
A new liquid membrane diffusion model for characterizing the adsorption kinetics of europium by using a continuous measurement of adsorption platform
2024-03-09 08:52:24HaoQiYuTaoYuJianHuaYe
Nuclear Science and Techniques 2024年1期
Hao‑Qi Yu · Tao Yu · Jian‑Hua Ye
Abstract To explore the kinetic adsorption under continuous and nonequilibrium states, an integration of continuous measurement and adsorption platform kinetics method was proposed, which was initially called the ICM-AP kinetics method, and a corresponding kinetic adsorption experimental method was developed.Adsorption experiments of europium (Eu) on Ca-bentonite,Na-bentonite, and the D231 cation exchange resin were performed using the ICM-AP kinetics method and continuous measurements.Because the kinetic experimental results observed in this study were different from those of traditional batch adsorption data, pseudo-first-order or pseudo-second-order kinetic models were unsuitable for fitting the experimental data.Hence, a liquid membrane diffusion (LMD) model was developed based on the assumption of simultaneous adsorption/desorption to discuss the mechanism of kinetic adsorption.The kinetic adsorption mechanism was also studied by using XPS.The results indicated that the proposed adsorption model can fit the experimental data more suitably, and the adsorption/desorption behaviors of Eu on bentonite and the D231 resin were simultaneously observed, suggesting that the adsorption kinetics of Eu(III) was mainly dominated by hydrated Eu(III) ions on the liquid membrane.
Keywords ICM-AP method · LMD model · Adsorption mechanism · Eu(III)
1 Introduction
Nuclear energy is receiving increasing attention from many countries as a clean and efficient source of energy.France,as a former nuclear power country, decided to restart nuclear power projects on a large scale and continue to maintain the status of a nuclear power country [1].By 2021, China's nuclear power generation will account for 5.02% of its electricity generation for the first time, and this proportion will continue to steadily increase [2].However, considering the large-scale use of nuclear energy, radioactive and highly toxic wastes have been released into the environment,causing an increased risk of damage to human health and ecosystems.Therefore, studies regarding the adsorption of radionuclides in ecological environments, including the development of models and experimental investigations, are critical for predicting the behavior of radionuclides released into the biological environment and for the safety assessment of nuclear waste disposal [3].According to the Status and Trends in Spent Fuel and Radioactive Waste Management published by the IAEA [4], low-level radioactive waste accounts for approximately 95% of the total radioactive waste, whereas high-level radioactive waste accounts for less than 1%.Meanwhile, reprocessing has been widely considered as an effective treatment for low-level radioactive waste, for which the separation of radionuclides from radioactive waste is critical [5–7].
Traditional adsorption is considered as an effective and widely adopted method for removing radioactive pollutants from wastewater [8–10].Generally, research regarding the adsorption behavior of radionuclides primarily focuses on the following three main aspects: nuclide species, adsorbents, and thermodynamic/kinetics models characterizing the adsorption mechanism.The study of nuclide species,uranium, thorium, transuranic elements (Np, Am, Cm, and Pu), fission products (Cs, Cr, and Pm), and lanthanides (Eu,Sc, and Ce) has gained notable attention [11–16].Regarding the adsorbents, several previous studies have focused on rock minerals (granite, attapulgite) [17, 18], clay minerals(bentonite, and red or yellow soil) [19, 20], metal–organic frameworks (MOFs) [21], and organic polymeric materials[22, 23]; meanwhile, the extraction of uranium from seawater has received greater attention [24].Investigations regarding the adsorption of Eu on clay minerals have practical reference values; for instance, owing to its strong adsorption capacity and weak water conductivity, bentonite has been considered a major buffer and backfilling material for the geological disposal of high-level radioactive waste [25].Numerous thermodynamic and kinetic models have been developed to characterize and predict adsorption behaviors.For instance, a non-linear two-site Langmuir model was used to describe the kinetic adsorption.Previous studies [26,27] employed a two-site Langmuir model to investigate the adsorption mechanism of Cs and Se on mudrock.The nonlinear heterogeneity-based isotherms have also been used to characterize the anaerobic and aerobic adsorption of Se and Cs on various clay rocks.
In this study, among the various cations, europium (Eu)was selected to perform the relevant adsorption tests owing to its stable species, which was mainly the Eu3+cation with a solution of pH < 9.Varying the pH values would affect the concentration of H+, which would highly influence the adsorption capacity of Am(III) on Na-bentonite [28].Theoretically, the desorption fluctuation curves are more likely to be observed with a relatively higher temperature and initial concentration of Am(III).Hence, a series of tests for different pH values, temperatures, and initial concentrations were performed to investigate the fluctuation mechanism in this study.
An adsorption model is typically constructed based on the assumption that adsorption reaches a state of equilibrium.In this case, the adsorption isotherm should be the same as the desorption isotherm because the theory of thermodynamic equilibrium assumes complete reversibility of the chemical reactions, thus a unique (C, Q) pair [25].However, adsorption mechanisms are driven by various controlled reactions or physical phenomena that have the largest variability in the reaction times, ranging from a few seconds to several years [29].The largest variability in the reaction times mainly depends on the activation energyE(kJ/mol), which is the difference in the activation energies of the adsorptionE1and deadsorptionE2.However, for kinetic adsorption experiments, previous studies [30, 31] have focused only on adsorption or desorption kinetics.The time scale of the kinetic reaction in previous studies was relatively long, and the measurement methods (ICP-OES or ICP-MS) for the intermittent measurements of the samples had limitations.In this case, the kinetic curves always exhibited a single adsorption or desorption state.In fact, the adsorption and desorption kinetics should not be considered independently because they occur, simultaneously, where one of the two dominates the entire process.Therefore, the adsorption and desorption processes should not be treated separately.This study proposes a new kinetic experimental method corresponding to a continuous measurement method to satisfy specific experimental conditions.The integration of a continuous measurement and adsorption kinetics platform was designed.An exponential kinetics model of liquid membrane diffusion was developed based on these assumptions to simulate the kinetic experimental data obtained in this study and to calculate the activation energyEaccording to the Arrhenius law.It was assumed that the kinetic adsorption process can be divided into two steps as follows: (1) The hydrated Eu(III) ions in the solution diffuse to the surface of the liquid membrane of the adsorbent particles, while desorption also occurs in this area.(2) The adsorption of the hydrated Eu(III) ions further occurs in the solid internal hole [20].
2 Theory
2.1 A new liquid membrane diffusion model
A new exponential kinetics model of liquid membrane diffusion was proposed based on the assumption of adsorption and desorption simultaneously occurring to describe the entire nonequilibrium adsorption kinetics of Eu on Ca-bentonite, Na-bentonite, and the D231 cation exchange resin.In this model, the adsorption of Eu on the adsorbent particles mainly occurred in the outer layer of the liquid membrane and internal holes.The entire adsorption and desorption process was divided into two steps.First, hydrated Eu(III) ions mainly diffused into the liquid membrane located at the outer layer of the bentonite or resin particles; the hydrated Eu(III)ions in the liquid membrane would then be released into the solution.Second, the hydrated Eu(III) ions attached to the liquid membrane would further diffuse into the solid internal hole; simultaneously, the hydrated Eu(III) ions would then release from the solid internal hole into the liquid membrane(physisorption mainly controlled the entire adsorption process).A schematic of this mechanism is shown in Fig.1.In the first step, the reaction equation for the solute diffusion into the liquid membrane can be expressed as follows:
In the aforementioned equations,Nindicates the nuclide of the solute,Lis the liquid membrane, andNLis the compound of nuclides that diffuses into the liquid membrane.On the other hand, the desorption process can be observed throughout the entire adsorption process; however, the desorption fluctuation curves observed were random, irregular,and hardly quantitative.Hence, only the empirical exponential rate of the adsorption reaction is given by Eq.(2):
whereC1is the concentration of Eu in the liquid membrane(mg/L),C0is the initial concentration of the solution (mg/L),andtis the reaction time (s).k1andγ1(1/T) are the coefficient and rate constant of the exponent equation, respectively.In the second step, the adsorbate (Eu) located at the liquid membrane diffuses into the solid internal hole of the bentonite and resin (the adsorption kinetic reactions are driven by the chemical surface complexation and caution exchange, respectively), for which the reaction equation can be expressed as follows:
Here,Sis the solid internal hole andNSis the compound of nuclides adsorbed onto the solid internal hole.The reaction rate is given by Eq.(4):
whereC2is the concentration of Eu in the solid internal hole(mg/L);C1andC2are the initial concentrations of Eu in the solution (C0).Compared to the previous step, the nonequilibrium adsorption kinetics were relatively weak.Considering the entire adsorption kinetics process, both steps occurred simultaneously; however, the weight factors of the two steps in the entire process were different.If the experimental conditions were changed, the weight factors of the two steps would also change.Hence, the total reaction rate can be expressed by Eq.(5):
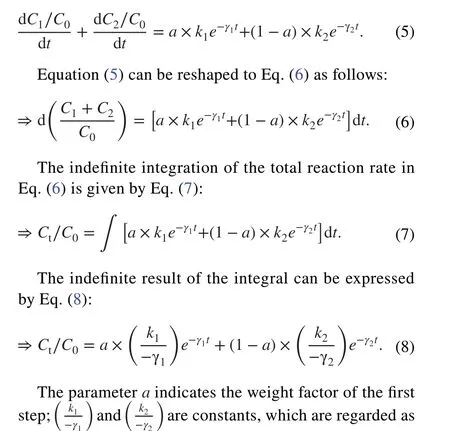
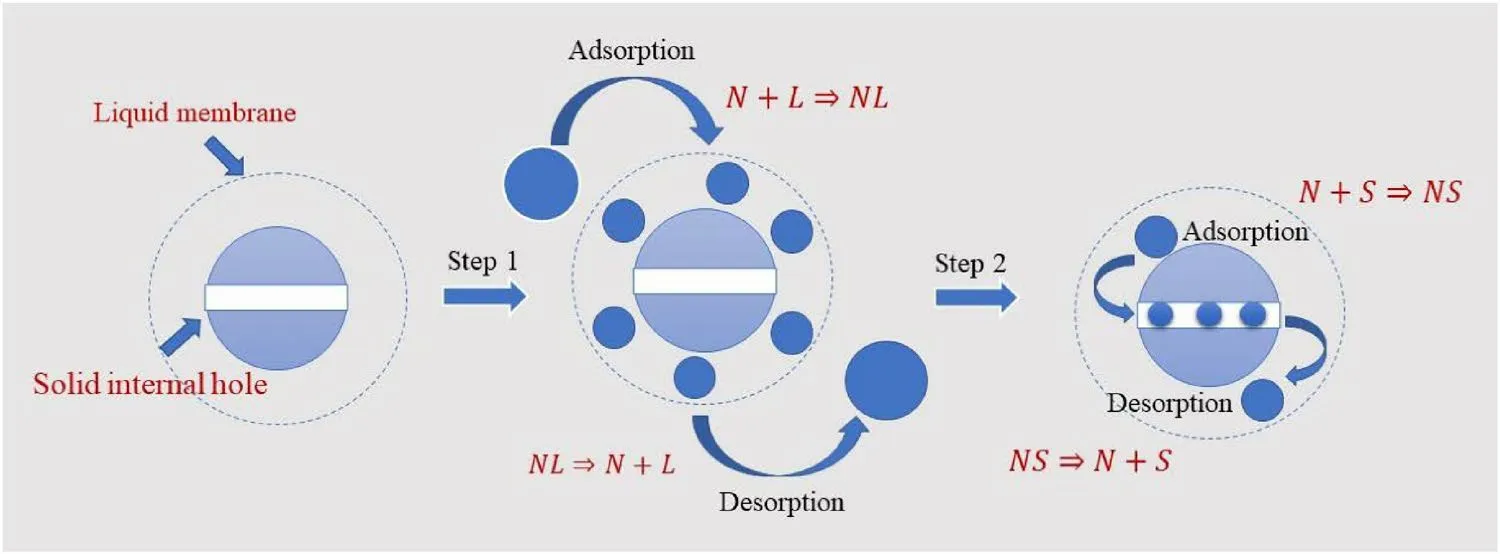
Fig.1 Schematic diagram of the kinetics of the adsorption mechanism.The complete kinetics adsorption process was presumably divided into the following two steps: 1) The nuclides diffuse into the liquid membrane, which can be expressed by N+L ⇒NL ; the nuclides also diffuse from the liquid membrane to the solution, which can be expressed by NL ⇒N+L.2) The adsorption of nuclides adsorbed in the liquid membrane on the solid internal hole will continue to simultaneously occur with desorption; these equations are expressed by NL+S ⇒NS and NS ⇒N+S , respectively

whereCtis the concentration of Eu in the solution at various reaction times (mg/L) andC0is the initial concentration of Eu (mg/L).However, numerous unknown parameters significantly affect the accuracy of the fitting results.According to the indefinite integral derivation process, parameters “B”and “C” in Eq.(9) should be constants, both of which can be considered as “1”, with parameters “k1” and “k2” equal to r1 and r2, respectively.Because parameters “a”, “r1”, and“r2” were sufficient to accurately describe the experimental data, parametersBandCare not shown in Tables 1, 2, and 3.
Nevertheless, the random, irregular, and hardly quantitative desorption fluctuation curves observed forCt/C0are shown in Figs.6, 7, and 8, respectively; the desorption rate equations for the two steps in this study could not be determined.The Arrhenius law provides the relationship between the kinetics constantkand activation energyE(kJ/mol) [31],which can be used to calculate the standard energy of the two steps proposed in the exponential kinetics model of liquid membrane diffusion.
Here,Dindicates a dimensionless collision probability factor;RandTindicate the molar gas constant (8.314 J/(K/mol)) and thermodynamic temperature (K), respectively.The“k” parameter in Eq.(10) is based on the reaction constant.Using Eq.(10), we calculated the activation energyEfor steps 1 and 2.The “k” parameter in Eq.(10) was directly obtained with the value of parameter “γ1”, which is shown in Eq.(8) and is not mathematically deduced.The ΔEcalculated according to Eq.(10) was only a relative value and provided a reference for the two steps.The calculated parameter ofDwas considered for the value of the weight factora, which can approximate the collision probability instead of parameterD.The kinetics model of the liquid membrane proposed in this study is a non-linear equation; its parameters were directly fitted by MATLAB (version 2019b)instead of linearization, which was then estimated using a non-linear approach.
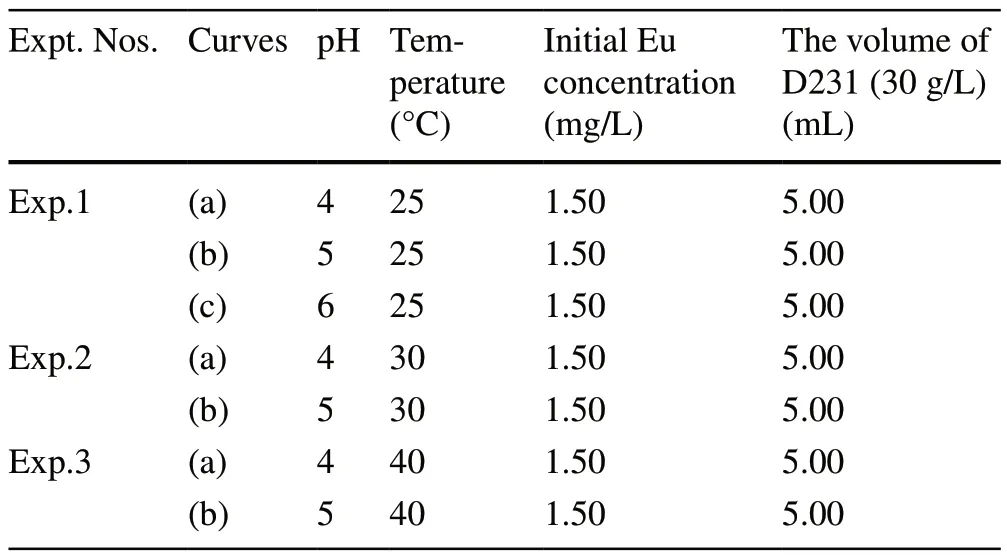
Table 2 Detailed experimental conditions for the adsorption of Eu on the D231 resin (Fig.8)
2.2 Kinetics adsorption conditions
To meet the specific experimental requirements (relatively short kinetics adsorption time within a maximum of 60 min)of the refit thermodynamic adsorption platform, a new kinetics adsorption method is proposed.The main difference of the newly proposed kinetics method in traditional batch tests is the simultaneous adsorption of Eu on bentonite and, more recently, the Eu concentration observed by ultraviolet spectrophotometry.The kinetics adsorption times of the batch tests (the kinetics adsorption of the nuclides on bentonitegenerally occurs within 7 days) were also greater than that of the ICM-AP kinetics method.
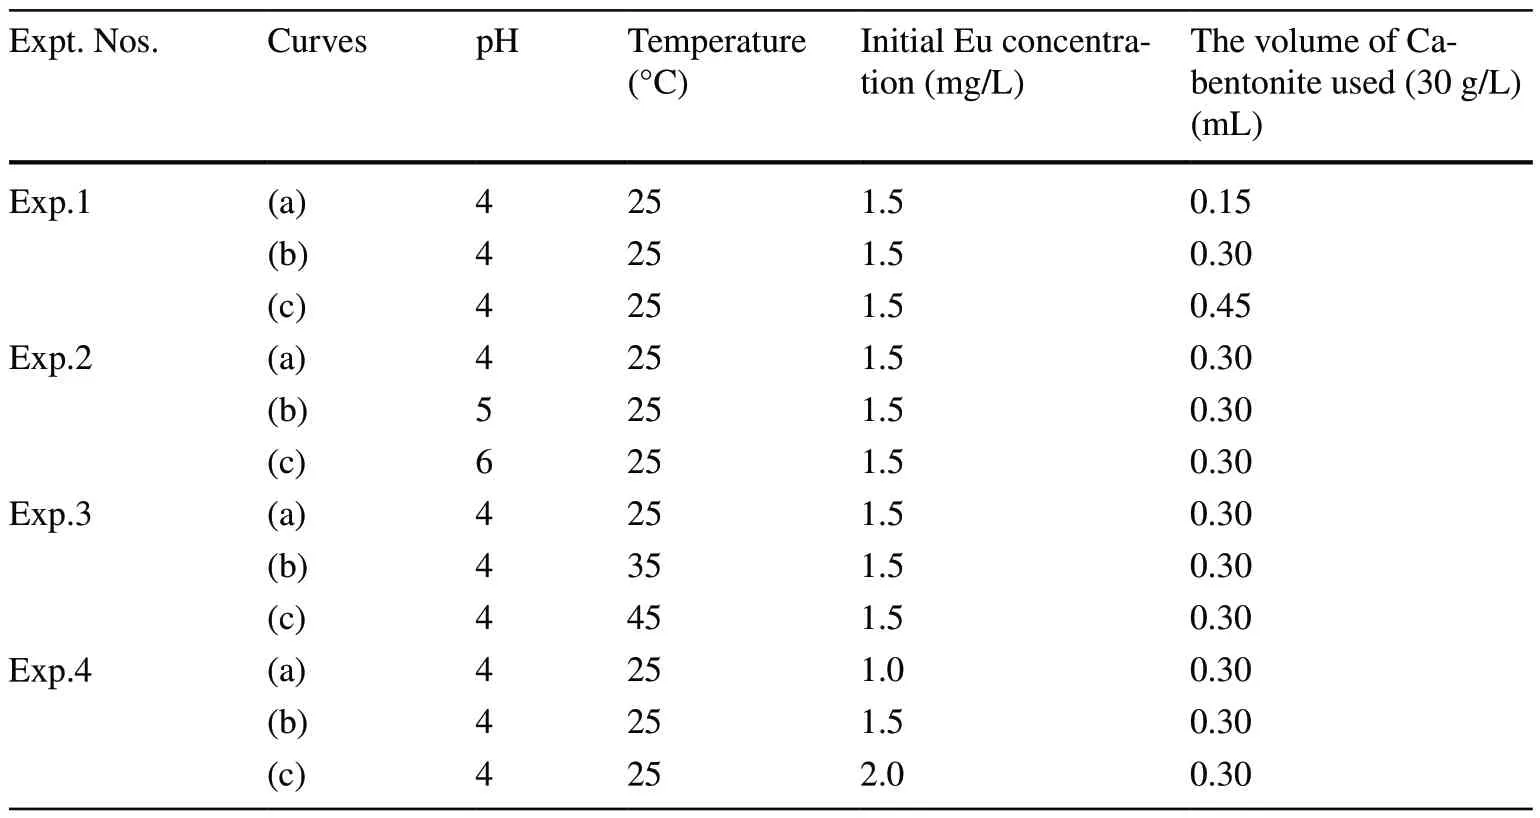
Table 1 Various experimental conditions
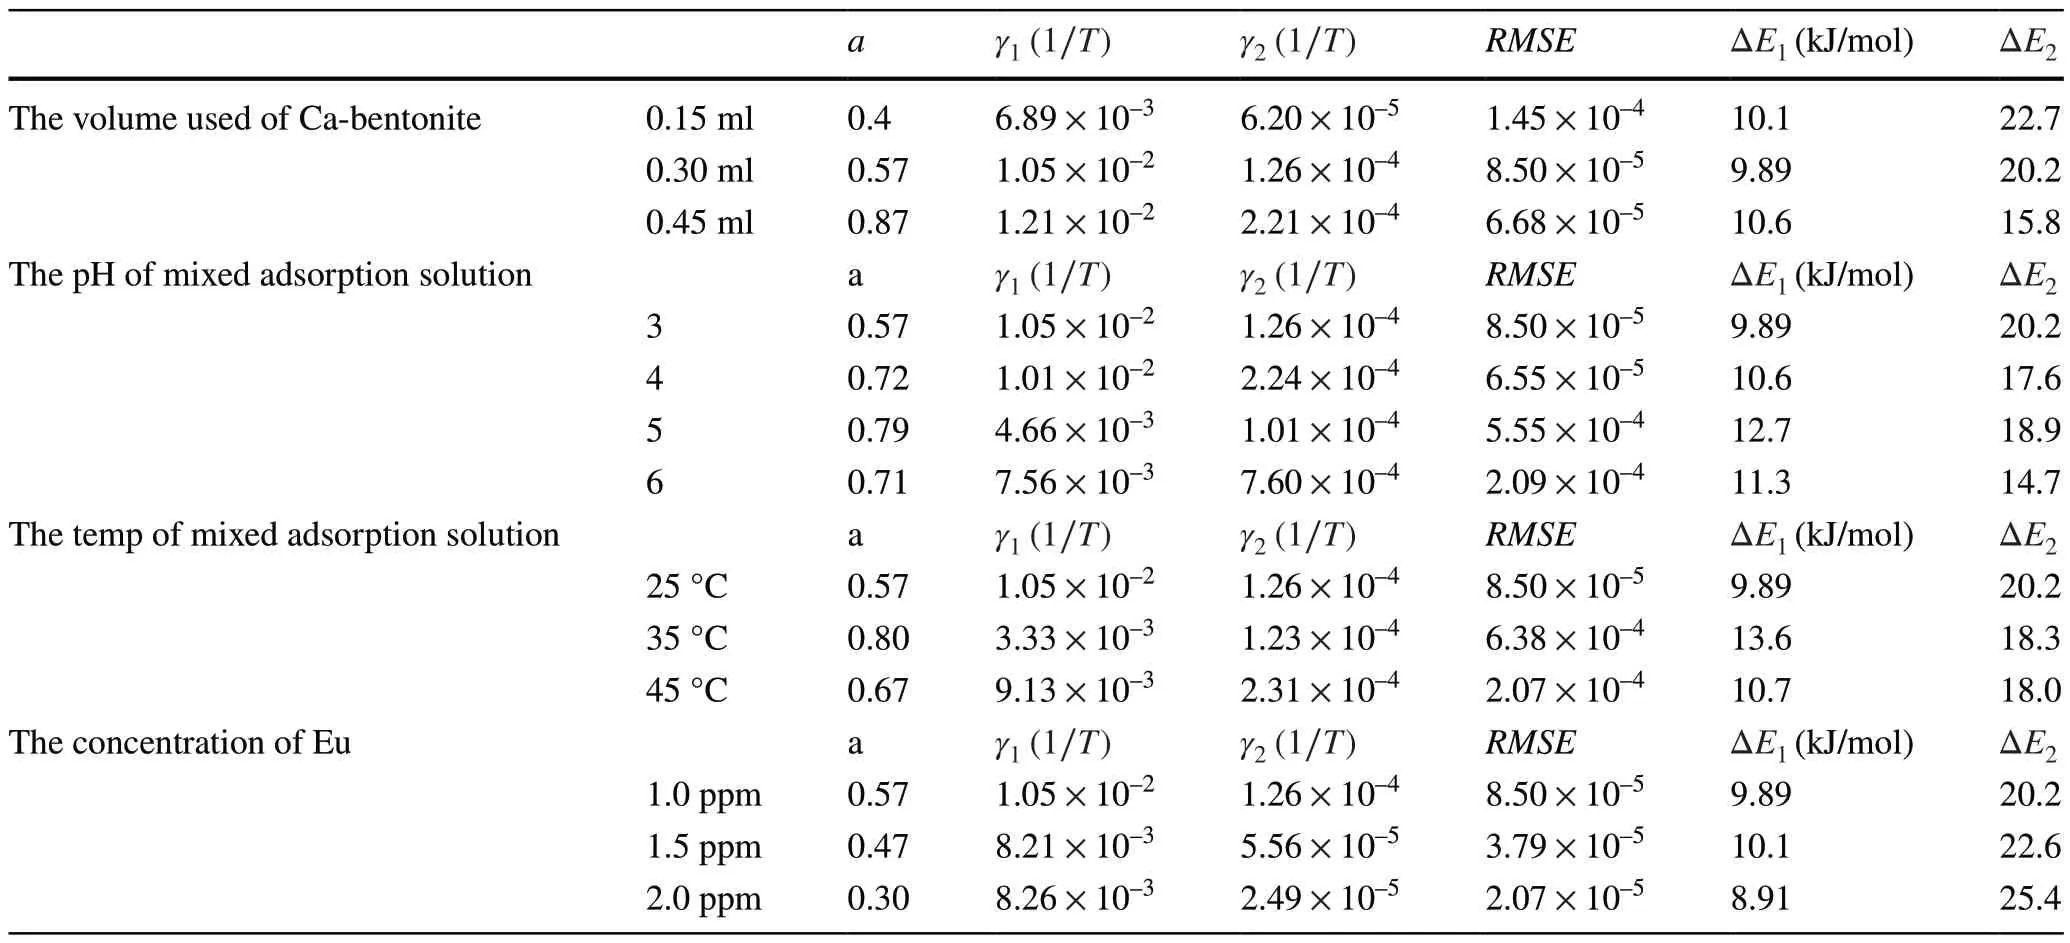
Table 3 Parameters of the exponential kinetics model of liquid membrane diffusion for the simulation of experimental data of the adsorption of Eu on Ca-bentonite
2.3 Integration of continuous measurement and adsorption platform kinetics method
Generally, eachCt/C0curve was obtained approximately 2–3 times because if only obtained once, the fluctuation observed in the curves may have been caused by a signal interference.For instance, if air was sucked into a rubber tube, the adsorbance value would suddenly increase, thus affecting the results.Many key experimental conditions, such as the rotating speed of the peristaltic pump and the pH value of the mixed solution, influence the value of the absorbance,which further causes an apparent error in the value ofCt/C0.Therefore, after a series of tests, the most suitable rotating speeds of the magnetic rotor and inlet peristaltic pump were maintained at 1500 and 20 rpm, respectively; the pH of the mixed solution was measured to be 2.7.A schematic of the experimental setup is shown in Fig.2.
The kinetic adsorption devices used in this study differed from traditional equipment, as well as the batch or column methods.As shown in Fig.2, the adsorption reactor was filled with a standard europium solution at concentrations of 1, 1.5, and 2 mg/L, and material powders of Ca-bentonite,Na-bentonite, and the D231 cation exchange resin with a solid/liquid ratio of 30 g/L.Note, the different solid/liquid ratios of the adsorbent will influence the experimental results in the kinetic adsorption process, whereas the solid/liquid ratio in this special condition hardly changes because the particle size of the material powders is sufficiently small to cause the entire solution to present a homogeneous state,indicating a proportional reduction of the solution and clay particles.To meet the requirements of continuous measurements, traditional visible spectrophotometry was performed in this study.When traditional spectrophotometry is used to test the concentration of the samples, many specific conditions must be satisfied, including the optimal pH of the samples and adequate time to achieve color-rendering stability.To meet these requirements, two electromagnetic heating stirrers (Fig.2) were used to adjust the temperature of the sample solution and to shorten the color rendering time.An integral kinetics experimental process can be divided into two major steps or parts (the adsorption reaction and realtime online detection and recording).As shown in Fig.2,the mixed adsorption solution in beaker 1 contained either Ca-bentonite, Na-bentonite, or the D231 cation exchange resin powders and a standard europium solution.A magnetic rotor was used to enable the adsorption reaction to fully react in the beaker, and a filter membrane with a diameter of 0.45 μm was connected to the nozzle of the injection rubber pipe to separate the sorbent powders from the europium solution.The port of the outlet rubber conduit was connected to a three-way valve to mix the arsenazo III solution containing acetic acid-sodium acetate and the Eu sample solution.Subsequently, the mixed solution was allowed to flow into a heating and cooling beaker.Finally,the mixed solution flowed into the modified cuvette to detect and record the absorbance of the mixed solution displayed in the computer program, and then flowed into the beaker of the waste liquid.Many key experimental conditions, such as the rotating speed of the peristaltic pump and pH value of the mixed solution, influence the value of the absorbance,which further causes an apparent error in the value ofCt/C0.Therefore, after a series of tests, the most suitable rotating speeds of the magnetic rotor and inlet peristaltic pump were maintained at 1500 and 20 rpm, respectively, and the pH of the mixed solution measured was 2.7.Appropriate rotating speeds ensured that the adsorption reaction of europium on the adsorbents and color rendering occurred adequately.A rotation speed of 20 rpm for the peristaltic pump ensured an adequate adsorption reaction time.The initial Eu concentration was adjusted to maintain the absorbance observed in the SP-721E spectrophotometer within the range of the linear working area.Generally, the concentration of europium should not exceed 2 mg/L; the pH of the arsenazo III reagent was maintained at 2.7.
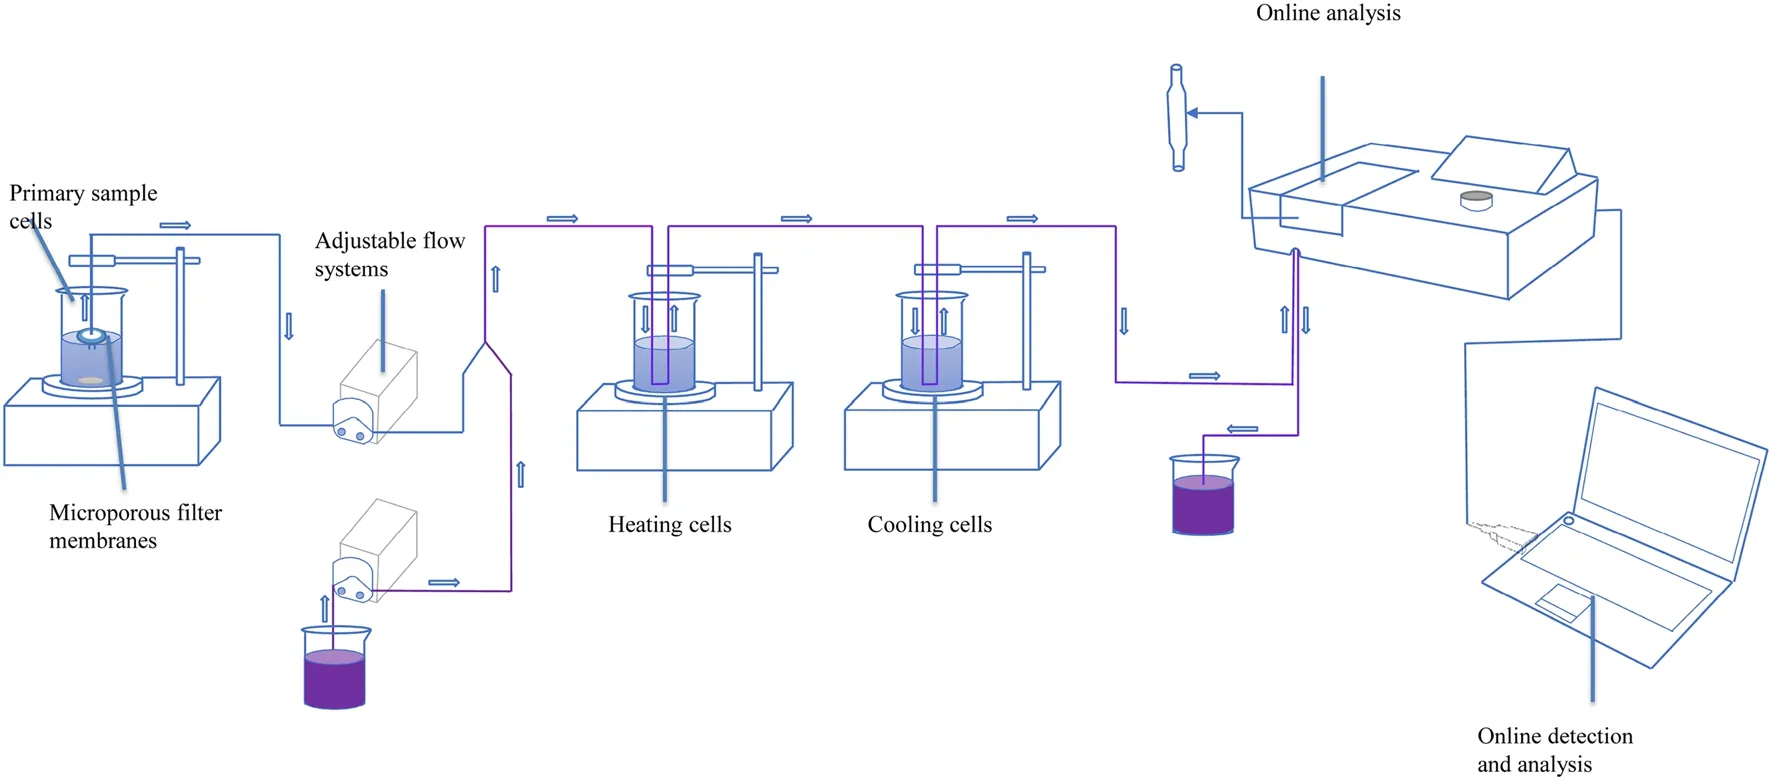
Fig.2 Schematic of the integration of continuous measurements and kinetic adsorption.Notes: the solution flow direction is from left to right
3 Materials and method
3.1 Materials
All the raw materials and reagents used in the experiments were analytical grade without further purification except for the raw material of the D231 resin, which had a particle size of approximately 0.45 μm and was ground and passed through ~ 100 mesh sieves prior to use.The bentonite sample was obtained from Gaomiaozi and converted into Nabentonite and Ca-bentonite according to a previous study[31].The Eu solution used in this study was purchased from Guobiao (Beijing) Testing and Certification Co, Ltd.The acetic acid-sodium acetate pH buffer solution with a value of 2.7 that was controlled by sodium hydroxide was purchased from Xilong Scientific Co, Ltd.The arsenazo III reagent was purchased from Xilong Scientific Co, Ltd., which had a concentration of 1.0 g/L.An ultraviolet spectrophotometer (SP-721E), peristaltic pump (L100-1S-2), pH meter (PHS-3C),and X-ray photoelectron spectroscope were used for testing.
3.2 Preparation of the integration of continuous measurement and adsorption kinetics platform
Traditional adsorption kinetics research methods, such as batch or column experiment techniques, have been frequently used to study various kinetics-related questions;however, these methods have certain inherent flaws, such that the adsorption kinetics experimental data are intermittently measured.Because the measurement and adsorption reactions were not operational and simultaneously occurred,many studies [20, 32] have suggested that the fluctuation of the adsorption capacity versus the reaction time observed in the adsorption kinetics curves was caused by measurement or artificial errors.Moreover, owing to the lack of integration of the adsorption and measurement equipment as well as the corresponding test methods, the irregular fluctuations observed in the kinetics curves have not been thoroughly investigated.Traditional kinetic adsorption methods cannot explain the irregular fluctuations observed in the early stages of kinetic adsorption (within 1 hour).The majority of Eu was adsorbed on the bentonite within one hour, which is indicated by the frequent fluctuations in the kinetics curves.Therefore, to accurately understand the adsorption kinetics,the integration of continuous measurements and adsorption/desorption kinetics was proposed; the traditional SP-721E spectrophotometer (purchased from INESA Analytical Instrument Co., Ltd.) used in this study was retrofitted to achieve a continuous injection and real-time online display of absorbance on a computer.The original cuvette was pierced at the bottom; a diagram of the physical device is shown in Fig.3.
For real-time online detection and recording, a visualization Chinese window program was developed, as shown in Fig.4.Using this software, experimental data can be collected from the aforementioned instruments; that is, the curve of the adsorption capacity versus time (calculated in terms of absorbance).
3.3 Kinetic adsorption tests and modeling
The kinetic adsorption method used in this study differs from that used in traditional batch experiments.Three types of adsorbent materials were prepared, and the operating concentrations used for this adsorption test were designed using a standard solution of Eu at concentrations of 1, 1.5, and 2.0 mg/L.The experiments were conducted at varying temperatures (25°, 35°, and 45°), and pH values (approximately 3.0, 4.0, 5.0, and 6.0) of the adsorption solution to investigate the different conditional influences on the results of the adsorption kinetics.The experimental data obtained using this specific kinetics method were simulated using a liquidmembrane diffusion exponent kinetic model to characterize the adsorption kinetics.The trust region reflective algorithm and the Levenberg–Marquardt option, which can potentially make the liquid membrane diffusion model effective, are vital tools for the reliable analysis of the experimental data obtained by a new adsorption kinetics method.The residual root mean square error (RMSE) was used to determine the goodness of fit and is defined by the following equation:
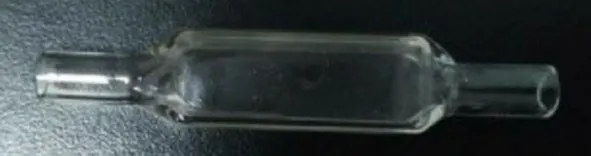
Fig.3 Physical image of the refitting cuvette
whereQiis the experimental data obtained from the new kinetics adsorption method used in this study,qiis the fitting value corresponding withQi, andmandvindicate the number of data points in the new kinetics experiments and the number of parameters within the liquid membrane diffusion exponent model, respectively.
4 Results and discussion
4.1 XPS study

Fig.4 Schematic of the visualization Chinese window program
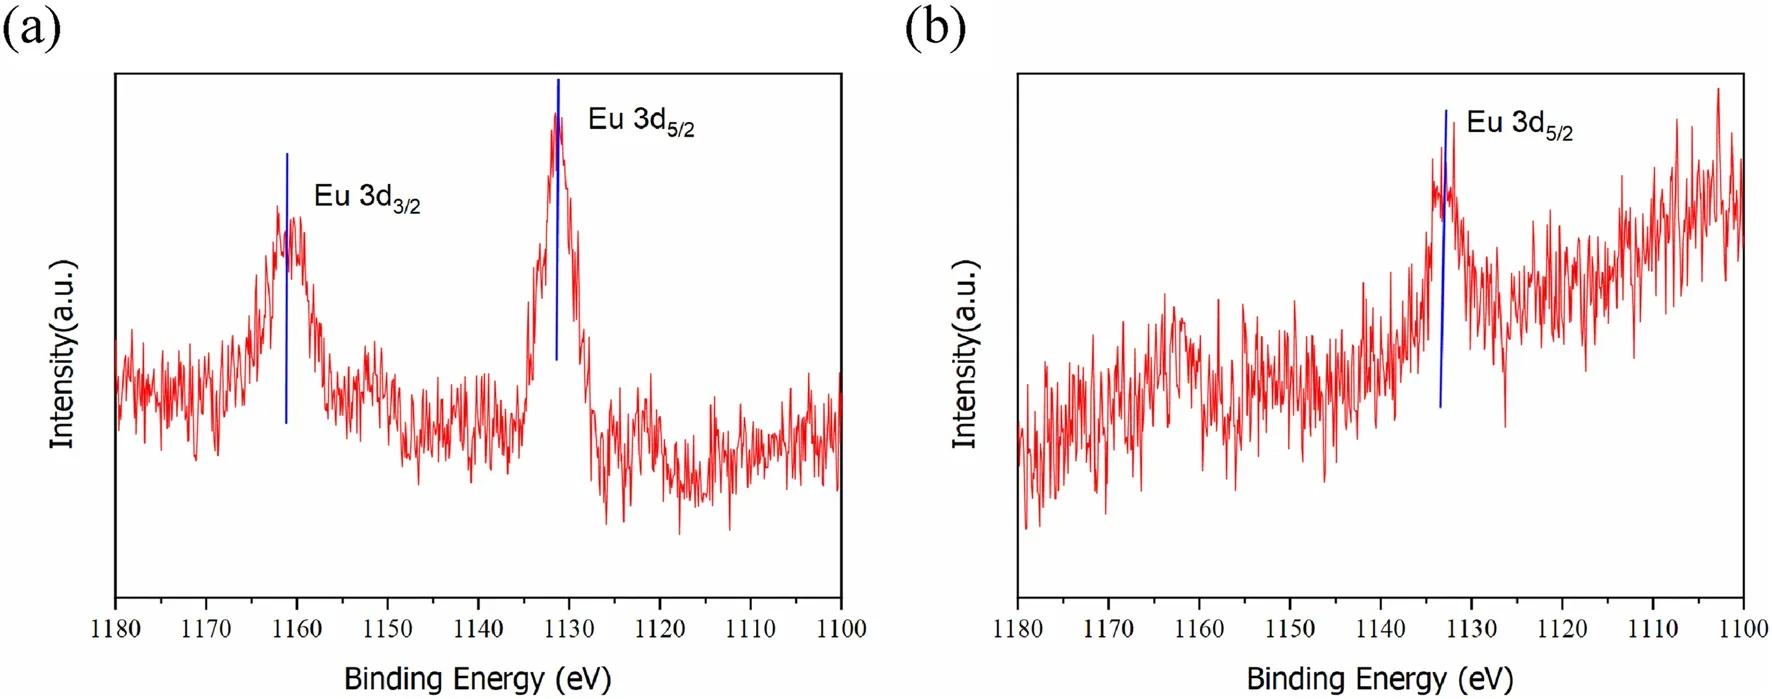
Fig.5 (1) XPS spectra of Eu 3d5/2 on the Ca-bentonite samples: a kinetic reaction time of 15 min and b 30 min.The samples were prepared as follows: 20 mg/L of CEu(III), pH = 5, and the weight of the samples was 3 mg
In this study, the kinetics of the adsorption of Eu(III) under different adsorption times was studied using XPS.As shown in Fig.5, the main peak position of Eu 3d5/2varies at 15 and 30 min, indicating different binding energies of the adsorbed Eu(III) at variable adsorption times.Because the adsorption reaction of the liquid membrane of the Ca-bentonite particles dominated the initial adsorption process, the main peak of Eu 3d5/2at an adsorption time of 15 min may be attributed to the hydration of Eu(III) on the liquid membrane.As the adsorption time increased, the hydrated Eu(III) on the liquid membrane further diffused to the surface, and surface complexation occurred inside the hole sites, increasing the binding energy of Eu 3d5/2.The main peak positions of the Eu 3d5/2kinetic adsorption at 15 and 30 min were close and fixed at 1130.8 eV and 1132.1 eV, respectively.This indicates that the Eu(III) adsorption on Ca-bentonite gradually stabilized.The binding energy of the hydrated Eu(III) on the liquid membrane was the lowest, and its combination was relatively unstable.
4.2 Analysis of the Ct/C0 curvesfortheadsorption kinetics of Eu on Na, Ca‑bentonite,and the D231 resin
Prior to an explanation of the results, note that the fluctuation in theCt/C0curves above is not attributed to the signal noise.(1) If the fluctuation in the curves is considered signal noise, it should be observed throughout the entireCt/C0curves and at the beginning.(2) As shown in Fig.6b, theCt/C0curves for the adsorption of Eu(III) on Ca-bentonite as a function of pH (pH = 5, 6) were smooth and no fluctuations were observed, which is explained in the following states.A previous study [16] suggests a similar fluctuation in the kinetic curves of the adsorption of Am(III) on Na-bentonite as a function of the contact time.
The adsorption experiments were performed as a function of the volume of Ca-bentonite used, pH, temperature,and initial concentration of Eu, and each kinetic test lasted approximately one hour.As shown in Fig.6a, as the volume of Ca-bentonite used increased, the adsorption rate gradually improved; meanwhile, smaller irregular fluctuations were observed in the backend of theCt/C0curves.This phenomenon is attributed to the physical-desorption behavior of Eu(III) on the liquid membrane of the surface of Ca-bentonite.Note, the entropy change of the hydrated Eu(III) ions diffused to the surface of bentonite is positive (ΔS> 0).The dehydration step requires high energy, which is provided by the reaction temperature (25°); thus, the reaction rate apparently improves as the temperature increases.This is considered as step “1” of the liquid membrane diffusion model, when physical desorption nearly occurs; this is the rate-controlling step that occurs at the beginning, which is indicated by theCt/C0curves (within 15 min).Based on the assumptions of the liquid membrane diffusion model, the equation of Step 1 (NL⇒N+L) that is shown in Fig.1 can be used to represent this physisorption kinetics behavior.TheCt/C0curves as a function of the pH(4, 5, and 6) are shown in Fig.6 (b).The descending behavior of theCt/C0curves with pH values of 5 and 6 were smooth,which indicates that the entire reaction process was dominated by adsorption whereas the physical-desorption of Eu(III) on the liquid membrane of the surface of Ca-bentonite was hardly occurring.There are two main interpretations for this.The concentration of the ionized H+decreased, which further weakened the competitive adsorption between Eu(III) and H+(the surface charge of bentonite is negative and the competitive adsorption will influence the process of Step 2 (N+S⇒NS)shown in Fig.1).However, the chemical reaction process of the surface complexation was dominant at these pH values, for which the equations can be expressed as follows:Eu on Na-bentonite were similar, as shown in Fig.7a–d, and only the adsorption rates were slightly different.
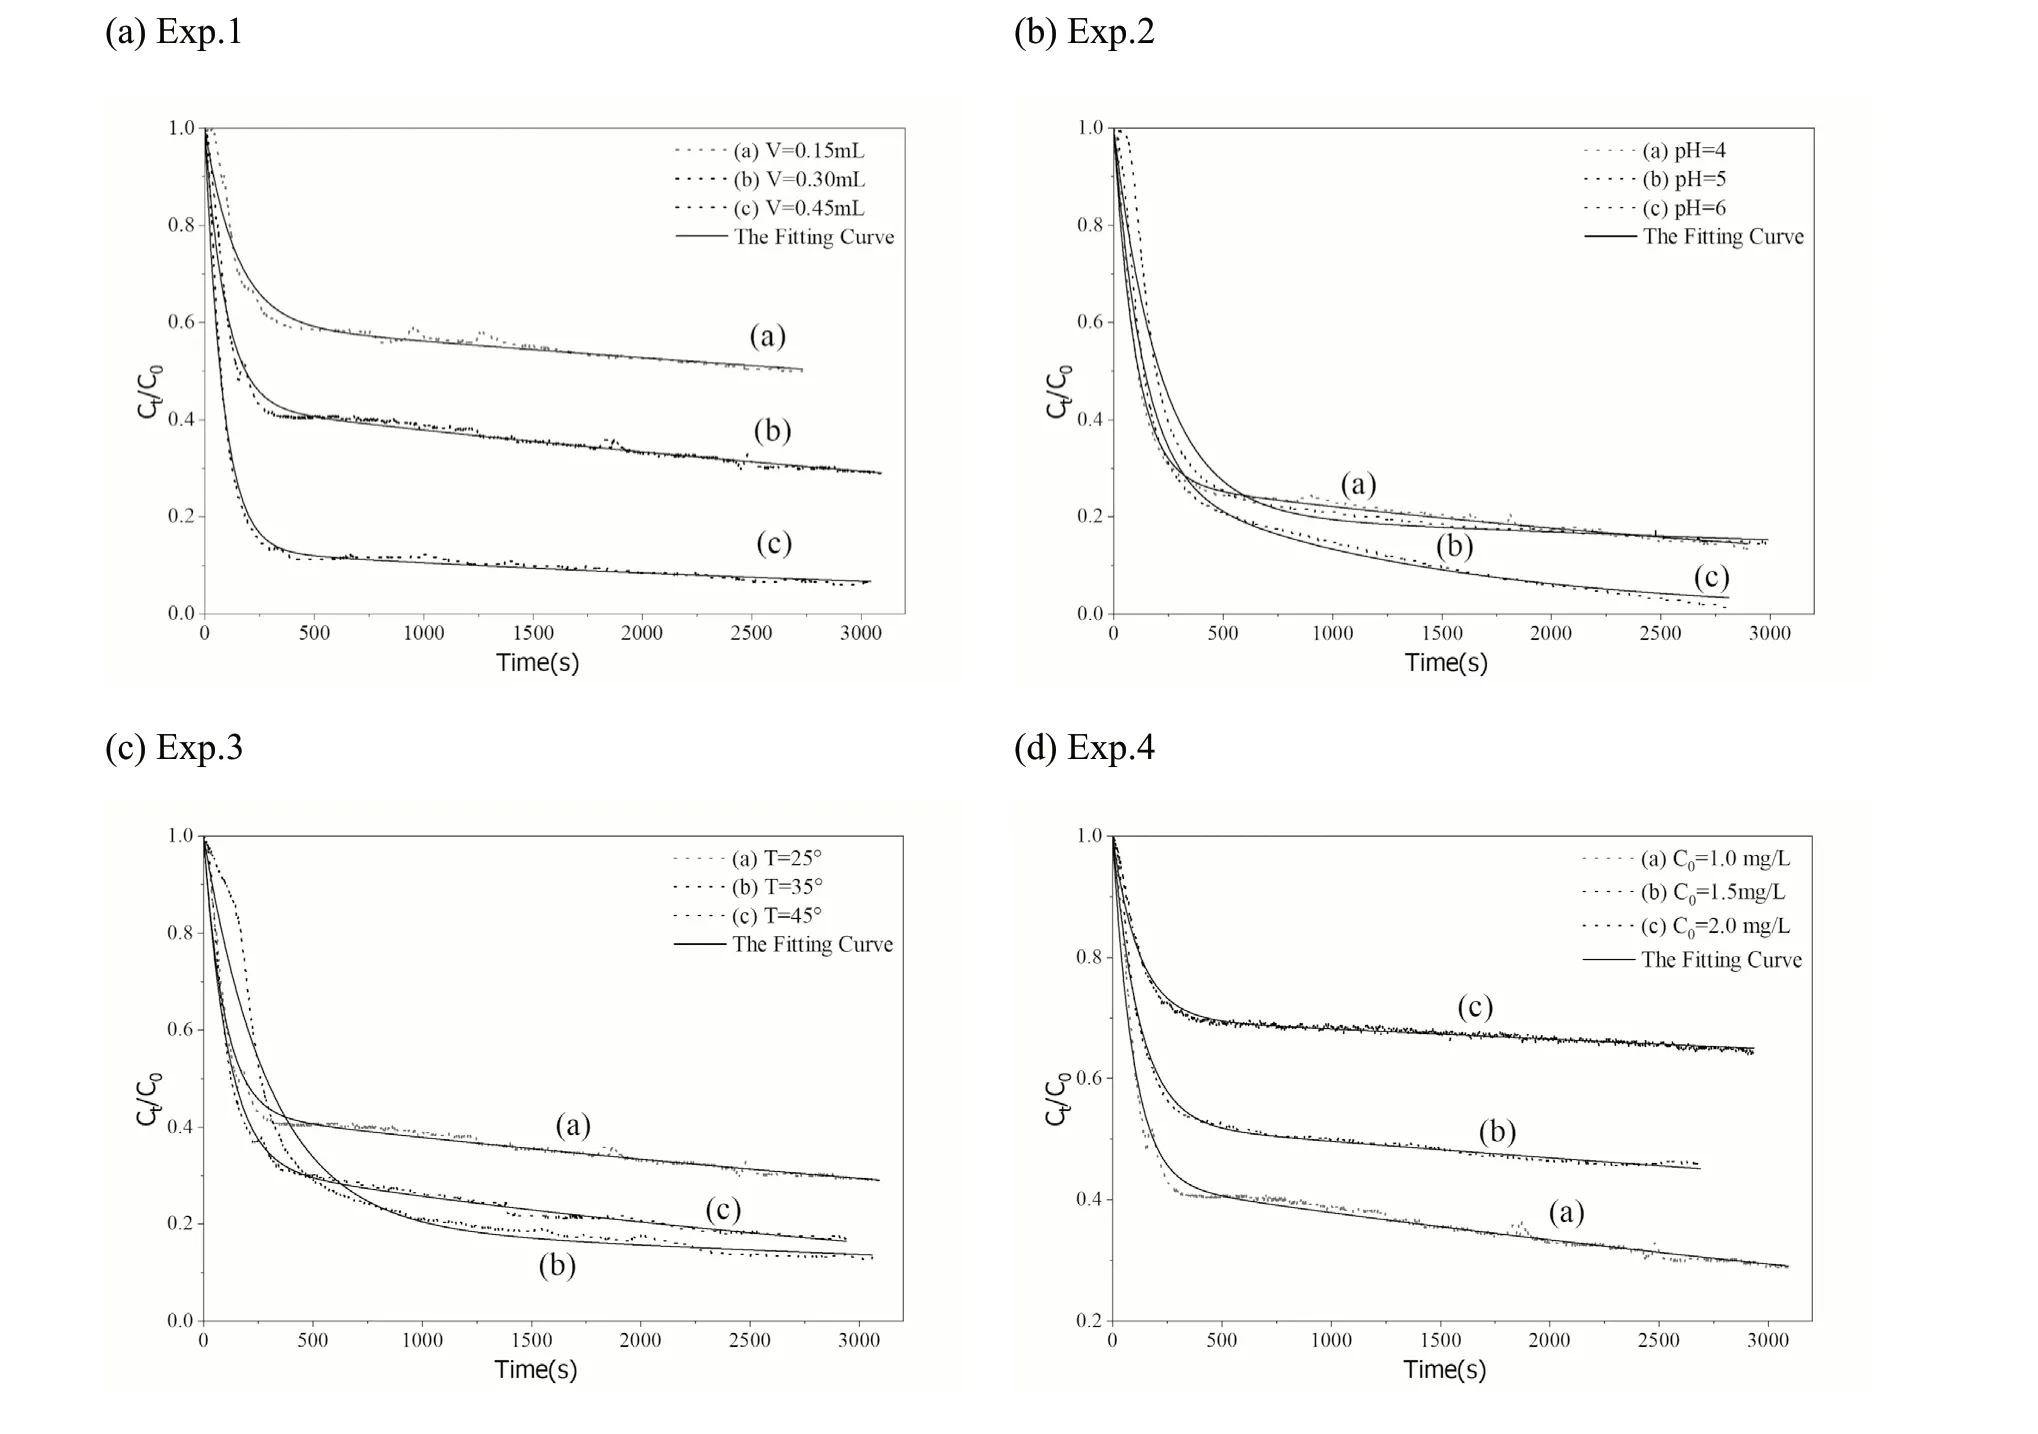
Fig.6 (Ct/C0) curves for the experimental data of the kinetics tests and fitting curves of the exponential kinetics model of liquid membrane diffusion for the adsorption of Eu on Ca-bentonite.Figure a–d represent the different volumes of Ca-bentonite used, pH, temperature and initial concentration of Eu, respectively (Notes: The detailed conditions of the experiments are listed in Table 1)
The process of Eu adsorption on the D231 cation resin did not change the physical structure of the D231 resin; a cation exchange with the functional group of the D231 resin occurred.Irregular fluctuations at the backend of theCt/C0curves were also observed; however, the observed times were difficult to determine.These observations indicate that desorption occurs during the adsorption process, but do not confirm the precise time.However, as shown in Fig.8a–c,the irregular fluctuations in theCt/C0curves for the adsorption of Eu on the D231 cation exchange resin are clearly observed, indicating that the desorption was relatively stronger than the adsorption on bentonite, and its adsorption capacity was lower than that of bentonite.The kinetic adsorption of Eu on D231 was completely driven by the chemical mechanism of the cation exchange with a relatively lower selectivity.Its adsorption combining energy was also relatively weak, which leads to a reversible reaction easily occurring.In contrast, the fluctuations observed in Figs.6 and 7 were relatively weak because bentonite has a higher
The Eu adsorption process on bentonite does not change the physical structure of bentonite, rather only forms the complex compounds of SOEu2+, SOEuOH+, and SOEu(OH)2.As indicate in the chemical equations above,the equilibrium of the reaction moves forward.These two main factors ultimately led to a steady decline in the pH of theCt/C0curves.When the kinetic adsorption tests were performed at different temperatures, as shown in Fig.6c, the discrimination of these curves was subtle; a few irregular fluctuations in the backend of the curves were also observed.This phenomenon clearly indicates the physical-desorption of Eu(III) on the liquid membrane of the Ca-bentonite surface.As indicated by theCt/C0curves in Fig.6b–d, there were hardly any fluctuations, which is in agreement with the adsorption expectations of the physical-desorption of Eu(III)on the liquid membrane of the surface of Ca-bentonite owing to the excessive Eu(III) in the solution medium.
Meanwhile, upon comparing the curves of the adsorption of Eu on Ca-bentonite, theCt/C0curves for the adsorption of adsorption capacity and selectivity for Eu and demonstrates a relatively weaker desorption phenomenon.

Fig.7 Experimental data curves (Ct/C0) of the kinetics tests and fitting curve of the exponential kinetics model of liquid membrane diffusion for the adsorption of Eu on Na-bentonite.a–d present the different volumes of Ca-bentonite used, pH values, temperatures, and initial concentrations of Eu, respectively (Notes: the detailed conditions of the experiments are shown in Table 1.)
4.3 Analysis of the parameters of the exponential kinetics model of liquid membrane diffusion
The RMSE values for the simulation of the exponential model of liquid membrane diffusion shown in Tables 3, 4,and 5 were considerably small, with values ranging between 1.45 × 10⁻⁴and 2.07 × 10⁻⁵(at least four or five orders of magnitude).These results indicate that the adsorption model proposed in this study is effective.The key parameters of the liquid membrane diffusion model and the calculated activation energies are listed in Tables 3, 4, and 5.As shown in the Table 3, as the volume of Ca-bentonite used increased, the parameterarepresenting a weight factor for Step 1 gradually increased from 0.40 to 0.87, and the values of the rate constantγ1were larger thanγ2(1.21 × 10⁻²–6.89 × 10⁻³> 1.26 ×10⁻⁴–6.20 × 10⁻⁵).Moreover, the activation energy of Step 1 ( ΔE1, the activation energy of the adsorption of Eu on the liquid membrane) was lower than ΔE2(the activation energy of the adsorption of Eu on the solid internal hole); a lower activation energy resulted in a faster and easier reaction rate.As the volume of Ca-bentonite used increased, the values of ΔE1hardly changed (9.89–10.6 kJ/mol)); however, the values of ΔE2gradually reduced (22.7–15.8 kJ/mol).These results can be attributed to the fact that the kinetic adsorption tests in this study were conducted in a nonequilibrium and unsaturated state.The total volume of the liquid membrane of Ca-bentonite gradually increased, which further led to more hydrated Eu(III) ions diffusing into the liquid membrane and, consequently an improvement in the value of the weight factor (a).Meanwhile, as the volume of Cabentonite increased, the surface complexation sites ( ≡SOH )also rapidly increased, resulting in an easy performance of the complexation reaction.Therefore, the value of the activation energy ΔE2that was calculated according to the Arrhenius law shown in Table 3 gradually reduced (22.7–15.8 kJ/mol).When the pH of the mixed adsorption solution progressively increased, the value ofaincreased and remained at approximately 0.7, indicating that the hydrated Eu(III)ions diffused into the liquid membrane (Step 1) and dominated the entire adsorption kinetics process.The rate constantγ1was larger thanγ2(4.66 × 10⁻³–1.05 × 10⁻²> 1.01× 10⁻⁴–7.60 × 10⁻⁴), and the activation energy ΔE2was larger than ΔE1(14.7–20.2 > 9.89–12.7 kJ/mol).This also indicates that Step 1 occurred more easily and rapidly compared to Step 2.As the temperature increased, parametersaand ΔE1first increased and then decreased.Combined with theCt/C0curves at a temperature of 35°, Step 1 for the hydrated Eu(III) ion diffused into the liquid membrane(a= 0.8) and dominated the entire kinetics process.When the temperature increased, the calculated ΔE2value gradually decreased from 20.2 to 18 kJ/mol, and Step 2 easily occurred.The adsorption tests under different initial Eu concentrations were conducted; the trend for parametersa,ΔE1, and ΔE2were different from the other conditions.As the initial Eu concentration increased, the total concentration(C1+C2) of adsorbed Eu on the liquid membrane and solid internal holes increased, whereas the volume of the liquid membrane did not change.However, the relative proportion concentration (C1) would decrease because Step 2 for the adsorption of Eu on the ≡SOH sites would further improve(the improvement of concentration (C2) was larger thanC1), which caused the reaction rate to decrease (the gradual increase of ΔE2(20.2–25.4 kJ/mol)).The key parameters for the adsorption of Eu on Na-bentonite are also listed in Table 4, which indicates that the adsorption kinetics process based on the assumptions of the proposed adsorption model theory is similar to the adsorption of Eu on Ca-bentonite.
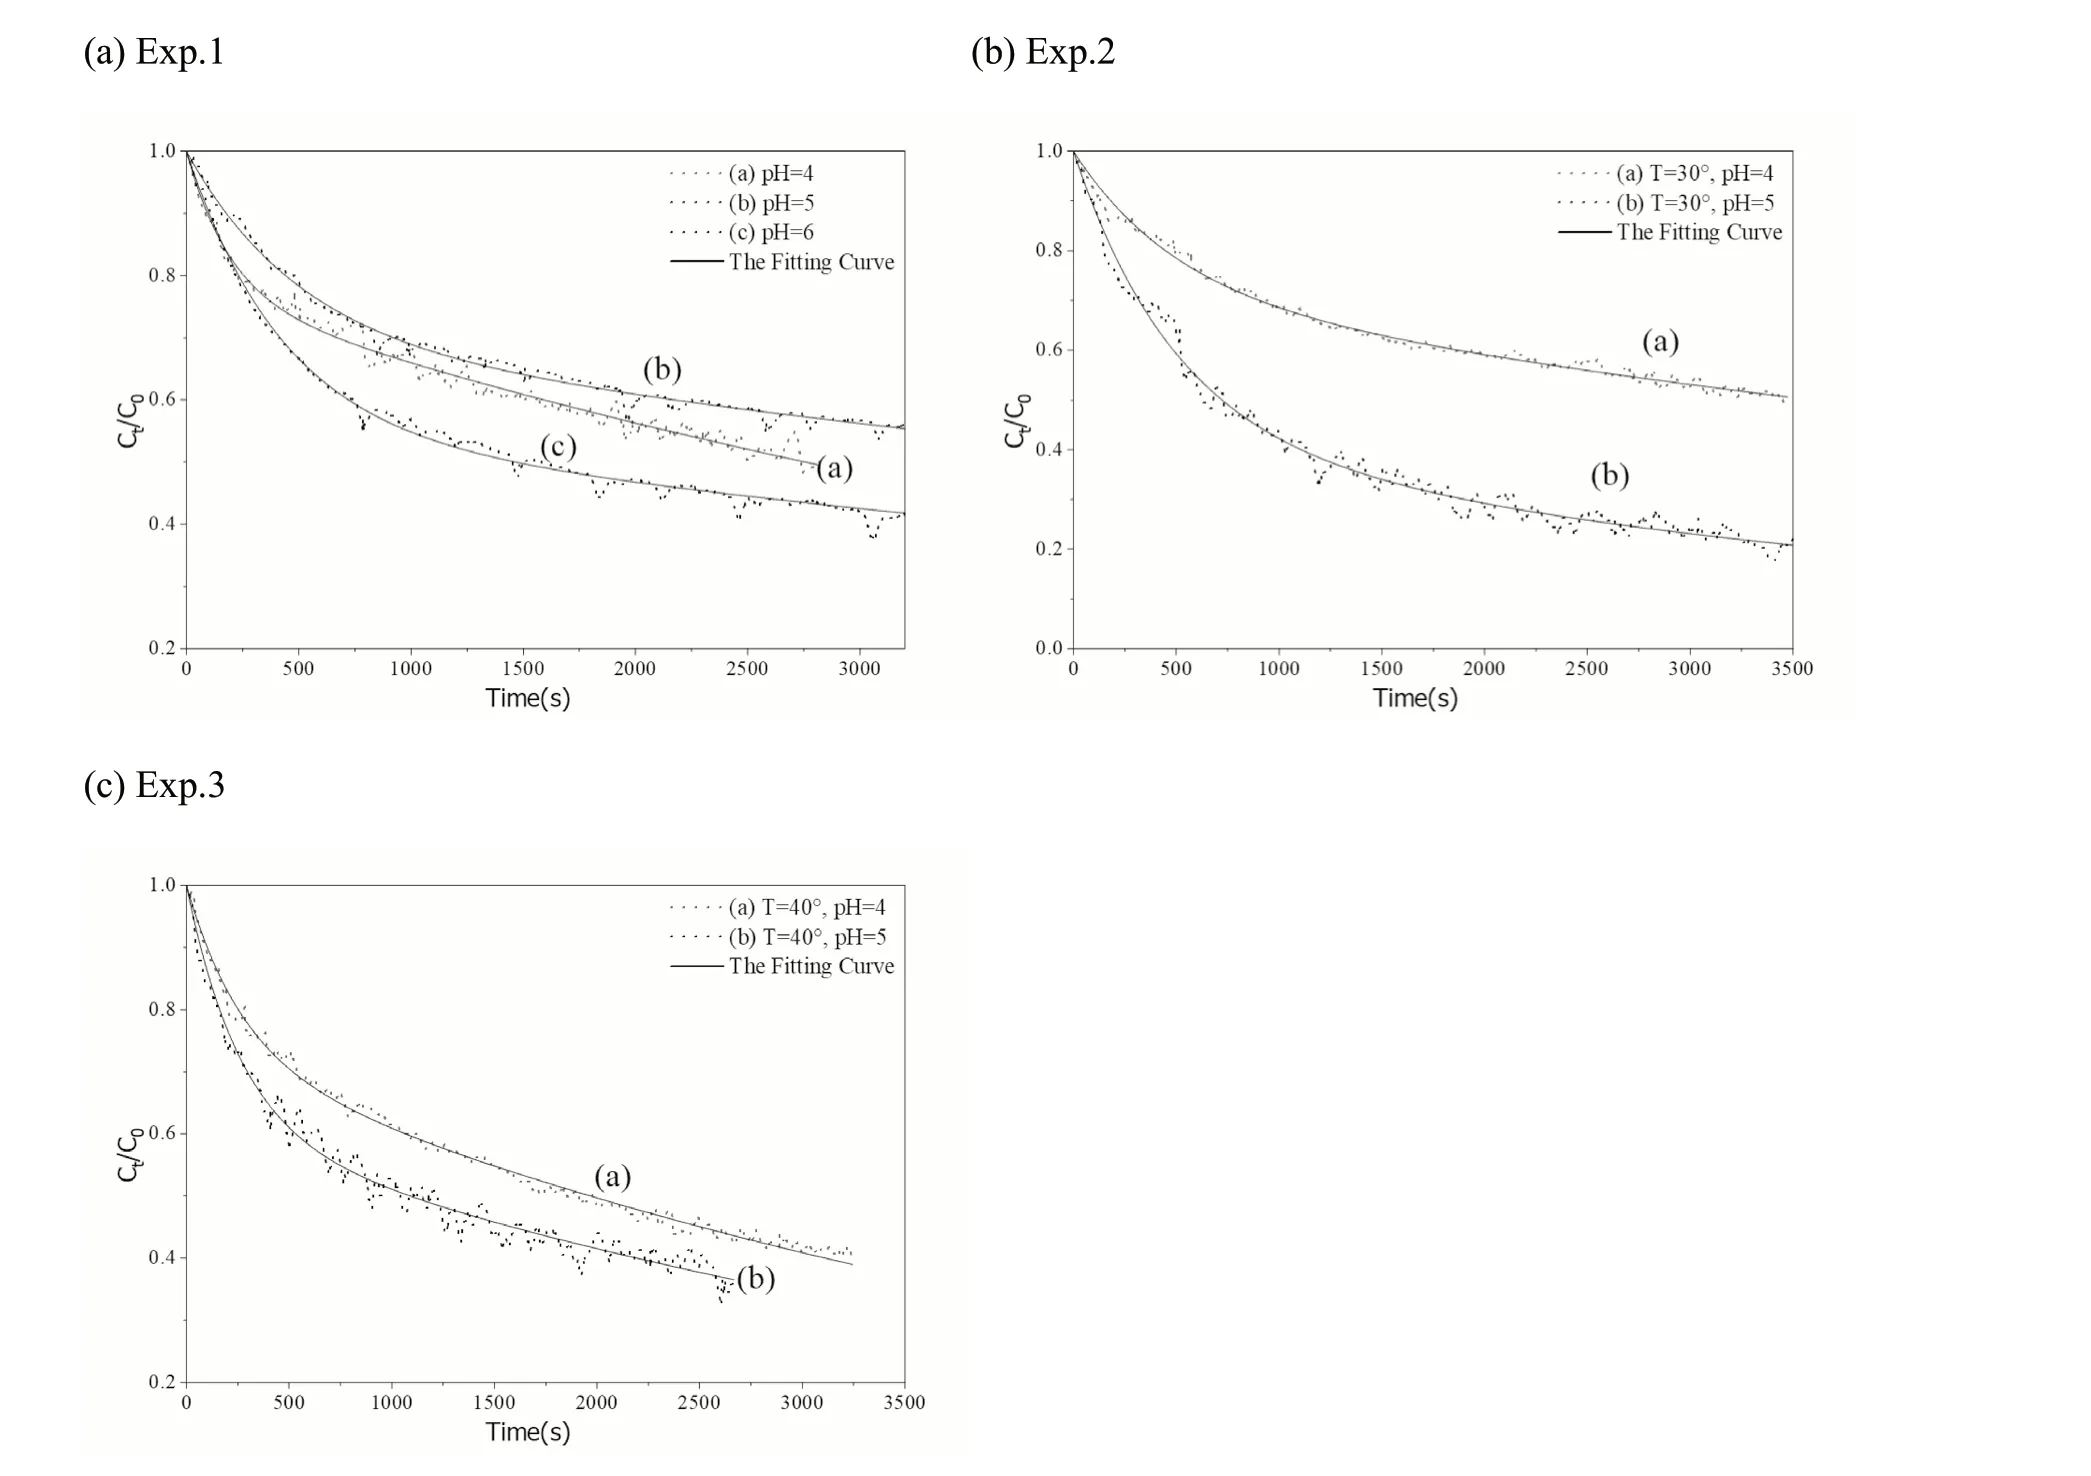
Fig.8 Curves of the experimental data (Ct/C0) of the kinetics tests and the fitting curve of the kinetics model of the liquid membrane diffusion exponent for the adsorption of Eu on the D231 cation exchange resin (Notes: The detailed conditions of the experiments are shown in Table 2)
The calculated reaction rate of Step 1 (γ1) was always larger (4.19 × 10⁻³–5.43 × 10⁻³> 1.58 × 10⁻⁴–7.14 × 10⁻⁵)thanγ2.This indicates that the front-end (rapidly decreasing) and rear-end (slowly decreasing) of the curves were owing to the adsorption of Eu on the liquid membrane and solid internal hole, respectively.The parameters for the adsorption of Eu onto the D231 cation-exchange resin are listed in Table 5.For the series of pH, theaparameters gradually increased (0.23–0.45) and the adsorption capacity of the D231 resin improved according to theCt/C0curves shown in Fig.8.This is because the adsorption mechanism of Eu on the D231 resin was a cation exchange,which mainly depended on the pH of the solution.As the pH increases, the Eu(III) on the liquid membrane further supplies the demand of Step 2.The calculated reaction rates of Step 1 (γ1) were always larger (5.13 × 10⁻³–7.92 ×10⁻³> 1.50 × 10⁻⁴–2.36 × 10⁻⁴) than those of Step 2 (γ2).The calculated weight factoraand the activation energy of the two steps were hardly influenced by the temperature.Comparing the different adsorption materials, bentonite and the D231 resin, the parameters ofafor the bentonite were larger than those of the D231 resin.Considering parameter ofafor the D231 resin, the weight factor ofafor the adsorption of Eu on bentonite was further influenced by the different experimental conditions.However, according to the calculated parameters ofashown in Table 5, the adsorption of Eu on the D231 resin was mainly controlled by Step 2 (chemical behavior: cation exchange).
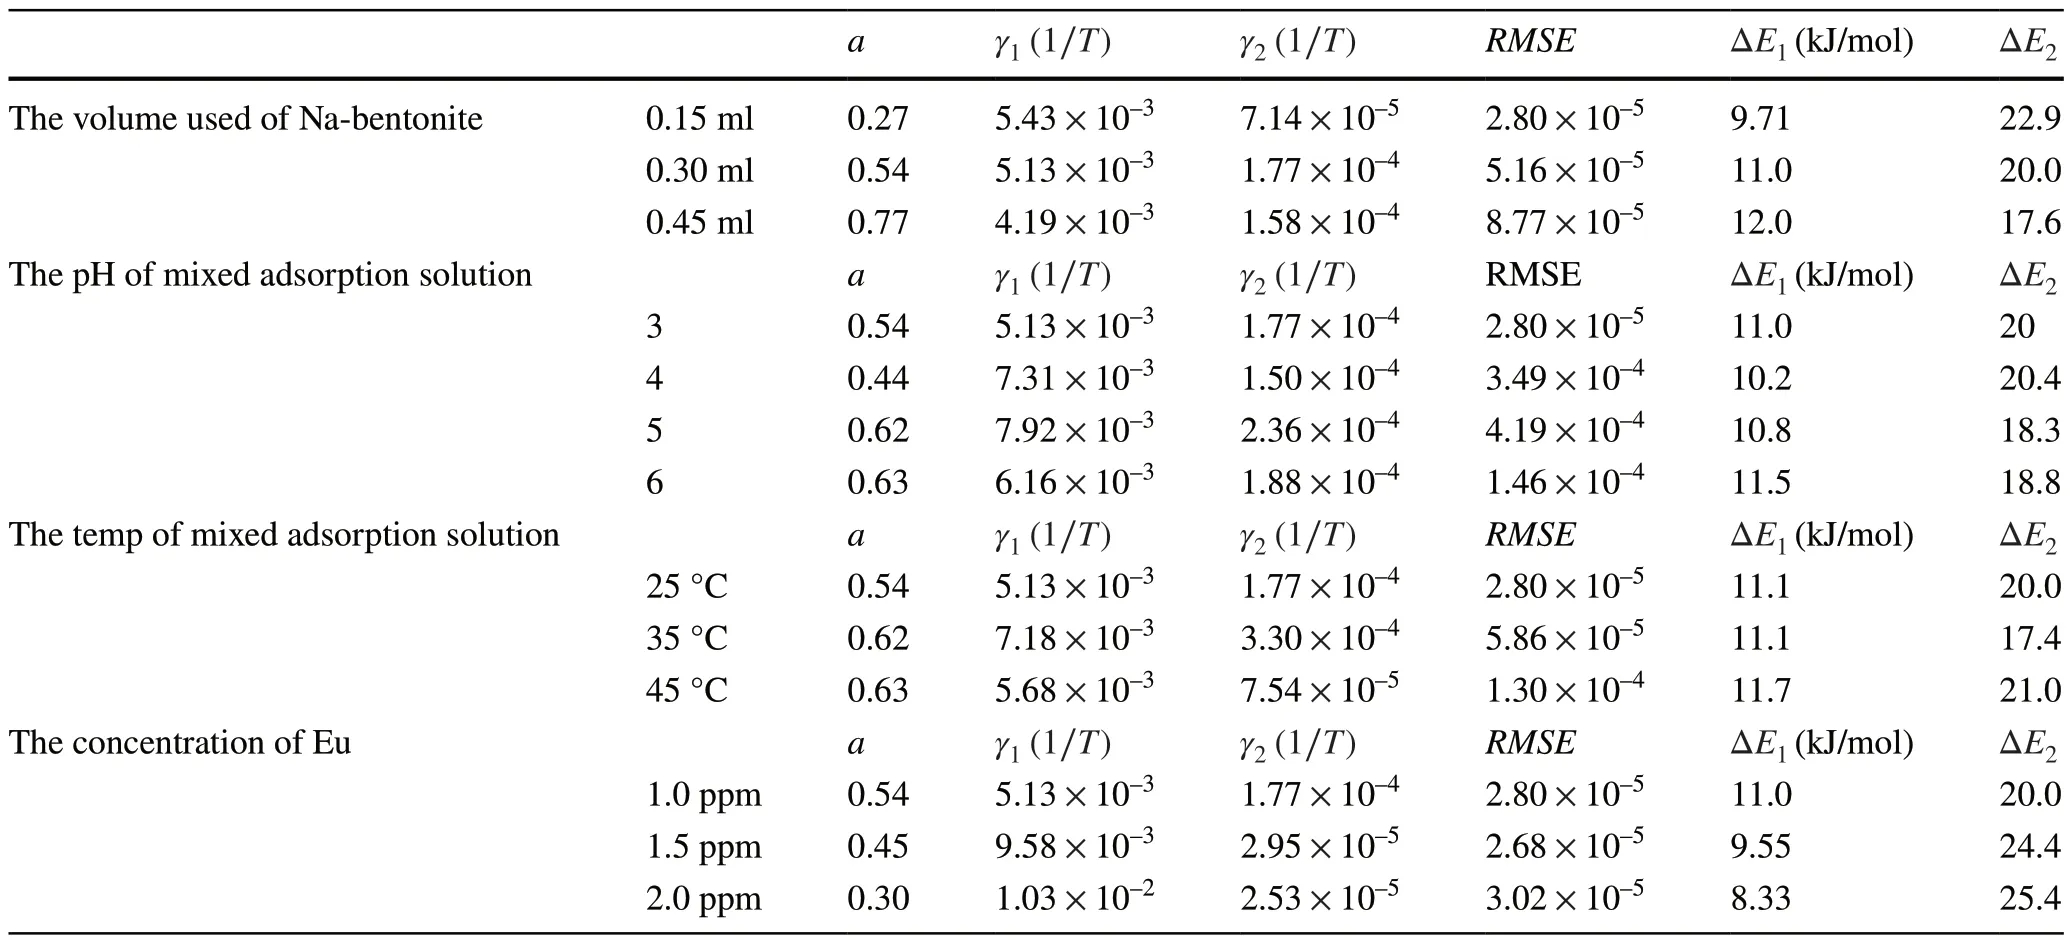
Table 4 Parameters of the exponential kinetics model of liquid membrane diffusion for the simulation of experimental data of the adsorption of Eu on Na-bentonite
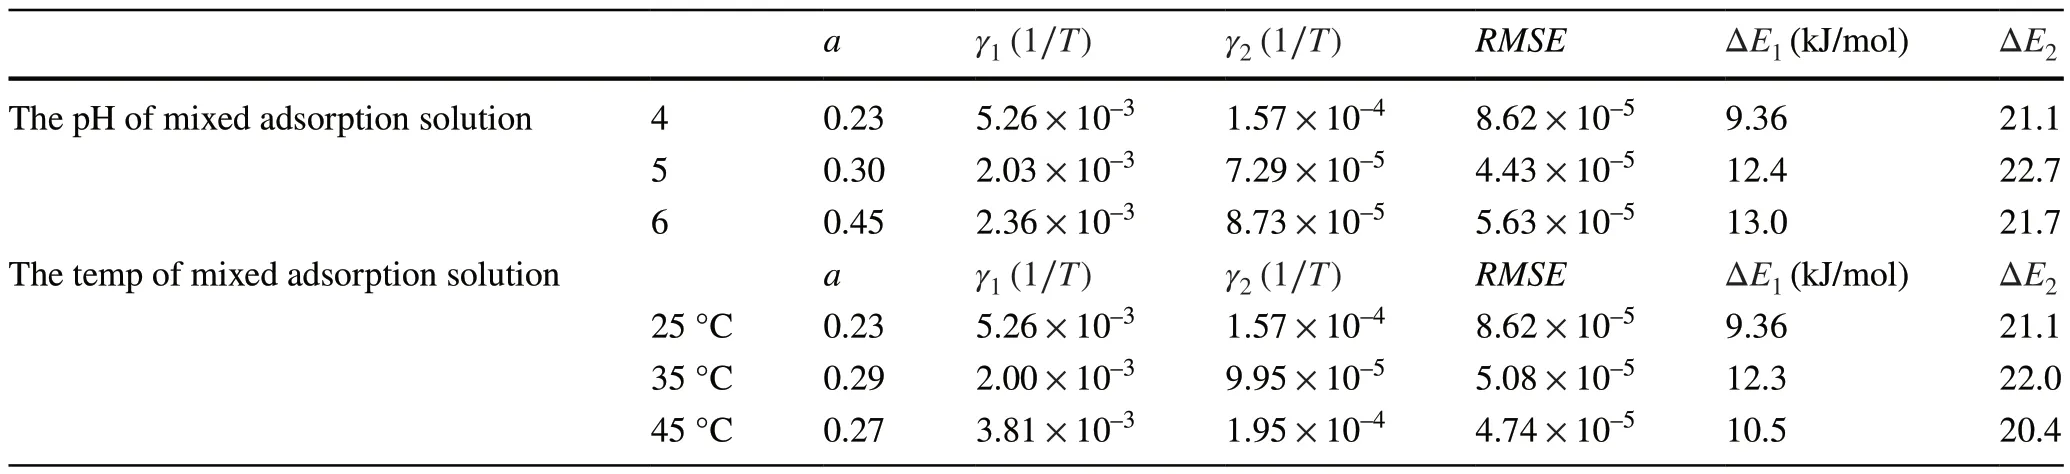
Table 5 The parameters of the liquid membrane diffusion exponent kinetic model for the simulation of experimental data of the adsorption of Eu on D231 caution exchange resin
5 Conclusion
In this study, the desorption reaction was observed in theCt/C0curves when kinetic adsorption tests were conducted under different conditions.A new automated adsorption platform for the continuous measurement and its corresponding kinetic adsorption experimental method were proposed to conduct kinetic adsorption experiments of Eu on Ca-bentonite, Na-bentonite, and the D231 cation exchange resin.A new exponential kinetics model of liquid membrane diffusion was used to simulate the experimental data obtained to evaluate the characteristics of the adsorption kinetics of Eu.The model used for the adsorption kinetics in this study was consistent with the experimental data.According to theCt/C0curves of Eu on Ca-bentonite,Na-bentonite, and the D231 resin, irregular fluctuations in the back-end of the curves were clearly observed, indicating the simultaneous occurrence of adsorption and physical desorption.The desorption of Eu on the D231 resin was more significant than that on the bentonite, which may be attributed to the lower selectivity of Eu on the D231 resin functional group.The values ofashown in Tables 3 and 4 were larger than those in Table 5, which indicates that the weight for Step 1 in the process of Eu adsorption on bentonite was stronger than that of D231; this implies that the surface charge of bentonite was negative, which improved the process of Eu adhering to the surface.Meanwhile, for the D231 caution resin, the surfaces of the resin particles were electrically neutral (the weight factor of Step 1 was lower than that of bentonite), and the adsorption of Eu on the solid internal hole was carefully exchanged in an equalcharge manner.The calculated reaction rate of Step 1 (γ1)was always larger thanγ2, which also reflects that the frontend (rapidly decreased) and rear-end (slowly decreased) of the curves were indicative of the adsorption of Eu on the liquid membrane and the solid internal hole, respectively; these results were in agreement with theCt/C0curves and reflected the reaction activation energy ΔE2.The XPS results demonstrated that the Eu(III) adsorption on Ca-bentonite gradually stabilized.The binding energy of the hydrated Eu(III) on the liquid membrane was the lowest, and its combination was relatively unstable.A previous study [20] also indicated similar conclusions, which supports the results of this study.Based on the aforementioned analysis, the adsorption models proposed in this study can be integrated into chemical and physical adsorption models.The adsorption mechanism is shown in Fig.9, where the kinetic curves observed in this study were not smooth, but fluctuated, and curve (a) was integrated with curves (b) and (c).Curve(b) represents the chemical adsorption occurring on the surface and internal hole of the bentonite /D231 resin, and curve (c) represents the physical adsorption occurring in the liquid membrane.Curve (b) represents the chemical adsorption types, indicating that the chemical bonds were stable and not immediately desorbed, whereas curve (c)represents the process by which the hydrated Eu ions diffuse into the liquid membrane, which is relatively unstable.Therefore, the amplitudes of the fluctuations in theCt/C0curves observed in this study were controlled by the weights of the two steps.

Fig.9 Schematic of the adsorption types for the models proposed in this study
Author contributionsAll authors contributed to the study conception and design.Material preparation, data collection and analysis were performed by H-QY, TY and J-HY.The first draft of the manuscript was written by H-QY and all authors commented on previous versions of the manuscript.All authors read and approved the final manuscript.
Data availabilityThe data that support the findings of this study are openly available in Science Data Bank at https:// cstr.cn/ 31253.11.scien cedb.j00186.00276 and https:// doi.org/https:// doi.org/ 10.57760/ scien cedb.j00186.00276.
Declarations
Conflict of interestThe authors declare that they have no competing interests.
 Nuclear Science and Techniques2024年1期
- Nuclear Science and Techniques的其它文章
- Correction to: Development and preliminary results of a large‑pixel two‑layer LaBr3 Compton camera prototype
- Conceptual design of a 714‑MHz RFQ for compact proton injectors and development of a new tuning algorithm on its aluminium prototype
- NνDEx‑100 conceptual design report
- Digital signal acquisition system for complex nuclear reaction experiments
- Infrared microspectroscopy beamline BL06B at SSRF
- Generation and regulation of electromagnetic pulses generated by femtosecond lasers interacting with multitargets