
Uncertainty and sensitivity analysis of in‑vessel phenomena under severe accident mitigation strategy based on ISAA‑SAUP program
2024-03-09 08:52HaoYangJiShenLiZhiRanZhangBinZhangJianQiangShan
Nuclear Science and Techniques 2024年1期
Hao Yang · Ji‑Shen Li · Zhi‑Ran Zhang · Bin Zhang,2 · Jian‑Qiang Shan,2
Abstract The phenomenology involved in severe accidents in nuclear reactors is highly complex.Currently, integrated analysis programs used for severe accident analysis heavily rely on custom empirical parameters, which introduce considerable uncertainty.Therefore, in recent years, the field of severe accidents has shifted its focus toward applying uncertainty analysis methods to quantify uncertainty in safety assessment programs, known as “best estimate plus uncertainty (BEPU).” This approach aids in enhancing our comprehension of these programs and their further development and improvement.This study concentrates on a third-generation pressurized water reactor equipped with advanced active and passive mitigation strategies.Through an Integrated Severe Accident Analysis Program (ISAA), numerical modeling and uncertainty analysis were conducted on severe accidents resulting from large break loss of coolant accidents.Seventeen uncertainty parameters of the ISAA program were meticulously screened.Using Wilks' formula, the developed uncertainty program code, SAUP,was employed to carry out Latin hypercube sampling, while ISAA was employed to execute batch calculations.Statistical analysis was then conducted on two figures of merit, namely hydrogen generation and the release of fission products within the pressure vessel.Uncertainty calculations revealed that hydrogen production and the fraction of fission product released exhibited a normal distribution, ranging from 182.784 to 330.664 kg and from 15.6 to 84.3%, respectively.The ratio of hydrogen production to reactor thermal power fell within the range of 0.0578–0.105.A sensitivity analysis was performed for uncertain input parameters, revealing significant correlations between the failure temperature of the cladding oxide layer,maximum melt flow rate, size of the particulate debris, and porosity of the debris with both hydrogen generation and the release of fission products.
Keywords Gen-III PWR · Severe accident mitigation · Wilks’ formula · Hydrogen · Fission products · Uncertainty and sensitivity analysis
1 Introduction
In traditional accident analysis, deterministic methods are commonly employed.However, due to cognitive limitations and other factors, the understanding of mathematical models is not perfect [1].Therefore, when predicting thermal hydraulics and severe accident phenomena, mathematical models with varying degrees of accuracy and reliability inevitably introduce uncertainty [2].The Best Estimate Plus Uncertainty (BEPU) method, which combines the best estimation program with uncertainty analysis, helps avoid excessive subjective assumptions.Since the 1990s, the use of best-estimate codes and the BEPU safety analysis method has become the preferred approach to meet increasing technical and regulatory requirements [3].
In the realm of uncertainty analysis for severe accidents,the primary focus is on employing severe accident analysis programs such as MELCOR, MAAP and ASTEC [4–6] to assess the effects of fission product releases and hydrogen production.In 2019, a collaborative research project named MUSA [7] involved organizations from 16 different countries, aiming to enhance the practical application of uncertainty and sensitivity methods for severe accident analysis in water-cooled reactors.The MUSA project's objective was to use uncertainty analysis methods to evaluate the predictive capability of severe accident codes for GEN II, GEN III, and GEN III + reactors.In recent years, researchers from various countries have conducted numerous uncertainty analyses of severe accidents in light-water reactors.Yousefpour[2] analyzed the probability of creep fracture failure in a two-loop PWR using MATLAB and MELCOR programs.Chevalier-Jabet et al.[8] assessed the source term consequences for a French 1300 MWe PWR using the ASTEC code and the uncertainty propagation tool SUNSET.Ahn et al.[9, 10] conducted uncertainty analyses on the main phenomena occurring during a short-term Station Blackout(SBO) accident in the advanced pressurized water reactor(APWR) OPR1000 in Korea.Sensitivity analysis was performed using the MAAP5 and MELCOR programs to identify important sensitivity parameters of the program models.Gharari [11] conducted a statistical analysis of hydrogen production during SBO-LBLOCA, SBO-SBLOCA, and various SBO accidents in the VVER1000 reactor using the LHS method and MELCOR program.Malicki [12], Darnowski [13], and Tiborcz [14] carried out studies on aerosol behavior, fission product release, and hydrogen production in PHEBUS experiments using MELCOR and ATHLET,respectively.Ma [15] used traditional uncertainty analysis methods combined with the MELCOR program to analyze a Nordic boiling water reactor and summarized the advantages and disadvantages of the different methods.Due to the limitations of traditional methods in severe accident analysis, Ma[16] further conducted research using a bootstrap artificial neural network (ANN) model.In fact, there is still relatively limited research on uncertainty analysis for severe accidents.Given the extreme complexity and uncertainty of severe accidents themselves, conducting related work holds great significance for the safety design of nuclear power plants and the development of physical models for severe accidents.
A double-ended cold leg (DECL) break refers to a specific type of large LOCA, characterized by a total guillotine-type break in the cold leg pipe [17].Without mitigation measures, this accident could result in the release of high-temperature coolant into the containment (Design Basis Accident, DBA), hydrogen production within the Reactor Pressure Vessel (RPV) (Beyond Design Basis Accident,BDBA), core meltdown, and hydrogen production outside the vessel (Severe Accident, SA), ultimately leading to the occurrence of a hydrogen explosion, loss of containment integrity, and large-scale radioactive leakage [18].Currently,advanced PWRs worldwide have implemented various accident mitigation measures to reduce the consequences of accidents and prevent the spread of fission products [17,18].Therefore, assessing the quantities of hydrogen and radioactive materials released during accident mitigation is a central focus of severe accident analysis.This paper focuses on a Gen-III PWR that employs advanced active and passive mitigation strategies.A numerical model of a severe accident caused by an LBLOCA was developed using the integrated severe accident analysis ISAA program [19–21].Relevant work has been conducted by combining uncertainty and sensitivity analyses.The research presented in this paper can offer support for the design and optimization of severe accident mitigation measures for Gen-III PWR, as well as the improvement and development of severe accident analysis programs.
2 APWR numerical model
The ISAA was employed for the numerical modeling of a double-ended cold-leg guillotine break LOCA in a 1000 MWe advanced PWR.The system model node diagram is shown in Fig.1, which encompasses the primary reactor primary system, a portion of the secondary system, as well as the active and passive safety equipment.
Previously, safety analyses were conducted to assess the impact of various safety equipment types in an APWR under an LBLOCA, as reported by Li [22].The results demonstrated that relying on primary passive equipment such as a Core Makeup Tank (CMT) and Cavity Injection Systems(CIS) could effectively delay the core degradation process in an LBLOCA accident, thereby preventing the failure of the pressure vessel's lower head and significantly reducing the release of radioactive nuclides from the reactor.Given the complexity of phenomena inside the reactor and the high uncertainty associated with the generation of hydrogen gas and the release of fission products during severe accident mitigation, it is imperative to conduct accident analysis and safety assessment based on corresponding accident mitigation scenarios.The primary objective of this paper is to investigate the impact of physical models on the source term release inside the RPV during the core degradation process.Hence, the third condition was selected, involving the utilization of CMT, CIS, and Containment SPray system (CSP)passive equipment, along with active Low-Head Safety Injections (LHSI), while the other equipment experienced failures.

Fig.1 (Color online) numerical modeling of APWR
3 Methodology
3.1 Overview of ISAA‑SAUP
Consistent with the approach commonly employed in most current BEPU methods, the uncertainty analysis code SAUP developed in this paper adheres to the fundamental concept of "propagation based on input uncertainty" [23].Inputbased uncertainty analysis involves the introduction of statistical variations in uncertain input parameters, and their uncertainty is propagated throughout the code, as illustrated in Fig.2.This program, as depicted in Fig.2, typically comprises the following steps: (1) identification of the Figures of Merit (FOMs) and confirmation of the input parameters,including their distributions and ranges; (2) utilization of the LHS statistical method for random sampling to generateNsets of input cards; (3) invocation of the ISAA program for parallel computation; (4) extraction of program calculation results and utilization of different methods to estimate percentiles with confidence intervals; (5) derivation of the empirical cumulative distribution function (CDF) and the 95/95 estimated statistical values through statistical analysis;and (6) execution of parameter sensitivity analysis based on sampling calculations.

Fig.2 (Color online) the computational framework of SAUP
ISAA [19–21] is an integrated system-level computer code primarily used to describe the progression of severe nuclear reactor accidents.It incorporates advanced and validated physical models capable of representing a wide array of severe accident phenomena, including thermal–hydraulic behaviors, heat-up, degradation, and relocation of the reactor core, generation of combustible gases, and the release and transport of radionuclides.ISAA employs a modular approach, integrating various modules to model different physical phenomena during severe accidents.The calling relationships and functions of the main modules are illustrated in Fig.3.
3.2 Nonparametric statistical method
Nonparametric statistical methods [24] are primarily used to determine the minimum required number of computational cases,N, for given values ofγandβ.The most widely used nonparametric statistical method in BEPU analysis is Wilks'method [25].It offers the advantage of a sample size that is independent of the number of input parameters.Wilks'formula establishes a relationship between the confidence levelβ, the probability levelγ, and the number of samplesN, effectively reducing the number of calculated samples and improving computational efficiency.During its application, this method directly derives a one-sided tolerance limit through the permutation of output parameters without the need for additional calculations.The one-sided Wilks'formula is presented as follows (Table 1):
3.3 Latin hypercube sampling
The fundamental concept of Latin Hypercube Sampling(LHS) is as follows: It employs stratified sampling to address the challenge of generating a large number of sampling points efficiently, especially when compared to simple Monte Carlo methods [26].LHS divides the sampling range intoNnon-overlapping intervals of equal probability based on the distribution function and value range of each input parameter.Random sampling is then conducted within each interval [27], as shown in Fig.4.This approach prevents duplication and omission of data, ensuring comprehensive coverage of the entire sampling area, thereby enhancing sampling efficiency and accuracy [28].

Fig.3 (Color online) main modules in ISAA

Table 1 Minimumcomputational cases N for onesided tolerance limit of 95/95
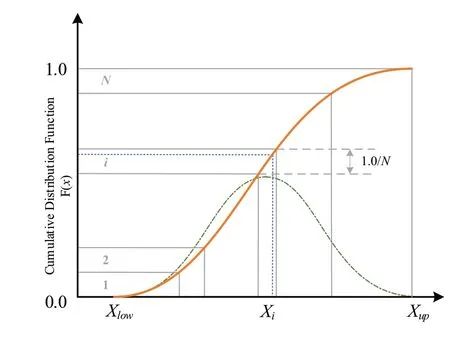
Fig.4 Principle of LHS
3.4 Sensitivity analysis methods
Sensitivity analysis [29] focuses on the influence of input parameters on output parameters.Its objective is to identify key parameters that significantly affect the target parameter while screening out less influential ones.The performance of a sensitivity analysis between uncertain input variables and the response parameters provides guidance on how to effectively refine the model to reduce output uncertainty.Stochastic sampling of uncertain parameters was performed,and the analysis of their impact on the output was conducted by running the programNtimes using the LHS method.Various methods, such as correlation analysis and regression analysis, were employed to quantify the impact of the selected input parameters on the results [29–33].
3.4.1 The Pearson correlation coefficient
The Pearson correlation coefficient [30] measures the linear correlation between inputXand outputYand is represented by "r." It ranges between − 1 and 1, with − 1 indicating a perfect negative correlation, 0 indicating no correlation,and 1 indicating a perfect positive correlation.The Pearson correlation coefficient is used to determine the strength and direction of the relationship between two variables and is widely employed in statistical analysis to assess the association between two numerical variables.However, it is sensitive to outliers and does not account for the possibility of one parameter being related to another.The formula for calculating the Pearson correlation coefficient is as follows:
where

3.4.2 The Spearman rank correlation coefficient
The Spearman rank correlation coefficient [31] is based on the ranks of the inputs and outputs, rather than their actual values, to calculate the correlation between them.Therefore,even if there are large differences in the magnitudes between the inputs and outputs, the Spearman rank correlation coefficient is still effective, thus overcoming the limitations of the Pearson correlation coefficient.
whereR(Xi) andR(Yi) represent the rankings of thei-th variable among all samples, andNrepresents the total sample size.
3.4.3 The partial rank correlation coefficient (PRCC)
The Spearman rank correlation coefficient [31] calculates the correlation between two variables based on the ranks of their inputs and outputs, rather than their actual values.This approach allows it to remain effective even when there are significant differences in magnitude between the inputs and outputs, overcoming the limitations of the Pearson correlation coefficient.The Partial Rank correlation coefficient [9]measures the degree of the linear relationship between inputs and outputs while accounting for the linear effects of other parameters.In situations where we want to assess the correlation between two variables while considering the potential influence of other variables on their relationship, the partial correlation coefficient helps us determine the independent relationship between them by removing the influence of other variables.
Because the PRCC isolates relationships between variables from the influence of other variables, it provides a more accurate analysis and prediction of each variable's behavior and helps in better understanding the causal relationships between them [32].In cases where multicollinearity exists among the parameters, the PRCC outperforms the Pearson correlation coefficient.
whereρPCCYX1X2represents the partial correlation coefficient betweenX1andYafter removing the influence ofX2variable, andrYX1,rYX2andrX2X1represent the linear correlation coefficient between two variables.
3.4.4 The standardized regression coefficient (SRC)
The standardized regression coefficient [33] is a commonly used statistic in multiple linear regressions.It quantifies the average change in the dependent variable when the independent variable changes by one unit of standard deviation.UsingXjandYto represent the inputs and outputs, respectively, we can establish a multiple linear regression model:
The absolute range of the standardized regression coefficients falls between 0.0 and 1.0, and their sign signifies whether there is a positive or negative correlation betweenXjandY.The formula for calculating SRC is as:
wherebjrepresents the regression coefficient ofXjonYand Var(Xj) and Var(Y) represent the variances ofXjandY,respectively.
Another crucial coefficient for assessing a regression model's capacity to fit the data is the model determination coefficientR2.It assumes values between 0 and 1, where a value approaching 0 indicates a suboptimal fit to the data,while a value nearing 1 signifies a strong fit.
4 Results and discussion
4.1 FOMs and uncertain parameters
After the Fukushima accident, researchers have extensively investigated the issue of hydrogen production during the accident processes of light-water reactors.The zirconium–water reaction can release hydrogen gas and generate heat, and the generation of hydrogen gas poses the risk of a hydrogen explosion.Consequently, within an integrated severe accident analysis program, the zirconium-water reaction and the release of fission products have become essential phenomena to consider.
This study focuses on the generation of hydrogen gas and the release of fission products during the progression of severe accidents.Drawing on the relevant physics models within the ISAA program and insights gained from ongoing uncertainty analyses of severe accidents [9–16, 31],we selected 17 key uncertain input parameters for analysis,as listed in Table 2.These parameters encompass models associated with material heat transfer, oxidation collapse,material relocation, and debris behavior within the reactor core, potentially exerting varying degrees of influence on the accident phenomena inside the vessel.
In this study, LHS was used to perform stratified sampling on 17 uncertain input parameters, and the sampling results for the different distribution functions are provided below(Fig.5).
4.2 Uncertainty analysis
4.2.1 Hydrogen productionFigure 6a shows the transient change curve of hydrogen mass under various operating conditions, while Fig.6b shows a scatter plot of total hydrogen production.As apparent from the figures, hydrogen was primarily generated during theinitial stages of large-break loss of coolant accidents.This is because, immediately after the accident was triggered at 0.0 s, a substantial amount of coolant was expelled, leading to a rapid decrease in the core water level, coupled with an increase in fuel temperature.Simultaneously, the CMT and LHSI systems promptly initiated water injection into the high-temperature-exposed core, resulting in the generation of a significant amount of steam.Zirconium alloys undergo a vigorous oxidation reaction with water vapor when temperatures exceed 1500 K, leading to the early production of a substantial amount of hydrogen.Thanks to the timely activation of safety systems and core cooling, further hydrogen production through oxidation was averted.By the time 1000 s had elapsed, hydrogen production had reached a steady state.

Table 2 Uncertain input parameters
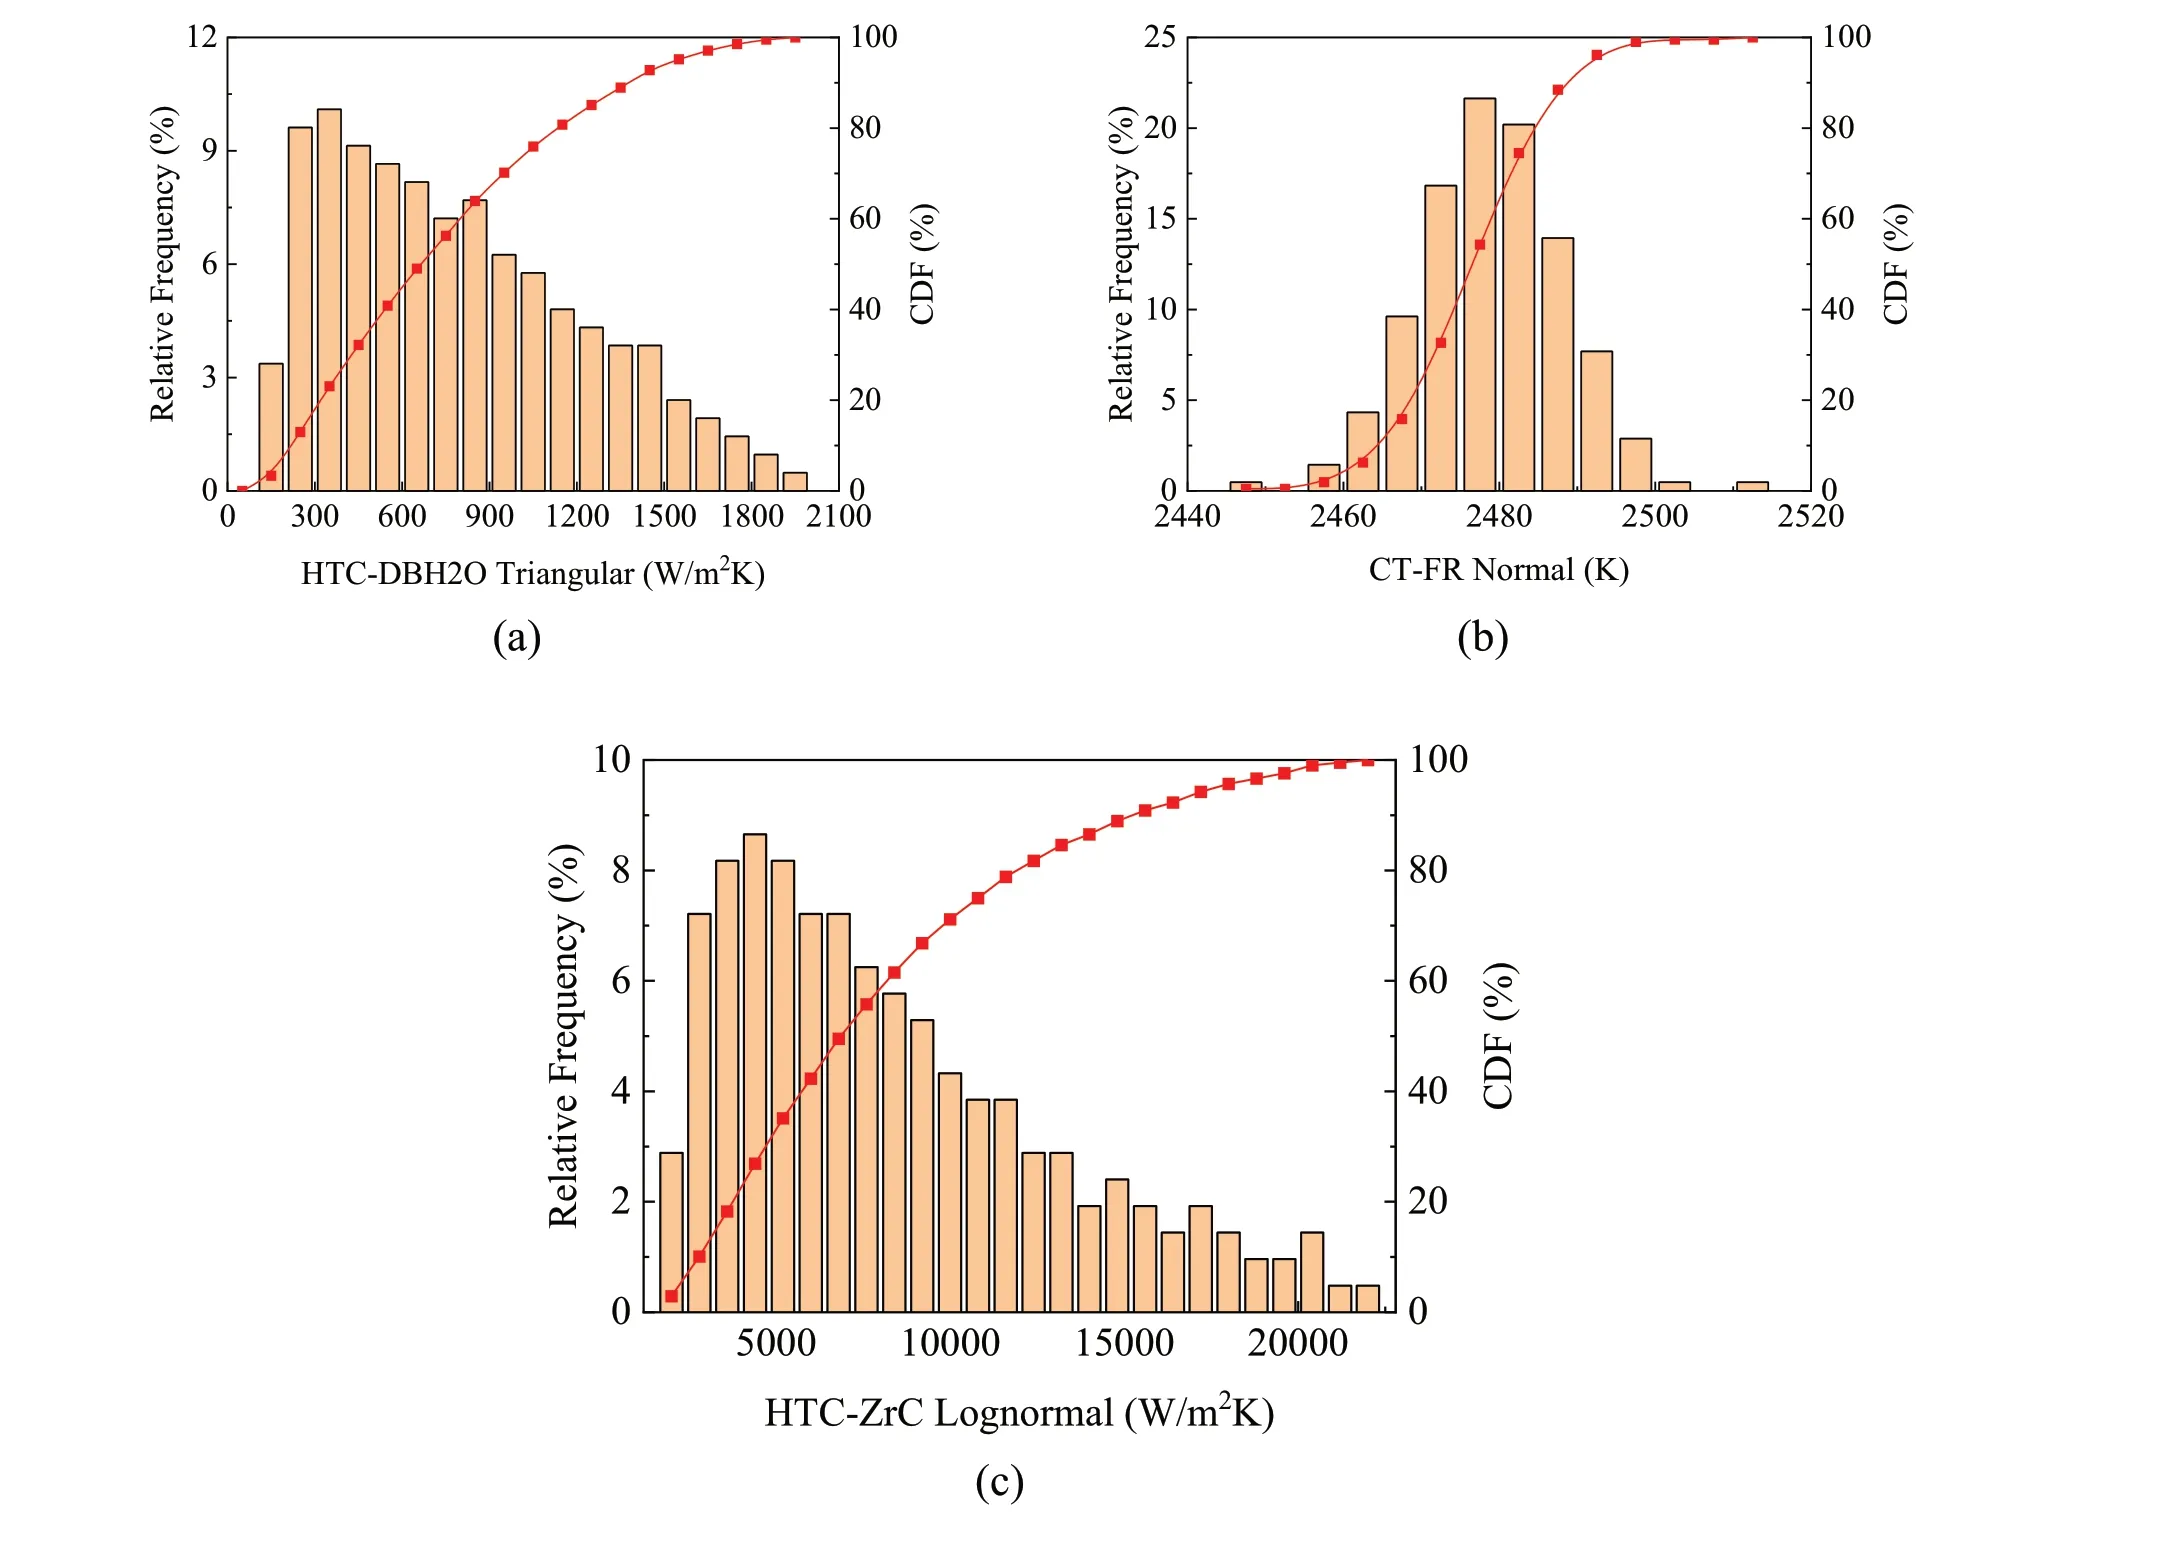
Fig.5 (Color online) LHS sampling results.a Triangular distribution; b normal distribution; c lognormal distribution
As the accident developed, the uncertainty band for hydrogen production gradually widened.Through calculations, it is evident that the total mass of hydrogen generated falls within the range of 182.784–330.664 kg.Darnowski[13] calculated that hydrogen production from zirconium oxidation accounted for approximately 97% of the total hydrogen mass in a double-ended break LOCA accident in a PWR reactor.According to the design parameters of a million-kilowatt nuclear power plant, hydrogen production from 100% zirconium–water reaction is approximately 1010.1 kg.Based on the calculations in this article, it can be inferred that approximately 18.10–32.736% of zirconium reacts with water to produce hydrogen within the reactor core.
Examining the various percentile curves in Fig.6a, it is evident that the calculated result of 278.348 kg for the reference operating conditions closely aligns with the median value of 253.242 kg.Figure 6c illustrates the probability density distributions (PDF) of hydrogen production under all operating conditions.After data processing, the overall sample calculation results fit a normal distribution with anR2value of 0.8968, and the one-sided upper limit of the hydrogen mass associated with a 95% cumulative probability density is 306.621 kg.

Fig.6 (Color online) Uncertainty analysis of hydrogen production.a Hydrogen production in pressure vessel; b hydrogen mass scatter point; c probability density distribution of hydrogen mass
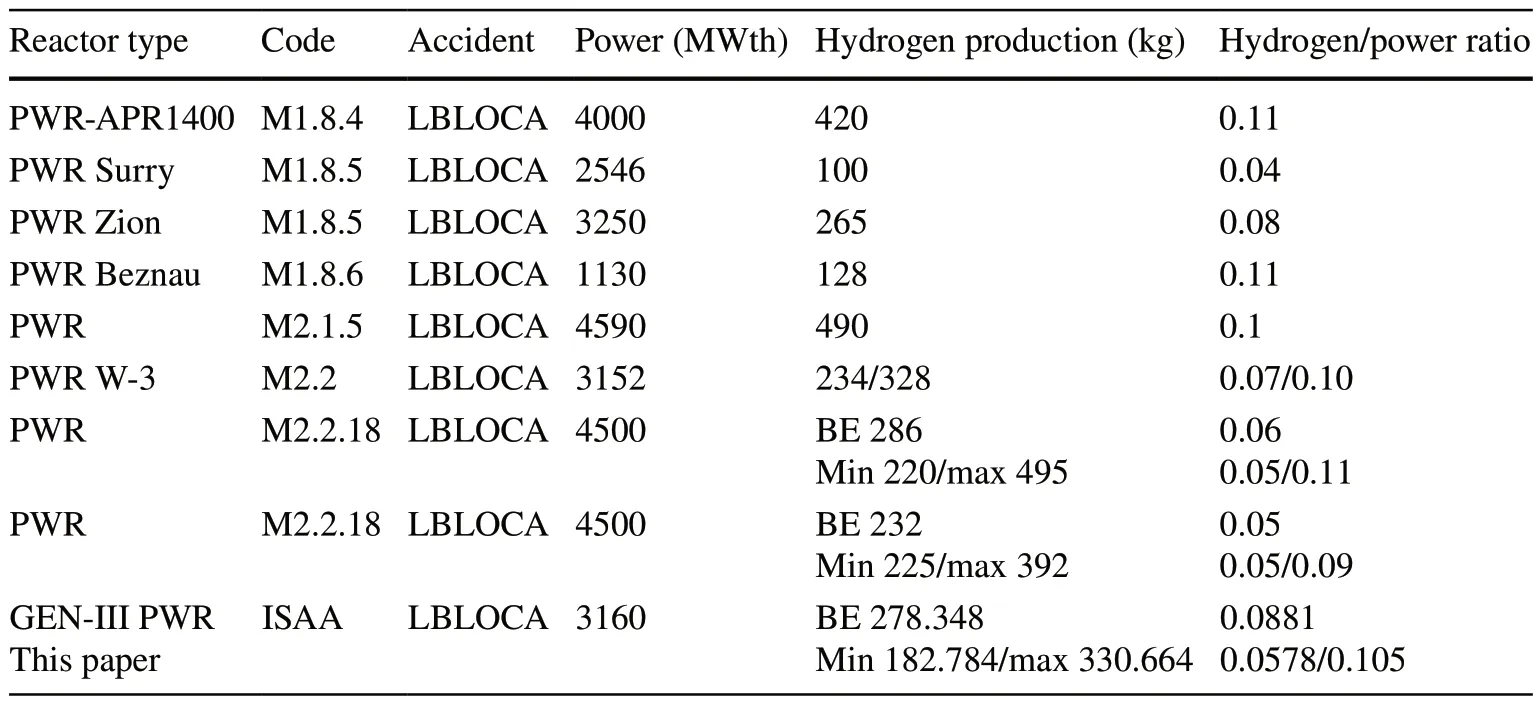
Table 3 Hydrogen production data calculated for different reactors
Thermal power is directly linked to the size of the reactor core and, to some extent, is proportionate to the mass of zirconium.Due to variations in reactor design parameters and calculation programs, a metric (the ratio of hydrogen production to thermal power within the reactor core) was introduced for comparative analysis, as outlined in Table 3.According to the table, the MELCOR simulation results for LBLOCA in different reactor types project hydrogento-thermal power ratios ranging from 0.04 to 0.11 kg H2/MWth.Zhao [34] and colleagues [34] conducted a sensitivity analysis of the COR node in a Westinghouse threeloop nuclear power plant during an LBLOCA, predicting similar values within the range of 0.07–0.1 kg H2/MWth.In this study, the best estimates and uncertainty analysis of the hydrogen-to-thermal power ratio obtained through ISAA were 0.0881 and 0.0578–0.105, respectively, which align with other simulation results.

Fig.7 (Color online) Uncertainty analysis of FP release fraction.a Release fraction of Cs/I from fuel; b scatter plots for Cs/I fraction; c probability density distribution of Cs/I release fraction
4.2.2 Fission product release fractionFigure 7a displays the curve representing the release fraction of fission products during the accident.Cs and I symbolize the release behaviors of highly volatile fission products,with their behaviors being relatively similar.The primary factor influencing their release from the fuel is the fuel temperature [22].Shortly after the PCS pipeline experienced shear rupture, the rapid loss of coolant resulted in a swift decline in the core water level and a rapid increase in fuel temperature.During this phase, fission products were rapidly released at a high rate as the fuel temperature increased.Subsequently, the release rate of fission products decreased as the safety injection system consistently injected water to cool the core materials.Ultimately, further progression of the accident was arrested by the continuous cooling provided by the Low-Head Safety Injection (LHSI) system, resulting in the cessation of fission product release, which stabilized at a certain mass level.
Analyzing the data from Figs.7a and b, it becomes evident that the range of the proportion of nuclide release to the initial reactor inventory is quite extensive, spanning from 15.6 to 84.3%.In comparison to the release fraction (less than 35%) obtained by Ahn et al.[9] in their uncertainty calculation for the Station Blackout (SBO) accident in the OPR1000 advanced reactor, the LBLOCA results in considerably more severe radioactive consequences.This paper primarily focuses on the fraction of fission products released after the core has been cooled.The instantaneous data distribution function at 15,000 s is shown in Fig.7c.The fraction of fission products released from the fuel follows a normal distribution (R2= 0.94), with the calculated value (43.956%)closely aligning with the median value (48.1%), indicating a high degree of consistency with the reference case.
4.2.3 The influence of Wilks order
Non parametric statistical methods, employing Wilks' formula, were used to calculate one-sided tolerance upper limits for hydrogen production and fission product release fractions at a 95% confidence level and 95% probability levels.The upper limits obtained through resampling are listed in Table 4.
The results reveal that non-parametric statistical methods inherently exhibit conservatism when calculating onesided tolerance limits at lower orders.Calculations using the higher-order Wilks' formula yield more stable results.Studies have shown that the one-sided tolerance upper limitscalculated with Wilks' formula gradually converge after the third order [24, 35].Figure 8 underscores this consistent trend.Mean values calculated using Wilks' formula with third-order or higher sampling have already converged,and increasing the order has relatively minor effects on the results.

Table 4 The 95/95 estimates by nonparametric methods

Fig.8 Wilks’ method analysis.a The 95/95 upper limit of hydrogen production; b the 95/95 upper limit of the FP release fraction
4.3 Sensitivity/importance analysis
This section summarizes the results of various sensitivity analyses and interprets them in conjunction with the data distribution graph.To assess the credibility of the sensitivity analysis results,Pvalues were calculated for each parameter.WhenP< 0.05, the correlation calculation was considered to be statistically [13–15].Generally, highρand lowPvalues indicate a strong correlation.Furthermore, in some scatter plots in the following text, there are noticeable dispersions in the results.This could be due to the random combinations after LHS, introducing some dispersion into the results [36].However, the dispersion resulting from other factors reduces the overall influence of the analyzed model parameters on the output.Nonetheless, correlations between the parameters can still be observed through correlation analysis and data graphs.
4.3.1 Sensitivity analysis of hydrogen production
Various sensitivity analysis methods were employed to assess the degree of influence of each uncertain input parameter on hydrogen production.The calculation results are presented in Table 5 and Fig.9a.According to the results, the rupture temperature of the zirconia oxide layer (RT-ZrO2)exhibits a strong positive correlation with hydrogen production, while the maximum flow rate of molten material after the oxide layer rupture (MaxFR-Mat) and the equivalent diameter of the particulate debris in the core (EDPD-CORE)show weak negative correlations with hydrogen production.Other parameters did not display significant correlations.

Table 5 Sensitivity analysis of hydrogen production
Zirconium alloy forms an oxide shell layer on the exterior of the cladding due to the oxidation reaction, which prevents the molten material from undergoing relocation.It ruptures and relocates only when the oxide shell layer reaches its failure temperature.The failure temperature of the oxide shell layer determines when the molten material is released and impacts the reaction between water vapor and the zirconium alloy, subsequently affecting hydrogen production.A higher failure temperature results in a higher material temperature when the fuel rod collapses into particle debris, leading to a faster zirconium-steam oxidation rate and a greater amount of hydrogen production.To visually represent the linear relationship between this parameter and hydrogen production, Fig.9b shows a scatter plot of temperature values and hydrogen production for each operating condition and conducts a linear fitting (R2= 0.593).The linear fitting outcome is consistent with the correlation coefficient calculations,indicating a significant positive correlation between the two.Wang et al.[15] conducted a sensitivity analysis of a Nordic boiling water reactor and obtained results that align with the conclusions of this study.
As shown in Fig.9a, there is a negative correlation between EDPD-CORE and hydrogen production, consistent with the overall trend observed in the linear fitting shown in Fig.9c.Smaller particulate debris likely have a larger contact area with water vapor, making oxidation reactions more likely to occur and produce more hydrogen, resulting in a negative correlation.
There is a weak negative correlation (ρ≈0.20) between the maximum flow rate of molten material after oxide layer rupture (MaxFR-Mat) and hydrogen production, as shown in Fig.9d.This parameter partially determines the amount of molten zirconium exposed to oxidation outside the core.The analysis results in this study are consistent with the sensitivity analysis results of Choi et al.[10] for the OPR1000 reactor mitigation strategies.This could be attributed to the safety injection system rapidly injecting water into the reactor, with higher flow rates enhancing the heat exchange between the molten material and water, rapidly cooling it and resulting in less hydrogen generation.
4.3.2 Sensitivity analysis of FP release fraction
Table 6 and Fig.10a show the sensitivity analysis results for the 17 model parameters concerning the total fission product release from the fuel.Similar to hydrogen production, a correlation was observed between RT-ZrO2,MaxFR-Mat, and EDPD-CORE and the fission product release fraction.However, the porosity of the debris(POR-DB) exhibited a significant negative correlation(− 0.853, − 0.632) with the release of fission products, distinct from the sensitivity analysis of hydrogen production.Other model parameters did not exhibit clear relationships in this study.
As previously discussed, RT-ZrO2and MaxFR-Mat can influence the release of molten materials from the rod and the heat exchange process with water.A higher failure temperature of the oxide layer results in higher debris temperatures, delaying their cooling, and thus a more evident positive correlation between RT-ZrO2and the fission product release.After reaching the failure value of RT-ZrO2, molten material is ejected from the oxide layer.At this point, due to the activation of the safety system and external water injection, a larger MaxFR-Mat enhances the heat exchange and cooling of the fragments, affecting the release of fission products.
A higher porosity of the fragments increases the heat transfer surface area within the core debris bed, enabling more effective cooling by the injected water.This, in turn,is closely related to the temperature, with lower fragment temperatures leading to reduced fission product release.Figure 10d illustrates a strong negative correlation.The PRCC calculation results, corrected for the effects of other parameters, exceed 0.8, further indicating a strong correlation between porosity and fission product release.Additionally,there is a weak negative correlation between the equivalent diameter of the PD in the core (EDPD-CORE) and the release of fission products, as shown in Fig.10e.In general,a smaller equivalent diameter of the PD allows for better contact with the surrounding water or steam, enabling more effective heat exchange and cooling, ultimately reducing fission product release.

Fig.9 (Color online) Sensitivity analysis of hydrogen production.a Importance of input parameters; b scatter plot of RT-ZrO2 and hydrogen production; c scatter plot of EDPD-CORE and hydrogen production; d scatter plot of MaxFR-Mat and hydrogen production
4.3.3 Important parameters for FOMs
Through uncertainty and sensitivity analysis of LBLOCA with severe accident mitigation measures in a 1000 MWe APWR, several parameters significantly impacting the target output have been identified and organized in Table 7.Notably, RT-ZrO2, MaxFR-Mat, EDPD-CORE, and POR-DB play more prominent roles among the selected 17 parameters.Importantly, these parameters are all user-defined empirical values.To minimize uncertainties in numerical simulations, further improvements are necessary in future research.
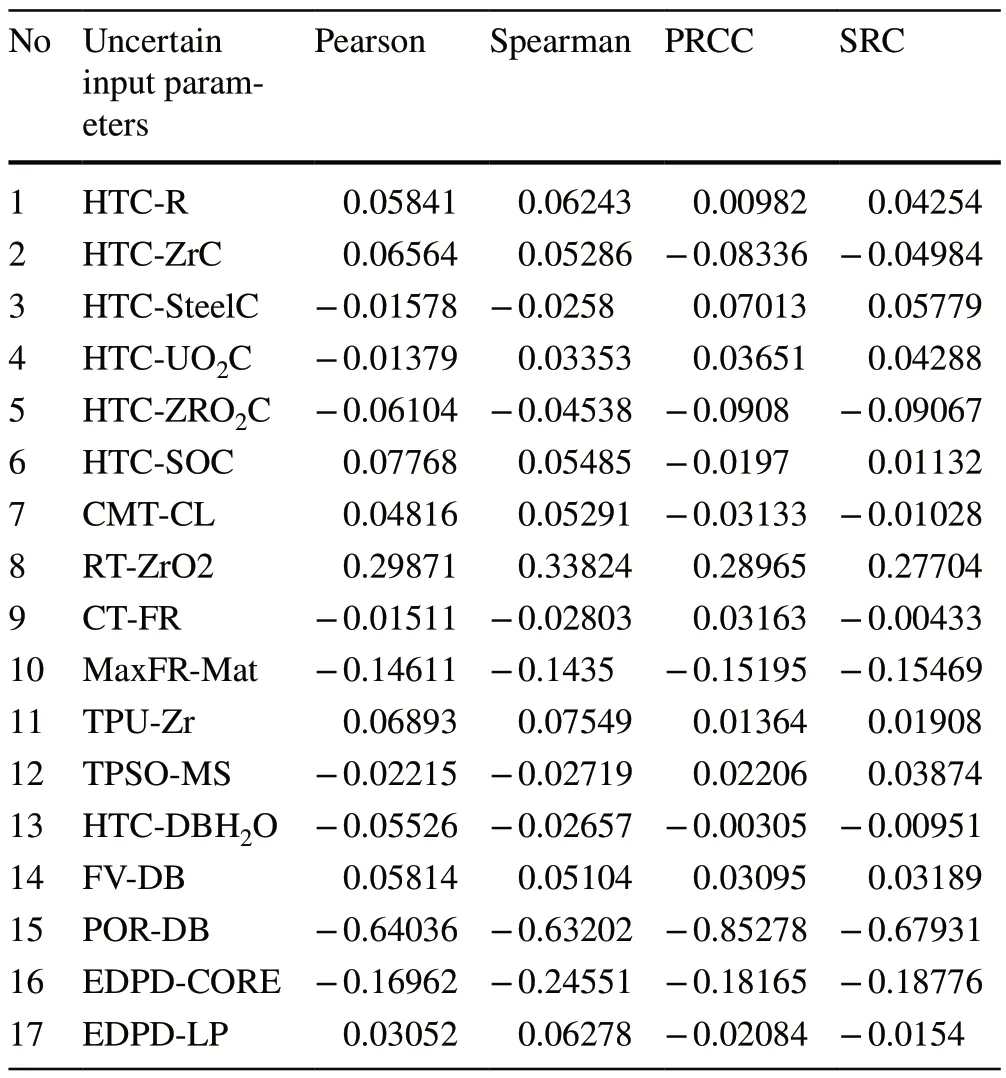
Table 6 Sensitivity analysis of FP release fraction

Fig.10 (Color online) Sensitivity analysis of FP release fraction.a Importance of input parameters; b scatter plot of RT-ZrO2 and release fraction; c scatter plot of MaxFR-Mat and release fraction; d scatter plot of POR-DB and release fraction; e scatter plot of EDPDCORE and release fraction

Table 7 Uncertain parameter screening and sorting
5 Summary and conclusion
This study used the Integrated Severe Accident Analysis code(ISAA) and the Sensitivity Analysis and Uncertainty Propagation (SAUP) program to conduct uncertainty and sensitivity analyses of in-vessel phenomena in an Advanced Pressurized Water Reactor (APWR) under severe accident mitigation strategies.Based on surveys and program development experience, 17 uncertain model parameters were selected.Using the Latin Hypercube Sampling (LHS) method and Wilks’sampling theory, the SAUP program, within ISAA, was used to perform uncertainty calculations.Uncertainty and sensitivity analyses were performed on hydrogen production and the release of fission products.The main conclusions obtained from the calculation analysis are as follows:
(1) In a Large-Break Loss of Coolant Accident (LBLOCA)with a double-ended cold leg break of a GEN-III PWR,the total in-vessel hydrogen and the release fraction of fission products are both normally distributed, with values ranging from 182.784 to 330.664 kg and from 15.6 to 84.3%, respectively.The calculation results indicate that the source term has a higher degree of uncertainty compared to hydrogen production.
(2) The hydrogen production-to-reactor thermal power ratios obtained from the reference case and uncertainty analysis are 0.0881 and 0.0578–0.105, respectively.These values are comparable to data obtained from numerical simulations of PWR LBLOCA by other researchers.
(3) In the uncertainty analysis, a nonparametric statistical method was used to evaluate the tolerance limits of Figures of Merit (FOMs).It was observed that convergence gradually occurred after applying the 3rd order Wilks’ method, and increasing the order had little effect on the results.
(4) Among the selected uncertainty parameters, the rupture temperature of the zirconia oxide layer (RT-ZrO2),maximum flow rate of the molten material after oxide layer rupture (MaxFR-Mat), equivalent diameter of the PD in the core region (EDPD-CORE), and porosity of debris (POR-DB) in the ISAA program were significantly correlated with the outputs of interest.The calculations revealed significant uncertainty in both hydrogen production and the release fractions of fission products.This uncertainty can be attributed to the complexity of the phenomena associated with severe accidents.Nevertheless,it also underscores the importance of future efforts aimed at refining and enhancing the numerical models within integrated analysis programs to mitigate this uncertainty.For instance,certain parameters examined in this study, such as RT-ZrO2,MaxFR-Mat, and POR-DB, have demonstrated substantial influence on the results.However, they are currently represented by basic empirical constants in the ISAA program.Presently, numerous severe accident analysis programs rely on similar empirical values.Therefore, in the future, it is imperative to leverage uncertainty and sensitivity analyses to effectively identify parameters with significant impact and subsequently develop relevant models to address these uncertainties.
Author contributionsAll authors contributed to the study conception and design.Material preparation, numerical modeling, computational analysis, and initial drafting were performed by HY.Numerical modeling and correction were completed by JSL.The literature research and data organization were conducted by ZRZ.Methodology, funding support, and article revisions were provided by BZ.Article review was conducted by JQS.And all authors commented on previous versions of the manuscript.All authors read and approved the final manuscript.
Data AvailabilityThe data that support the findings of this study are openly available in Science Data Bank at and https:// cstr.cn/ 31253.11.scien cedb.j00186.00346 and https:// www.doi.org/https:// doi.org/ 10.57760/ scien cedb.j00186.00346.
Declarations
Conflict of interestThe authors declare that they have no competing interests.
 Nuclear Science and Techniques2024年1期
- Nuclear Science and Techniques的其它文章
- Digital signal acquisition system for complex nuclear reaction experiments
- Millisecond dynamics of colloidal suspension studied by X‑ray photon correlation spectroscopy at the Shanghai Synchrotron Radiation Facility
- Generation and regulation of electromagnetic pulses generated by femtosecond lasers interacting with multitargets
- Infrared microspectroscopy beamline BL06B at SSRF
- A new liquid membrane diffusion model for characterizing the adsorption kinetics of europium by using a continuous measurement of adsorption platform
- Conceptual design of a 714‑MHz RFQ for compact proton injectors and development of a new tuning algorithm on its aluminium prototype