
Trial application of the envelope method to the potential ambiguity problem
2024-03-09 08:49LiYuanHuYuShouSong
Nuclear Science and Techniques 2024年1期
Li‑Yuan Hu · Yu‑Shou Song
Abstract The optical potential ambiguity is a long-standing problem in the analysis of elastic scattering data.For a specific colliding system, ambiguous potential families can lead to different behaviors in the nearside and farside scattering components.By contrast, the envelope method can decompose the experimental data into two components with negative and positive deflection angles, respectively.Hence, a question arises as to whether the comparison between the calculated nearside (or farside) component and the derived positive-deflection-angle (or negative-deflection-angle) component can help analyze the potential ambiguity problem.In this study, we conducted a trial application of the envelope method to the potential ambiguity problem.The envelope method was improved by including uncertainties in the experimental data.The colliding systems of 16O+28 Si at 215.2 MeV and 12C+12 C at 1016 MeV were considered in the analyses.For each colliding system, the angular distribution experimental data were described nearly equally well by two potential sets, one of which is “surface transparent” and the other is refractive.The calculated angular distributions were decomposed into nearside and farside scattering components.Using the improved envelope method, the experimental data were decomposed into the positive-deflection-angle and negative-deflection-angle components, which were then compared with the calculated nearside and farside components.The capability of the envelope method to analyze the potential ambiguities was also discussed.
Keywords Elastic scattering · Optical potential ambiguities · Envelope method · Nearside/farside decomposition
1 Introduction
Optical potential represents the interaction between two colliding nuclei and plays an important role in the analyses of nuclear reactions [1].The parameters of empirical optical potentials are typically obtained by fitting the experimental data of elastic scattering angular distributions (e.g., Refs.[2–5]).However, the ambiguity problem usually exists in the obtained potential parameters, which implies that the experimental data can be fitted equally well by using different sets of potential parameters [1].Potential ambiguities can be classified into several different types, including continuous, discrete, refractive or diffractive, and shallow- or deep-Wones, which have been investigated in many studies(e.g., Refs.[6–10]).Clearly, the ambiguity introduces problems in analyzing the reaction mechanisms [11–15].Therefore, proper treatment is required to resolve the ambiguity problem and obtain more physical optical potentials.One approach is to use global energy-dependent optical potentials(such as those in Refs.[16–26]) to constrain the potential parameters.In addition, for the elastic scattering of two light heavy-ion systems, it was found that the refractive farside scattering data can help eliminate the discrete and shallowor deep-Wambiguities [1].
In Ref.[10], Hussein and McVoy highlighted that at energies well above the Coulomb barrier, the nearside and farside scattering components exhibit different behaviors for the refractive and diffractive optical potentials.For the refractive potential, the nearside scattering component shows a larger slope than the farside component (when using ln(dσ∕dθ) as the vertical coordinate).Consequently, the two components can construct the localized Fraunhofer crossover point, and a deep minimum appears near the corresponding scattering angle in the total differential cross sections.However, for the diffractive potential, the nearside and farside components are nearly parallel.In this case, rather than the localized Fraunhofer crossover point, a much wider Fraunhofer oscillation structure exists.The authors of Ref.[10] have taken the elastic scattering of16O+28Si at 215.2 MeV as an example to show the differences between the nearside/farside decompositions calculated with the refractive potential and the diffractive one.For this colliding system, both the refractive deep-Vpotential called “A-type” potential and the diffractive shallow-Vpotential called “E18” potential (which is also known as “surface transparent”) can effectively reproduce the existing experimental data of the angular distribution [9].However, the nearside and farside scattering components calculated using the two types of optical potentials exhibit different behaviors.For the nearside components, the difference in slopes is significantly small at angles smaller than those at which the nearside and farside components are close to each other.However, at larger angles, the nearside component calculated with the “E18” potential shows a relatively smaller slope than the one calculated with the“A-type” potential.For the farside scattering, different from the nearside case, the calculated cross sections with the“A-type” potential show a smaller slope than that calculated with the “E18” potential in the whole angular range.These results indicate that a comparison between the nearside and/or farside components can be used to demonstrate the differences between the ambiguous potential families.
In Ref.[27], da Silveira and Leclercq-Willain proposed an envelope method to decompose the experimental data of the elastic scattering angular distribution into two scattering components with negative and positive deflection angles,respectively.In this method, two envelopes were drawn for the experimental data with the well-defined maxima and minima in the data.Moreover, “experimental” data points corresponding to the negative- and positive-deflection-angle components can be derived.In Ref.[27], this method was applied to the elastic scattering data ofα+40Ca at 104 MeV andα+58Ni at 140 MeV without considering the uncertainties introduced by the experimental data.In addition, this method has been extended to investigate the refractive phase relationship between elastic and inelastic scattering and the decomposition of the farside scattering angular distribution [28, 29].In Ref.[30], the experimental dataset ofα+40Ca at 104 MeV was further analyzed using the envelope method.The obtained differential cross-section data of the positive- and negativedeflection-angle components agree well with the nearside and farside scattering components, respectively.Combined with the behaviors of nearside and farside scattering mentioned above, our observations inspired us to consider the envelope method as a potential solution to address the ambiguity problem.This could be achieved by comparing the “experimental”positive- and negative-deflection-angle components with the theoretical nearside and farside components, respectively.
In this study, a trial application of the envelope method to the potential ambiguity problem was performed.The experimental data of the elastic scattering angular distributions of16O+28Si at 215.2 MeV and12C+12C at 1016 MeV were selected, and the optical potential ambiguity between the“surface transparent” and refractive potentials were studied.Optical model calculations and corresponding nearside/farside decompositions were performed for each dataset.Using the envelope method, the experimental data points within the angular range covered by the well-defined maxima and minima were decomposed into positive- and negative-deflectionangle cross-section components.To estimate the uncertainties of the two components, the errors of the experimental data points used in the construction of the envelopes were considered.The capability of the envelope method to analyze the potential ambiguity problem was discussed by comparing the obtained positive/negative-deflection-angle cross-section components with the calculated results of the nearside/farside decompositions.
2 Method
The optical model, the nearside/farside decomposition and the envelope methods were utilized to analyze the experimental data.In this section, the latter two methods are briefly outlined;more details can be found in Ref.[27, 30–33].
In the envelope method, the starting point is a partial-wave expansion of the scattering amplitude [27].Using the asymptotic expression of the Legendre polynomials, the scattering amplitude can be decomposed into the components corresponding to the positive and negative deflection angles, which are denoted byf+(θ) andf−(θ) , respectively.

whereδlis the nuclear plus the Coulomb phase shift.The cross sections corresponding to the positive and negative deflection angles are denoted asσ+(θ) andσ−(θ) , respectively, which are related to the scattering amplitudes as follows:
It should be noted that the signs (“+ ” and “−”) used as subscript are similar to those used in Ref.[30] but in contrast to those used in Ref.[27].The elastic scattering angular distributionσ(θ)=|f(θ)|2oscillates between the upper envelopeEuand lower envelopeEldefined by
According to Eqs.(4) and (5), the positive- and negativedeflection-angle scattering cross sections can be obtained using two envelopes of the experimental elastic scattering angular distribution.The upper and lower envelopes are determined by the maxima and minima of the angular distribution, respectively.The envelopes can be drawn if the maxima and minima are well-defined in the experimental angular distribution.In the present study, the upper and lower envelopes were drawn by connecting these maxima and minima with broken lines, respectively.The broken lines were then smoothed using the TGraph class provided by the ROOT software [34].
Observing Eqs.(4) and (5), one can find thatσ+(θ) andσ−(θ) follow the same relationship.Additional analysis is required to determine whether the solution obtained isσ+(θ)orσ−(θ).This problem can be resolved by observing the trends of the ratio ofσ+(θ) to the Rutherford scattering differential cross sectionσR(θ) becauseσ+(θ)∕σR(θ) tends to unity asθapproaches zero and decreases almost exponentially asθbecomes larger [27, 30].
In previous studies based on the envelope method, uncertainties in the experimental data have not been considered quantitatively.For each maxima/minima data point, the mean value (μ) was used to determine the envelope.In the present work, in the construction of the envelopes, the standard deviation (dev) of each maxima/minima data point was also considered.In addition toμ, the envelopes were drawn forμ+dev andμ−dev to estimate their uncertainties.Hence,there were three upper and three lower envelopes.The mean values ofσ±(θ) were obtained by combining the upper and lowerμenvelopes.The other combinations of upper and lower envelopes were used to limitσ+(θ) andσ−(θ).Using this approach, the uncertainties can be propagated to the calculatedσ±(θ) , which makes the envelope method more quantitative.
The nearside/farside decomposition of the scattering amplitude was performed using the method proposed by Fuller [31].The scattering amplitude can be expressed as

wherePl(cosθ) andQl(cosθ) are the Legendre functions of the first and second kinds of degreel, respectively.The differential cross sections corresponding to the nearside and farside scattering amplitudes are denoted asσnandσf,respectively:

In the present work, the comparisons between “experimental”σ±(θ) and the theoreticalσn/f(θ) were performed to test the capability of the envelope method in treating the potential ambiguity problems.The optical model calculations were performed using FRESCO [35].The nearside/farside decomposition was conducted according to the method described in Ref.[32].
3 Results and discussion
Experimental data for the elastic scattering angular distributions of16O+28Si at 215.2 MeV (Ref.[36]) and12C+12C at 1016 MeV (Ref.[37]) were analyzed using the optical model, the nearside/farside decomposition, and the envelope method, respectively.
Experimental data for16O+28Si at 215.2 MeV were obtained by digitizing the data points shown in “Fig.6” in Ref.[38].The digitizing software used in this study was GSYS (version 2.4.9) [39].The experimental data for12C+12C at 1016 MeV were obtained from the NRV database[40].
The optical potential parameters used in the optical model and the nearside/farside decomposition calculations are listed in Table 1.For both the systems, the “standard”Woods-Saxon function was adopted for the nuclear optical potentials:
whereV0andW0are the depths of the real (R) and imaginary(I) parts, respectively.Riandai(i= R, I) are the radius and diffuseness parameters, respectively.The reduced radiusri(i=R, I) is defined as
whereATandAPare the atomic masses of the target and projectile, respectively.For the Coulomb potential, the potential between a point charge and a uniformly charged sphere was utilized.The optical potential parameters for16O+28Si and12C+12C were obtained from Ref.[9] and Ref.[11], respectively.
3.1 16O+28 Si at 215.2 MeV
First, we revisited the refractive or diffractive potential ambiguity problem of16O+28Si at 215.2 MeV, as discussed in Ref.[9, 10].In fact, the potential sets A1 and A2 are simply the diffractive shallow-V“E18” and refractive deep-V“A-type” ones, respectively [9].The A1 potential is also a “surface transparent” potential, whose characteristic is a larger value ofRRthan that ofRI.Its real part is deeper than the imaginary part forr >RR[10].The results of the optical model and nearside/farside decomposition calculations are shown in Fig.1.It can be seen that both the potential sets A1 and A2 can effectively reproduce the experimental data,although the theoretical angular distributions show quite different patterns at angles beyond approximately 35◦where no data exist.As reported in Ref.[10], within the angular range covered by the experimental data, although the nearside components corresponding to A1 and A2 potentials are significantly close to each other, the farside components are evidently different.

Fig.1 (Color online) Elastic scattering angular distribution of 16 O+28 Si at 215.2 MeV.The circles represent the experimental data.The curves are the results of the optical model and nearside/farside decomposition calculations with different potentials
The upper and lower envelopes of the experimental data are presented in Fig.2a.For each envelope, the uncertainties are represented by the region delimited by dotted lines.The positive- and the negative-deflection-angle components,σ+(θ) andσ−(θ) , are derived by using the envelopes and are shown in Fig.2b.The envelope uncertainties are propagated toσ±(θ).The uncertainties inσ±(θ) are also represented by the regions delimited by dotted lines.For comparison, the nearside and farside angular distributions,σn(θ) andσf(θ) ,are also plotted.It can be observed thatσ+(θ) matchesσn(θ)well with small uncertainties.Moreover,σ−(θ) is close to the magnitude ofσf(θ).As the calculatedσn(θ) with potentials A1 and A2 are significantly close to each other, it is not feasible to determine which is closer to the derivedσ+(θ).The calculatedσf(θ) with potentials A1 and A2 are evidently different.However, the relatively small values (less than 10−3)ofσ−(θ) probably make its apparent structure meaningless[28].In addition, the relative error ofσ−(θ) is significantly larger than that ofσ+(θ) , which is consistent with the results calculated in Ref.[30], in which the author found that slightadjustments of envelopes visibly affect the smaller ones ofσ+(θ) andσ−(θ) but have little effect on the larger one.These difficulties render it impractical to determine whetherσf(θ)is closer toσ−(θ).Hence, the envelope method is unsuitable for resolving the refractive or diffractive potential ambiguity problem of16O+28Si at 215.2 MeV.
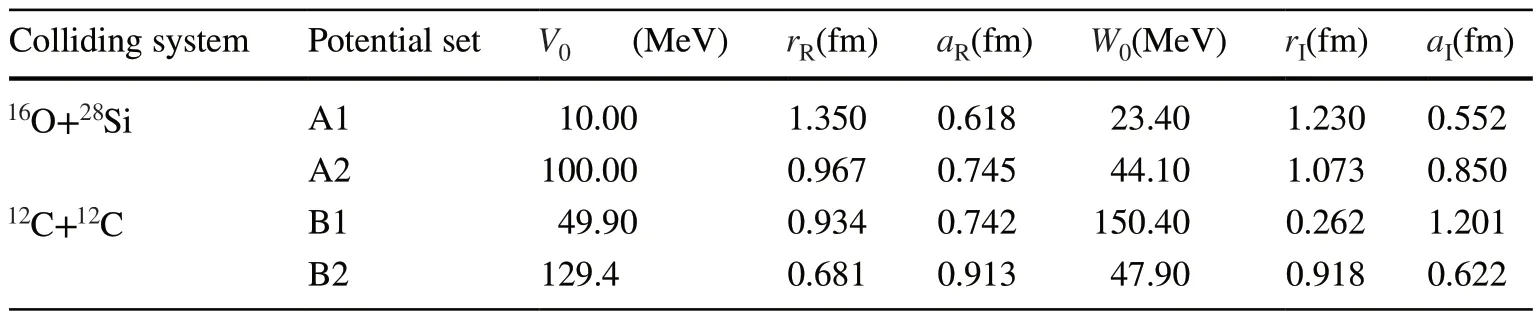
Table 1 The nuclear optical potential parameters used in the optical model and nearside/farside decomposition calculations
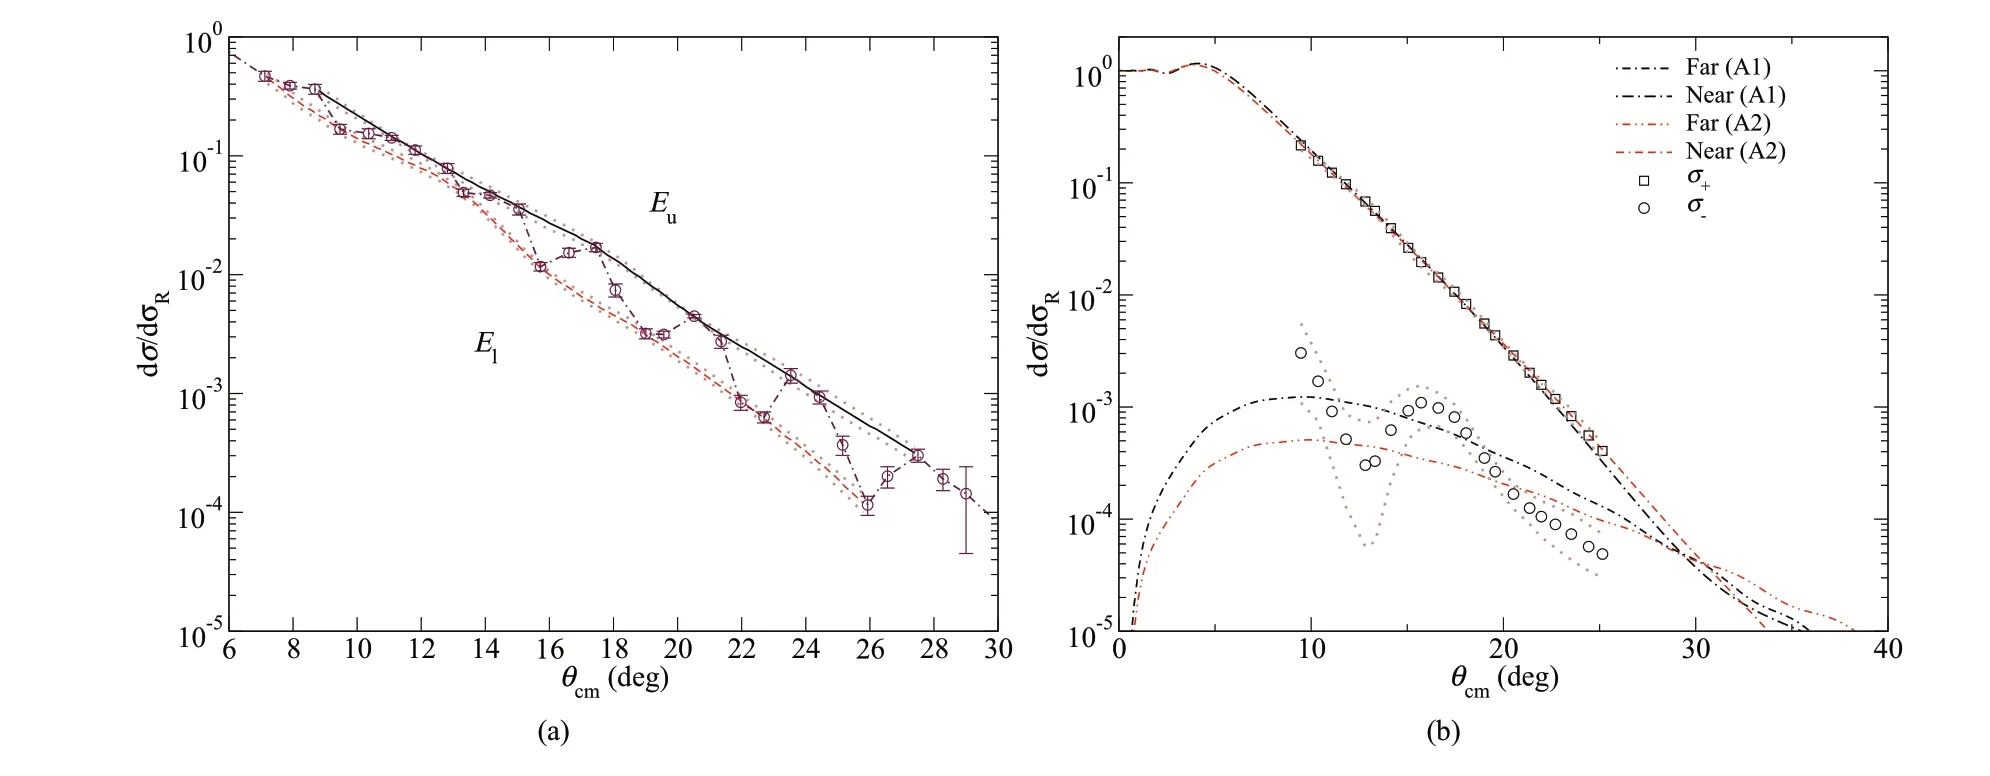
Fig.2 (Color online) Elastic scattering of 16O+28 Si at 215.2 MeV: a envelopes of the experimental data; b the derived positive/negative-deflection-angle components in comparison with the theoretical nearside/farside components
3.2 12C+12 C at 1016 MeV
For the elastic scattering of12C+12C at 1016 MeV, the calculated total, nearside and farside angular distributions with the B1 and B2 potentials are plotted in Fig.3 in comparison with the experimental data.For the B1 potential, although the depth of the real part is smaller than that of the imaginary part, it is not a diffractive potential because it produces a Fraunhofer crossover [10].Similar to the A1 potential, the B1 potential is a “surface transparent” one withRR>RI.The strength of the real part is greater than that of the imaginary part forr≥2 fm, and there is a strongly absorbing core at small radii [11].The B2 potential is a refractive deep-Vpotential, similar to the A2 potential.In these calculations,following the procedure described in Ref.[11], the relativistic effects were considered by using an effective center-ofmass energy of 496.84 MeV and an effective mass of 12.27 u for12C.Observing Fig.3, both the B1 and B2 potentials effectively reproduce the experimental data.The farside componentsσf(θ) are significantly close to each other in the angular range of the experimental data.However, the nearside componentsσn(θ) exhibit an evident difference in slope after approximately 5◦in the center-of-mass system,in whichσn(θ) corresponding to the B1 potential becomes smaller than that corresponding to B2.

Fig.3 (Color online) Elastic scattering of 12C+12 C at 1016 MeV.The circles represent the experimental data.The curves are the results of the optical model and nearside/farside decomposition calculations with different potentials
The upper and lower envelopes are drawn for the experimental data in Fig.4a, and the corresponding derivedσ±(θ)are drawn in Fig.4b in comparison withσn/f(θ).As in the case of16O+28Si, the envelope uncertainties are also considered and propagated intoσ±(θ).It can be observed thatσ−(θ) matchesσf(θ) , andσ+(θ) is close toσn(θ) for both B1 and B2 potentials.In this case, because the farside scattering componentsσf(θ) corresponding to the two potential sets are close to each other, it is not feasible to determine which one is closer to the derivedσ−(θ).However, the evident difference between the calculatedσn(θ) with the two potential sets enables the selection of the physical potential.As for the obtainedσ+(θ) , its magnitude is larger than 10−3at almost all the scattering angles covered by the envelopes.In addition, the relative error increases as the scattering angle increases.Clearly,σ+(θ) matches better with the B2 nearside component than with the B1 component.This reveals that the B2 potential is more physical, which is consistent with the results of the combined analyses of elastic scattering and the transfer reaction of12C+12C at 1016 MeV in Ref.[11].

Fig.4 (Color online) Elastic scattering of 12C+12 C at 1016 MeV: a envelopes of the experimental data; b the derived positive/negative-deflection-angle components in comparison with the theoretical nearside/farside components
3.3 Factors influencing the application of the envelope method
The calculated results for12C+12C at 1016 MeV preliminarily indicate the possibility of using the envelope method to address the potential ambiguity problem.Several factors influencing the application of the envelope method to potential ambiguity problems were identified.
The primary factor is the difference between the calculatedσn/f(θ) corresponding to different potential families.If they show evident differences inσn(θ) and/orσf(θ) , there is a possibility of selecting a physical potential.However, when the calculatedσn/f(θ) values are nearly identical for different potential families, applying this method is not feasible.
The second factor is the magnitude of the smaller part ofσ±(θ).When the calculatedσn/f(θ) exhibits evident differences from the smaller values, as in the cases of16O+28Si at 251.2 MeV and12C+12C at 1016 MeV, the magnitudes should not be significantly small.The present calculations show that when the magnitudes are smaller than approximately 10−3, a comparison between the smaller parts ofσ±(θ)andσn/f(θ) can provide limited information.In this case,although the derivedσ±(θ) matches the calculatedσn/f(θ)well on the order of magnitude, the details of the structure become meaningless.This phenomenon was observed in the positive-/negative-deflection-angle decomposition of the inelastic scattering angular distributions using the envelope method in Ref.[28].
Furthermore, the data quality also influences the application of the envelope method.The plot of the envelopes requires well-defined maxima and minima; in other words,it requires good angular resolution.The errors of the differential cross sections should be small as they are propagated to the derivedσ±(θ).
Apart from the factors encountered and mentioned above,it should be noted that the Fraunhofer crossover can also influence the application.In fact, at the Fraunhofer crossover angle, the values ofσ+(θ) andσ−(θ) should equal with each other in principle, which implies that the value of the lower envelope should be zero (cf.Eq.5).However, the lower envelope does not have zero points.Therefore, as indicated in Ref.[30], the data near the Fraunhofer crossover are unsuitable for use in the envelope method.
4 Summary
In this study, a trial application of the envelope method to the optical potential ambiguity problem is presented.The colliding systems of16O+28Si at 215.2 MeV and12C+12C at 1016 MeV were used as examples in the application.Based on the envelope method, the experimental data of the elastic scattering angular distributions were decomposed into positive- and negative-deflection-angle components (denoted asσ+(θ) andσ−(θ) , respectively).Although the original version of the envelope method does not quantitatively consider uncertainties, the present work propagates the uncertainties of the experimental data points that determine the envelopes into the derivedσ±(θ).For each colliding system, the optical model and the nearside/farside decomposition calculations are performed with two potential sets, of which one is “surface transparent” and another is refractive.For each potential set, the corresponding nearside and farside scattering components (denoted asσn(θ) andσf(θ) , respectively) were compared with the derivedσ+(θ) andσ−(θ) , respectively.
For16O+28Si at 215.2 MeV, the envelope method provides good estimations ofσn/f(θ) on the order of magnitude.The nearside componentsσn(θ) corresponding to two potential sets are nearly identical in the angular region of the envelopes.Therefore, although the derivedσ+(θ)matches them well, it is not feasible to select a physical potential by comparingσ+(θ) withσn(θ).By contrast, the farside componentsσf(θ) corresponding to two potential sets exhibit evident differences in the angular region of the envelopes.However, the derivedσ−(θ) has small magnitudes with large uncertainties, making its structure meaningless.It is impractical to select the physical potential by comparingσ−(θ) withσf(θ) quantitatively.
For12C+12C at 1016 MeV, the derivedσ+(θ) andσ−(θ)match the calculatedσn(θ) andσf(θ) well, respectively.In this case, the farside componentsσf(θ) corresponding to two potential sets are significantly close to each other in the angular region of the envelopes.Although the derivedσ−(θ) matches well withσf(θ) , it is not feasible to select the physical potential by comparingσ−(θ) withσf(θ).Forσn(θ) ,the two potential sets yield significantly different results.The calculatedσn(θ) corresponding to the “surface transparent” potential B1 shows an evident smaller values after 5◦in comparison with that corresponding to the refractive potential B2.The derivedσ+(θ) clearly matches much better withσn(θ) corresponding to B2.Hence, the refractive potential B2 was selected as the physical potential, which was consistent with the results given in Ref.[11].
Several factors that influence the application of the envelope method to the potential ambiguity problem were identified.We believe that one can try to use the envelope method to analyze the potential ambiguity problem when the following conditions are met: (1) the calculatedσn/f(θ) of potential families exhibit evident differences; (2)the smaller part ofσ±(θ) is not too small (e.g.larger than 10−3); (3) the experimental data have good angular resolutions and small errors of differential cross sections; (4) the main part of the envelopes is not close to the Fraunhofer crossover point.The envelope method has shown potential for analyzing the potential ambiguity problem.Further applications of the envelope method to the potential ambiguity problem are required to verify the method.
Author ContributionsAll authors contributed to the study conception and design.Material preparation, data collection and analysis were performed by L-YH and Y-SS.The first draft of the manuscript was written by L-YH, and all authors commented on previous versions of the manuscript.All authors read and approved the final manuscript.
Data availabilityThe data that support the findings of this study are openly available in Science Data Bank at https:// cstr.cn/ 31253.11.scien cedb.j00186.00355 and https:// doi.org/ 10.57760/ scien cedb.j00186.00355.
Declarations
Conflict of interestThe authors declare that they have no competing interests.
 Nuclear Science and Techniques2024年1期
- Nuclear Science and Techniques的其它文章
- Digital signal acquisition system for complex nuclear reaction experiments
- Uncertainty and sensitivity analysis of in‑vessel phenomena under severe accident mitigation strategy based on ISAA‑SAUP program
- Generation and regulation of electromagnetic pulses generated by femtosecond lasers interacting with multitargets
- Infrared microspectroscopy beamline BL06B at SSRF
- A new liquid membrane diffusion model for characterizing the adsorption kinetics of europium by using a continuous measurement of adsorption platform
- Conceptual design of a 714‑MHz RFQ for compact proton injectors and development of a new tuning algorithm on its aluminium prototype