
Numerical simulations for radon migration and exhalation behavior during measuring radon exhalation rate with closed‑loop method
2024-03-09 08:49MingXiaYongJunYeShuYuanLiu
Nuclear Science and Techniques 2024年1期
Ming Xia · Yong‑Jun Ye,2 · Shu‑Yuan Liu
Abstract Accurate measurements of the radon exhalation rate help identify and evaluate radon risk regions in the environment.Among these measurement methods, the closed-loop method is frequently used.However, traditional experiments are insufficient or cannot analyze the radon migration and exhalation patterns at the gas–solid interface in the accumulation chamber.The CFDbased technique was applied to predict the radon concentration distribution in a limited space, allowing radon accumulation and exhalation inside the chamber intuitively and visually.In this study, three radon exhalation rates were defined, and two structural ventilation tubes were designed for the chamber.The consistency of the simulated results with the variation in the radon exhalation rate in a previous experiment or analytical solution was verified.The effects of the vent tube structure and flow rate on the radon uniformity in the chamber; permeability, insertion depth, and flow rate on the radon exhalation rate and the effective diffusion coefficient on back-diffusion were investigated.Based on the results, increasing the insertion depth from 1 to 5 cm decreased the effective decay constant by 19.55%, whereas the curve-fitted radon exhalation rate decreased (lower than the initial value) as the deviation from the initial value increased by approximately 7%.Increasing the effective diffusion coefficient from 2.77 × 10⁻⁷ to 7.77 × 10⁻⁶ m2 s−1 made the deviation expand from 2.14 to 15.96%.The conclusion is that an increased insertion depth helps reduce leakage in the chamber, subject to notable back-diffusion,and that the closed-loop method is reasonably used for porous media with a low effective diffusion coefficient in view of the back-diffusion effect.The CFD-based simulation is expected to provide guidance for the optimization of the radon exhalation rate measurement method and, thus, the accurate measurement of the radon exhalation rate.
Keywords Radon exhalation · Numerical simulation · Accumulation chamber
1 Introduction
Radon, a colorless and odorless naturally radioactive gas, is the second leading cause of lung cancer [1, 2].Widely found in building materials, soil, rocks, and uranium mill tailings[3–5], concerns have been raised regarding radon released from these media into the ambient air.An accurate radon exhalation rate can be used in environmental assessments to quantify and identify radon-risk areas [6].
Currently, radon exhalation has been studied [7–12],and the methods commonly used for radon exhalation rate measurement include activated carbon [13, 14], open loop[15, 16], and closed loop [17–19].For a closed-loop system, the effects of leakage from the accumulation chamber,back-diffusion at the gas–solid interface, and sampling flow rate during radon exhalation rate measurement are nonnegligible [18, 20].The increased insertion depth proved to be effective in reducing chamber leakage [21], while ignoring the back-diffusion effect.The back-diffusion phenomenon is caused by the radon returning to the porous medium as the radon level increases in the accumulation chamber [22].This affects radon exhalation on the surface of the medium,as well as the measurement of the radon exhalation rate[23–27].Moreover, convection (or advection) driven by the pressure gradient is an important factor influencing radon exhalation [28–32].Conventionally, radon exhalation rate measurements for porous media with unknown physical parameters do not show a discrepancy between the measured and initial values.The limitations of experimental tests, such as the control of environmental factors and experimental parameters, make it difficult or time-consuming to perform the experiments.Although the analytical solutions of 1D and 2D models can reflect radon migration patterns in steady or transient states, they are subject to various assumptions such as ignoring the insertion depth, lateral diffusion, specific dimensions of the accumulation chamber, or porous media,and constant uniform concentration distribution inside the chamber [33].
Diffusion driven by the concentration gradient and convection driven by the pressure gradient are responsible for radon migration in porous media.However, the traditional measurement method cannot provide details of radon migration in the chamber and gas flow in the porous medium.These are the key data for analyzing the underlying reasons for the deviation of the measured radon exhalation rate from the true value.The advancement of computational fluid dynamics (CFD) has made it possible to numerically solve the Navier–Stokes equations and has been maturely applied to scenarios such as soil, atmosphere, indoor environments,underground space pollutant migration, and nuclear reactor system [34–38], providing researchers with solutions to complex scientific problems.Relevant simulations have been performed in previous studies to predict the radon concentration distribution and migration in a limited space [39, 40],indicating good consistency between the experimental and simulation results.In addition, a two-phase flow and heat transfer simulation with a simplified porous media model was established for engineering purposes, and the results showed good agreement with the experimental data [41].Therefore, the CFD-based 3D numerical simulation exhibited spatial and temporal radon migrations in the accumulation chamber and porous media and revealed the variation in radon exhalation at the gas–solid interface during the measurement.
In this study, two types of vent tube structures (openended and half-open) in the accumulation chamber were modeled, and three radon exhalation rates (initial, transient,and fitted radon exhalation rate) were defined to quantify the radon exhalation behavior.Using uranium mill tailings as the research object, a geometric model of a radon exhalation rate-measuring device and a mathematical model for radon migration were established.The CFD-based technique was employed to demonstrate the radon migration patterns under the coupling of multiple factors (flow rate, insertion depth,diffusion coefficient, and permeability) and thus analyze the variations of the fitted and transient radon exhalation rates at the gas–solid interface.The simulated results are consistent with previous experimental phenomena and are expected to optimize the design of an accurate measurement of the radon exhalation rate using the closed-loop method.
2 Materials and methods
2.1 Theory of radon diffusion and exhalation in porous media
One-dimensional steady-state diffusive migration of radon in a porous medium can be described using the following equation:


Fig.1 One-dimensional model of radon diffusion in porous medium

Fig.2 Connection diagram of the system
The radon exhalation rate for diffusion is then theoretically deduced:
whereEa−dis diffusive radon exhalation rate, Bq m−2s−1.
2.2 The closed‑loop method and device for radon exhalation rate measurement
The closed-loop method is commonly used in the measurement of radon exhalation rate, which involves the accumulation of radon in the chamber (Fig.2).Radon exhaled from the surface of the porous medium flowed into a radon detector (e.g., RAD7 from Durridge Company Inc., USA)driven by an air pump and returned to the chamber through the flow-in vent tube.
Inside the accumulation chamber, the accumulation of radon is described as:

The linear fitting solution for Eq.(4) is [6]

3 Methods of numerical simulations
3.1 Measuring device and geometric model
The three-dimensional geometry (Fig.3) for the model of the accumulation chamber (AC) had internal dimensions of 30 cm × 30 cm × 10 cm with a thickness of 4 mm, inserted into uranium mill tailings (a height of 50 cm filled in a container of 100 cm × 100 cm × 60 cm).Two vent tubes (Ø6 mm) were designed on the diagonal of the chamber, with 3 cm from each hole to the inner wall of the chamber.Besides the AC model, a reference (R) model, a container dimension of 100 cm × 100 cm × 60 cm, was established to determine the reference radon exhalation rate by the closed-loop method for uranium mill tailings (a height of 50 cm) filled in the container being sealed but with two holes (Ø6 mm,50 cm apart) on the top cover.

Fig.3 (Color online) Three-dimensional geometric model of the accumulation chamber from a top, b lateral, and c overall views.(Color figure online)
Considering the disturbance of the porous medium caused by the jet from the inlet vent tube, two vent tube schemes(open-ended and half-open) were designed.The first type is a vent tube with an open end.The other was sealed at the bottom end of the vent tube with four holes (Ø2 mm, 2 cm apart, and a normal direction of 90° of two adjacent holes)open on the tube wall to avoid the direct impact of the jet from the vent tube on the porous medium.
The chamber had a thickness of 4 mm, and its volume was subtracted from that of the porous medium upon insertion.
The geometry was discretized into polyhedral and hexahedral elements using Fluent Meshing to reduce memory and computing time.The mesh was refined in the region(e.g., the gas–solid interface and local opening of the vent tube) where rapid changes in the radon concentration and air flow were expected, as shown in Fig.4.
3.2 Governing equations

Fig.4 a Discrete mesh from overall view.b The sectional plane of discrete mesh where vent tubes are included
The gas flow, which is regarded as incompressible, in the chamber and porous medium followed the laws of conservation of mass and momentum.Following the law of conservation of mass, the mass conservation equation is described by [43]

whereDis the radon diffusion coefficient (m2s−1);vicorresponds to the physical velocity of convection in thex,y, andzdirections (m s−1);SRnis the source term (Bq m−3s−1);Picorresponds to the pressure in thex,y, andzdirections (Pa).

3.3 Parameters for simulation
The simulated scenarios involved reference (R) and accumulation chamber (AC) models.In the AC model,the effects of the vent tube structure and permeability of the porous medium on radon exhalation were analyzed.Furthermore, the effects of insertion depth (H1/H3/H5 corresponding to insertion depths of 1/3/5 cm), flow rate(0.5/1/2 L min−1), and effective diffusion coefficient (D1/D2/D3/D4 corresponding to 2.77 × 10⁻⁷/7.77 × 10–7/2.7 7 × 10⁻⁶/7.77 × 10–6m2s−1) were also tested.The effective diffusion coefficient of radon in a porous medium is defined as [42]
whereτis the tortuosity factor, 0.66 (dimensionless) [42,47].
In the R model, the radon exhalation rate obtained from the reference container is used to evaluate the rate measured using the AC model.The design of the R model helps improve the reliability of the simulation, considering that the reference radon exhalation rate is commonly used in laboratory tests to evaluate the radon exhalation rate obtained from the AC model.
The free radon production rate (α) is defined by [42]
whereρsis the density of the porous medium, kg m−3;ARais the activity concentration of radium, Bq kg−1; andERnis the radon emanation coefficient, dimensionless.
Radium activity concentration of uranium mill tailings commonly ranges from less than 5 kBq kg−1to as high as 10 kBq kg−1[48], with the emanation coefficient ranging from 0.1 to 0.35 [42], dry-bulk density of 1800 kg m−3,and averaged porosity of 0.4 measured using the drainage method for samples in the laboratory.
Laminar flow in a porous medium follows Darcy’s law, and permeability, which is an intrinsic property of a porous medium, is defined by the Kozeny–Carman empirical equation [49]
whereDpis the average grain size (mm) andKis the permeability, m2.
After sieving the tailings sand in the laboratory,Dpwas determined to be 0.5 mm andKwas calculated to be 2.47 × 10⁻¹⁰m2.The physical parameters for the simulations were determined, as listed in Table 1.
The finite volume method (FVM) was adopted for numerical calculations.Thek–εturbulence model was setfor the chamber zone due to confined jet from the four openings on the surface of vent tube, whereas the flow in the porous media was laminar model.The empirical constants in thek–εturbulence model equations [45] are as follows:Cμ= 0.09,C1ε= 1.44,C2ε= 1.92,σk= 1.00, andσε= 1.30.

Table 1 Physical parameters used in the simulation
To simplify the model, the following assumptions were made: the leakage of the container was not considered,and the porous medium was homogeneous, with air as an incompressible gas, ignoring the impact of gravity and temperature.
3.4 Initial value and boundary settings
The radon concentration distribution of the porous medium in the steady state was calculated before simulating the radon accumulation in the measurement, in which the radon concentration in the air was set to 0 Bq m-3.Transient mode was adopted upon the measurement, with initial radon concentration at 0 s in the chamber set at 0 Bq m-3.The detailed boundary settings are listed in Table 2.
3.5 Mesh independence
The three-dimensional geometric model was discretized in coarse, medium, and refine (0.5 M, 1.2 M, and 2.3 M cells,respectively) mesh and the radon exhalation rate for each mesh was further calculated as 1.4676593, 1.4674347,and 1.4674092 Bq m−2s−1, respectively, shown in Fig.5.The decline in the radon exhalation rate slowed with an increase in the sum of cells.The criterion for discretizing the mesh is to minimize the error between the numerical and analytical results while maintaining the calculation at a lower cost.Thus, a medium mesh was used in subsequent simulations.
The calculation is considered converged with the residual less than 10–10and the differential value of radon exhalation rate of two consecutive iterations less than 10–7.
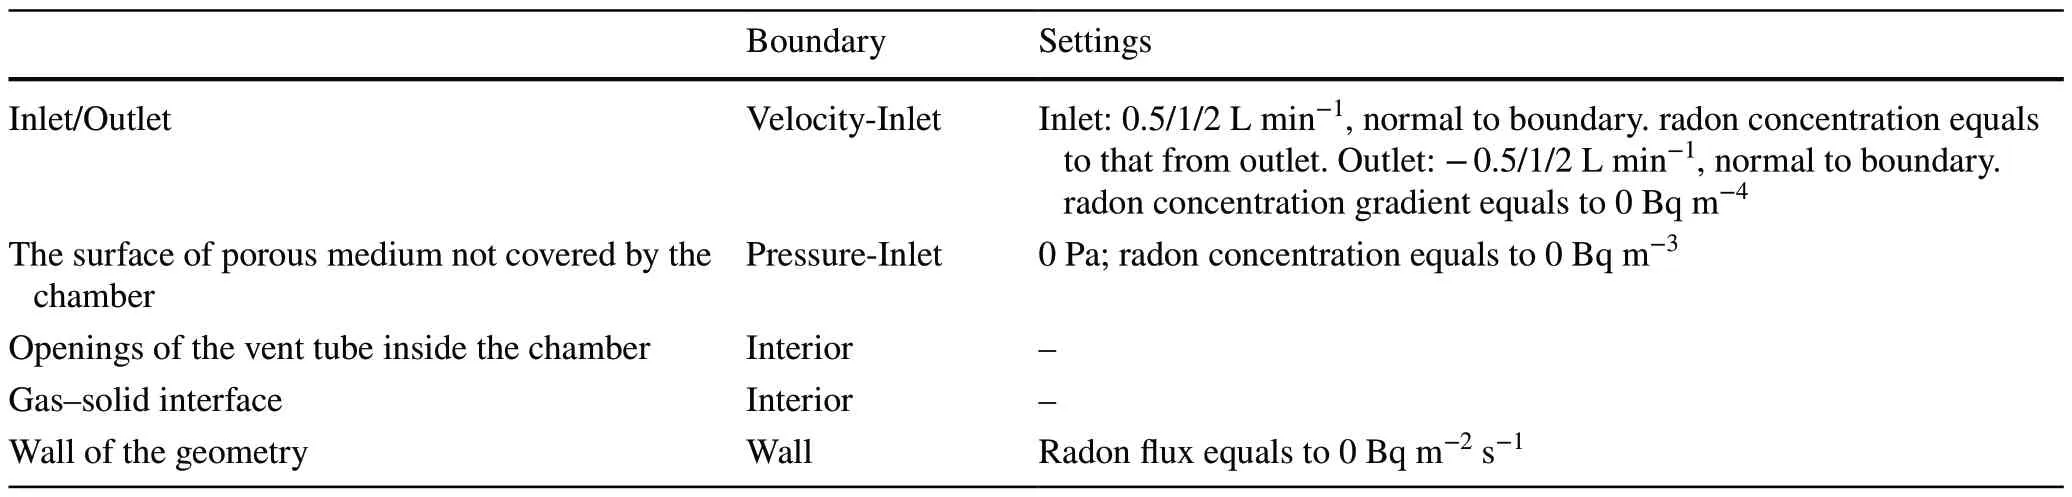
Table 2 Boundary settings in the simulation

Fig.5 Mesh sensibility analysis
4 Data processing
As the FVM method was adopted in the numerical calculation, the volume-averaged radon concentration (Cv−avg)in the chamber was obtained using discrete data in the approximation, as follows:
wherenis the total number of cells inside the chamber,Viis the volume with a cell indexi, m3, andCicorresponds to the radon concentration in cellVi.
The area-averaged radon concentration (Cs−avg) at the outlet is given by:
wheremis the total number of faces on the surface of the outlet andSticorresponds to the area with face indexi, m2.
In the numerical simulation, the transient radon exhalation rate for diffusion was calculated as follows:
The initial radon exhalation rate, corresponding to the radon exhalation rate of the surface of porous medium in the natural state, is the value intent to be measured experimentally.In the numerical simulation of the homogeneous porous medium, the initial radon exhalation rate was equivalent to the value calculated using Eq.(3).
The nonuniformity of the radon concentration distribution in the chamber is defined as [39]
whereCv−maxis the maximum radon concentration in the chamber, Bq m−3, andCv−minis the minimum radon concentration in the chamber, Bq m−3.
A lower NUI indicates better uniformity and vice versa.
5 Results and discussion
5.1 Effect of vent tube structure on radon concentration
Prior to the experimental simulation, the vent tube structures of the chamber were designed and reconstructed.Two schemes were established, the vent tube with end opening for Case 1 and the vent tube with four side wall openings(Ø2 mm) on the wall for Case 2 (both under 1 L min−1,1 × 10⁻⁹m2).The growth curves of the radon concentrations for these two cases are shown in Fig.6a.In addition, the permeability in Case 2 was changed to 1 × 10–11m2(Case 3 with four openings) to test the effect of permeability.
Prior to reconstruction (case 1),Cs-avgwas larger thanCv-avgin the first 100 s, with the gap narrowing and remaining for the rest of the time.However,Cv-avgwas reckoned to grow faster thanCs-avgin view of the initial radon concentration being equal to 0 Bq m−3, implying defects in the vent tube structure in Case 1.Upon modification (Case 2),Cs-avgincreased more slowly thanCv-avgand the discrepancy remained constant.Cv-avg, representing the actual trend of radon concentration in the chamber, was used for subsequent simulations to study the migration of radon in the chamber.
The radon concentration contours for Cases 1 and 2 at 600 s are shown in Fig.7.The streamlines in Case 1 show that the jet from the vent tube enters the porous medium and then returns to the chamber, directly affecting the radon
concentration distribution in the porous medium, thus leading to the inhomogeneity of the radon concentration in the chamber.The streamlines in Case 2 mainly staying in the chamber indicate few impacts on the radon concentration distribution in the porous medium, in which the maximum,minimum, and average radon concentration in the chamber for Case 2 is 8676.49, 6208.08, and 7089.7 Bq m−3,respectively, while those for Case 1 are 9473.19, 4444.73,and 6575.9 Bq m−3.The NUI for Cases 2 and 1 was 34% and 76%, respectively, revealing that the uniformity of the radon concentration distribution in case 2 significantly improved.
5.2 Permeability effect on radon exhalation rate

Fig.6 a Growth curves of Cs-avg and Cv-avg in the first 600 s (case 1 and case 2), b the full growth curve of radon concentration for the R model,and c exhibition of all sorts of radon exhalation rate

Fig.7 (Color online) The streamlines and distribution of the radon concentration along the diagonal section of the accumulation chamber at 600 s for a Case 1, b Case 2, and c Case 3.(Color figure online)
TheEnon the surface covered by the chamber at 600,1200, and 1800s was 1.03988, 0.84632, and 0.69968 Bq m−2s−1for Case 2 and 1.03943, 0.84595, and 0.69937 Bq m−2s−1for Case 3.The approximate similarity of the radon exhalation rate as well as the contours and streamlines for Cases 2 and 3 implies that the effect of permeability on the closed-loop measurement of the radon exhalation rate can be neglected.Therefore, the permeability is set to 1 × 10⁻¹⁰m2in the subsequent simulations.
5.3 Reference radon exhalation rate
For assessment of radon exhalation rate under AC model,reference exhalation rate (Eref) under R model was calculated.TheCv-avggrowth curve from 0 to 1.2 × 10⁷s was obtained by radon accumulation until saturation in the sealed container (Fig.6b).The initial (Ea), fitted (Ef-exp),and total transient radon exhalation rates (En) were calculated, as shown in Fig.6c.As the transient radon exhalation rate for convection remains at 0 Bq m−2s−1in approximation, the effect of convection on the exhalation rate measurement can be neglected.Thus, the total transient radon exhalation rate was determined by the transient radon exhalation rate for diffusion (En-d), which is represented by the overlap ofEnandEn-din Fig.6c.
The fitted radon exhalation rate characterized the average exhalation for a given duration.Upon saturation for radon accumulation,Ef-expwas approximately equal toEn, suggesting the consistency of the fit, as well as the back-diffusion phenomenon, withEf-exp(0.520835 Bq m−2s−1) being only 35.59% equivalent toEa(1.463235 Bq m−2s−1).
The Porcelain Maiden and the Golden Blackbird know you too? Yes, replied the youth, and the Porcelain Maiden can tell you the whole truth, if she only will

Fig.8 (Color online) Radon concentration distribution in the accumulation chamber at 1800s (flow rate with 0.5/1/2 L min−1 and insertion depth with 1/3/5 cm).(Color figure online)
5.4 Flow rate and insertion depth effect on radon exhalation rate
The increased insertion depth of the chamber has been experimentally proven to reduce leakage during measurements.The effects of insertion depth (H1/H3/H5) and flow rate (0.5/1/2 L min−1) on the radon concentration and exhalation rate are analyzed in this section.The radon distribution in the accumulation chamber at 1800s is shown in Fig.8.At a low flow rate (0.5 L min−1), the radon concentration distribution is subject to notable spatial variation, while it gradually becomes uniform as the flow rate increases.In addition, lateral diffusion is responsible for the average concentration in the chamber for H1 being lower than that for H5, implying that the effect of insertion depth on the measurement cannot be neglected.
Excluding the points in the initial 60 s, the average value for every 60 s was calculated as the concentration at the midpoint, and further fitted to obtain the exhalation rate.For example, the average radon concentration from 61 to 120 s was calculated as the value at 90 s.The duration for curve fitting included 600 s, 720 s, 900 s, 1020 s, 1200 s, 1500 s,and 1800s, while it was 240 s, 360 s, 480 s, 600 s, 720 s,840 s, 960 s, 1080 s, 1200 s, 1320 s, 1440 s, and 1560 s for linear fitting.
Ef-expandEf-linwere obtained by fitting the points to the curve and linearly fitting the equations using different time ranges, as shown in Fig.9.A long duration (1800s) is unfavorable for curve fitting, the discrepancy of which withEaenlarged (0.9–3.3% increase in deviation for various insertion depths compared with 600 s).In contrast, the linear fitting value declined significantly with increasing duration (14.7–22.8% increase in deviation for various insertion depths from 240 to 1800 s).

Fig.9 The radon exhalation rate for the fitting value (Ef-exp in curve fitting and Ef-lin in linear fitting) under various duration,the transient value in numerical simulation (En), and the analytical solution (Ea) (flow rate with 0.5/1/2 L min−1, insertion depth with 1/3/5 cm, and permeability with 1 × 10⁻¹⁰ m2)
BothEf-expandEf-linincreased with the flow rate for a fixed insertion depth closer toEa.Throughout the accumulation duration,Enmaintained a decreasing trend and was only 48–59% (for various insertion depths) ofEaat 1800s, indicating thatEfis an averaged value for a certain duration and is unable to representEnat a specific moment.Moreover,Efwas more susceptible to back-diffusion for longer fitting durations.
For an in-depth analysis of the insertion depth effect(1 L min−1),Ef-expandEf-lin, as well as the effective decay constant (λe), were calculated, shown in Fig.10.λe(2.23582 × 10⁻⁶s−1) is comparable toλRnduring closedloop measurement in R model, in view of the assumption of radon-impermeable wall of the sealed container.A significant decrease of 27.2–34.2% is shown forλewith the increased insertion depth, implying that the leakage was effectively reduced in line with the previous experimental observations [21].
Furthermore, the ratios ofErefandEftoEawere calculated (Fig.10b, c).The ratio for the curve fitting (Ef-exp) is found to be positively correlated withλe.Increased insertion depth results in lowerλeand the ratios, suggesting an obvious back-diffusion effect.Unlike curve fitting, the ratios for linear fitting showed slight growth.Specifically,the exhalation rates of curve fitting using 1800s and linear fitting using 480 s for H1 were 0.89952 and 0.81364 Bq m−2s−1, respectively, while they were 0.89241 and 0.83551 Bq m−2s−1for H5.The effect of increased insertion depth on lower leakage is demonstrated by linear fitting (i.e., the fitted exhalation rate is closer toEaobtained by the increased insertion depth), whereas curve fitting for longer durations is more affected by back-diffusion.
In general, a uniform mixture of radon inside the chamber facilitates the radon exhalation rate measurement as the flow rate increased from 0.5 to 2 L min−1.Although the increased insertion depth helps lower the leakage rate,the side effect is the decreased accuracy of the curve fitting owing to back-diffusion.

Fig.10 (Color online) a Effective decay constant (λe)for H1, H3, H5, and R model using curve fitting (1 L min−1,λRn = 2.1 × 10⁻⁶ s−1).Ef-to-Ea ratios for H1, H3, H5, and R model using b curve fitting(Ef-exp) and c linear fitting (Ef-lin)(1 L min−1)
5.5 Validation of the numerical model
The effective decay constant measured on RB1 (approximately 4.88 × 10⁻⁶s−1) is 62% greater than that on RB2(approximately 3 × 10⁻⁶s−1) measured by RAD7, whereas it is 58% greater by Alphaguard, implying that the container of RB2 is better sealed during measurement.The effective decay constant for the accumulation chamber peaked at an insertion depth of 0 cm (C0), approximately 1.88 × 10⁻⁴s−1on RB1 and 2.5 × 10⁻⁴s−1on RB2.As the insertion depth increased, the effective decay constant declined by 38–52% to almost 2.9 × 10⁻⁵s−1, indicating a lower leakage rate.The variation in the effective decay constant for the reference boxes (RB1 and RB2) and the accumulation chamber fit well with the simulated results shown in Fig.10a.The effective decay constant decreased by 27.2–34.2% with increasing depth from 1 to 5 cm.
Furthermore, the ratios of the curve-fitted radon exhalation rate to the reference values for C0, C3, and C6 on RB2 were chosen for comparison with those for H1, H3, and H5 because the airtightness of RB2 was better than that of RB1.The ratios for C0, C3, and C6 were 1.65, 1.22, 1.1 measured by Alphaguard, and 1.18, 1.04, 1.02 by RAD7,respectively.An evident downward trend was observed for both Alphaguard and RAD7, which agrees well with the trends of the ratios for H1, H3, and H5 by exponential fitting in Fig.10b.
Although the reference radon exhalation rate (equivalent to the value obtained from the R model in this study)was used as an intrinsic value for comparison, the potential discrepancy caused by back-diffusion should be noted.Inaccurate reference values can potentially render comparisons unreliable.
In summary, the simulation not only validates the variation in the experimental data but also further reveals the positive correlation between the back-diffusion phenomenon and the increase in insertion depth.
5.6 Diffusion coefficient effect on radon exhalation rate

Fig.11 The radon exhalation rate for the fitting value (Ef-exp in curve fitting and Ef-lin in linear fitting) under various duration, the transient value in numerical simulation (En), and the analytical solution (Ea)(D1/D2/D3/D4 corresponding to 2.77 × 10⁻⁷/7.77 × 10–7/2.77 × 10–6/7.77 × 10–6 m2 s−1, 1 L min−1, 1 × 10⁻¹⁰ m2, and 1 cm insertion depth)
In view of the inevitable back-diffusion phenomenon mentioned in Sect.5.4 (i.e., the curve-fitted radon exhalation rate declines with an increase in the insertion depth and with a lower effective decay constant), the effect of the radon diffusion coefficient for the porous medium onEa,Ef, andEnwas additionally analyzed.According to Eq.(3),the radon exhalation rate is positively correlated with the effective diffusion coefficient, explaining why theEa(1.2081 Bq m−2s−1) for D1 scenario (the lowest effective diffusion coefficient among the four scenarios) is apparently lower than that for the other three scenarios (the former equivalent to 81.3–87.7% of the latter in Fig.11).Lower radon exhalation needs longer time for the radon concentration to reach saturated, evidenced by lower value ofλefor D1 (Fig.12a).Increasing the effective diffusion coefficient causesEforEnto deviate fromEa, suggesting that the effective diffusion coefficient is an important factor in the back-diffusion phenomenon.
The ratios ofEftoEausing various fit durations for the four effective diffusion coefficient scenarios are shown in Fig.12b, c.The ratios decrease with the increasing effective diffusion coefficient, going from 0.98 to 0.84 for curve fitting (Ef-exp, 1800s) and from 0.96 to 0.67 for linear fitting(Ef-lin, 480 s).The deviations between the curve (1800s) and linear (480 s) fitting were 2.08%, 3.88%, 9.55%, and 20.68%for D1, D2, D3, and D4, respectively, making the exhalation rate for a lower effective diffusion coefficient that can becalculated approximately using linear fitting in a time-saving manner to replace curve fitting.

Fig.12 (Color online) a Effective decay constant (λe) obtained by applying curve fitting for D1, D2, D3, and D4 scenario(1 L min−1, λRn = 2.1 × 10⁻⁶ s−1).Ratios of Ef to Ea for D1,D2, D3, and D4 scenario using b curve fitting (Ef-exp) and c linear fitting (Ef-lin) (1 L min−1).(Color figure online)
6 Conclusion
A CFD-based technique was employed to model the threedimensional geometry and simulate various scenarios to measure the radon exhalation rate beyond the traditional method.The transient radon exhalation rate for diffusion maintained a decreasing trend during the initial 1800 s in the measurement owing to the back-diffusion caused by the accumulated radon, whereas that for convection contributed little to the radon exhalation.The results revealed that radon migration patterns are subject to the vent tube structure,effective radon diffusion coefficient, insertion depth, and flow rate.Their effects on the radon exhalation rate were analyzed, and the discrepancies between the initial, fitted,and transient exhalation rates were quantified.The conclusions are as follows:
The improved vent tube structure (tube with side wall openings) in the accumulation chamber was favorable for a stable radon concentration distribution in the porous medium, avoiding the disturbance of the jet from the tube with the end opening.The increase in circulation flow rate(from 0.5 to 2 L min−1) further improves the uniformity of radon concentration in the chamber (NUI from 76 to 34%),beneficial for accurate measurement of radon concentration.In addition, the permeability of the porous medium had little effect on the closed-loop measurement of radon exhalation rate.
The effect of the effective diffusion coefficient on the radon exhalation rate measurement was notable.The deviation in the fitted radon exhalation rate (Ef) from the initial value (Ea) was small (max.2.14%) for a relatively low effective diffusion coefficient (D1), whereas it increases for D4 (max.15.96%), making the measurement susceptible to back-diffusion.A lower effective diffusion coefficient indicates a lower radon diffusion capability in the porous medium, which limits the ability of radon to accumulate inside the chamber at high concentrations and diffuse into the porous medium.Therefore, the closed-loop method is more suitable for measuring the radon exhalation rate on the surface of a compact porous medium with a low effective radon diffusion coefficient.
Although the increased insertion depth (from 1 to 5 cm)contributed to a decrease in the effective decay constant(a decrease of 23.17% and 19.55% corresponding to 600 s and 1800s curve fitting, 1 L min−1), back-diffusion could not be avoided.This is evident from the deviation of the exhalation rate using curve fitting (Ef-exp) from the initial value (Ea), which increased by approximately 7% (1800s),whereas that in the case of linear fitting (Ef-lin) decreased by approximately 12% (480 s).The deeper the insertion depth,the lower the leakage rate and, to some extent, the higher the equilibrium radon concentration inside the chamber.This,in turn, suppressed radon exhalation from the medium surface.Thus, linear fitting allows the radon exhalation rate to be calculated at a lower time cost and reduces the effect of back diffusion.
In summary, the consistency of the numerically simulated results with previous experimental data signals that modeled the closed-loop measurement system of the radon exhalation rate by CFD-based numerical simulation is verifiable and reliable.The results are expected to provide theoretical guidance for the optimization of closed-loop measurement methods (e.g., circulation flow rate, insertion depth, and applicability of porous media).
Author contributionsAll authors contributed to the study conception and design.Material preparation, data collection and analysis were performed by MX, Y-JY and S-YL.The first draft of the manuscript was written by MX, and all authors commented on previous versions of the manuscript.All authors read and approved the final manuscript.Data availabilityThe data that support the findings of this study are openly available in Science Data Bank at https:// cstr.cn/ 31253.11.scien cedb.13468 and https:// www.doi.org/https:// doi.org/ 10.57760/ scien cedb.13468.
Declarations
Conflict of interestThe authors declare that they have no competing interests.
 Nuclear Science and Techniques2024年1期
- Nuclear Science and Techniques的其它文章
- Digital signal acquisition system for complex nuclear reaction experiments
- Uncertainty and sensitivity analysis of in‑vessel phenomena under severe accident mitigation strategy based on ISAA‑SAUP program
- Generation and regulation of electromagnetic pulses generated by femtosecond lasers interacting with multitargets
- Infrared microspectroscopy beamline BL06B at SSRF
- A new liquid membrane diffusion model for characterizing the adsorption kinetics of europium by using a continuous measurement of adsorption platform
- Conceptual design of a 714‑MHz RFQ for compact proton injectors and development of a new tuning algorithm on its aluminium prototype