Utilizing bioinformatics for integrated analysis of multiple genes in the diagnosis and pathogenesis of metastatic pheochromocytoma and paraganglioma
Chun-Lei Zhng,Rui Wng,Fo-Rong Li,De-Hui Chng,*
Abstract Objective: The aim of the study was to investigate effective diagnostic molecular markers and the specific mechanisms of metastatic pheochromocytomas and paragangliomas(PPGLs).Methods:Data were collected from GEO datasets GSE67066 and GSE60458.The R software and various packages were utilized for the analysis of differentially expressed genes,Gene Ontology analysis,Kyoto Encyclopedia of Genes and Genomes analysis,receiver operating characteristic curve assessment,logistic model construction,and correlation analysis.The NetworkAnalyst tool was used to analyze gene-miRNA interactions and signaling networks.In addition,the TIMER database was used to estimate the immune scores.Results:A total of 203 and 499 differentially expressed genes were identified in GSE67066 and GSE60458,respectively.These genes are implicated in cytokine and cytokine receptor interactions,extracellular matrix-receptor interactions,and platelet activation signaling pathways.Notably,MAMLD1,UST,MATN2,LPL,TWIST1,SFRP4,FRMD6,RBM24,PRIMA1,LYPD1,KCND2,CAMK2N1,SPOCK3,and ALPK3 were identified as the key genes.Among them,MATN2 and TWIST1 were found to be coexpressed with epithelial-mesenchymal transition-linked markers,whereas KCND2 and LPL exhibited associations with immune checkpoint expression and immune cell infiltration.Eight miRNAs were identified as potential regulators of key gene expression,and it was noted that TWIST1 might be regulated by SUZ12.Notably,the area under the curve of the 4-gene model for distinguishing between malignant and benign groups was calculated to be 0.918.Conclusions:The combined gene and mRNA expression model enhances the diagnostic accuracy of assessing PPGL metastatic potential.These findings suggest that multiple genes may play a role in the metastasis of PPGLs through the epithelial-mesenchymal transition and may influence the immune microenvironment.
Keywords: Diagnosis;Epithelial-mesenchymal transition(EMT);Immunity;Metastasis;Paraganglioma;Pheochromocytoma
1.Introduction
According to the 2017 World Health Organization classification,pheochromocytomas and paragangliomas(PPGLs)of the same histological type are considered neuroendocrine tumors derived from adrenomedullary and extra-adrenal chromaffin tissues.Their incidence is approximately 0.6 per 100,000 person-years,and they typically carry a favorable prognosis.[1]However,approximately 15%of PPGLs exhibit malignant behavior,characterized by metastasis and resistance to conventional therapies,which significantly reduces the 5-year survival rate for these patients to 60%.[2]Hence,early detection and intervention are of paramount importance in managing PPGLs with malignant tendencies.Malignant PPGLs were previously defined by the presence of metastatic tumor cells in chromaffin-free tissues and have now been officially renamed as metastatic PPGLs(mPPGLs).Pathologists have developed a grading system for adrenal PPGLs to evaluate malignancy based on histological and malignant biological features.However,this grading system falls short in accurately distinguishing early-stage malignant PPGLs well.[3]In addition,there are currently no molecular markers available to differentiate between benign and malignant PPGLs.Therefore,further research into the pathogenesis,mechanisms of metastasis,diagnosis,and prognosis of mPPGLs is necessary.With the advancement of high-throughput sequencing,combining RNA sequencing results with bioinformatics analysis can aid in the identification of diagnostic molecular markers by identifying differentially expressed genes (DEGs).By conducting correlation analyses between DEGs and genes associated with metastasis,we can gain insights into the mechanisms underlying tumor metastasis promotion.
By searching the database,we obtained RNA sequencing results related to mPPGL tissues from the GSE67066 and GSE60458 databases.Given the limited studies on the mechanisms of metastasis and diagnostic analyses of PPGLs,we used bioinformatics to analyze these 2 datasets.Our goal was to explore potential metastatic mechanisms involved in the malignant transformation of PPGLs through a comprehensive analysis of mRNA expression.The workflow for integrated analysis of multiple genes in the diagnosis and pathogenesis of metastatic pheochromocytoma and paraganglioma is depicted in Figure 1.
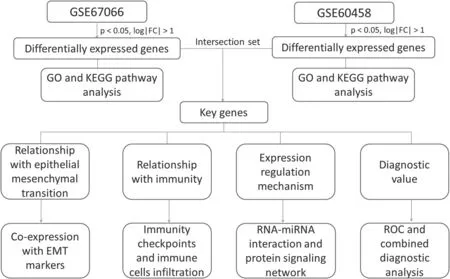
Figure 1.Workflow for integrated analysis of multiple genes in the diagnosis and pathogenesis of metastatic pheochromocytoma and paraganglioma.
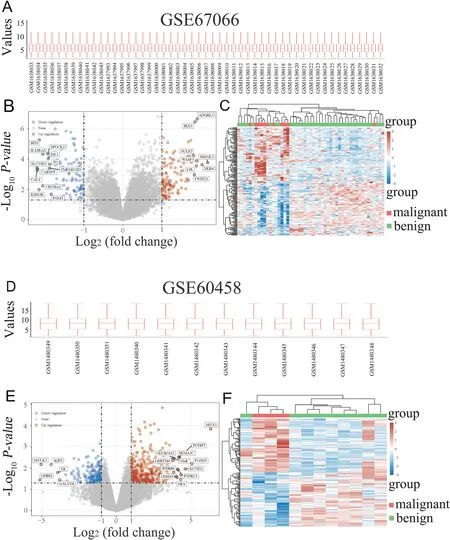
Figure 2.Identification of differentially expressed genes (DEGs).A,Boxplot displaying normalized data in GSE67066.B,Volcano plot illustrating differential gene expression (DEGs) in GSE67066.Red dots indicate upregulated genes,whereas the blue dots indicate downregulated genes.C,Heatmap showcasing the DEGs in GSE67066,with different colors representing the trend of gene expression in various tissues.The figure displays the top 50 upregulated genes and top 50 downregulated genes.D,Boxplot exhibiting normalized data in GSE60458.E,Volcano plot showing DEGs in GSE60458.F,Heatmap depicting the DEGs in GSE60458.
2.Materials and methods
2.1.Data collection
Data on DEGs came from the dataset GSE67066 and GSE60458 downloaded from the GEO database (http://www.ncbi.nlm.nih.gov/geo/).The gene expression profile of GSE67066,including 40 benign and 11 malignant PPGLs,was assessed using the GPL570(HG-U133_Plus_2)Affymetrix Human Genome U133 Plus 2.0 Array platform(Affymetrix,Inc.,Santa Clara,California,United States).The gene expression profile of GSE60458,which includes 9 benign and 3 malignant PPGLs,was assessed using GPL13607 Agilent-028004 SurePrint G3 Human GE 8x60K Microarray(feature number version,Agilent Technologies,Inc.,Santa Clara,California,United States).
2.2.Identification of DEGs and software for analysis
R software(version 3.6.3,for statistical analysis and visualization,RStudio,PBC,Boston,Massachusetts,USA)was used for all bioinformatics analyses.The GEOquery package in R (version 2.54.1)was used for data download,the limma package in R (version 3.42.2) was used for differential expression analysis,the ClusterProfiler package in R (version 3.18.0) was used to analyze the Gene Ontology (GO) function of potential targets and enrich the Kyoto Encyclopedia of Genes and Genomes pathway,the ComplexHeatmap package in R(version 2.2.0)was used for heatmap visualization,the p ROC package in R(version 1.17.0.1)was used for receiver operating characteristic curve construction,the glm function was used to build the logistic model,and the ggplot2 package in R(version 3.3.3)was used for visualization,“P <0.05 and log(fold change)>1 or log(fold change)<-1”was defined as the threshold for the differential expression of mRNAs.
2.3.Application of public database
The NetworkAnalyst database(https://www.networkanalyst.ca)was used to analyze gene-miRNA interactions and signaling networks.Gene-miRNA interactions were based on the data from miRTarBase v8.0(developed by the team of the Department of Biological Science and Technology and the Institute of Bioinformatics and Systems Biology at the National Chiao Tung University in Hsinchu,Taiwan,China),and signaling network construction was based on the data from SIGNOR 2.0.The TIM ER database (https://cistrome.shinyapps.io/timer)was used to estimate the immune scores.
2.4.Statistical analysis
The Mann-Whitney U test was used to analyze the differences in gene expression in samples,and genes were grouped according to the median.The Pearson correlation coefficient was calculated using correlation analysis.Nonsignificance was set at P <0.05,and statistical significance was set at P <0.05.
3.Results
3.1.Identification of DEGs
Two datasets,GSE67066 and GSE60458,from the GEO database were selected to analyze the DEGs between benign and malignant PPGL tissues.The clinical characteristics of the patients are summarized in Table 1.Finally,in GSE67066,20,547 genes were identified,of which upregulated DEGs were 109 (P <0.05,log|FC|>1)and downregulated were 94 (P <0.05,log|FC| >1),as shown in Figures 2A–C.In GSE60458,19,886 genes were identified,of which upregulated DEGs were 337 (P <0.05,log|FC| >1) and downregulated were 162 (P <0.05,log|FC| >1),as shown in Figures 2D–F.
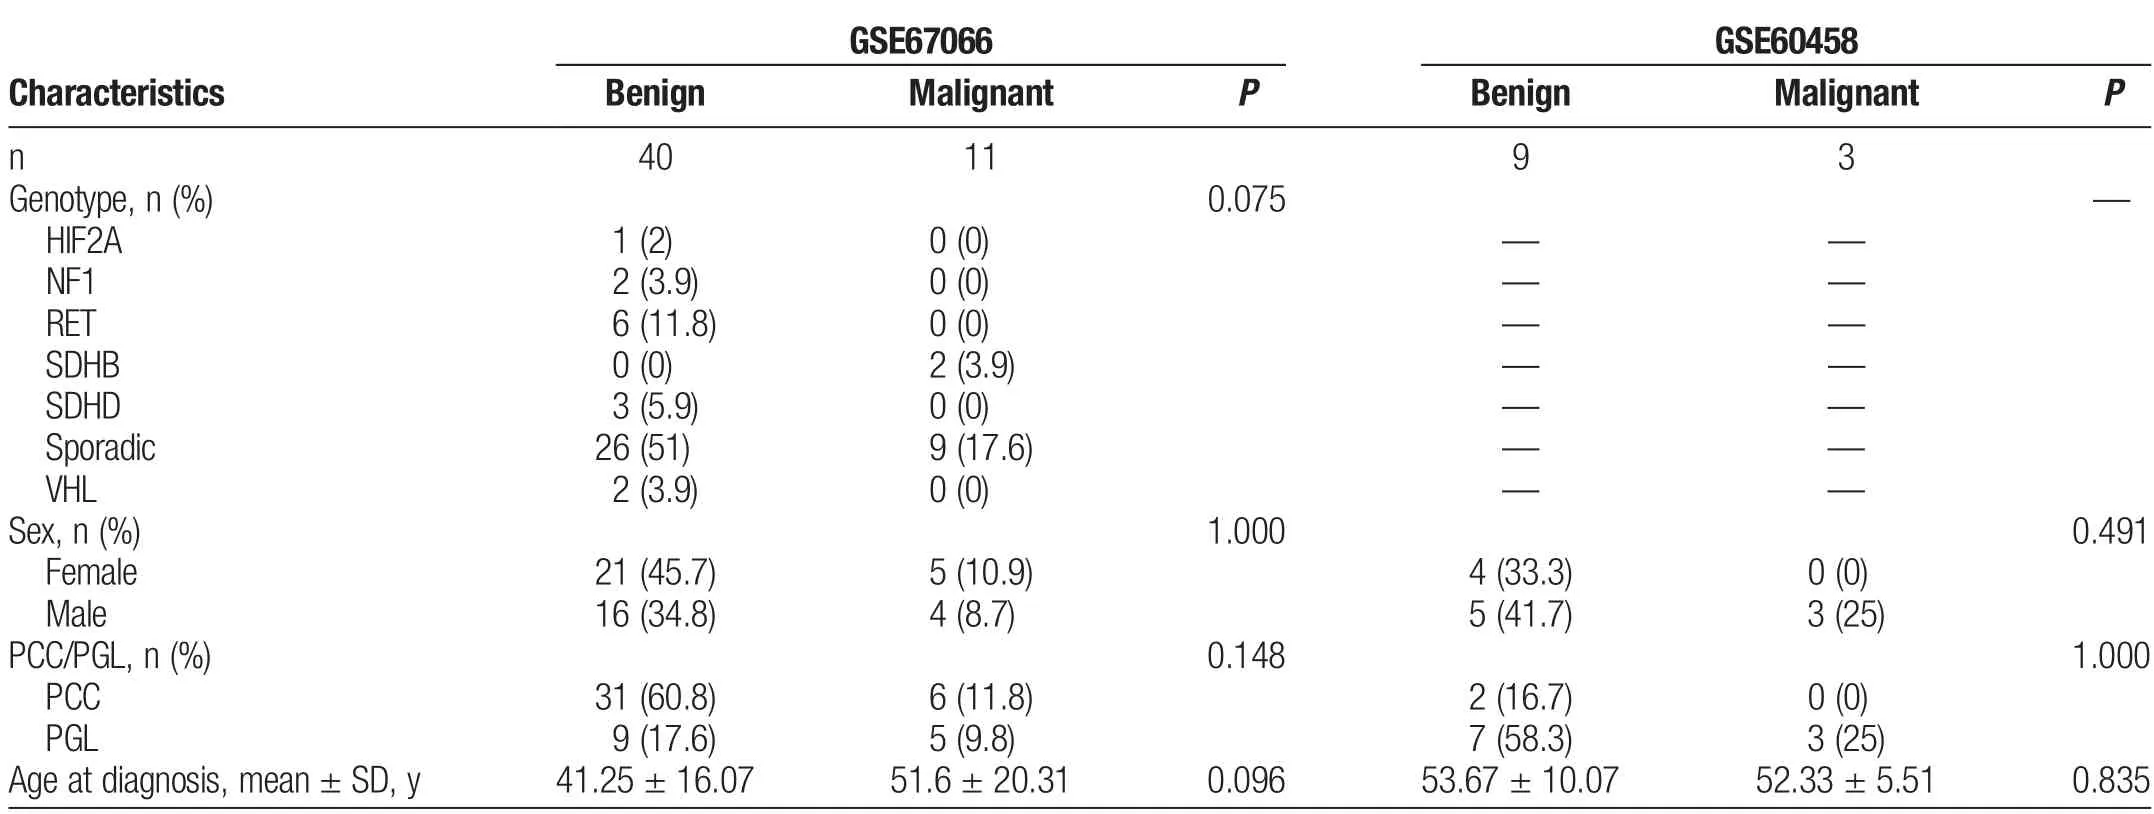
Table 1Patients’clinical characteristics
3.2.Kyoto Encyclopedia of Genes and Genomes pathway and GO analysis of DEGs
All the upregulated and downregulated DEGs from each dataset were included in the functional analysis.In the Kyoto Encyclopedia of Genes and Genomes pathway analysis,upregulated DEGs in both datasets exhibited enrichment in cytokine and cytokine receptor interactions as well as extracellular matrix–receptor interactions(Figures 3A and B).Conversely,downregulated DEGs in both datasets showed enrichment in platelet activation(Figures 3C and D).Eighty-four GO analysis results of upregulated DEGs were represented in both datasets,such as regulation of epithelial-mesenchymal transition(EMT)and stem cell proliferation,but none for downregulated DEGs(Figure 3E).
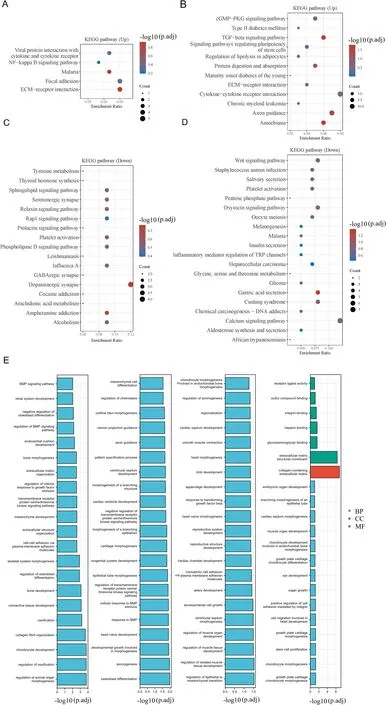
Figure 3.Functional enrichment analyses.A,KEGG signaling pathways of upregulated DEGs in GSE67066.B,KEGG signaling pathways of upregulated DEGs in GSE60458.C,KEGG signaling pathways of downregulated DEGs in GSE67066.D,KEGG signaling pathways of downregulated DEGs in GSE60458.Colors represent the significance of differential enrichment,and the size of the circles corresponds to the number of genes,with larger circles indicating a greater number of genes.E,GO analysis of DEGs represented in both GSE67066 and GSE60458.Pathways with FDR <0.05 are considered meaningful.FDR,false discovery rate;GO,Gene Ontology;KEGG,Kyoto Encyclopedia of Genes and Genomes.
3.3.Screening for key genes
To identify key genes,we generated a Venn diagram of the DEGs in the 2 datasets(Figures 4A and B).We identified a set of 14 key genes,which were selected for further analysis by taking the intersection of the DEGs.These key genes included upregulated MAMLD1,UST,MATN2,LPL,TWIST1,SFRP4,FRMD6,RBM24,PRIMA1,LYPD1,and KCND2 and downregulated CAMK2N1,SPOCK3,and ALPK3.Their respective expression in each dataset can be observed in Figures 4C and D,and their expression correlations in each dataset are depicted in Figure 4E.

Figure 4.Screening and expression of key genes.A,Venn diagram displaying upregulated genes in GSE67066 and GSE60458.B,Venn diagram illustrating downregulated genes in GSE67066 and GSE60458.C,Expression of key genes in GSE67066.D,Expression of key genes in GSE60458.E,Correlations of key gene expressions in GSE67066 and GSE60458.*P <0.05 and**P <0.01.
3.4.Key genes relationship with EMT
Given the significant role that EMT plays in the metastasis of malignant tumors,we constructed a Venn diagram to identify commonalities between the 14 key DEGs and a set of 1263 EMT-related genes.[4–6]MATN2,SFRP4,and TWIST1 areEMT-related genes(Figure5A).Furthermore,MATN2 was found to be coexpressed with the EMT-linked markers SNAIL2 and TWIST2 in both datasets.TWIST1 exhibited coexpressed with TWIST2 in both datasets(Figure 5B).

Figure 5.Correlation of DEG expression with epithelial-mesenchymal transition (EMT).A,Venn diagram showing DEGs and EMT-related genes.B,Correlation of MATN2,SFRP4,and TWIST1 expression with EMT markers in GSE67066 and GSE60458.EMT markers include CDH1,CDH2,VIM,SNAIL1,SNAIL2,TWIST1,and TWIST2.*P <0.05 and**P <0.01.
3.5.Key gene relationship with immunity
The immune microenvironment is recognized as a pivotal factor in tumor metastasis.Therefore,we generated a Venn diagram of identifying intersections between 14 key DEGs and 1959 immunityrelated genes.[7,8]This analysis led to the selection of KCND2 and LPL,as shown in Figure 6A.We proceeded to investigate the correlations between the expression of these 2 genes,8 immune checkpoints,and 6 immune cell infiltrations in each dataset.In the GSE67066 cells,KCND2 expression was negative for macrophage infiltration.LPL expression was negative for CD274 and LAG3 expression,but positive for CD8 T cells,neutrophils,and macrophages,as shown in Figures 6B–E.In GSE60458,KCND2 expression was negative for PDCD1LG2 expression but positive for LAG3 expression.LPL expression was negative for SIGLEC15 expression,shown in Figures 6F–I.
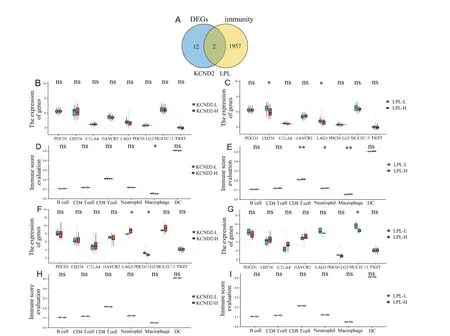
Figure 6.Correlation of DEG expression with immunity.A,Venn diagram displaying DEGs and immunity-related genes.B,Correlation of KCND2 expression with immune checkpoint expression in GSE67066.C,Correlation of LPL expression with immune checkpoint expression in GSE67066.D,Correlation of KCND2 expression with immune cell infiltration in GSE67066.E,Correlation of LPL expression with immune cell infiltration in GSE67066.F,Correlation of KCND2 expression with immune checkpoint expression in GSE60458.G,Correlation of LPL expression with immune checkpoint expression in GSE60458.H,Correlation of KCND2 expression with immune cell infiltration in GSE60458.I,Correlation of LPL expression with immune cell infiltration in GSE60458.Immune checkpoints include PDCD1,CD274,CTLA4,HAVCR2,LAG3,PDCD1LG2,SIGLEC15,and TIGIT.Immune cells include B cell,CD4 T cell,CD8 T cell,neutrophil,macrophage,and dendritic cell.L denotes low expression,and H denotes high expression.*P <0.05 and**P <0.01.
3.6.RNA-miRNA interaction and protein-signaling network construction
To analyze the regulatory mechanism of gene expression,we constructed an RNA-miRNA interaction network and found that miR-335-5p,miR-7-1-3p,miR-1-3p,miR-548c-3p,miR-26b-5p,miR-106b-5p,miR-124-3p,and miR-1238-3p may regulate the expression of key genes (Figure 7A).We then constructed a protein-signaling network;only TWIST1 and LPL had matching objects (Figures 7B and C).Of all the results,only SUZ12 was observed positively expressed with TWIST1 in both datasets(Figures 7D and E).
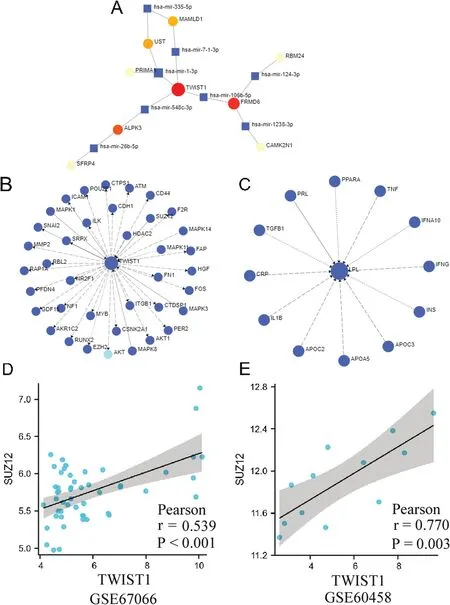
Figure 7.Regulation mechanism of DEG expression.A,RNA-microRNA(miRNA)interaction network of DEGs and predicted miRNAs.B,Protein-signaling protein network of TWIST1.C,Protein-signaling protein network of LPL.D,Correlation of TWIST1 expression with SUZ12 expression in GSE67066.E,Correlation of TWIST1 expression with SUZ12 expression in GSE60458.
3.7.Diagnostic value of DEG mRNA
Considering the insufficient samples of GSE60458 and the lack of significant differences in clinical characteristics between the benign and malignant groups,we constructed receiver operating characteristic curves for all key DEGs in GSE67066 to screen mRNAs that can be used as diagnostic markers.Genes with area under the curve(AUC)>0.80 were selected for integrated diagnostic analysis,including LPL (AUC,0.809),UST (AUC,0.809),CAMK2N1(AUC,0.866),and SPOCK3(AUC,0.811)(Figures 8A and B).Logistics regression equation=9.698+0.4192×LPL+0.5088×UST+(-1.6145)×CAMK2N1+(-0.2148)×SPOCK3.The cutoff value was-1.075,the sensitivity and specificity were 0.909 and 0.900,respectively,and the AUC was 0.918(Figure 8C).

Figure 8.ROC curve of mRNA of key genes in malignant and benign PPGLs.A,ROC curve of mRNA of FRMD6,KCND2,LPL,LYPD1,MAMLD1,MATN2,and PRIMA1.B,ROC curve of mRNA of RBM24,SFRP4,TWIST1,UST,ALPK3,CAMK2N1,and SPOCK3.C,Combined genes ROC curve of LPL,UST,CAMK2N1,and SPOCK3.The abscissa represents the FPR,and the ordinate represents the TPR.FPR,false-positive rate;PPGLs,pheochromocytomas and paragangliomas;ROC,receiver operating characteristic;TPR,true-positive rate.
4.Discussion
GSE67066 and GSE60458 represent the only 2 mRNA-seq datasets available in the GEO database.Hence,we conducted a simultaneous analysis of both datasets to derive more accurate conclusions.The primary distinction between malignant and benign PPGLs lies in the metastasis observed in the former.Functional cluster analysis of the DEGs disclosed several pathways that could have a substantial impact on metastasis.Cytokines,being small-molecular-weight proteins with a wide array of biological activities,and the extracellular matrix,comprising a basement membrane and Leydig cell,[9,10]together constitute a major molecular tissue barrier.Both elements can influence metastatic progression by modulating the tumor cell microenvironment.Notably,cytokines are predominantly secreted by immune cells,[9]which suggests that the immune system may play a role in the development of malignant PPGLs.Moreover,processes such as EMT and stem cell proliferation are critical for tumorigenesis,growth,and metastasis.[11]
Generally,hub genes are screened by constructing a protein-protein interaction network of DEGs.However,we found no interaction network diagram consisting of 14 key genes under the low-confidence standard after constructing the protein-protein interaction network of the DEGs.Interestingly,we found that MATN2,SFRP4,and TWIST1 were EMT-related genes.Studies have reported that SFRP4 modulates EMT in ovarian and colon cancers as a Wnt gatekeeper.[12]TWIST1,an EMT-related transcription factor belonging to the bHLH family,contributes to tumor metastasis,tumor initiation,and primary tumor growth.[13]
The tumor immune microenvironment is a vital element of tumor biology.[14]KCND2 and LPL were found immune-related genes in this study.Immunosuppression is an important factor in immune escape from the tumor.[15,16]The binding of immune checkpoints to their ligands can effectively inhibit immune response.[17]However,when analyzing the correlation between DEGs and immune-related gene expression,we found that KCND2 and LPL expressions were negatively associated with immune checkpoints,except that LPL was positive for LAG3.This implies that immune factors may play an antitumor role in mPPGLs.When analyzing the correlation between these 2 genes and immune-infiltrating cells,we found that a higher KCND2 expression indicated more CD8 T cell,neutrophil,and macrophage infiltration.Because immune function may be enhanced by the expression of DEGs,targeted immunotherapy may bring new hope for the treatment of mPPGLs.An open-label phase II study of pembrolizumab in patients with mPPGLs has been conducted(NCT02721732).
Furthermore,we analyzed the possible regulatory mechanisms of key genes in PPGLs.MicroRNAs are endogenous noncoding RNAs that posttranscriptionally regulate the expression of conserved genes.In the present study,miR-335-5p,miR-7-1-3p,miR-1-3p,miR-548c-3p,miR-26b-5p,miR-106b-5p,miR-124-3p,and miR-1238-3p were found to be the underlying molecules to influence key genes.They play crucial roles in the cellular biology of different cancers.[18–25]In addition,the protein-signaling protein network showed that SUZ12 was positively expressed along with TWIST1 in both datasets.SUZ12 has been reported as an oncogene in gastric cancer,[26,27]indicating that SUZ12 promotes PPGL progression by regulating TWIST1.
mRNA expression can be used as a molecular marker for disease diagnosis,and the combined application of multigene mRNA expression can significantly increase diagnostic efficiency.[28,29]We used the dataset GSE67066 to screen 4 genes that could effectively distinguish malignant PPGLs samples from benign samples.We used a logistic regression equation constructed using the selected gene mRNA expression for diagnostic analysis.This approach provides a better reference for diagnosing malignant PPGLs.Owing to the use of different sequencing platforms,the diagnostic efficacy of this equation could not be validated in GSE60458.
This study had some limitations.Tumor progression from benign to malignant is gradual.Some of the benign PPGLs we defined may have malignant tendencies.Therefore,it is acceptable to analyze gene expression trends or the correlation between gene expression in both benign and malignant tumor samples.Normally,bioinformatics results need to be verified experimentally,but the PPGL experimental model is difficult to establish.Hence,the results of this study should be verified in future studies.In addition,this study and its conclusions illustrate the relevance of gene mRNA expression but do not address the specific mechanism of metastasis.This task is the next step in our study.Moreover,this study failed to show the prognostic value of DEGs because of a deficiency in the outcomes of the corresponding patients.Therefore,more complete data are required for future prognostic evaluations.
5.Conclusions
MAMLD1,UST,MATN2,LPL,TWIST1,SFRP4,FRMD6,RBM24,PRIMA1,LYPD1,KCND2,CAMK2N1,SPOCK3,and ALPK3 may be important genes in PPGL metastasis via EMT or immunity.MiR-335-5p,miR-7-1-3p,miR-1-3p,miR-548c-3p,miR-26b-5p,miR-106b-5p,miR-124-3p,and miR-1238-3p may regulate key genes expression,and TWIST1 may be regulated by SUZ12.This study demonstrates that multiple genes mRNA models including LPL,UST,CAMK2N1,and SPOCK3 can increase the diagnostic efficiency of the metastatic potential of PPGLs.
Acknowledgments
None.
Financial support and sponsorship
This research was supported by the Project of the 940 Hospital of the Joint Logistics Support Force of the Chinese PLA (no.2021yxky057).
Conflicts of interest statement
The authors declare that they have no conflict of interest with regard to the content of this report.
Author contributions
All authors contributed to data acquisition and interpretation and reviewed and approved the final version of this manuscript.
Data availability statement
Open-access datasets are available through the following URL:GSE67066(https://www.ncbi.nlm.nih.gov/geo/query/acc.cgi?acc=GSE67066) and GSE60458 (https://www.ncbi.nlm.nih.gov/geo/query/acc.cgi?acc=GSE60458).All data generated or analyzed in this study are available from the corresponding author upon reasonable request.
Ethical approval
Not applicable.
 Oncology and Translational Medicine2024年1期
- Oncology and Translational Medicine的其它文章
- Wan-Yee Joseph Lau:the promoter of modernization and internationalization of Chinese surgery
- In vivo study of the effect of anlotinib on the stemness of the lenvatinib-resistant hepatocellular carcinoma cells and the underlying mechanisms
- Role of tumor necrosis factor alpha-induced protein 6(TNFAIP6)in tumors:a pan-cancer analysis
- Clinical and pathological characteristics and expression of related molecules in patients with airway disseminated lung adenocarcinoma
- Three novel rare TP53 fusion mutations in a patient with multiple primary cancers:a case report
