基于潮流追踪的用户碳排放水平计算与评估方法
杨晓林, 陈 虹, 袁 琪, 卢陈越, 马煜承, 王 琦
(1.国网江苏省电力有限公司 常州供电分公司,江苏 常州 213003;2.东南大学 电气工程学院,江苏 南京 210096)
0 引言
随着近年来电力系统向低碳化转型以及分布式电源、分布式储能技术的发展,部分用户从传统的单一能源消费者转变为同时兼具能源供给能力的产消者。这些用户侧泛在资源分布零散、数量多、容量小以及随机性大的特点[1-2],加剧了电网公司在用户碳排放量溯源、计算与评估上的困境。因此本文提出了基于潮流追踪技术[3]的用户碳排放水平计算与评估方法,对大电网的碳流分布进行有效追踪[4-5]。同时,构建基于用户侧能源信息的碳排放指标体系,实现对用户碳排放水平的有效评估。
潮流追踪技术目前在大电网分析与控制领域中的研究较多,包括输电成本分摊方法[6]、需求响应[7]和网损分摊[8]等。文献[9]提出结合潮流追踪法、功率灵敏度法与反向等量调整法对控制节点组进行相应控制进而快速消除线路过载避免连锁故障。文献[10]基于潮流追踪算法提出一种发电机功率非均匀分配方式以降低网络的临界同步耦合强度,改善电网同步性能与鲁棒性。文献[11]针对导致潮流方程无解的支路型故障,提出了一种基于潮流追踪方法的潮流解恢复控制策略。近年来,潮流追踪技术在碳电领域中的研究应用越来越被关注,文献[12]基于发、用电企业的电力生产和消费数据、电力潮流分布数据以及绿色电力交易数据,构建了一种企业用电碳排放因子计算模型,实现用电侧碳排放因子的实时更新。文献[13]建立了基于气、热系统叠加特性的动态潮流模型,对系统进行动态潮流追踪,形成了用户侧精细化碳指标。
在电力系统碳排放水平评估方面,各个研究尚未达成共识。文献[14]提出了随时间变化的电网碳排放因子测算方法,并分析了电网碳排放因子的日内和季节性变化。文献[15]提出利用灵敏度分析确定节点负荷变化对应的边际机组,进而量化用户的用电碳排放责任。文献[16-17]提出了初步的碳流理论架构,文献[18]基于该理论提出了电力碳排放区域分摊的基本原则。文献[19]将碳排放流理论拓展到综合能源系统,揭示了能源网络中碳排放流的基本特征与规律。
基于前人的研究,本文提出了一种基于潮流追踪技术的用户碳排放水平计算与评估方法。针对现有技术难以对电网碳足迹进行准确追踪等问题,创新性地提出了基于潮流追踪理论的电网碳追踪技术,构建碳流网络模型与理论框架。所提的创新碳排放指标体系,可助力相关部门、政府对于电力系统进行合理的碳排放的量化评估。
1 潮流追踪方法


(1)
式中:*为顶点(节点)的相连运算,代表顶点序列满足结合律但不满足交换律;∨为条件“或”,满足结合律、交换以及两种运算间的分配律。
通过三步进行潮流追踪[20]:顺流和逆流追踪将网络损失双向分摊至负荷侧和电源侧从而将有损网络转化为无损网络;通过直流潮流方程对无损网络进行潮流分析求解;通过有功功率的逆流潮流追踪得到节点负荷、支路潮流分布以及发电机注入网络的功率分布。
首先通过双向网损分摊可以将支路损耗分摊至电源与负荷两侧如式(2)~(5)所示:

(2)

(3)

(4)

(5)

然后经过网络损失的双向分摊可以得到无损网,通过求解式(6)所示的直流潮流方程进行潮流计算。

(6)

最后根据逆流追踪重新计算得到节点负荷、支路潮流中各发电机注入网络的功率占比。
2 基于潮流追踪的用户碳排放水平计算与评估方法
碳排放因子计算方法如图1所示。
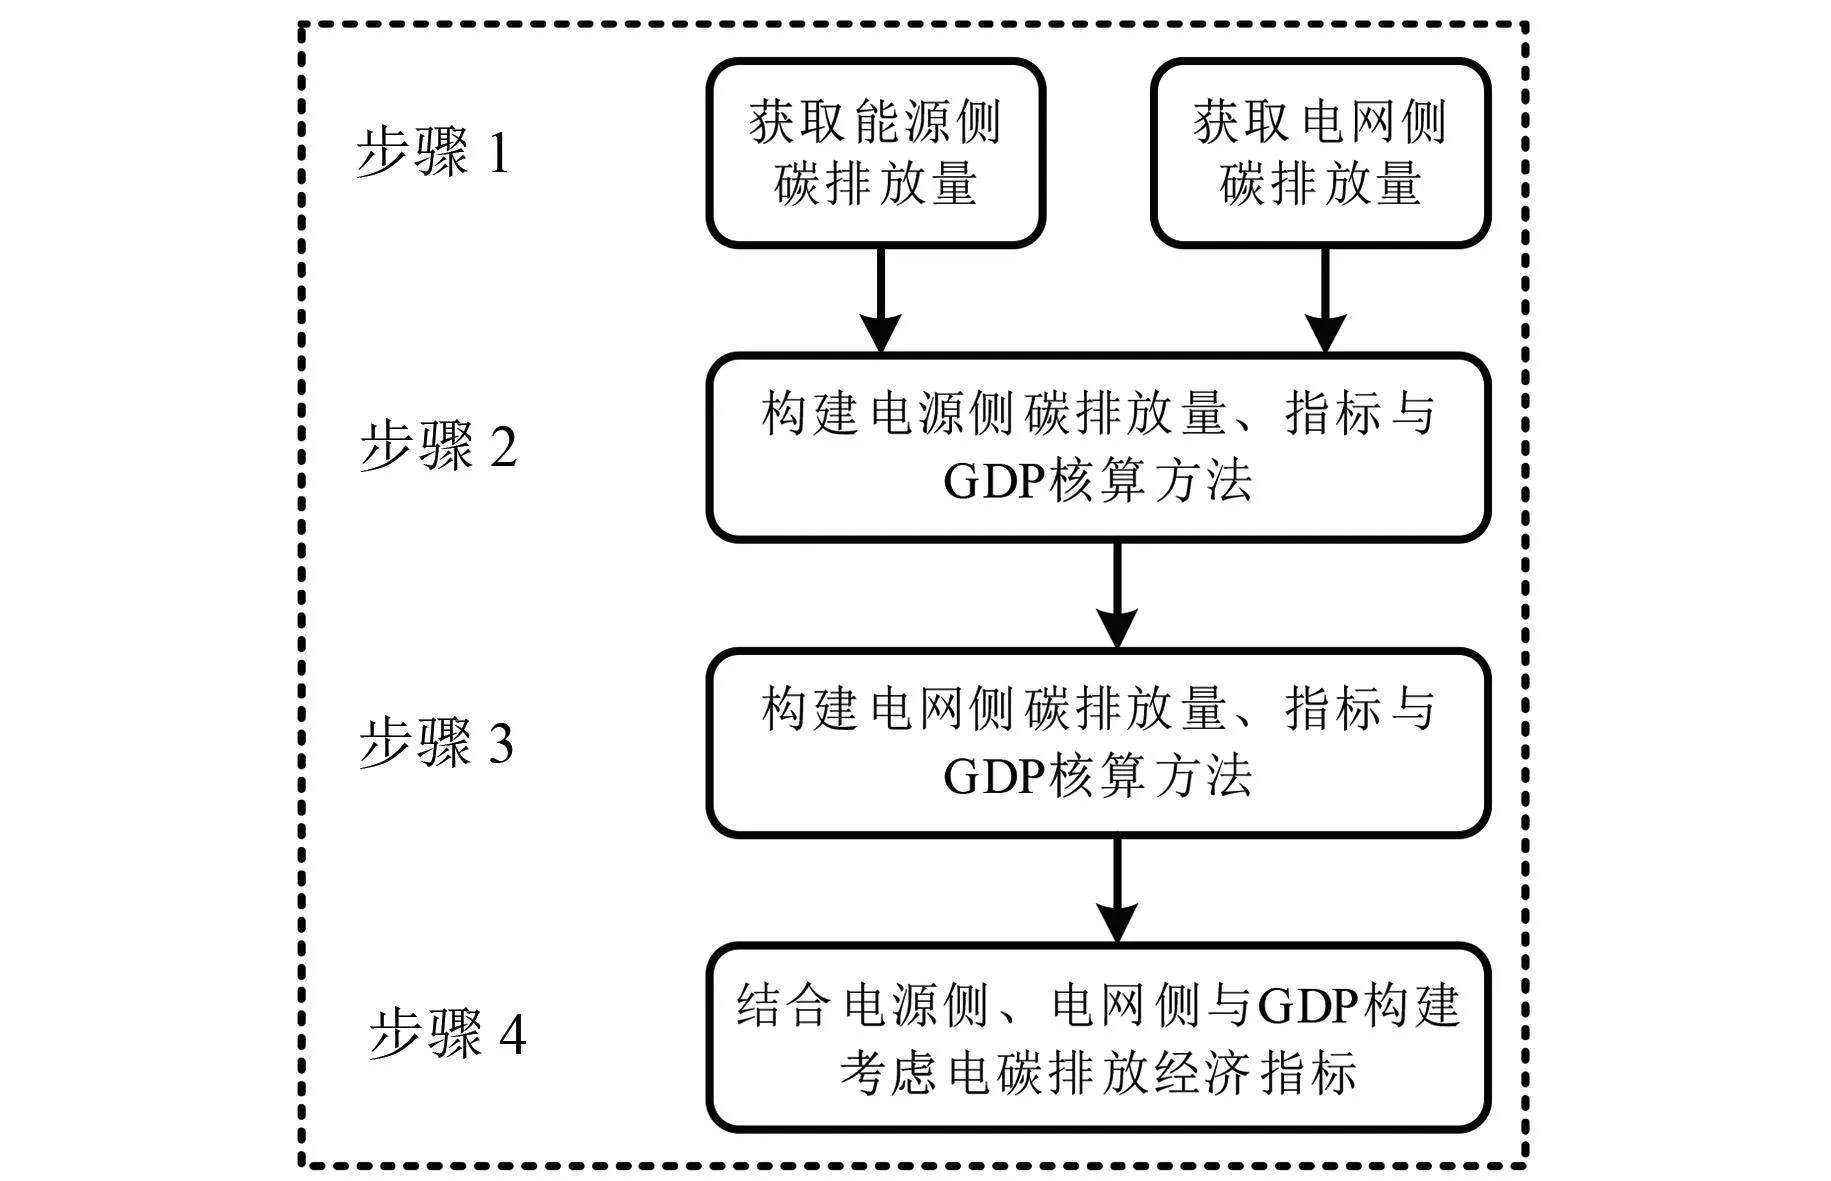
图1 结合电力与经济的电网碳排放指标计算流程
碳排放因子计算如式(7)所示:
Emgrid,i+∑j(EFgrid,j×Eimp,j,i)+

(7)
式中:EFgrid,i为电网i的平均CO2排放因子;Emgrid,i为区域电网i覆盖的地理范围内发电产生的CO2直接排放量;EFgrid,j为向区域电网i净送出电量的区域电网j的平均CO2排放因子;Eimp,j,i为区域电网j向区域电网i净送出的电量;EFk为向区域电网i净出口电量的k国发电平均CO2排放因子;Eimp,k,i为k国向区域电网i净出口的电量;Egrid,i为区域电网i覆盖的地理范围内年度总发电量;i为东北、华北、华东、华中、西北和南方区域电网之一;j为向区域电网i净送出电量的其他区域电网;k为向区域电网i净出口电量的其他国家。
由前述得到的节点负荷、支路潮流中各主网馈线输入的功率结合主网馈线碳排放强度EG,即可计算得到配电网中的碳流分布情况,如下式所示:

(8)

(9)
RGk=Re[SGk]EG
(10)
ΔRGk=Re[ΔSGk]EG
(11)
式中:RLi为负荷i的碳流率,物理意义为负荷i每小时用电产生的等效到发电侧的碳排放量;Rij为支路i-j的碳流率,物理意义为单位时间内随有功潮流通过的碳流量;RGk为节点k注入配电网的碳流率;ΔRGk为节点k承担的网损碳流率。
用户碳排放水平评价指标如表1所示,用于评价实际电网中的用户用碳表现。其中:Cload为用户负荷实时碳流率;Pload为用户负荷实时有功功率;ECload为系统总体碳排放量;Eload为系统总体用电量;ELDlloss为配网线损耗电量;ELDl为配网线路传输电量;ECLlpos为线路正向输电损耗;ECLlrev为线路反向输电损耗;Ewind、Elight、Ewater分别为风力、光伏、水力发电量;Etotal为系统总体发电量;Pwind、Plight、Pwater分别为风力、光伏、水力发电出力量;Ptotal为系统出力。Cload、Pload为实际量测量,由实时监测获得;ECload、Eload、ELDlloss、ELDl、ECLlpos、ECLlrev、Ewind、Elight、Ewater、Etotal、Pwind、Plight、Pwater、Ptotal为统计量,由系统统计获得。
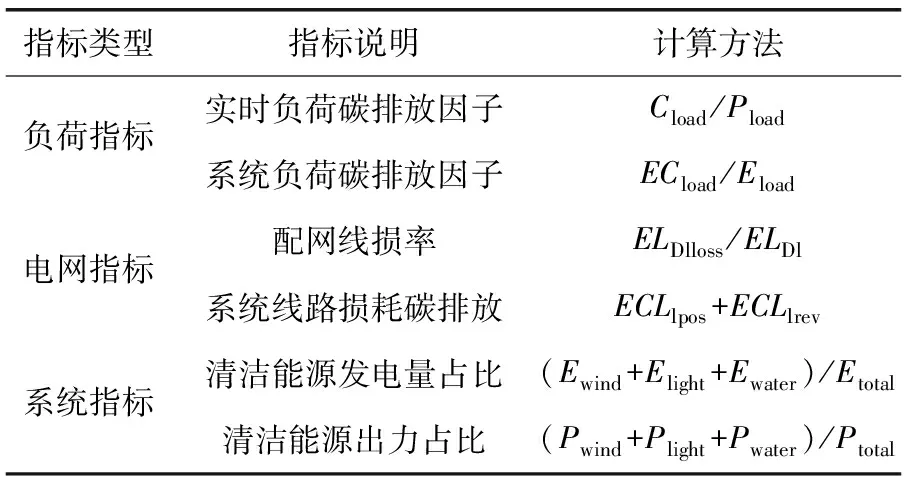
表1 用户碳排放水平评价指标
3 算例分析
本文对东部省份某区域220 kV以上的电网节点进行拓扑构建、节点与线路碳排放量综合评估。其中SCWB与QTB两节点存在区外来电,区外来电碳排放因子取2020年东部省网平均碳排放因子700 g/kWh,其他均为区域内部自发电厂供电,其碳排放因子根据厂站碳排放监测与分析数据进行求解。本算法已部署在该区域碳排放中心,对该区域的碳排放统计与减排实际工作进行指导。
分析可以得到电网碳排放综合态势评估结果,如图2所示,节点的颜色深浅与线路的粗细代表不同的节点负荷碳排放量和线路承载碳排放量的大小。
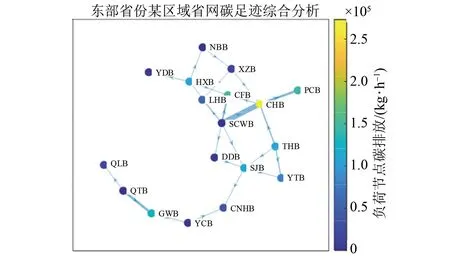
图2 东部省份某区域省网碳足迹综合分析
东部省份某区域电网中碳排放量最高的负荷节点为CHB,碳排放量为272 983 kg/h;碳排放量最高的发电节点为SCWB,碳排放量为579 600 kg/h;承载碳排放最高的线路为SCWB-CHB,碳排放量为334 327 kg/h。
以THB为例,追踪其发电出力及等效碳排放向周边节点的传递过程,THB的总碳排放量为301 370 kg/h。结果如图3及表2所示。线路承载比例指源节点注入某一线路的碳排放占源节点总碳排放量的比例;负荷节点排放比例指某一节点负荷对应的碳排放中来自源节点的碳排放的占比。

图3 THB源-荷追踪结果
由表2可以看出,该发电节点的碳排放主要流向THB自身负荷与YTB负荷节点,占比分别为36.20%与23.45%。
以线路SCWB-CHB为例,追踪其上承载的潮流及等效碳排放的来源节点与目标节点,结果如图4和表3所示。
由表3可以看出,该线路主要碳流来源是SCWB的区外来电;主要碳流目标为CHB、PCB以及CFB等地的负荷。
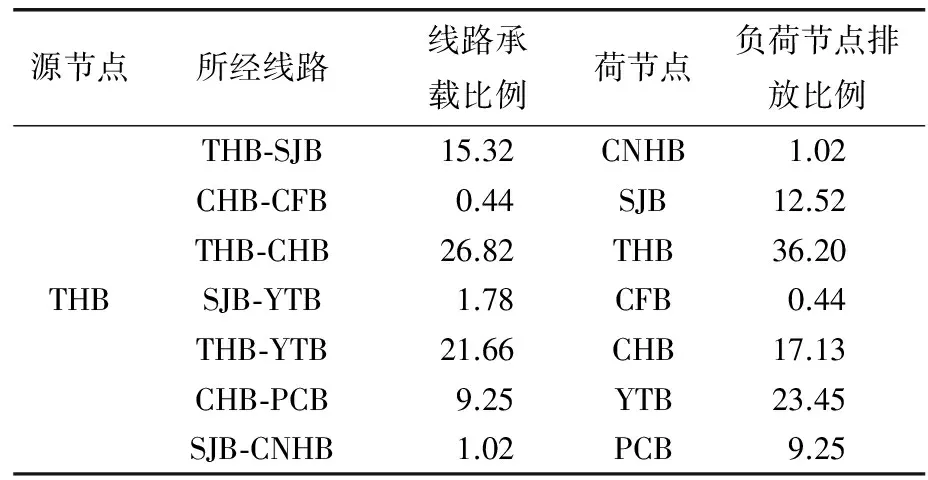
表2 THB源-荷追踪结果
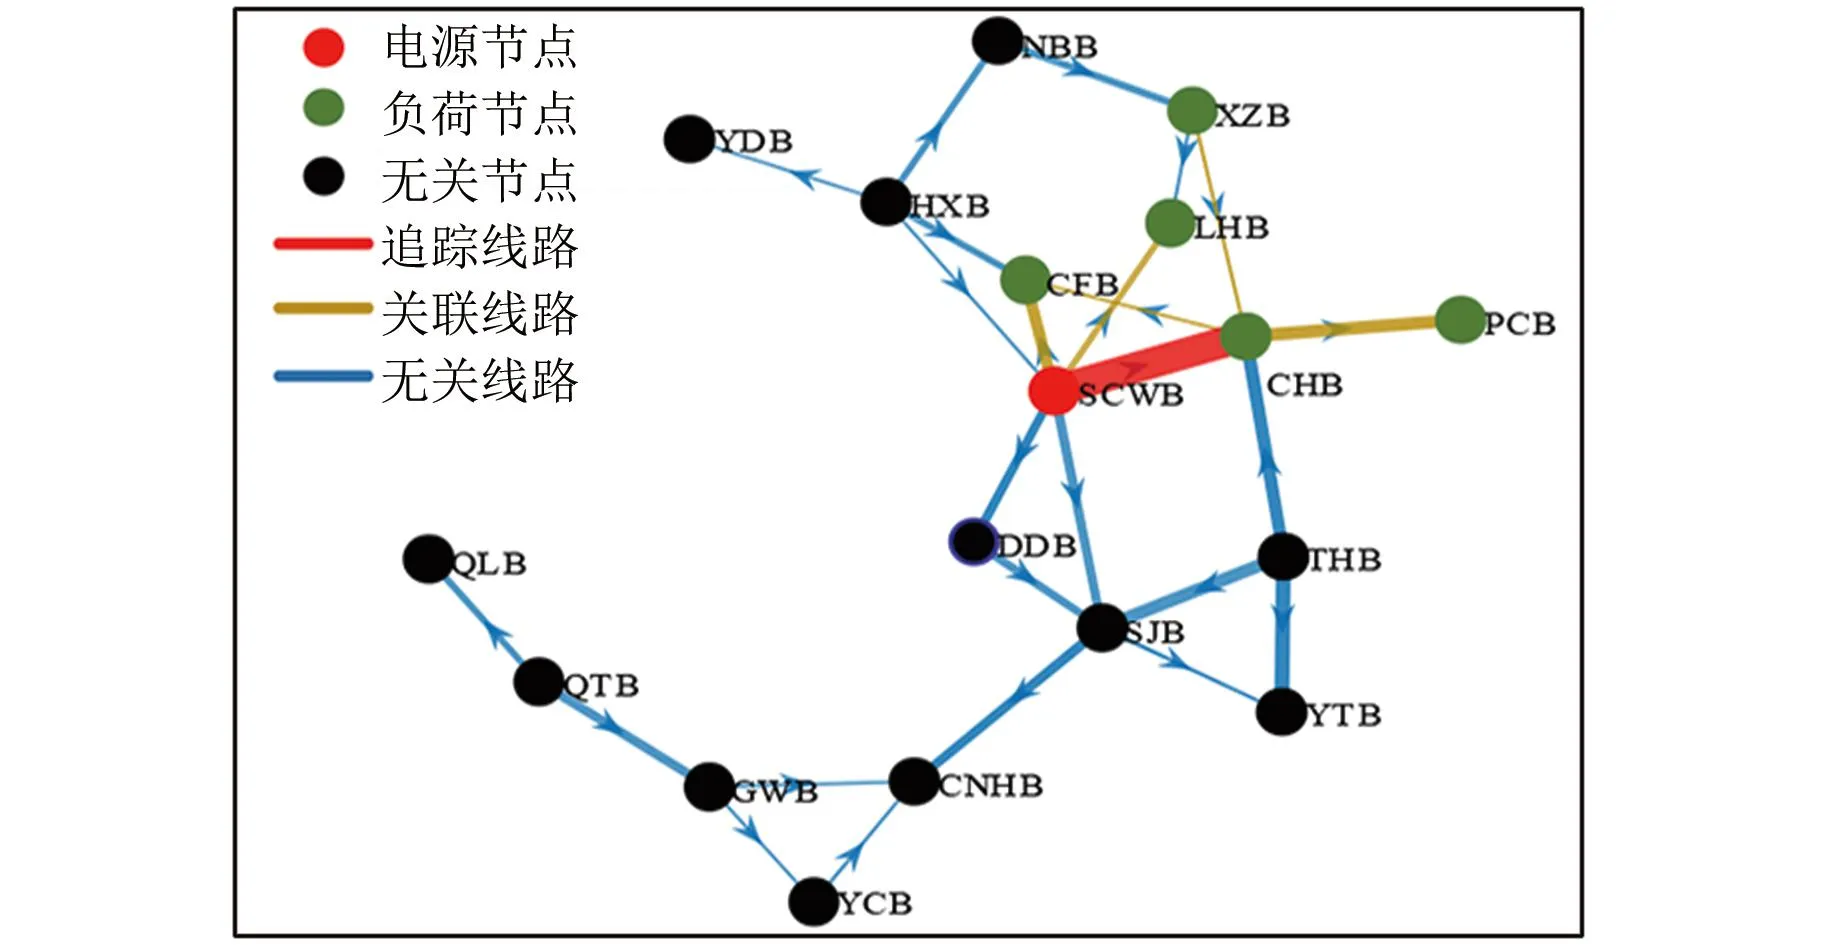
图4 线路双向追踪结果

表3 线路源-荷双向追踪结果
以东部省份某区域一天内负荷平均功率与平均碳排放强度为例,可以计算负荷度电碳排放,如图5所示。

图5 负荷节点清洁程度
将负荷按度电碳排放结果进行清洁程度评估,分为以下几类:非常清洁(400~550 g/kWh):节点12(YDB)、节点18(HXB)、节点16(XZB);一般清洁(550~710 g/kWh):节点9(CFB)、节点3(LHB)、节点10(CHB)、节点13(PCB)、节点2(DDB)、节点17(GWB)、节点8(QLB);不清洁(>710 g/kWh):节点4(CNHB)、节点6(SJB)、节点7(THB)、节点11(YTB)。
以江水源能源站为例,计算典型大功率用户的用能碳排放追踪结果,从而得出用户的整体用能清洁程度如表4所示。

表4 江水源能源站清洁程度
4 结语
本文针对现有技术难以对电网碳足迹进行准确追踪等问题,创新性地提出了基于潮流追踪理论的电网碳追踪技术,提出了碳流网络的建模方法与理论框架,构建了电网节点、支路、网络碳流模型。提出了统一各维度与精度的电碳监测数据的方案,分行业、地区和时间对区域能源系统整体能碳数据进行监测。从源头引入,分析碳排放在一次能源-发电机组-输电网-配电网-用户负荷中的运行态势,在此基础上,结合行业企业数据,分析最终落点碳排放清洁消纳指标。从而计算区域内各类型企业的碳排放,定量测度系统碳排放总量和强度的总体水平。
CalculationandEvaluationMethodofUserCarbonEmissionLevelBasedonPowerFlowTracking
YANG Xiaolin1*, CHEN Hong1, YUAN Qi1, LU Chenyue1, MA Yucheng2, WANG Qi2
(1.Changzhou Power Supply Branch, State Grid Jiangsu Electric Power Co., Ltd., 213003, China;2.School of Electrical Engineering, Southeast University, Nanjing, 210096, China)
Keywords: power flow tracking; carbon emission data; carbon footprint tracking; carbon emission level assessment
The characteristics of new power system user-side ubiquitous resources that are scattered in distribution, large in number, small in capacity and stochastic in nature create difficulties for user-side fine-grained carbon emission calculations. Carbon flow analysis method is a carbon flow tracking method based on power distribution, the basic idea is to determine the power distribution in the power grid by using the downstream or countercurrent tracking algorithm on the basis of the power flow results, and then combine with the carbon emission intensity of the units to fairly distribute the carbon emissions from the power generation side to the loads of each node, the power of each branch and the network loss, so as to achieve accurate tracking and tracing of the specific flow of carbon emissions.
Network loss is an important factor affecting carbon emissions. The carbon flow calculation method based on DC power flow will produce a large calculation error when facing the actual lossy network. Power plants use the grid to supply electricity, and loads are used through the grid. If only one party bears the burden, this results in an unequal sharing of carbon emissions from network damage. In order to accurately measure and assess the level of user carbon emissions in the power system, a method for calculating and evaluating the level of user carbon emissions based on power flow tracking is proposed.
First, the sources of different currents in each node of the power system by means of power flow tracking method is analyzed, so as to determine the indirect carbon emission responsibility of each node.
Second, in accordance with the principle of proportional sharing, this paper combines the carbon intensity of different sources to obtain the distribution of carbon flows in the power system. After allocating the total network losses to the loads or power sources, the original network which will be transformed into a virtual lossless network, and the power generation and consumption of the lossless network will remain balanced. In the lossless network, the net load of nodes and the net output of power supply are known. In addition, the net active current value of each branch is not known. Considering that the virtual network has a tributary loss of 0, the active distribution of each branch can be determined by DC current equation.
Solve the tributary power flow equation to obtain the power of each branch. Then, according to the countercurrent tracking algorithm, active components of each generator in the node load and branch power are recalculated. At this point, the two-way sharing of network loss and the construction of the virtual network have been completed. On this basis, the carbon emission stream can be calculated and analyzed.
Finally, the proposed load-side indicators of various electric power emissions are used to assess the degree of cleanliness of different nodes, so as to guide the users to use more cleaner energy reduce their own carbon emissions.
In order to verify the validity of the proposed method, this paper uses the real power system data from a region in one eastern province as example to ensure the reasonableness and usability.

