Numerical Simulation of Two Degrees Coupled Sloshing of Distributed Liquid Tanks in Ships
-,-,-,-
(1.State Key Laboratory of Ocean Engineering,School of Naval Architecture,Ocean and Civil Engineering,Shanghai Jiao Tong University,Shanghai 200030,China;2.Yantai Research Institute,Harbin Engineering University,Yantai 264000,China;3.Marine Design&Research Institute of China,Shanghai 200011,China;4.Yantai CIMC Blue Ocean Technology Co.,Ltd.,Yantai 264000,China)
Abstract: The distributed liquid tanks are widely used in LNG carriers, aquaculture ships and some other ships.Due to the ship motions in waves, especially the pitching and rolling coupled motions in oblique waves,the liquid sloshing in tanks will take place,which will have a great impact on the living environment and the tank structures in aquaculture ships.Based on the motion data from the aquaculture ship model test,the CFD software STAR-CCM+was used to carry out the numerical simulation of the tank sloshing of an aquaculture ship under single degree of freedom and double degrees of freedom.The magnitude of the sloshing pressure at different frequencies and measuring points were obtained, and the changes of the wave surface and the flow velocity distribution in the tank under different conditions were studied.The measured point pressure values obtained by simulation were compared with the experimental data to verify the accuracy of the numerical simulation method.The results can serve as a reference for the structure strength analysis and optimization of the liquid tanks of aquaculture ships.
Key words:CFD;numerical simulation;distributed liquid tank;2 DOF coupled sloshing
0 Introduction
The development of green and efficient mariculture methods by transitioning from near-shore to deep-sea aquaculture can provide a new direction to the development of the marine aquaculture industry.The aquaculture ship has emerged as an important tool for the transition from near-shore to deep-sea aquaculture[1].A single aquaculture ship often contains multiple tanks that allow hatching and breeding of different marine products[2].The aquaculture ships working in deep-sea regions are affected substantially by the wind and waves on the sea.The swaying motion of the hull in the waves causes tank sloshing,which may not only affect the reliability of the equipment on board and the safety of the hull,but also result in the deaths of marine creatures and serious economic loss.
During tank sloshing, waves with a high amplitude will be generated on the free surface of the liquid.In extreme cases,the free surface may even experience rolling and breaking.These phenomena are highly nonlinear and stochastic,which makes it very difficult to describe them precisely.So far, the slosh dynamics in a tank has been analyzed by researchers from different countries using various methods[3].
The equivalent mechanical model was first proposed to solve the problem of liquid sloshing in aerospace systems[4].Bao[5]discretized the equation of liquid motion using the equivalent mechanical model and obtained the momentum and dynamic moment of the liquid during sloshing.Based on these results, he further derived the direction and moment of the force exerted by the liquid on the entire storage tank during sloshing.The potential flow theory is another important method used to analyze liquid sloshing.Such a method was first used by Faltinsen[6]to solve the problem of liquid sloshing in a tank.As shown in his analysis, the potential flow theory is only applicable in a very limited scenario where geometric structure is relatively simple and liquid filling ratio is greater than 20%.In the case of large-amplitude sloshing,the potential flow theory cannot provide an analytical solution,and its use is limited for analyzing rolling and breaking phenomena of wave surfaces.With the rapid advancement of computer performance in recent years, analysis of liquid sloshing using viscous flow theory has gradually become a hot topic in the research field[7].Liu[8]has constructed tank models with different structures and analyzed the dynamics of slosh with different amplitudes and excited by motion containing one or two degrees of freedom,using the CFD software Fluent.He then obtained the pressure variation at a given point and investigated how the slosh dynamics change under different excitations.Compared to the two other methods described earlier, the viscous flow theory can be applied to a wide range of scenarios for better analyzing the nonlinear motion of liquid or rolling and breaking of waves during sloshing inside a tank.
Some experimental studies can serve as an important reference for understanding the tank sloshing in aquaculture ships.Yamamoto et al[9]analyzed the impact pressures caused by cargo sloshing in large LNG carriers and obtained pressure data on tank walls, which is an important input for optimization of tank structures.Panigrahy et al[10]conducted a series of experiments to study the sloshing behavior due to horizontal movement of liquids in baffled tanks, to investigate the effect of baffle on the sloshing dynamics.In China, Chen et al[11]performed the first experimental study of liquid sloshing in a rectangular tank using a swing bench.They investigated the manner in which liquid sloshing is affected by anti-vibration structure and proposed an equation to estimate the resonance period based on experimental data.In addition to these fundamental studies, Luo[12]established a model to predict tank sloshing that couples with ship motions and used experimental data to analyze their mutual impact.
In this study, the tank sloshing in an aquaculture ship was analyzed by numerical simulation using the volume of fluid (VOF) method in STAR-CCM+.Specifically, the magnitude of the sloshing pressure exerted by sea water on the tank walls as well as the changes in surface waves during the tank sloshing were analyzed.The findings of this study can serve as guidance for further research and development of aquaculture ships.
1 Numerical method
1.1 Governing equation
The mass and momentum conservation of an incompressible flow, expressed by the Reynoldsaveraged Navier-Stokes(RANS)equations,are given by
wherei,j= 1,2;x1andx2represent the horizontal and vertical directions, respectively;u1andu2are the corresponding components of the averaged velocity vector;U'iU'jdenotes the Reynolds stress;U'irepresents the fluctuation component of velocity;Pis the pressure;ρis the density of the fluid; andνis the kinematic viscosity.The Reynolds stressU'iU'jcan be expressed using the turbulent viscosityνTand the averaged flow gradient obtained using Boussinesq approximation is as follows:
The RANS equation can be discretized using the finite volume method in STAR-CCM+.Thek-εturbulence model is used as a closure for the RANS equation.kis the kinetic energy due to turbulence andεis its dissipation rate.
kandεare given by the following equations:
whereνT=Cμ(k2/ε).
1.2 Volume of fluid(VOF)method
Tracking the location of the free liquid surface at an instance is a key issue for analyzing the sloshing tank problem.Currently, there are two primary methods for determining the free surface:the interface tracking method and the interface capturing method.The VOF multiphase model is an interface capturing method capable of predicting the location and movement of the interface between immiscible liquids.The interface itself is represented by the scalar field of volume fractionαi,given by
whereViis the volume of Phaseiin the cell andVis the total volume of the cell.
Based on the value of volume fraction as shown below,we can determine if a specific cell is occupied by one or more phases/liquids:
αi= 0—the cell does not contain any Phasei
αi= 1—the cell is fully occupied by Phasei
0<αi<1—interfaces exist between different phases in the cell
1.3 Realization of liquid sloshing in tank
The method for realizing liquid sloshing in a tank is critical for the accuracy of numerical simulations.Fig.1 shows the distribution of tanks in the aquaculture ship.The ship has 15 tanks in total.A single tank at the bow is arranged in the center, and the remaining tanks are arranged symmetrically in two rows.

Fig.1 Distribution of tanks in the aquaculture ship
In this study,the liquid tank was designed with a length of 0.448 m,a width of 0.392 m,and a height of 0.4 m.Sloshing behavior was realized by the following steps:
(1)Obtaining motion data of the aquaculture ship:By conducting a pool model test of the aquaculture ship, its dynamic response under varied conditions with different wave angles and wavelength-to-ship length ratios was obtained.
(2) Selecting a target aquaculture tank for calculation: The primary objective of this study was to investigate the effect of rolling and pitching on the liquid sloshing in a tank of the aquaculture ship.In case of rolling motion with a single degree of freedom,the tanks located on both sides of the ship would move with the same amplitude.Therefore,tanks located on either side could be selected and used for subsequent analysis,such as A8 or A9.In case of pitching motion with a single degree of freedom, the amplitude of movement would increase with the increase of the distance from the center of gravity of the ship.At the same time, the impact of liquid on tank walls and the change of wave surface during sloshing would become more complicated.Therefore, an aquaculture tank A1 was selected for subsequent analysis.In case of ship motion with two degrees of freedom, it would be necessary to consider the impact of both rolling and pitching.Even in this case, the aquaculture tank A1 was selected.
(3)Generating liquid sloshing in a single tank:Considering rolling motion with a single degree of freedom as an example, since both rolling and pitching proceeded around the center of gravity of the ship,we could construct a local coordinate systemo-xyzwith the origin set at the center of gravity, as shown in Fig.2.Then, the tank model could be set to rotate around thex-axis, which would pass through the origin of the local coordinate system.The liquid tank rotated periodically around the axis of rotation with a rotation speed ofu=-aωcosωt.Here,aandωare the amplitude and frequency of the rolling motion respectively.Thus, we could successfully realize liquid sloshing in the tank.
(4) Tracking impact pressure on tank walls, wave surface changes, and distribution of flow velocities:Three different pressure measurement points were established at the long side of liquid surface inside the tank;the short side;and a corner of the tank,as shown in Fig.3.Pressure changes at these three points were monitored and recorded during the entire simulation.The changes in wave surface were monitored by creating an isosurface with volume fraction set as 0.5.Finally,two planar sections were created along the length and width of the tank to monitor changes in flow velocity inside the tank.
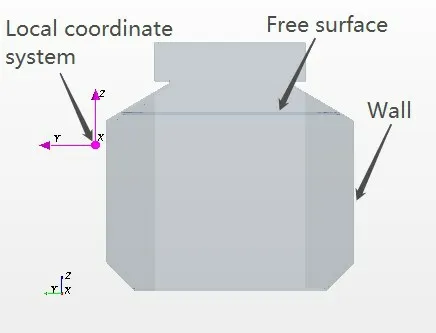
Fig.2 Flow domain inside the tank,boundary condition,and local coordinate system
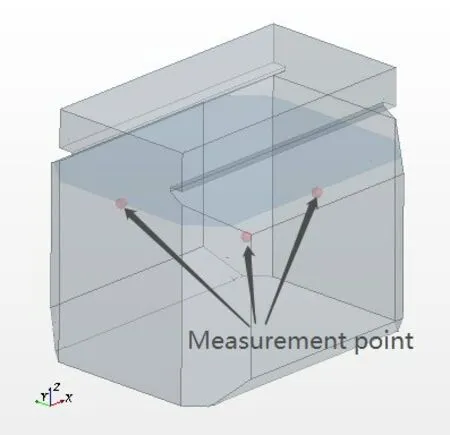
Fig.3 Location of pressure measurement points in the liquid tank
1.3.1 Accuracy verification of the numerical simulation method
In order to validate the numerical simulation method adopted in this study, we reproduced the 2D liquid sloshing process reported by Xu et al[13]and validated the results against the data shown in their study.Specifically, a numerical model was constructed using the same liquid tank model and identical parameter settings.By performing the numerical simulation,we obtained the temporal trajectory of wave on the right wall of the liquid tank.The result was then compared with that reported by Xu et al as well as the analytical solution obtained by Faltinsen[6]based on potential flow theory.
Fig.4 shows a schematic of the liquid tank used in the validation simulation.The lengthLand heightHof the tank are both 1 m.When the tank is at rest, the liquid inside the tank has a static height ofh=0.5 m.As the tank starts to move periodically along thex-axis due to an external force,liquid sloshing occurs inside the tank with different amplitudes and frequencies.For a given liquid tank with fixed geometric dimensions, the intrinsic sloshing frequency of the liquid is determined by the liquid depth.Faltinsen provided an equation to calculate the intrinsic sloshing frequency in a 2D liquid tank as follows:
wherenrepresents thenth intrinsic frequency of the liquid,dis the loading height,Lis the tank width,andgis the gravitational acceleration.
Using this equation, the intrinsic frequency of the tank model described above was calculated to be 5.134 rad/s.The 2D rectangular tank was subjected to an external excitation with a velocity given byu= -bω1cosω1t,wherebandω1are the amplitude and frequency of the horizontal excitation respectively.In our validation simulation, the amplitude of displacement generated by horizontal excitation was calculated to beb= 0.01 m.The excitation frequency wasω1= 0.5ω.The temporal change of the wave height was further calculated over 10 s from the simulation.
As shown in Fig.5, the numerical simulation conducted in this study reproduced the liquid sloshing process in a 2D tank well.Since Faltinsen obtained the analytical solution based on the potential flow theory without considering the influence of fluid viscosity,there is a 7.7%error with the result calculated by the CFD method in this paper.But on the whole,the results of this paper are in good agreement with those of Xu et al and Faltinsen's analytical solution.Therefore, the simulation method developed in this study can effectively realize liquid sloshing in a tank.
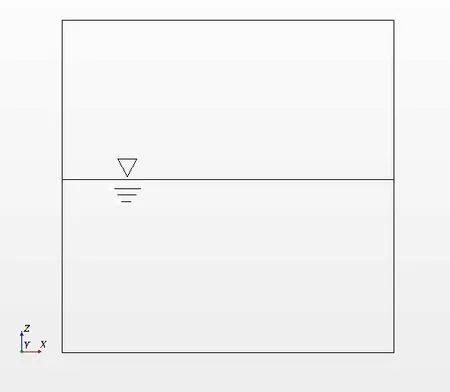
Fig.4 Schematic of the rectangular liquid tank

Fig.5 Temporal change of the wave height on the right wall of the tank obtained by different methods
1.3.2 Mesh convergence analysis
When simulating liquid sloshing in a tank,increasing the mesh resolution can provide more accurate description of the flow dynamics in the tank.However, employing a very fine mesh will require significantly higher computational resources.Therefore,selecting a proper mesh size is a critical step for conducting numerical simulations.In this study, a mesh convergence analysis was performed on the liquid sloshing simulation using three different base mesh sizes (500 000,1 000 000,and 1 800 000 cells).In each case, the pressure data at the measuring point on the long side of the tank were collected at an identical time step.The convergence curve could then be plotted by comparing these three pressure data.
As shown in Fig.6, the pressure at the measuring points on the long side of the tank changes quite significantly when the total number of cells is increased from 500 000 to 1 000 000.However,the simulation result barely changes when the total number of cells is further increased to 1 800 000.Based on the convergence curve, we could confirm that a cell number of 1 000 000 is sufficient to provide an accurate simulation result.Therefore, all the subsequent simulations were conducted using the same mesh parameters as above.Fig.7 shows the meshing of the entire liquid tank with 1 000 000 cells.
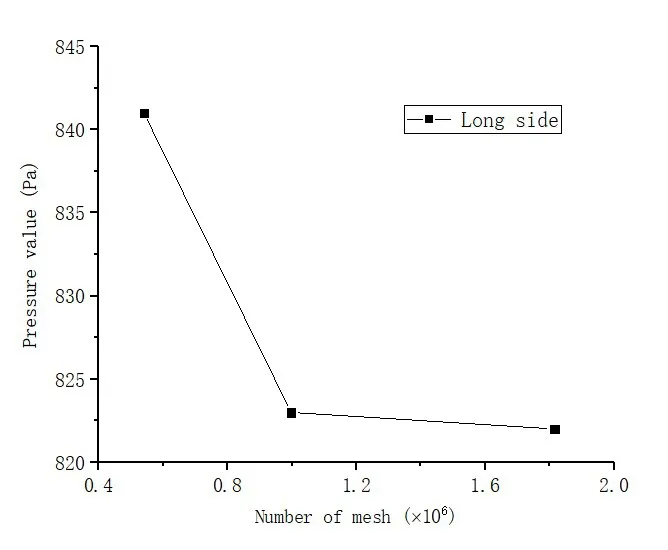
Fig.6 Mesh convergence curve

Fig.7 Mesh of the liquid tank
2 Numerical simulation results and comparison with experimental tests
The physical object of our experimental test is a deep-sea aquaculture ship with a displacement of 111 200 tons.A 1:50 scaled prototype of the actual ship was used for our experiment.The structure of the tank constructed in the scaled prototype was exactly the same as that in the real ship.During experimental test, the impact pressure on the tank walls was measured using surfacemount pressure sensors installed on the long and short sides of the tank along the water plane, as well as a corner of the tank.The dynamic response of the aquaculture ship model and the corresponding impact pressure were measured under five different wave angle conditions:head sea at 0°,bow sea at 45°,beam sea at 90°,quartering sea at 135°,and following sea at 180°.When the wave runs at 90°to the ship's heading,the motion of the aquaculture ship is dominated by rolling.In contrast,when the wave runs at 0°and 180°to the ship's heading,the motion of the aquaculture ship is dominated by pitching.When the wave strikes the ship at 45°or 135°,the aquaculture ship will roll and pitch simultaneously,both of which will have a significant effect on liquid sloshing in the tank.In this study, numerical simulations were performed to investigate liquid sloshing in the tank subject to an external excitation with two degrees of freedom.
2.1 Comparison and analysis of the results obtained with a single degree of freedom
During pitching motion with a single degree of freedom,the ship model only pitched with a relatively small angle.Therefore, the liquid remained relatively stable and almost no waves were observed on the free surface inside the tank.The pressure values measured in our tests were attributed to the fluctuations in liquid during pitching and were found to be most significant on the short side and corner region of the tank.Therefore,we compared the pressure values measured at these two locations under different pitching frequencies,as shown in Figs.8-11.
For ship rolling tests with a single degree of freedom,we compared the impact pressure recorded at the measuring points on the long side and corner region of the tank under different rolling frequencies.The results are shown in Figs.12-13.
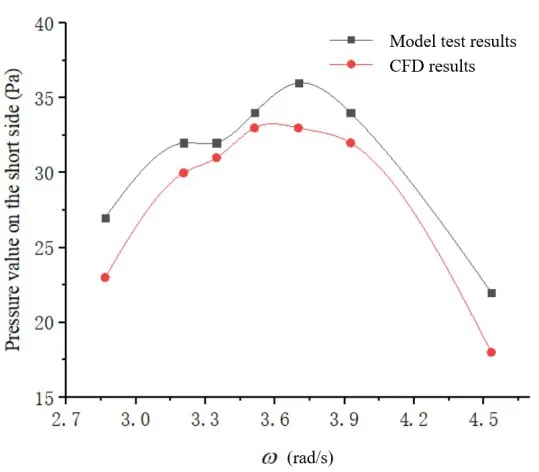
Fig.8 Pressure change on the short side of the tank with frequency increasing under head sea(0°)

Fig.9 Pressure change at the corner region of the tank with frequency increasing under head sea(0°)
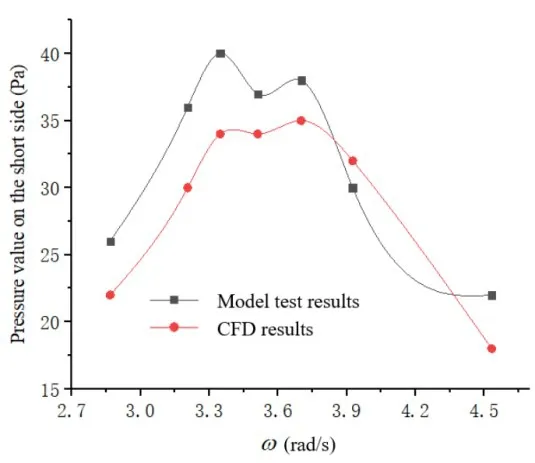
Fig.10 Pressure change on the short side of the tank with frequency increasing under following sea(180°)
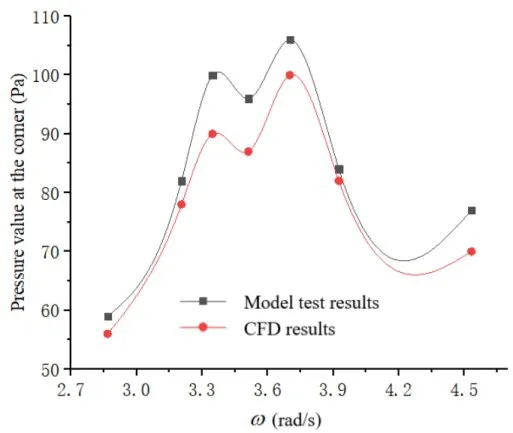
Fig.11 Pressure change at the corner region of the tank with frequency increasing under following sea(180°)

Fig.12 Pressure change on the long side of the tank with frequency increasing under beam sea(90°)
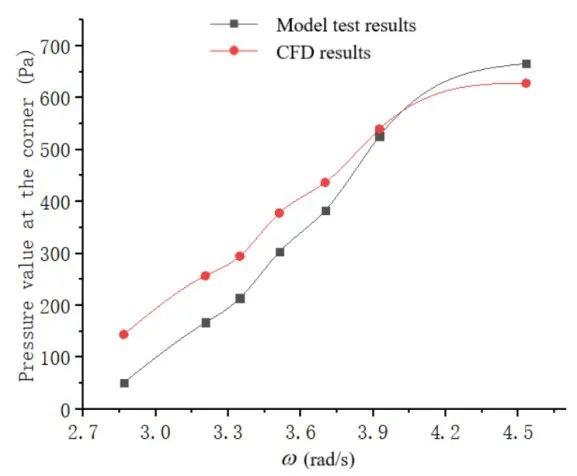
Fig.13 Pressure change at the corner region of the tank with frequency increasing under beam sea(90°)
Due to accuracy limitations of the experimental setup,the pressure values recorded at the measuring points deviate slightly from the real values.In addition, the motion of the liquid inside the tank becomes highly nonlinear and stochastic when the sloshing amplitude is sufficiently high.However, only a limited number of tests was performed in this study due to cost limitations.Furthermore,in the numerical simulations and experimental tests,data were collected only from a few dozen cycles.As a result, due to smaller sampling size, certain deviations exist between the simulation and experimental results.Nevertheless,the following assertions can be made by comparing the simulated values and experimental data of liquid pressure collected at the measuring points.The pressure data obtained from numerical simulations deviate only marginally from that obtained by measurements.Both the numerical and experimental curves exhibit a common trend, along with a reasonable range of deviation from each other.In the cases of head and following seas, the ship only pitches with a small amplitude and the fluctuation pressures measured at the short side and corner region of the tank are relatively small during liquid sloshing.Therefore, the pressure values at the measuring points were significantly smaller during pitching than those during rolling.As the pitching frequency approaches the extreme value, the liquid sloshing becomes more severe in the tank and nonlinear effects become increasingly evident.Consequently, the deviation between simulation and experimental results becomes more significant.In the case of beam sea, the ship will undergo severe rolling motion,which results in a high fluctuation pressure at the long side and corner region of the tank.Such a high pressure will adversely affect the structural strength of the tank.Therefore,the strength of the tank must be checked carefully.
2.2 Calculating the sloshing characteristics in tank at the intrinsic frequency
According to the literature, liquid sloshing is often two-dimensional when excited by ship motion containing a single degree of freedom.Therefore, the intrinsic frequency of sloshing with a single degree of freedom can be calculated using the empirical equation Eq.(7).However,it can only be used in case of a 2D rectangular tank.When ship undergoes rolling,the projection of the tank in thex-axis direction becomes rhombic and the empirical equation cannot be applied.Consequently,the intrinsic frequency of liquid sloshing with a single degree of freedom was calculated only for pitching in this study, which was worked out to be 8.73 rad/s.Due to the experimental limitations, the pitch motion data of the ship model could not be obtained at this frequency.Therefore, the pitching angle at which the impact pressure on the short side of the tank reaches the maximum under head sea condition was selected and used to calculate the characteristics of liquid sloshing in the tank.
Figs.14-17 show the evolution of wave surface in the tank, over a certain time window, while the ship undergoes pitching at the intrinsic frequency.Att=9.37 s, the wave reaches the maximum height at the left wall of the tank and the pressure becomes zero at the measuring point on the right short side of the tank.Att=9.57 s, the pitching angle decreases and the wave surface gradually becomes flat.Meanwhile,a single wave develops at the center of the tank.As the simulation proceeds,
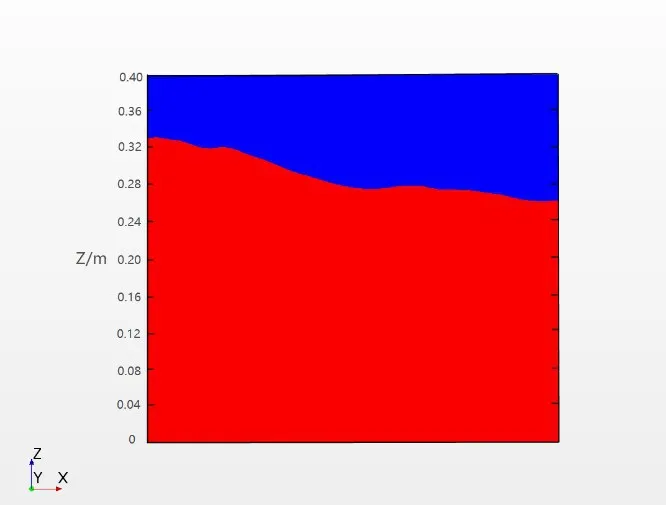
Fig.14 Movement of the wave surface at t=9.37 s

Fig.15 Movement of the wave surface at t=9.57 s

Fig.16 Movement of the wave surface at t=9.62 s
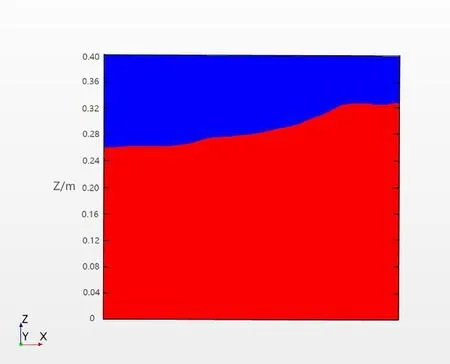
Fig.17 Movement of the wave surface at t=9.74 s
the inertial force of the liquid becomes stronger.Att=9.62 s, another solitary wave evolves toward the right and the wave surface starts to climb along the right wall of the chamber.Att=9.74 s,the inertial force of the liquid is equilibrated with the gravitational force, and the wave surface reaches the maximum height on the right wall.At this moment,the pressure value at the measuring point on the short side also reaches a maximum.Subsequently, the gravitational force becomes dominating,and the wave starts to fall back, leading to a new cycle of wave movement.
Fig.18 compares the pressure values recorded on the short side of the tank at test and intrinsic frequencies.Here, it is evident that the liquid sloshing is much stronger at the intrinsic frequency and the corresponding impact pressure on the tank walls is much larger than that obtained at the test frequency.However, since the maximum pressure is attained at a relatively small pitching angle, no significant rolling or breaking is observed on the wave surface.In addition, the wave does not hit the roof of the tank during the simulation.
2.3 Comparison and analysis of the results obtained with two degrees of freedom
The motion of the ship model becomes much more complicated under bow sea (45°) and quartering sea (135°) conditions.In these cases, it is difficult to describe the dynamic condition of the flow behavior inside the tank accurately by numerical simulation with only a single degree of freedom.In order to describe the flow of liquid in the tank under real conditions more accurately, both the rolling and pitching data of the ship were collected during tests in bow sea and quartering sea conditions.Subsequently,numerical simulations of liquid sloshing in tank were performed using excitations containing two degrees of freedom.The pressure data at the measuring points collected from experiments and simulations were then compared with each other.
It becomes rather difficult to simulate liquid sloshing when aquaculture ship is struck by a wave from an angle.In case of bow sea (45°), significant difference exists between simulation results and experimental values of pressure measured on the long and short sides of the tank at the frequency of 3.9 rad/s.However, as shown by the overall comparison of the pressure data in Figs.19-24, the numerical simulations conducted using excitations with two degrees of freedom could still capture the characteristics of liquid sloshing effectively.Compared to the results obtained using excitations with a single degree of freedom, the motion of the liquid surface becomes more chaotic when subjected to excitations containing two degrees of freedom.This chaotic feature was not obvious during the first few cycles of simulation.As shown in Figs.25-26, significant local fluctuations and wrinkles were observed on the liquid surface in the simulations conducted with two degrees of freedom.These features,absent in the simulations conducted with a single degree of freedom,represent a higher level of disorder in liquid motion.The liquid tank undergoes periodic movements throughout the simulation.However, the periodicity of the pressure curve becomes worse over the time and nonlinear features start to become more evident.Due to the high filling rate of liquid inside the tank and the existence of a closure structure on the top region of the tank, no significant rolling or breaking of waves was observed in the tank.The waves,however,did hit the roof during the simulations.These features suggest that the closure structure at the top of the tank can inhibit liquid sloshing effectively.Furthermore,the plate installed at the closure structure is susceptible to strong instantaneous impact during liquid sloshing.Therefore,its strength should be checked carefully.
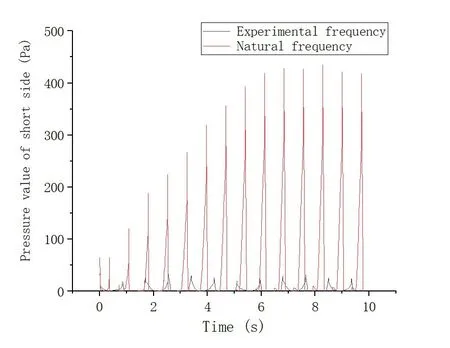
Fig.18 Comparison of pressure values obtained at test and intrinsic frequencies
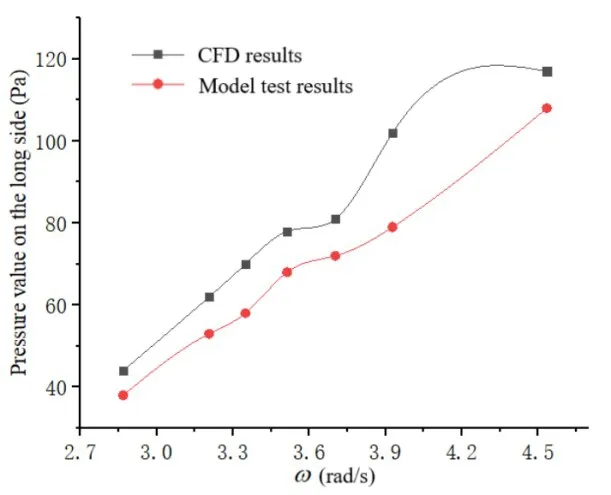
Fig.19 Pressure change on the long side of the tank with the frequency increasing under bow sea(45°)
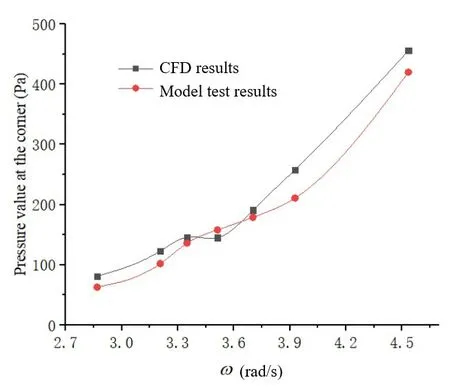
Fig.21 Pressure change at a corner of the tank with the frequency increasing under bow sea(45°)
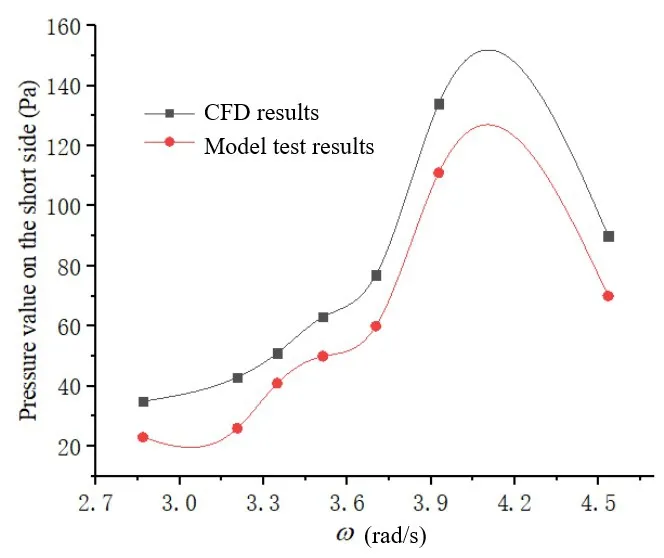
Fig.23 Pressure change on the short side of the tank with the frequency increasing under quartering sea(135°)

Fig.20 Pressure change on the short side of the tank with the frequency increasing under bow sea(45°)

Fig.22 Pressure change on the long side of the tank with the frequency increasing under quartering sea(135°)
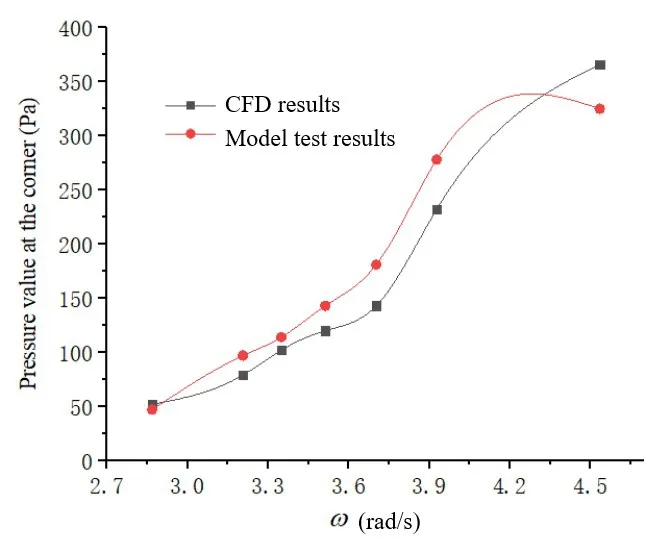
Fig.24 Pressure change at a corner of the tank with the frequency increasing under quartering sea(135°)
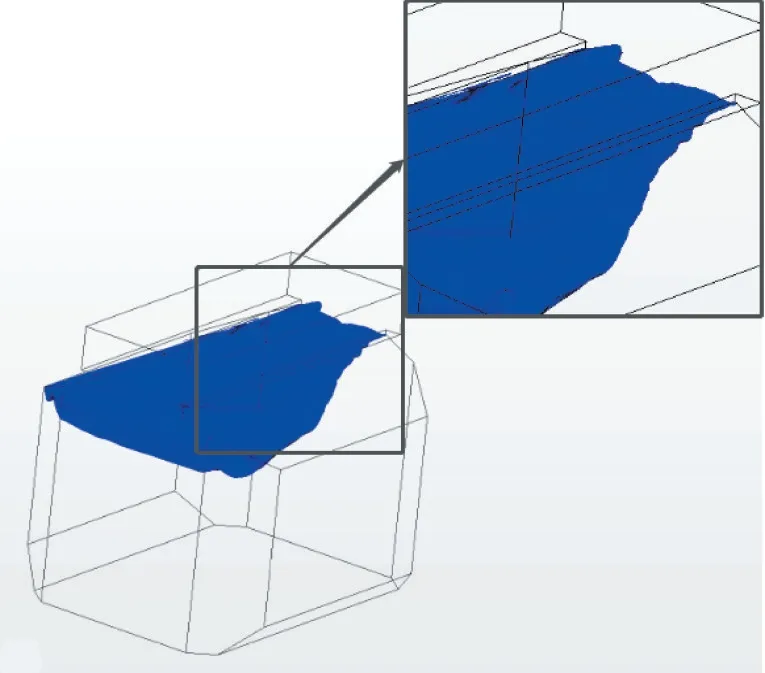
Fig.25 Evolution of the wave surface at t=7.94 s

Fig.26 Evolution of the wave surface at t=9.58 s
Figs.27-29 show the pressure values collected at the same measuring point under excitations containing a single degree and two degrees of freedom.As shown in the figures,the pressure recorded at the same measuring point can become substantially different under different test conditions.This variation is attributed to the differences between ship motion data collected during experimental tests under different conditions.As shown by the comparison of pressure on the short side of the tank,the pressure obtained from simulations with a single degree of freedom is smaller than that obtained with two degrees of freedom due to the smaller value of pitching amplitude used in the simulations.In addition, the pressure curve obtained in bow sea (45°) is quite different from that obtained in quartering sea (135°)because of the effects from the two degrees of freedom.As shown by the comparison of pressure data on the long side of the tank, the pressures obtained with wave angles of 45°and 135°are much smaller than that obtained with a wave angle of 90°.This is because the ship undergoes intensive rolling when a wave strikes the ship at an angle of 90°.The high amplitude of ship rolling provides a more dominating effect than the two degrees of freedom of ship motion.As shown by the comparison of pressures at the corner region of the tank, the data obtained during pitching motion with a single degree of freedom is generally smaller at all frequencies due to small pitching angles.However, for simulations conducted for waves at an angle of 90°, the ship undergoes rolling with a very large angle.Therefore, the highest pressure is obtained in the simulations when the ship rolls with a single degree of freedom.The simulations conducted with two degrees of freedom yield intermediate pressure values.As shown by these results, the motion amplitude has a direct impact on the pressure at the measuring point.

Fig.27 Comparison of pressure at the measuring point on the short side of the tank obtained with a single degree and two degrees of freedom
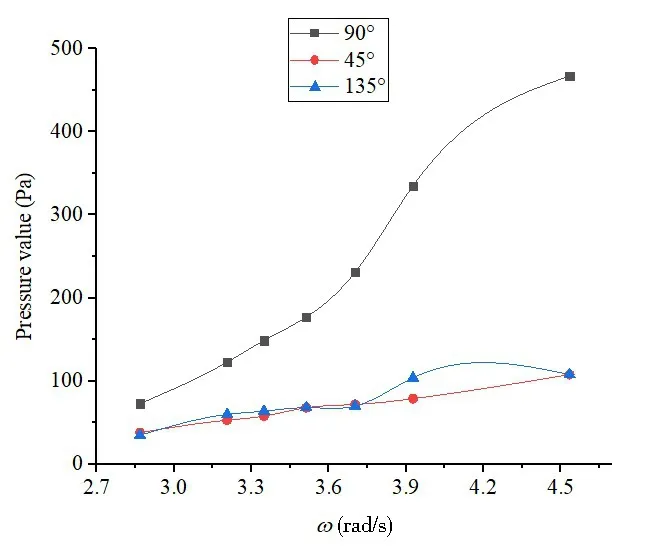
Fig.28 Comparison of pressures at the measuring point on the long side of the tank obtained with a single degree and two degrees of freedom
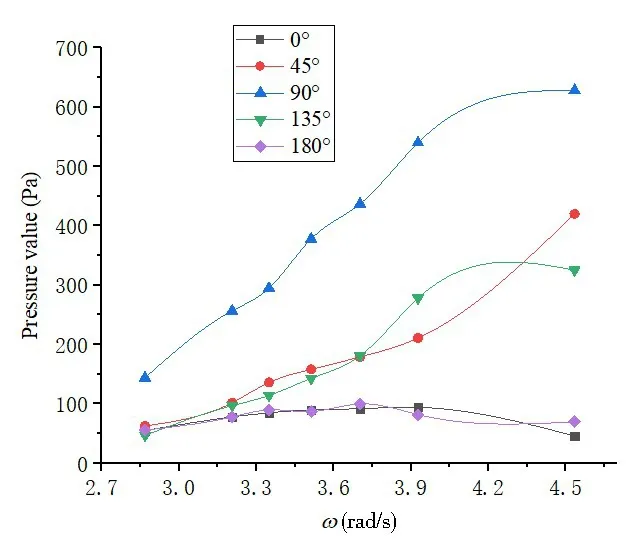
Fig.29 Comparison of pressures at the measuring point at a corner of the tank obtained with a single degree and two degrees of freedom
Figs.30-31 show the comparison of the pressures at different measuring points in simulations conducted with two degrees of freedom.For simulations conducted in bow sea (wave angle=45°)and quartering sea(wave angle=135°),the pressure obtained on the long side of the tank is very close to that on the short side at all the frequencies.In addition, both pressures become slightly higher with the frequency increasing.The pressure obtained at a corner of the tank is larger than those obtained on the long and short sides of the tank.Such a difference becomes higher with the frequency increasing.These features are attributed to the special structure at the corner region which, to a certain extent, inhibits the sloshing effect in the tank.As a consequence, a relatively large dynamic pressure is experienced in the corner region.

Fig.30 Comparison of the pressures at the different measuring points under bow sea(45°)
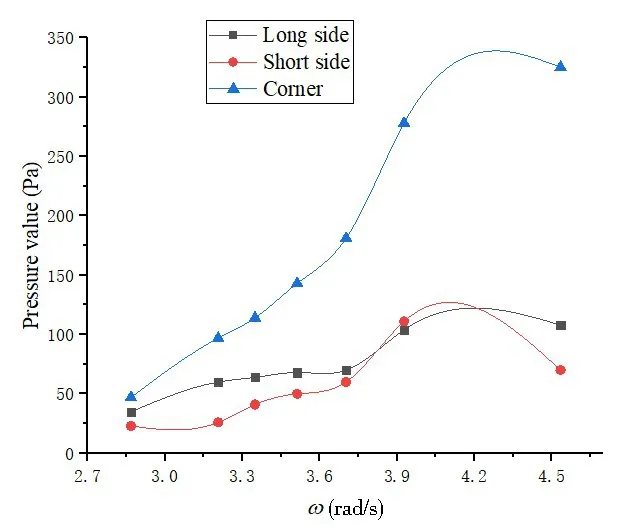
Fig.31 Comparison of the pressures at the different measuring points under quartering sea(135°)
Figs.32-35 show the distribution of the dynamic pressure on the tank walls obtained from the simulations when the ship undergoes rolling (single degree of freedom), pitching (single degree of freedom), and motions with two degrees of freedom.As shown in the figures, the dynamic pressure is significantly higher at the corner region in simulations conducted with a single degree of freedom.Such a trend is more evident when the ship undergoes rolling.The corner structure causes the dynamic pressure to be more concentrated during rolling than pitching.Therefore, the rolling motion has a greater impact on the structural strength of the tank than the pitching motion.In simulations conducted with two degrees of freedom, the distribution of the dynamic pressure is no longer symmetrical on the walls due to the combined effect of rolling and pitching.In particular, the dynamic pressure increases in relation to the distance from the center of gravity of the ship.The greater the distance,the larger the linear velocity of the tank during swinging,and the severer the liquid sloshing.Therefore, the maximum pressure is always observed on the tank walls at the farthest location away from the center of gravity of the ship despite the change of wave angle.In addition, as shown by the distribution of dynamic pressure obtained from the simulation with two degrees of freedom,the maximum dynamic pressure on the walls always appears below the free surface.While the free surface has a high velocity, the inertial force is quite small, which fails to provide a high dynamic pressure on the walls of the tank.On the other hand, while the velocity of water decreases with the increase of depth,the inertial force keeps increasing at the same time.Therefore,the dynamic pressure continues to increase and eventually reaches the maximum value at certain depth below the free surface.
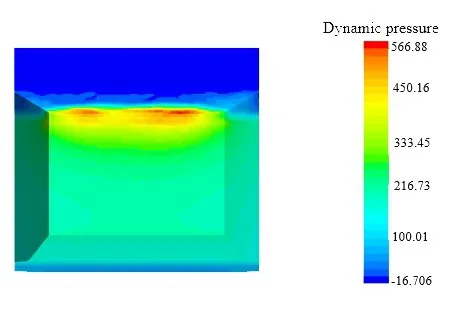
Fig.32 Distribution of the dynamic pressure on the long side of the tank wall at t=8.96 s obtained during rolling with a single degree of freedom
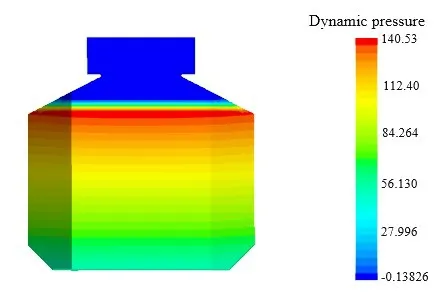
Fig.33 Distribution of the dynamic pressure on the short side of the tank wall at t=8.65 s obtained during pitching with a single degree of freedom
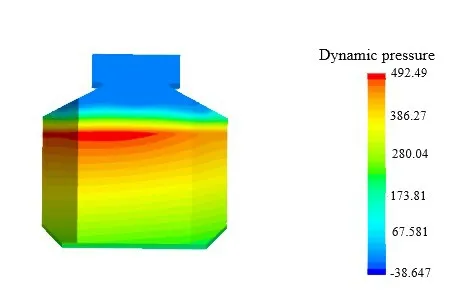
Fig.34 Distribution of the dynamic pressure on the short side of the tank wall at t=8.46 s obtained with two degrees of freedom
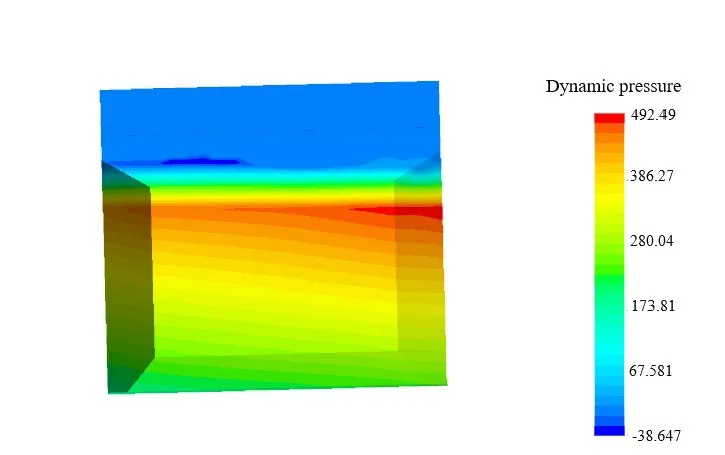
Fig.35 Distribution of the dynamic pressure on the long side of the tank wall at t=8.46 s obtained with two degrees of freedom
Figs.36-39 show the velocity distribution of the liquid inside the tank under different test conditions.For simulations conducted with a single degree of freedom,the velocity distribution is more orderly inside the tank.In particular, the liquid velocity becomes smaller toward the central region but larger toward the tank walls under both rolling and pitching motions.The flow of liquid is impeded at the corner region of the tank, which results in a relatively small velocity in that region.In general, the water tends to flow quite smoothly inside the tank.However, different characteristics were observed in simulations conducted with two degrees of freedom.Once sloshing occurs,the flow velocity becomes much larger at the free surface.During the flow process, the free surface will strike and rebound from the tank walls,which intensifies the local flow velocity.During the sloshing process, the velocity becomes generally higher and the variation of the velocity becomes more stochastic inside the tank.The distribution of the velocity field becomes more disordered and chaotic than that observed in simulations with a single degree of freedom.
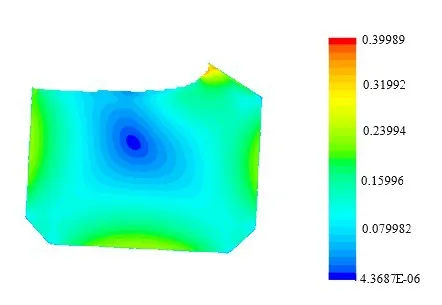
Fig.36 Velocity distribution inside the tank at t=7.69 s obtained during rolling with a single degree of freedom
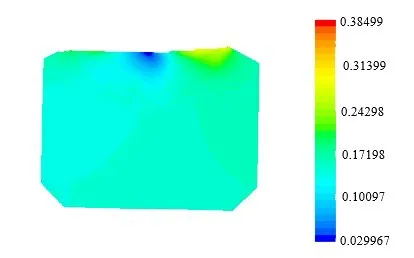
Fig.38 Velocity distribution inside the tank at t=10 s obtained with two degrees of freedom
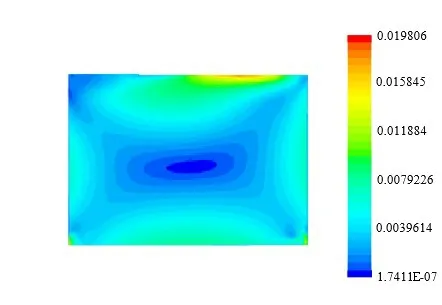
Fig.37 Velocity distribution inside the tank at t=8.42 s obtained during pitching with a single degree of freedom
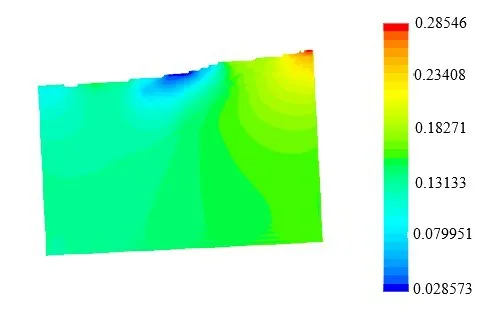
Fig.39 Velocity distribution inside the tank at t=11.2 s obtained with two degrees of freedom
3 Conclusions
Based on the structure of a liquid tank in an aquaculture ship and the motion data of ship model collected from experiments, numerical simulations were performed to investigate the dynamics of liquid sloshing inside the tank.Some conclusions are reached as follows:
(1)The single degree of freedom sloshing simulation results indicate that the swing angle is significantly larger during rolling than that during pitching at the same frequency.Therefore,the pressure at the measuring points during rolling motion is significantly larger than that during pitching motion.The magnitude of the pressure calculated from simulations is very close to the experimental measurements.
(2) At the intrinsic frequency, liquid sloshing becomes more severe, which results in a significantly higher impact pressure on the tank walls.However, no breaking of waves was observed, nor did the waves hit the roof of the tank.
(3) The two-degree-of-freedom simulation results indicate that the liquid sloshing is excited by ship motion containing two degrees of freedom (i.e., rolling and pitching), the flow of the liquid surface becomes more chaotic inside the tank.Nonlinear features also start to become more evident.
In this study,the pressure variation inside the tank during sloshing was predicted using numerical simulations.The simulation results were in good agreement with the experimental results.The results can serve as an important reference for further research related to the liquid tank optimization of aquaculture ships.
Acknowledgements
The authors would like to express their gratitude to the Towing Tank Lab and Deep-water Basin Lab of HEU for the model test results of the aquaculture ship, and for the funding of Key R&D Projects of Shandong Province(2020CXGC010702).
- 船舶力学的其它文章
- Experimental Study on Generation and Evolution of Three-dimensional Freak Waves
- A Numerical Study of Wave-Structure Interactions for a Square Structure with Different Submerged Depths
- Freezing Process Simulation of Standing Water Droplets Under Different Supercooling and Contact Angles
- Load-bearing Characteristic Analysis of Marine Sandwich Composite Structures with Bi-modulus
- Analysis on Plastic Responses of Metal Foam Sandwich Beams under Low Velocity Repeated Impacts
- An Improved Prediction Method for Structural Response Analysis of Offshore Wind Turbines

