
Shear behaviours and roughness degeneration based on a quantified rock joint surface description
2023-12-14 12:13:38ShuboZhngGngWngYujingJingChngshengWngFengXu
矿业科学技术学报 2023年10期
Shubo Zhng ,Gng Wng,b, *,Yujing Jing ,Chngsheng Wng ,Feng Xu
a Shandong Provincial Key Laboratory of Civil Engineering Disaster Prevention and Mitigation, Shandong University of Science and Technology, Qingdao 266590, China
b College of Civil Engineering, Fujian University of Technology, Fuzhou 350118, China
c Graduate School of Engineering, Nagasaki University, Nagasaki 852-8521, Japan
Keywords:Rock joint Roughness Shear behaviour Wear Asperity
ABSTRACT The asperity wear of rock joints significantly affects their shear behaviour.This study discusses the wear damage of the asperities on the joint surface,highlighting the roughness degradation characteristics during the shear process.The direct shear experiment of artificial specimens containing rock joints was conducted under different normal stresses based on three-dimensional scanning technology.These experimental results showed the contribution of joint wear to roughness degeneration,such as the height,zone,and volume of asperity degeneration.The wear coefficient of the rock joint was obtained based on the volume wear of asperities in the laboratory experiment.The functional relationship between the friction coefficient and wear coefficient is subsequently determined.To quantitatively analyse the wear damage of a joint surface,a calculation method for determining the wear depth of the rock joint after shearing was proposed based on wear theory.The relationship between the ultimate dilation and wear depth was analysed.A coefficient m,which can describe the damage degree of the joint surface,and a prediction method of joint surface roughness after shearing are established.Good agreement between analytical predictions and measured values demonstrates the capability of the developed model.Lastly,the sensitivity factors on the wear depth are explored.
1.Introduction
The strength,deformability,and permeability of rock masses in nature are greatly affected by joints.Most joint surfaces are irregular,and these asperities are essential factors affecting rock joint mechanical properties and shear behaviour [1].In fact,the failure of asperities is closely related to the stability of geotechnical engineering,such as water and mud inrush at joints[2-4],slope sliding and mining district instability [5-7],and differential settlement due to foundation sliding [8].In addition,the study of asperity wear on joint surfaces often responds to the fluid flow in fractures and rock permeability [9,10].Therefore,understanding the wear behaviour of rock joint asperities has significant implications for engineering safety and scientific research.
The joint surface is composed of many asperities with different shapes and sizes.The degradation of these asperities constitutes the macroscopic shear failure characteristics of joint surfaces.Therefore,studying the shear mechanics and morphology of joint surfaces has become an unavoidable problem [11-13].Patton[14] determined that the frictional characteristics,failure characteristics,and shear dilatancy are the important factors influencing the shear strength of rock joints.Barton and Choubey [15] noted the importance of joint roughness to wear damage and proposed a roughness coefficient (JRC) to characterize joint morphology.Asadollahi et al.[16] optimized the original Barton model.The new model can describe the degradation of surface roughness more comprehensively and predict the shear shrinkage behaviour under small shear displacement.Leong and Randolph[17]attributed roughness degradation to ploughing asperities on the surface.Li et al.[18] noted the influence of critical asperities on the shear strength of rock joints.Jiang et al.[19]studied the effect of the anisotropic morphology of rock joints on shear behaviour and discussed the anisotropic wear damage of rock joint asperities.However,the quantitative calculation of the wear loss of joint surfaces is still a scientific problem that has yet to be solved entirely.The parameters that quantify asperity wear or degradation during shearing have not been sufficiently studied,and the quantitative relationship between microdamage and macroscopic shear strength remains unclear.To better understand the shear strength rules of rock joints,the wear patterns of rock joints should be further studied.Unfortunately,due to the complexity of asperity changes during shearing,the roughness of the rock discontinuity surface can only be measured after shearing,and it is difficult to predict the depth of wear in advance [20].
Tribology is a field of science that studies interacting surfaces in relative motion,including related disciplines and practices [21].Wear has always been a focus issue in friction research.For a long time,people have observed that wear behaviour is often accompanied by the interaction of rough surfaces.The loss of industrial products is caused by wear,which brings profound economic losses.Researchers around the world have explored the evolution of wear through theoretical analysis and experimental research.However,friction and wear have not only been studied in industrial products but also extensive research has been conducted on the wear in rock joint shearing.When the asperities on two opposite joint surfaces are sheared,wear and gouging will occur [22].Archard [23] proposed the adhesion wear theory to characterize the evolution process of adhesion wear.The equation has been successfully used in numerical simulations and has been recognized worldwide.Zhao et al.[24] focused on the volume loss of rough rock joints caused by shearing.They proposed a new rock joint damage coefficient based on Archard wear theory.Therefore,the remaining research challenge is to relate the wear behaviour to the shear behaviour and parameterize and quantify the roughness loss of the joint surfaces after shearing.
This study describes the evolution of wear on joint surfaces under direct shear.Four types of rock joints with different roughness are sheared under different normal stresses.Combined with graphics processing and point clouds of the joint surface,the relationship between fracture geometry and shear behaviour is clarified.Finally,based on the theory of wear,a theoretical method for determining wear depth and a coefficientmthat can quantitatively represent the degree of wear are developed.In addition,the sensitivity factors of the new model are analysed.
2.Experiment preparation
2.1.Joint surface morphology characterization
The granite samples were collected from the water-sealed oil depot area of Huangdao,Qingdao City,China.The underground water-sealed caverns project of the Huangdao National Petroleum Reserve is one of the second phase projects of the China National Petroleum Reserve.It is the first large-scale underground watersealed cavern project in China.Rough joint surface samples were prepared by a splitting test.A cubic granite block size of 100 mm×100 mm×100 mm(length×width×height)was split axially.The three-dimensional laser scanner was used to acquire the joint surface profile information.The scanning accuracy of the digital model is as high as 0.05 mm.The basic process of creating a point cloud dataset and the scanned joint surface morphology are shown in Fig.1.
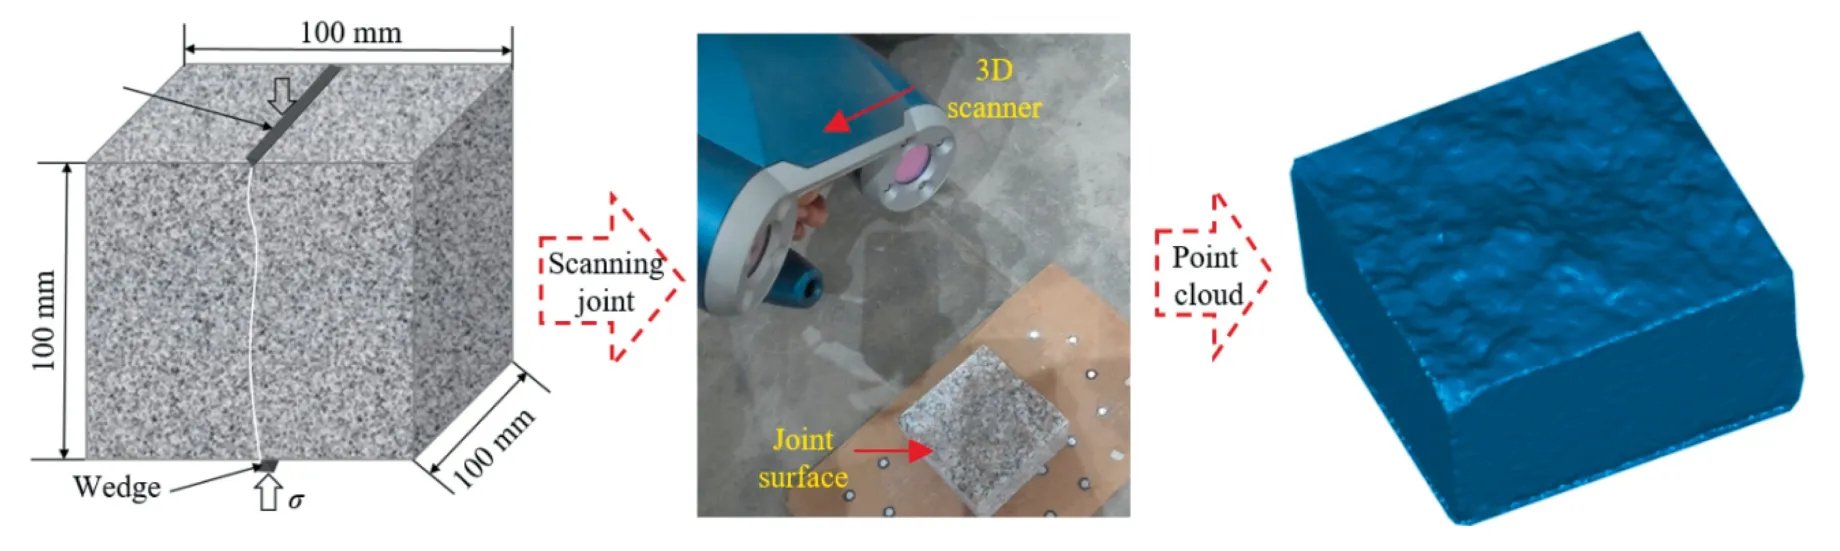
Fig.1.Preparation and laser scanning of the three-dimensional joint specimen.
Grasselli et al.[25] observed a large number of rock joint surface morphologies and conducted direct shear tests.He found that the shear strength of the joint surface is related to the contact area in the shear direction and proposed a statistical function relationship between the effective apparent dip angle of the microelement and the corresponding contact area.The Grasselli parameter is a real parameter that can describe the three-dimensional joint surface morphology.The description method of the threedimensional joint surface can be divided into two steps.First,the point cloud information of the rock joint surface is obtained through a three-dimensional laser scanner,and the point cloud data are dispersed into triangular elements using Matlab.Then,the three-dimensional shape parameters are calculated through a statistical function,as shown in Fig.2.The specimens are labelled GA,GB,GC,and GD according to the roughness [26],as shown in Table 1./(C+1)is the Grasselli roughness parameter,whereA0is the ratio between the area of the triangle elements with an effective dip angle greater than 0 and the total area of the joint surface;Cthe fitting coefficient to describe the distribution of the apparent dip angles;andthe maximum apparent dip angle,(°).
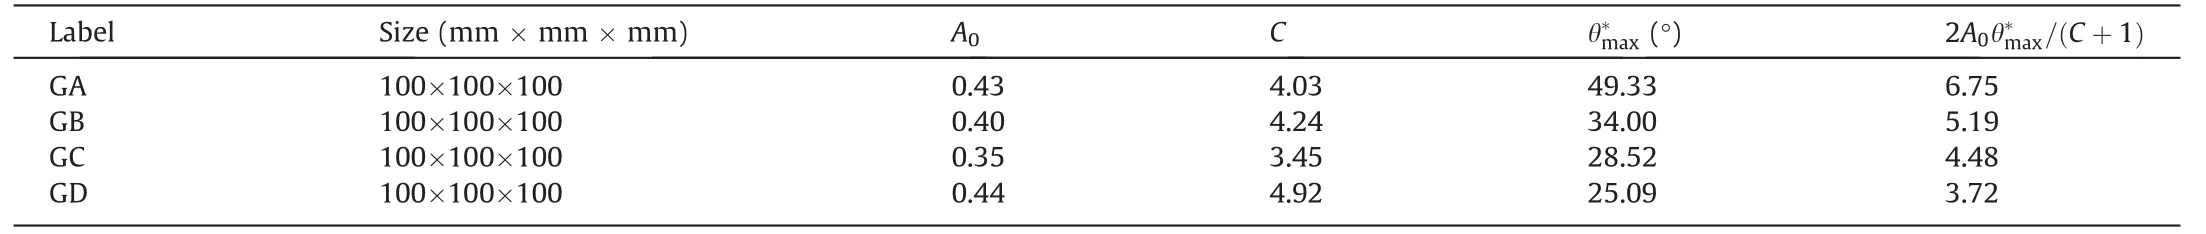
Table 1 Joint surface morphology parameters of the specimens.
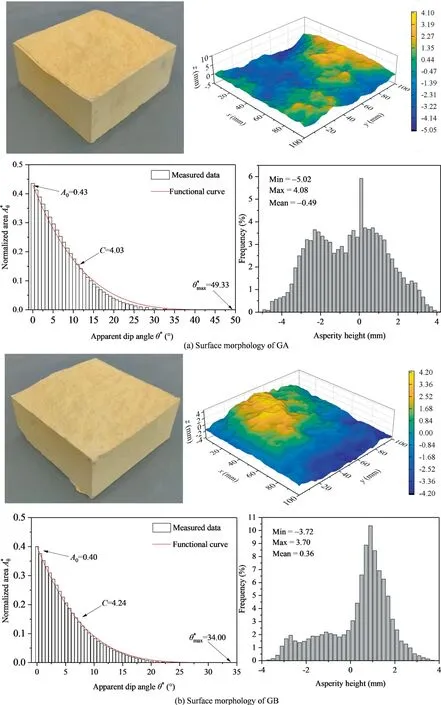
Fig.2.Statistics of rough joint surface morphology.
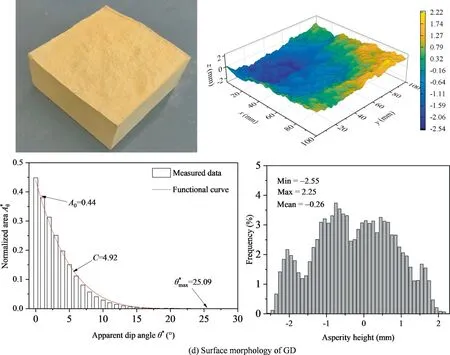
Fig.2 (continued)
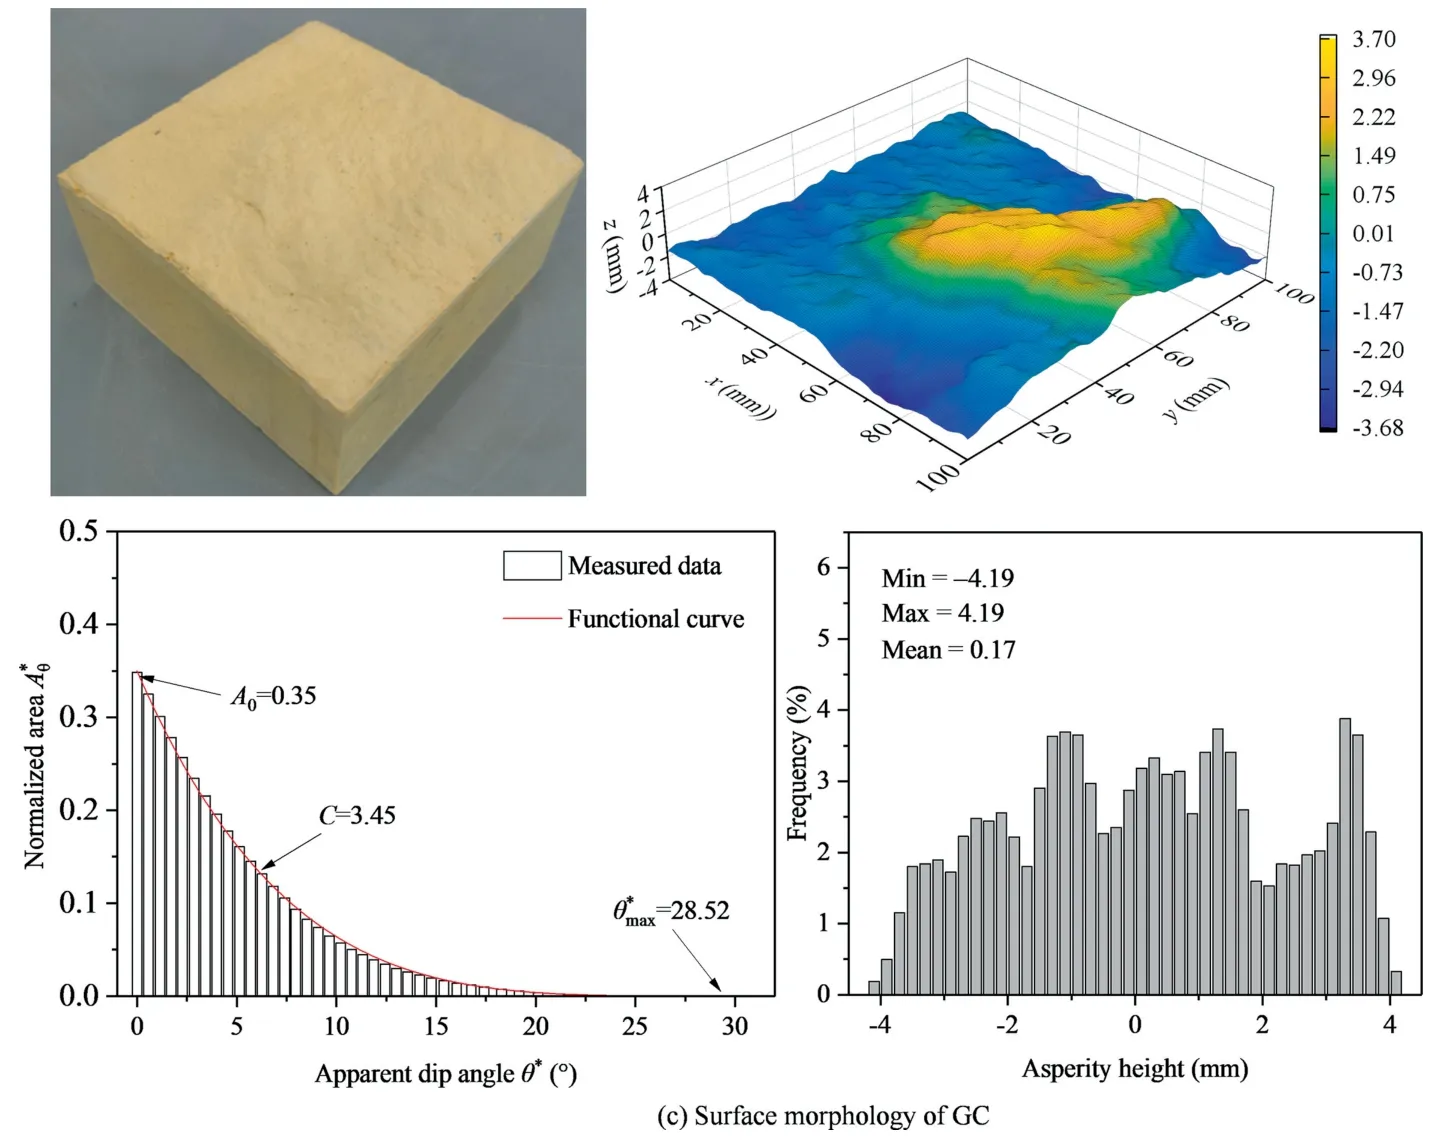
Fig.2 (continued)
2.2.Specimen configurations
The rock-like material is selected for the direct shear test to obtain the same joint surface morphology.The rock-like material is a mixture of high-strength gypsum,water,and retarder in the proportion of 1∶0.2∶0.005 (weight ratio) [27].The initial setting time of high strength gypsum is 8 min,and the expansion coefficient after hardening is less than 0.02%.The split rough rock was placed inside the steel mold box,and then the mixed rock-like material was poured into the box.After hardening,the prepared rock-like specimen was used as the mold to prepare another rock-like specimen.The specimens were cured at room temperature for approximately 10 d,and three identical specimens were made for the same set of experiments.Table 2 shows the physical and mechanical properties of the rock-like material.
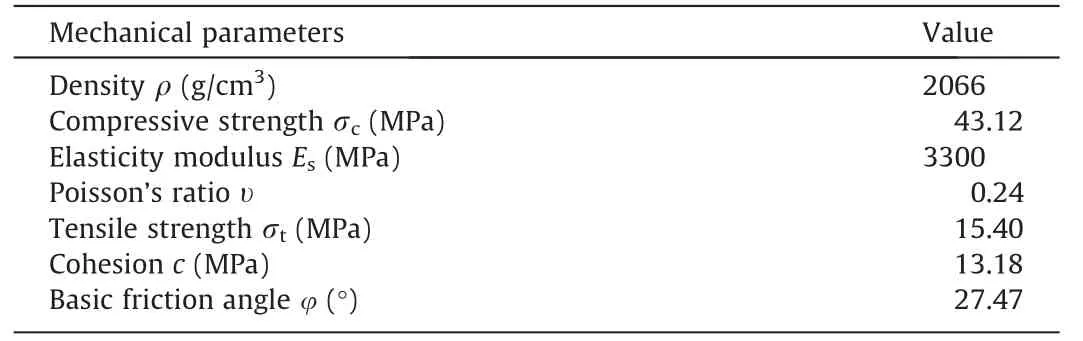
Table 2 Rock-like specimen parameters.
The TJW-1000 shear-seepage coupling testing machine was used in the experiment.The shear loading system adopts linear hydraulic cylinder loading mode and adopts high-precision digital controller imported from Germany.This measurement and control device has multiple measurement channels and can perform closed-loop control on any of them.The device was equipped with a high-resolution measurement system that does not require range division.It has a high resolution of ±250000 yards,allowing for high-precision measurement.This device can perform nonlinear correction on the force and deformation collected by sensors,thereby greatly improving measurement accuracy.The load sensor measures the load value,and the displacement sensor measures the displacement of the oil cylinder.The measured force and displacement values are fed back to the EDC controller to form a closed-loop control system and realize accurate control,as shown in Fig.3.The shear rate was 0.6 mm/min[28],and the normal loads(σn) were 0.5,1.0,1.5,and 2.0 MPa.The rock joints of different roughness were repeated,with each group of 3 specimens having the same roughness.The shear strength and displacement of rock joints with different roughness and normal strengths are recorded.
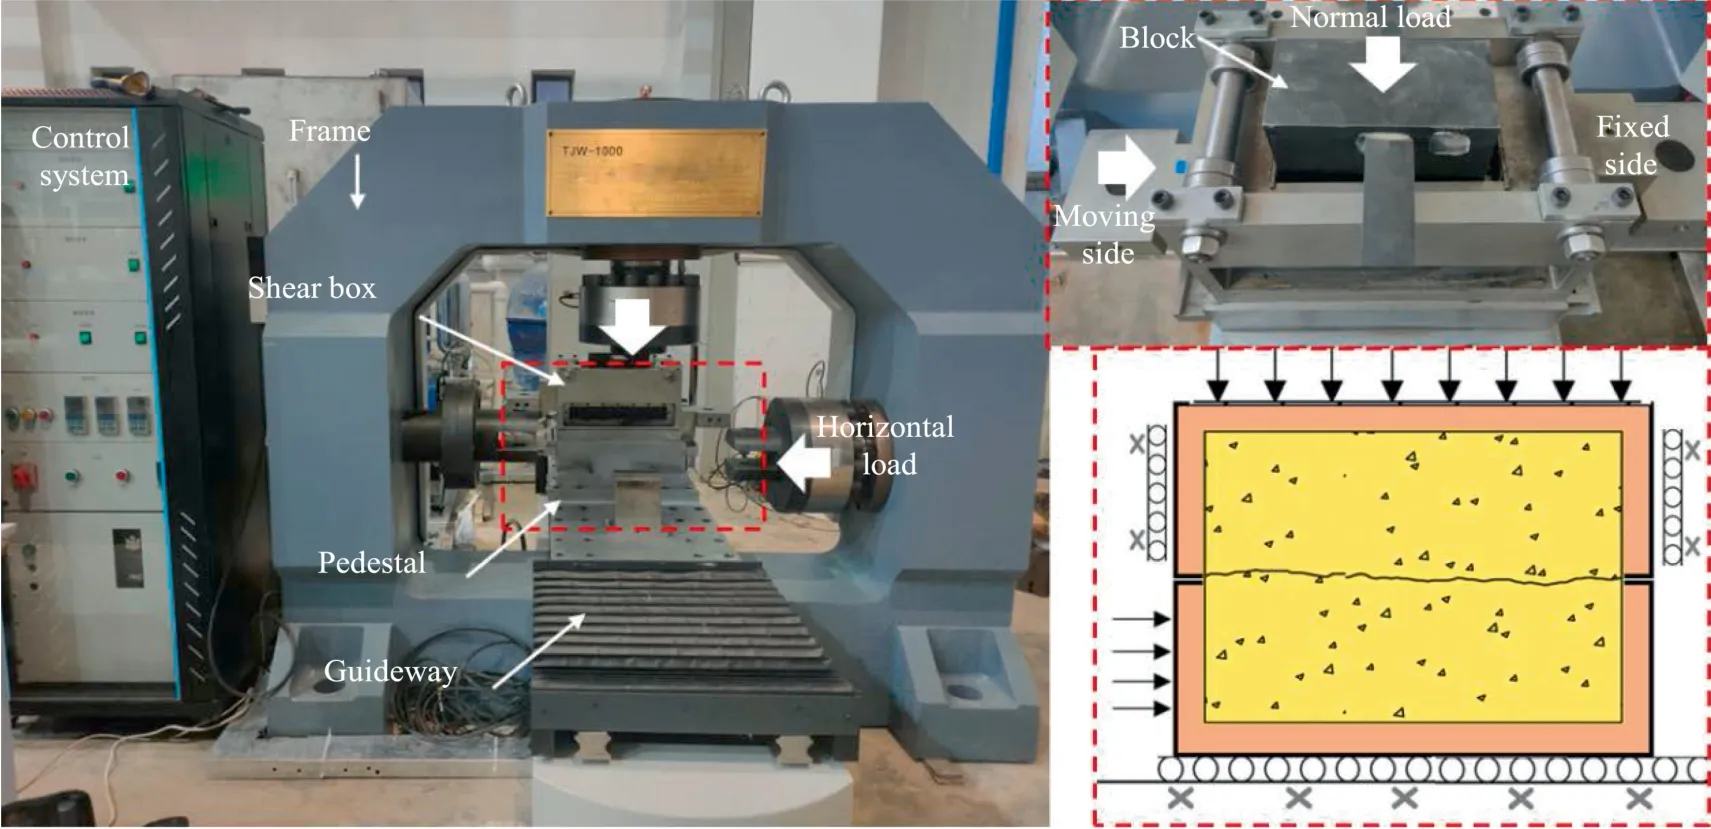
Fig.3.Laboratory shear experiment device.
3.Experimental results
3.1.Shear behaviour of rock joints
Fig.4 shows the stress-shear displacement curves.Similar shear behaviours of the same type of rock joints are observed under normal stresses of 0.5,1.0,1.5,and 2.0 MPa.Affected by the shear displacement,the shear stress shows an increasing trend.After the shear strength reaches the maximum,it shows a trend of decreasing stress.It was also observed that significant asperity damage occurred at the peak shear stress.It is considered that the stress intensity increases continuously when the asperities contact each other and reaches the ultimate strength of the rock mass at the peak point.In addition,the shear stiffness increases with increasing normal stress.
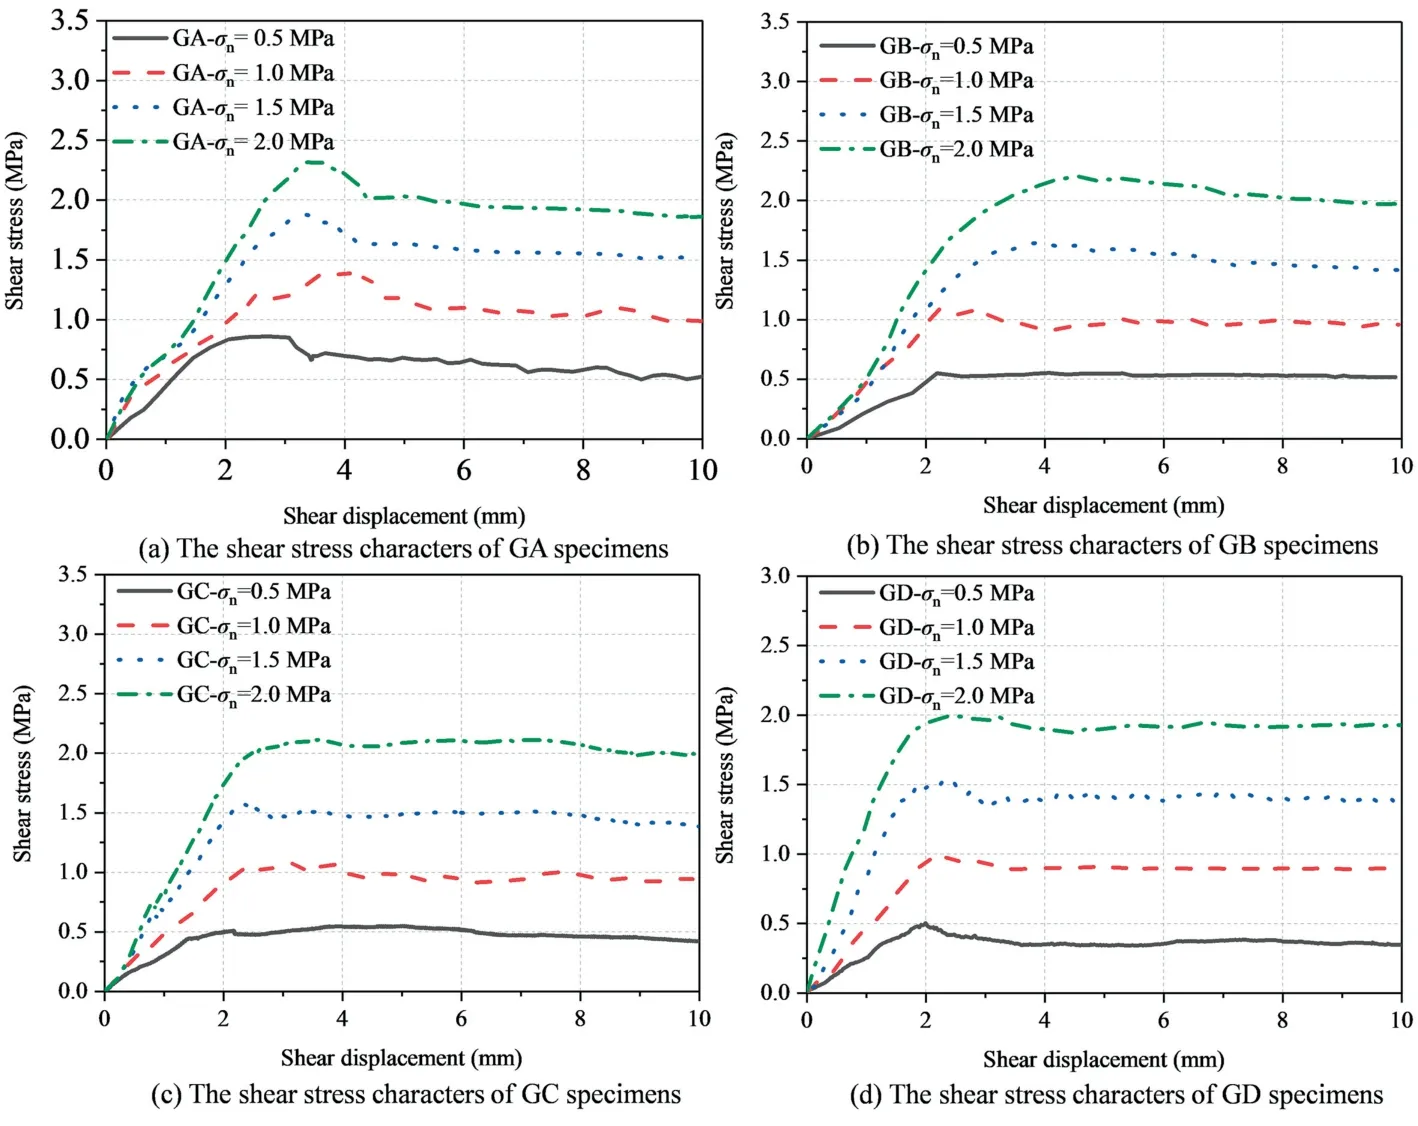
Fig.4.Stress-shear displacement curves.
Asperities also cause the dilatancy of rough joints during shear.Fig.5 shows the dilatancy-shear displacement curves.Comparing the dilatancy curves under the same test conditions shows that compaction and dilatancy occur in the rough joints during the shear test.The difference in dilatancy behaviour is attributed to the difference in asperities on the joint surface.The slope climbing effect is more evident for joint specimens with larger roughness.The ultimate dilatancy of rock joints with different roughness also decreases with increasing normal stress.When the normal stress increases from 0.5 to 2.0 MPa,the dilatancy decreases by 48%(GA),50% (GB),49% (GC),and 49% (GD).We believe that normal strength increases the degree of closure between joined rock masses,thereby greatly improving the contact area between joint walls.
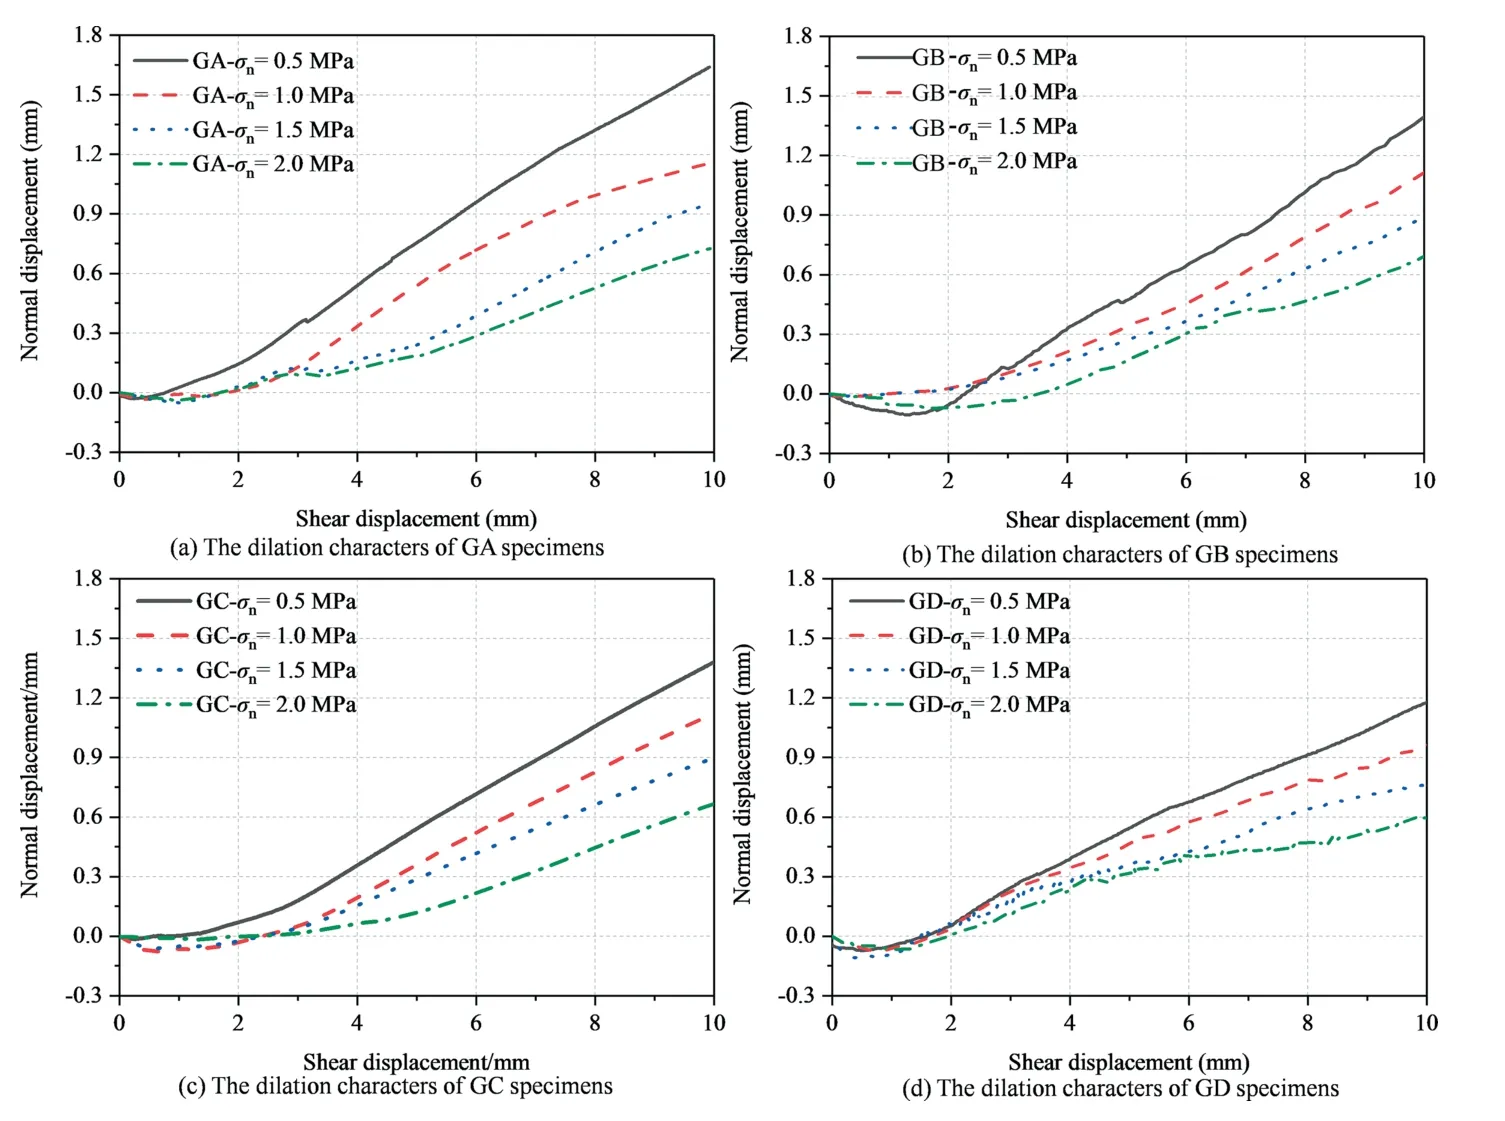
Fig.5.The dilatancy-shear displacement curves.
3.2.Height of asperity degradation
The joint surface can be divided into many two-dimensional profiles on the cross-sections taken from the shear direction.TheZ2of one profile of the sheared specimens was recalculated,which can reflect the roughness degradation characteristics of one section.The calculation method refers to the study of Tse and Cruden [26].The variation in the three-dimensional joint surface roughness can be reflected by connectingZ2of all curves along the shear direction,as shown in Fig.6.Some profiles before and after shearing coincide,indicating that incomplete contact may occur in this section.In some profiles,the value after shearing is lower than the highest point before shearing,indicating that the asperities are worn away during shearing.The rock joint shows the comprehensive effect of climbing and wearing in shearing.The whole joint surface wear can be determined by the average value ofZ2at different positions,When the normal stress is 2.0 MPa,the value ofdecreases by 31.26% (GA),20.18% (GB),17.95% (GC) and 17.05% (GD),respectively.The differences between the highestZ2and the lowestZ2are 37.62% (GA),26.99%(GB),21.13%(GC)and 20.57%(GD),respectively.The profile of the joint surface fattens,and the curve further flattens with higher normal strength after shearing.This shows that normal strength significantly affects asperity degeneration.
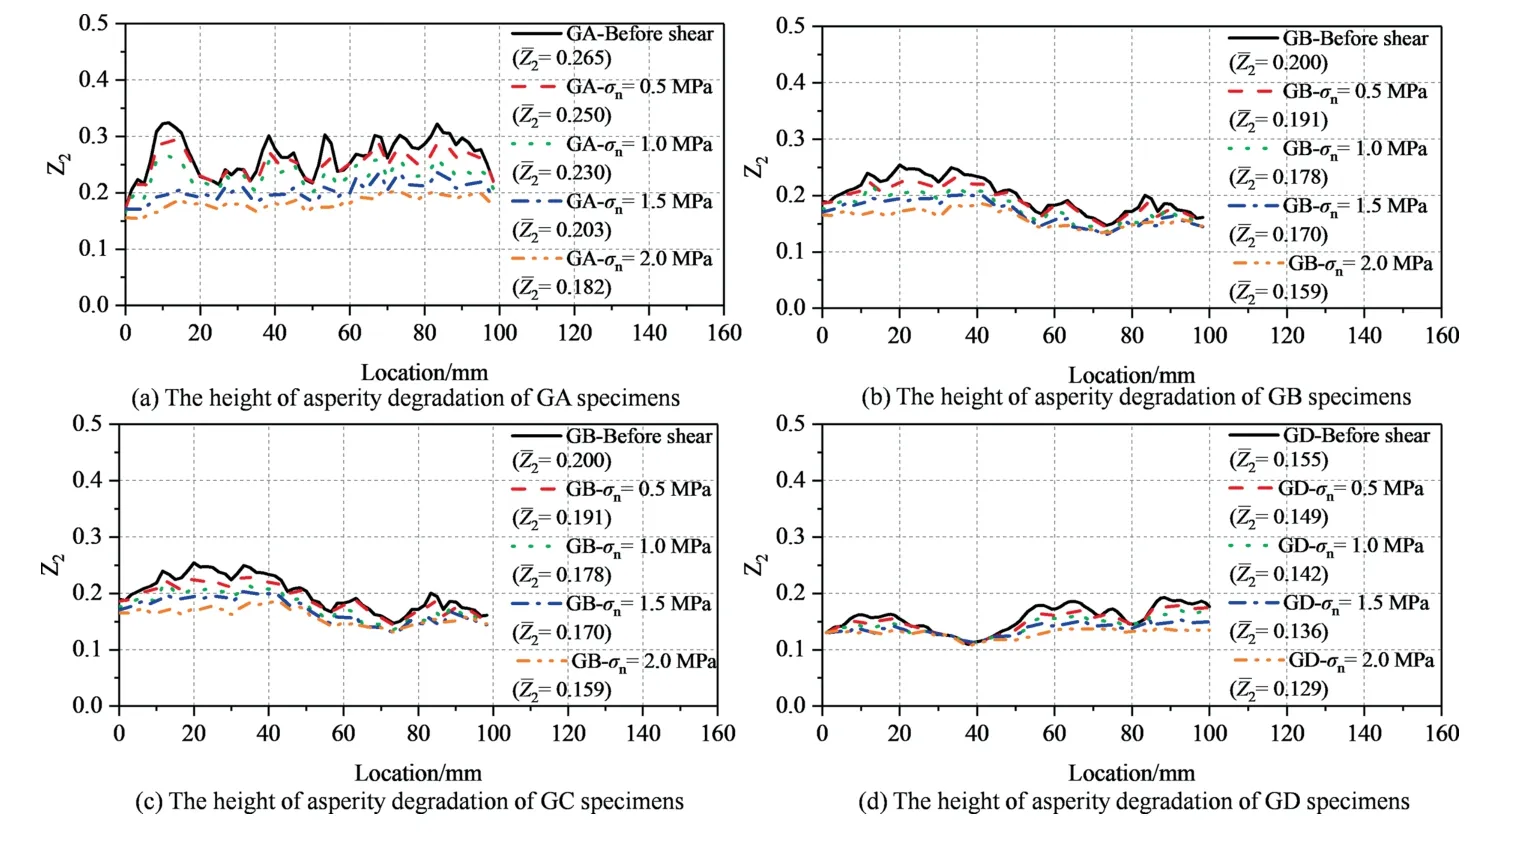
Fig.6.Shear-induced changes in joint surface roughness (Z2).
3.3.Zone of asperity degradation
Because the joint surface is uneven,it is necessary to calculate the real surface area of the joint surface.At present,joint surface topography can be measured at constant intervals using laser scanners or other optical instruments.In this study,the real surface area of the joint surface is calculated by the integral method,and it is estimated from the three-dimensional point cloud dataz(x,y) of the joint surface,as shown in Fig.7.

Fig.7.The Belem method [29].
Assume that the joint surface is contiguous and derivable.The actual areaAtcan be estimated by summing all triangular element areas.The specific calculation process can be found in the study of Belem et al.[29,30].The discrete form ofAtcan be approximated for very small sampling steps,Δxand Δy,by:
whereAiis the triangular element area;Δxand Δythe sampling steps along thex-andy-axes,respectively;Nxthe number of data points along thex-axis;Nythe number of data points along theyaxis;andzi,j=the discrete value of the joint surface single asperity height.
Fig.8 shows the wear morphology of rock joints after shearing under different normal stresses.The total zone loss of asperities was measured by comparing the fracture surfaces scanned before and after direct shear testing,as shown in Table 3.The damaged area of the asperity increases with increasing normal stress.Under the normal stress of 0.5 MPa,the asperities have the minimum damage,and the main form of shear dislocation between joints is sliding wear.The asperity degradation is mainly concentrated on the critical unevenness,and the damaged form of the joint surface is concentrated on a certain point.The normal strength will increase the contact area between joint surfaces and increase the wear zone.The failure of the joint surface also changes from point contact wear to surface contact wear with increasing normal strength.The wear area of the joint surface is significantly related to the contact area.Taking the specimens marked with GA as an example,with the normal stress increasing from 0.5 to 2.0 MPa,the wear zones are 9.53%,13.71%,16.18%,and 19.24%.The wear zone is positively correlated with the normal stress.In addition,the asperities of larger rough joint surfaces are steeper,which are more likely to cause stress on the joint surface and lead to greater damage.
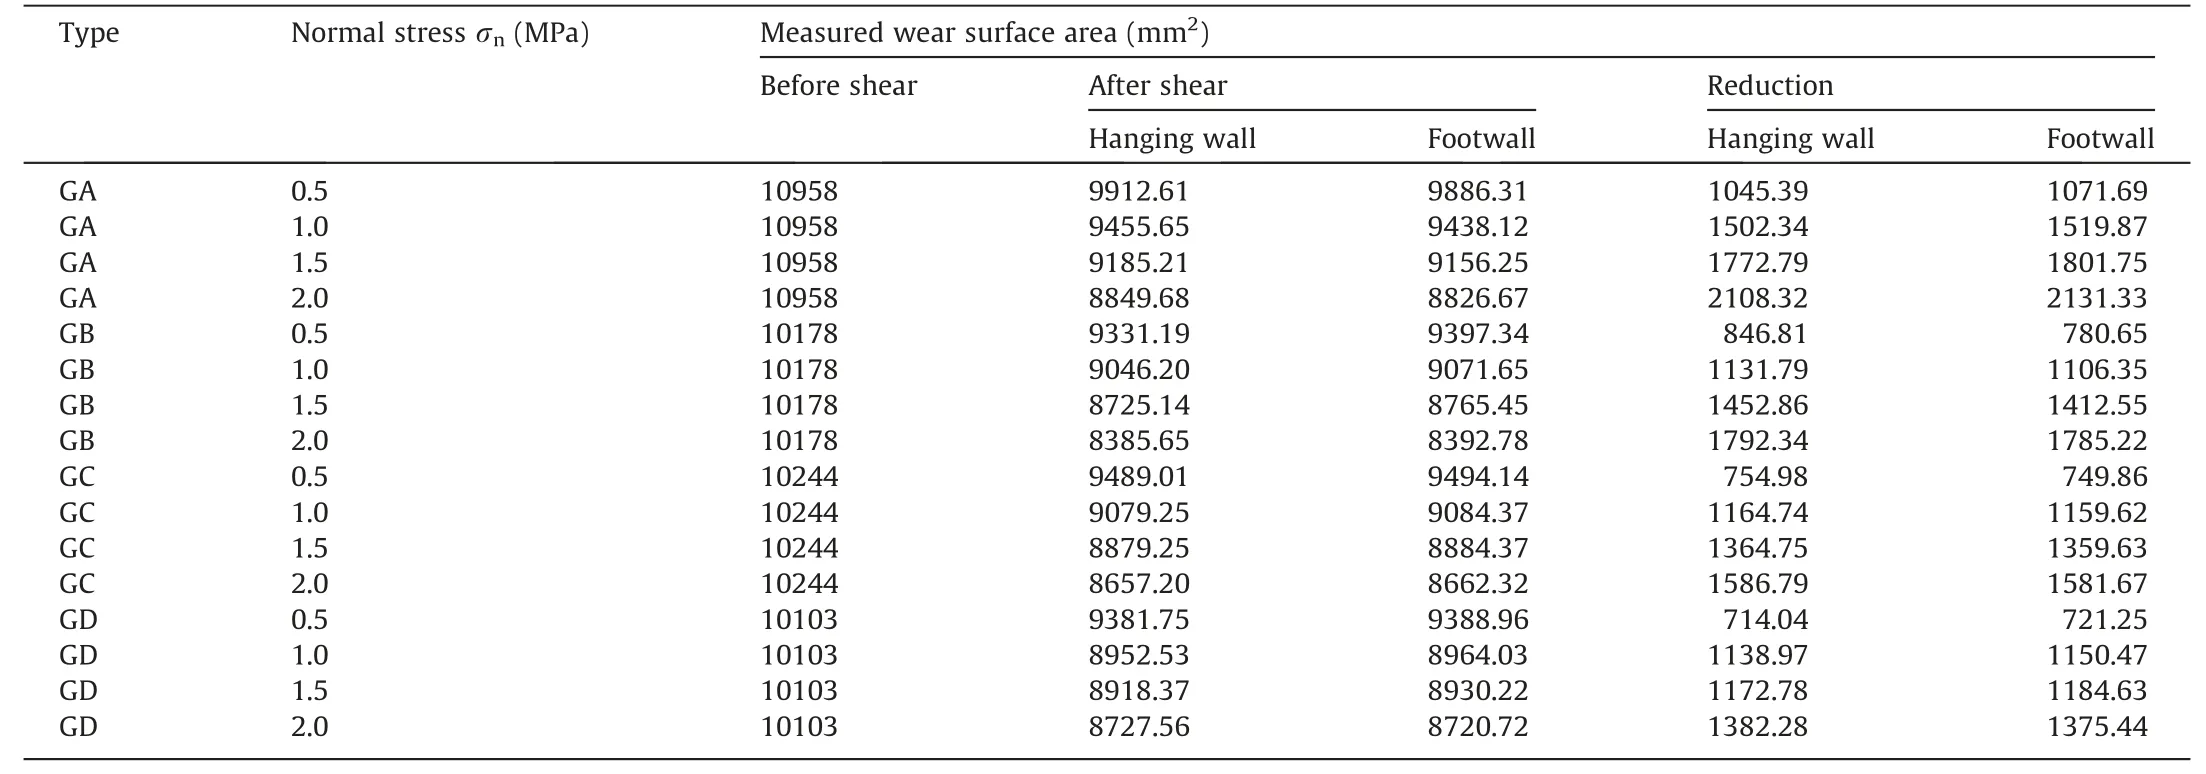
Table 3 Area degradation of asperities.
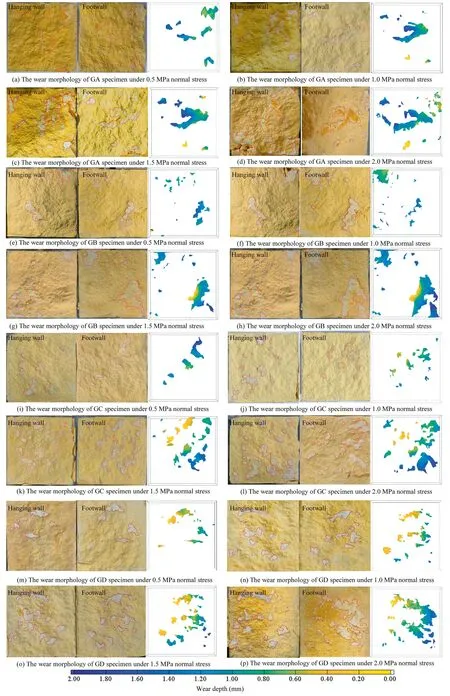
Fig.8.Wear morphology of rock joints after shearing under different normal stresses.Note:The hanging wall is depicted on the left,footwall is depicted in the middle,and the cloud picture of wear volume is shown on the right.
3.4.Volume of asperity degradation
The volume of asperity degradation of the joint surface after shear can be determined by three-dimensional scanning technology.The volume calculation method of Jiang et al.[19] is referenced in this work.Based on the reconstructed digital model,the point cloud data are interpolated by the equidistance interpolation method.Delaunay triangulation is then used to mesh and quantify the volume of the shear-damaged asperities.The volume degradation is shown in Table 4.Wear rate is the amount of material worn per unit load per unit time,the unit is cm3/(N·m).In general,the wear volume determines the wear rate.Therefore,the wear rate can better quantitatively express the wear state of the joint surface.The wear rate δ can be expressed as:
whereVis the measured wear volume,cm3;and ∑Wthe accumulated friction work,N·m.
The wear rate and normal strength are positively correlated in a nonlinear manner.Increasing normal strength can effectively cut steep asperities.In addition,the increase in the wear rate seems to decrease as the normal stress increases.On the one hand,the number of asperities is limited,and the wear behaviour does not increase indefinitely.On the other hand,when the critical asperities with large waviness and unevenness are sheared off,the additional increase in wear is contributed by small asperities,resulting in a reduction in wear efficiency.
The cloud pictures of wear volume in Fig.8 show the crushed fragments of the asperities on the joint surfaces.It can be seen that the wear and damage of asperities is the main reason for the decrease in shear stress.The shear strength of rock joints is mobilized by two mechanisms:the sliding behaviour between joint surfaces and the failure behaviour of contacted asperities on a shearing surface [31].Ban et al.[32].showed that the peak shear stress is related to the normal stress,surface morphology and shear direction.The normal pressure applied to the sliding surface concentrates on a few asperities,resulting in a significant increase in the pressure per unit area borne by the asperities.Due to the yielding of the asperities,shear fracture occurs,and frictional sliding occurs.In addition,the asperities on the closed joint surface form an interlocking effect,which can also provide shear resistance.
Although both the friction and asperities provide different shear resistances to the peak shear strength of rock joints during the shear process,the contributions of the friction and asperities to the shear strength are different under different normal stresses.Under higher normal stress and roughness,it is easier to cause cutting failure and wear damage on the joint surface,and the crushed fragments are relatively large.The wear depth increases with increasing normal load,which indicates that the ploughing effect between asperities is more significant under higher normal strength.Moreover,the fragments may be further crushed and broken under higher normal stress.When the normal strength is low,the interlocking effect and shearing effect between asperities are weakened,and extrusion and rolling between rock joints are likely to occur.Even under the same normal stress,the wear on the joint surface is not nearly the same.It is considered that the roughness changes the contact force state of asperities,which leads to the difference in wear loss.
4.Discussion
4.1.Rough joint surface real contact area
The above experimental study shows that joint surface wear mainly exists on asperities.The normal stress of asperities is relatively concentrated,and wear behaviour occurs after the material reaches the yield strength.However,not all asperities are in contact with each other during the shearing process,so it is necessary to calculate the real contact area on the joint surface.
It is known that the asperities on joint surfaces result in a‘‘real”contact area,which is actually very small.Thus,surface roughness results in contact pressures at roughness levels that are much higher than expected if the surface is completely smooth [33].Terzaghi [34] investigated the theory of contact and friction between asperities.From the view of microscopic contact,he proposes that all contact surfaces are rough surfaces and points out that the real contact area of two objects is much smaller than its normal area.Bowden [35] further revealed that most frictional contact behaviour is in accordance with Terzaghi theory.
Greenwood and Williamson[36]describe a new elastic contact theory that assumes all asperities distributed over a rough surface are spherical with equal radius (R).The height of the asperities (z)on the rough surface is a normal distribution function φ(z);then,the probability of one asperity height betweenzandz+dzis φ(z) dz.Assuming that the distance between the datum plane of the rough surface and the rigid plane isd,asperities whose height is greater thandon the rough surface will contact the rigid plane.For any asperity,the contact probability is
Assuming that the number of asperities isN,the number of contacting asperitiesncan be expressed as:
Then,for the whole plane,the real contact areaAcis
Separately,the total load is
whereE*is the equivalent elastic modulus;andRthe radius of the asperity.
By integrating Eqs.(5)and(6),the ratio of the real contact areaActo the forceFon the whole contact surface can be obtained as:
Let ζ=z/m,and ζ0=d/m,then
Referring to Valentin [37],where ζ0can be 2.5-3.5,letCequal
From the calculation results,Cis approximately equal to 1.4,then
Greenwood and Williamson [36] continued to improve the model,which is suitable for contacting two rough surfaces.Based on the research results of Greenwood and Williamson,Swan [38]shows that the stress level of asperities in contact is so high that asperities yield or fail under compression direct shear.Therefore,for the problem of rock joint shear under normal stress,the real contact areaAccan be approximately considered as the normal loadwacting on the joint surface divided by the uniaxial compressive strength σcof the rock.
whereAtis the area of the joint surface;σnthe normal stress;σcthe compressive strength;andwthe applied normal load.
4.2.Friction coefficient of the joint surface
In previous studies,it was recognized that wear is related to the roughness and friction force of the asperities [39,40].Wang et al.[41] showed that the friction and wear behaviours at the macroscale are usually affected by the morphology of the contact surface.The adhesive friction model proposed by Bowden [35] provides a possibility for accurate calculation of friction force.They believed that the friction forcefmshould equal the product of the real contact area (Ac) and shear strength (τ).
Based on a large number of direct shear tests and optical measurements of clean rock joints,Grasselli [42] proposed the shear strength equation considering the three-dimensional effect of the joint surface.Tang et al.[43] established a peak shear strength equation for rock joints in the form of the Mohr-Coulomb criterion based on Grasselli parameters.This equation has a definite physical meaning and can reflect the contribution of the threedimensional morphology of the joint surface to shear dilation.The new model of Tang is:
where τpis the peak shear strength;φbthe residual internal friction angle;A0the maximum possible contact area ratio;the maximum apparent dip angle;Cthe roughness parameter,determined by fitting test values;andA0,andCare related to the shear direction.
Combining Eq.(11),Eq.(12),and Eq.(13),the peak frictional forcefmof contact on asperities can be expressed as:
According to the definition of the coefficient of friction on the macroscopic surface,μ=the friction coefficient on the joint surface can be expressed:
4.3.Wear depth of the joint surface
Archard’s wear model was first proposed by Professor Archard at United Kingdom Leicester University [23].He proposes that when two surfaces rub against each other,the higher asperities on the surfaces first come into local stress concentrations.When the load exceeds the yield strength of the contacting asperities,it causes plastic deformation and failure of the asperities,as shown in Fig.9.The general equation of Archard’s wear model is as follows:
whereVis the measured wear volume;Pthe normal pressure on the contact surface;Sthe relative sliding displacement;Hthe hardness of the mould;andKthe wear coefficient.
The wear coefficientkscan also be obtained from the Archard adhesive wear model:
where σcis the compressive strength;andwthe applied normal load.
The wear coefficient is determined by the physical properties of the material.In the same material,the friction force positively correlates with the amount of wear.However,the influence of roughness on the shear behaviour of joint surfaces is not considered in the original wear theory.It is found in the direct shear test that the wear loss is significantly related to the roughness of the rock joint.The original wear theory does not obviously agree with the real wear situation.Therefore,the wear theory needs to be modified to adapt to the shear behaviour of rough rock joints.Assuming that all wear is caused by friction during shearing,the relationship between the wear coefficientksand the friction coefficient μ is established by regression analysis.
The measured wear volumes of the joint surfaces in Table 4 for different roughness and different normal strengths are substituted into Eq.(17),and we can obtain the wear coefficientks.The corresponding friction coefficient μ is obtained from Eq.(15).Finally,the function relation between the wear coefficient and friction coefficient μ is obtained by regression analysis,which isks=0.068 ln(μ)+0.448,as shown in Fig.10.
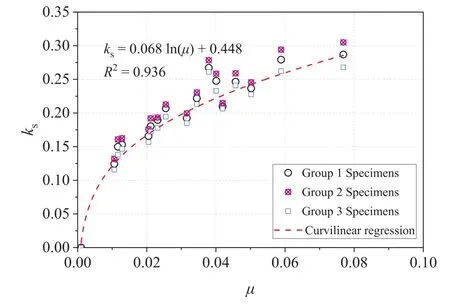
Fig.10.The relationship between the wear coefficient and friction coefficient.
Furthermore,the wear coefficient considering roughness and normal strength can be expressed as:
wherehis the wear depth;andAthe contact area,which can be obtained from Eq.(11).
Substituting Eqs.(11)and(17)into Eq.(19),the wear depthhin joint shear can be expressed as:
Due to the small wear of rock joints during the online elastic reinforcement stage,Sis the distance from the nonlinear reinforcement stage to the ultimate shear displacement.
In addition,the normal stress in rock joint direct shear is the normal load on the unit area.Eq.(20)is further simplified to obtain the wear depthh:
Although there is shear displacement in the compaction stage,there is no actual friction force.Therefore,Shere is calculated as the position where the wear starts.
4.4.Roughness degradation prediction model
In the process of shearing,shear wear is reflected not only in the shear strength decrease but also in the shear dilatancy.Fig.11 shows the relationship between the rock mass height and wear depth.The wear conditions of joint surfaces during shearing are roughly divided into 3 types,which are divided into (b)-(d) in Fig.11.In Fig.11a,the height of samples before shearing ish0.Fig.11b shows that when the normal strength during the samples motion is zero,the maximum shear dilatancy that can be achieved is ξult.ξultis also the amount of dilatancy without any asperity wear.The total height of the samples ish0+ξult.Fig.11c shows that when the samples are in the state of compression shear,the asperity may wear under the tangential load,and the total height of the samples at this stage ish0+ξult-h.If the worn joint surface is sheared again under the condition of no normal strength,the new dilatancy must be less than the ultimate dilation ξult.If the normal strength is sufficiently large,no dilatancy occurs during shear,and the height of samples after shearing ish0,as shown in Fig.11d.When the normal load is high and the rocks are weak,the rock joint is in a state of shear shrinkage.The height of the samples ish0-h.Under this condition,all asperities on the joint surface are completely worn out,and the wear depthhis equal to the maximum shear dilation ξult.In conclusion,the relationship between the wear depthhand the ultimate dilation ξultrepresents the wear of the joint surface.
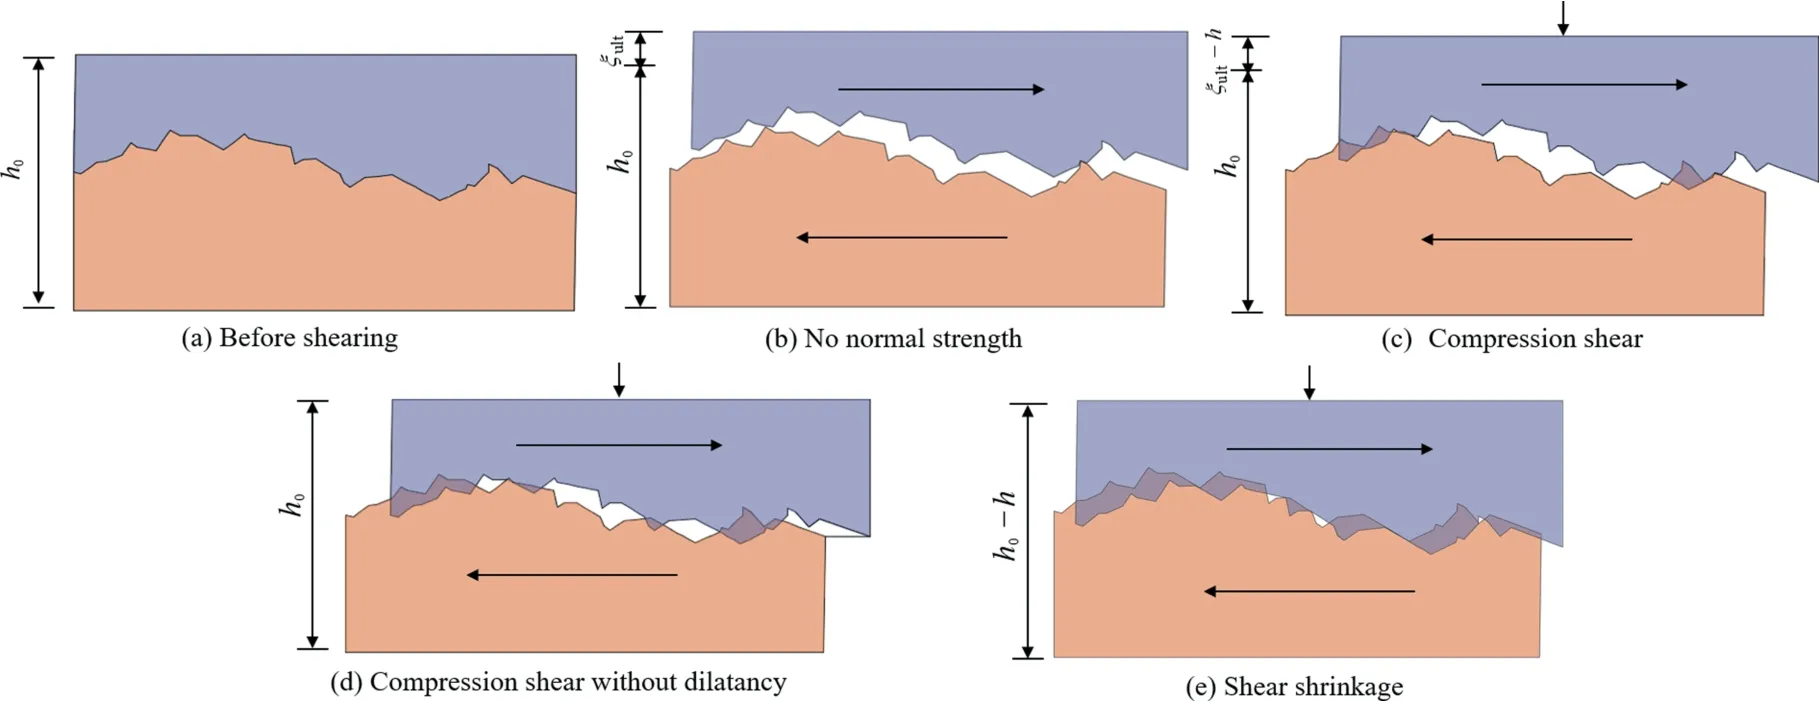
Fig.11.The height of samples and wear depth in shear.
The wear degree of the rock joint can be quantified by the ultimate dilation ξultand the wear depthh.Therefore,the maximum asperity height in the shear direction needs to be calculated.Zhou[44]obtained the calculation method of ultimate dilation based on a large number of direct shear experiments.Fig.12 shows the section curve of the rock joint,where the distance between points on the curve is 0.5 mm.The hanging wall of the rock joint with different roughness is sheared from left to right.For the asperities in the hanging wall,the shear side is the left side,and the shear resistant side is the right side.The maximum relief height is defined as the elevation difference between the local minimum and maximum on the shear side.Therefore,the maximum relief height can be calculated according to the point cloud coordinate values of the joint surface.However,that same asperity of the hanging wall traverses many asperities of the footwall during shearing.Therefore,the height of samples in five combinations are shown in Fig.13.
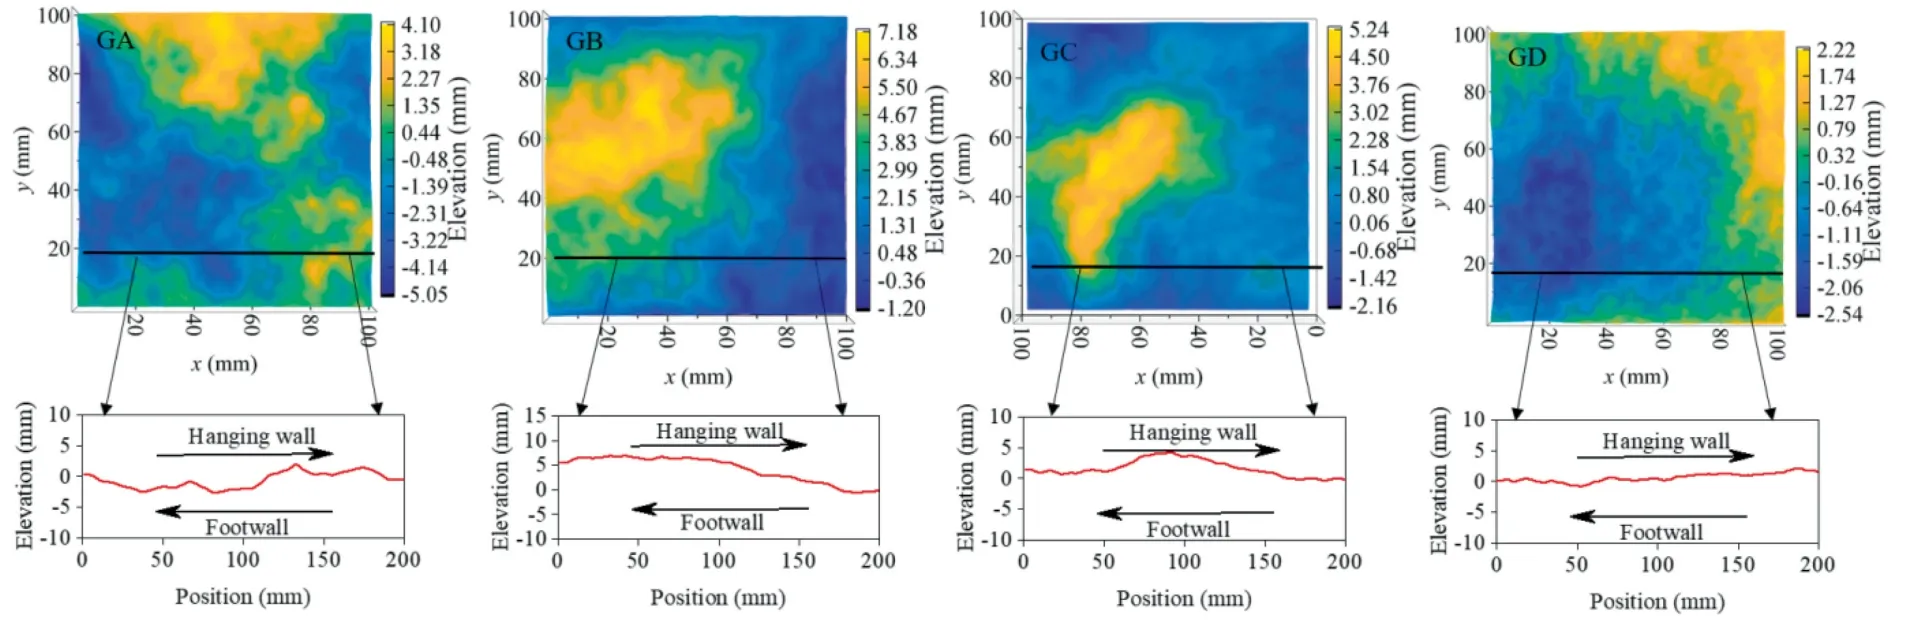
Fig.12.Profile curve extraction.
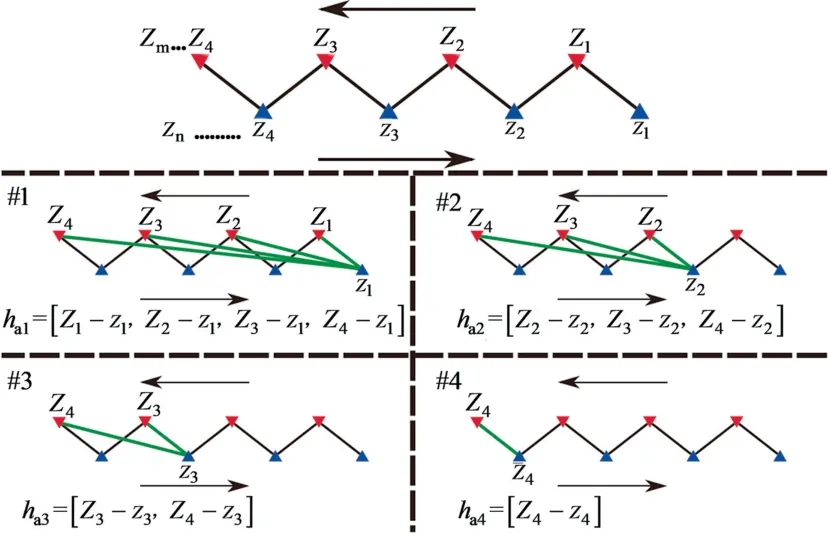
Fig.13.Asperity height combinations [44].
whereKis the number of curves,andall combinations of height differences.
Next,we define the coefficient of wear degree(m)as the ratio of wear depth to maximum shear expansion:
Combining Eqs.(21) and (24),mcan be expressed as:
Whenm=0,it means no wear;whenm≥1,it means complete wear.
Furthermore,the roughness after shearing can also be obtained as follows:
Combined with Eq.(24),the new roughness degradation model can be expressed as:
4.5.Result verification
To verify the rationality of the new model for roughness degradation and the validity of predicting roughness after shearing,we scan the specimen and calculate the roughness of the joint surface after shearing based on the point cloud file.The comparison between the experimental measurements and the new model calculations is shown in Fig.14.The calculation parameters involved can be obtained from Table 5.
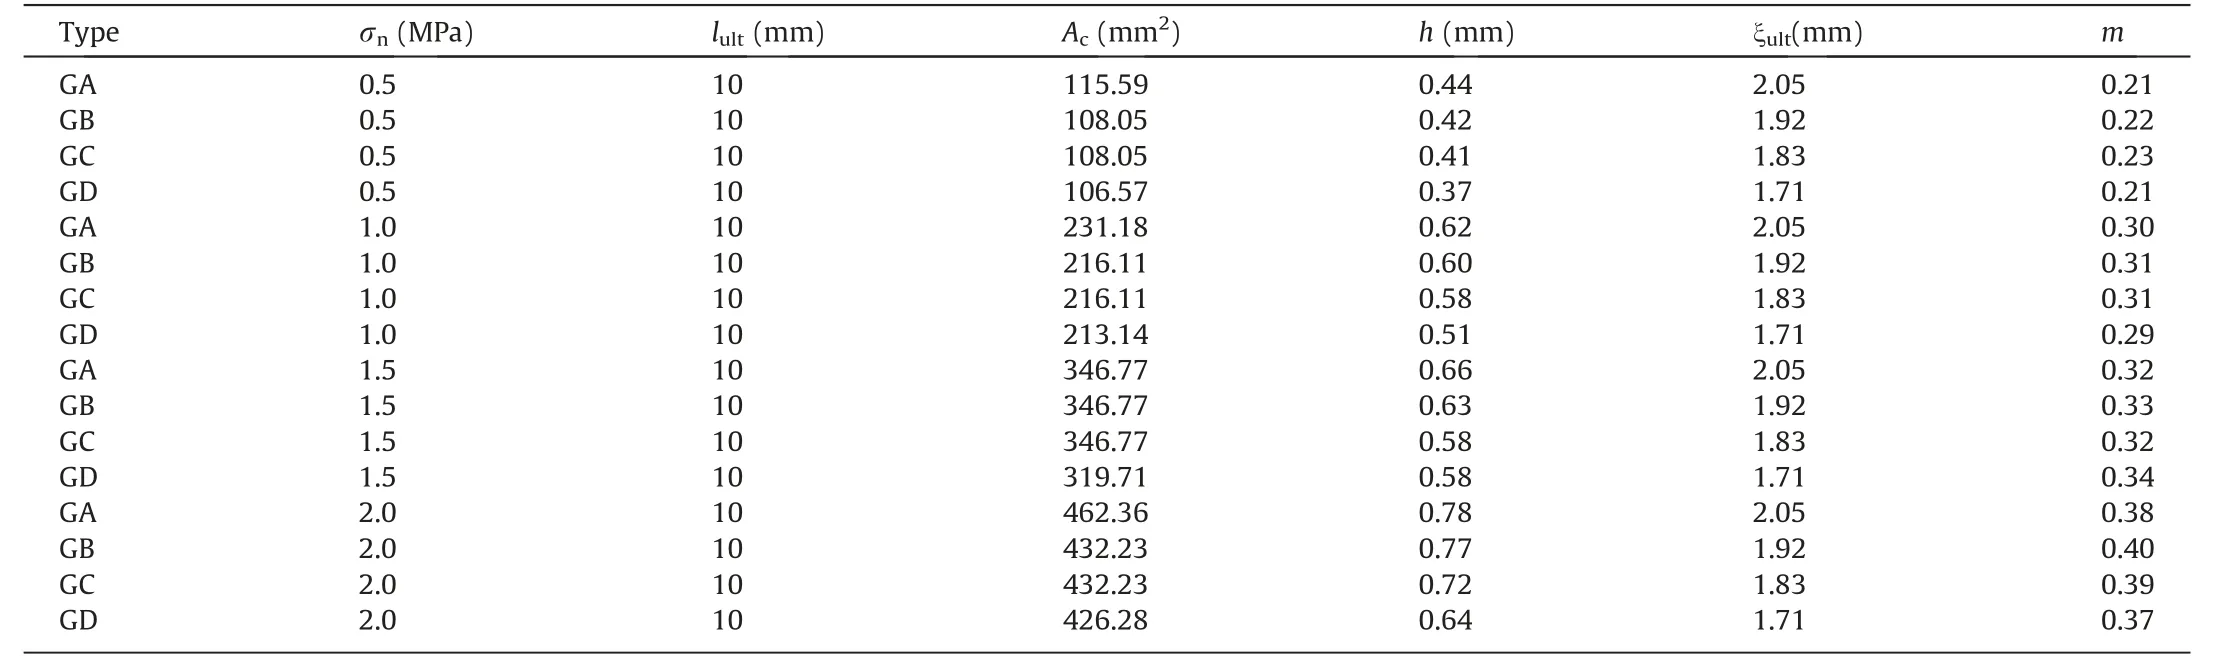
Table 5 The calculated value of each parameter index.
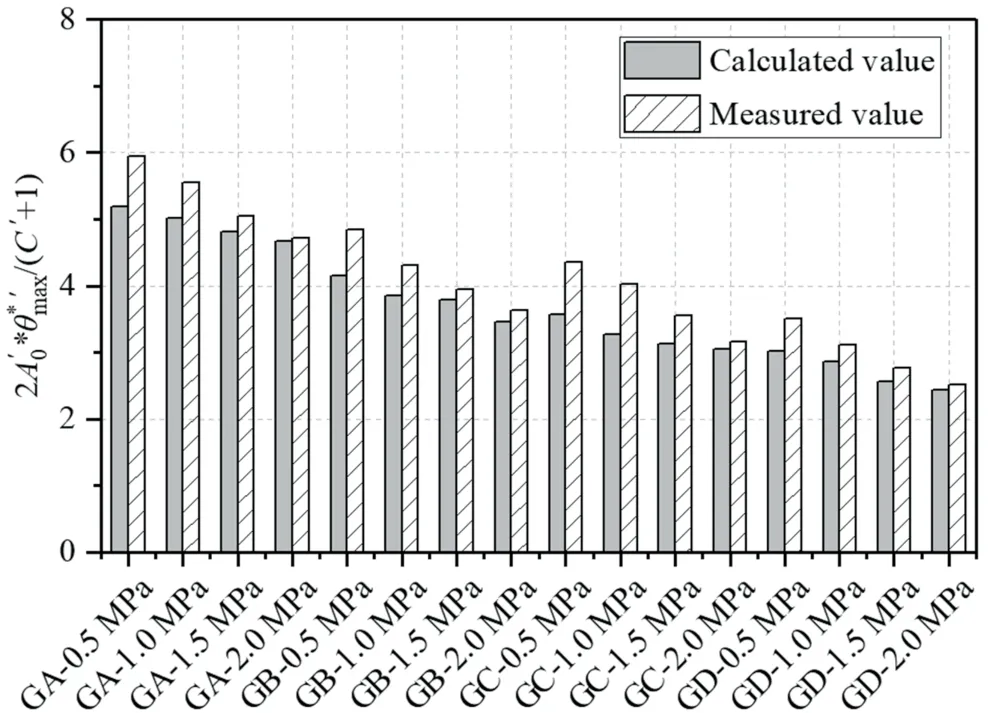
Fig.14.Comparison of the calculated and measured values.
The results show that the roughness degradation on the joint surface is greater with increasing normal strength and roughness.The trend of the new model is consistent with the experimental results and the laws of Zhao et al.[24].The error between the new model and the experimental results is relatively small,which can accurately reflect the roughness degradation law and calculate the ultimate roughness.In addition,all the parameters in the new model are easily obtained,which can be useful for the study of rock mechanics and engineering.
4.6.Analysis of the influencing factors
Eq.(21) shows that the wear depth of the rough rock joint is mainly related to the roughness,normal strength,compressive strength of the rock,and basic friction angle.Roughness and normal strength have been discussed in the laboratory test and will not be repeated here.However,the compressive strength and friction angle are directly related to the mechanical properties of rock materials,and their influence on wear cannot be ignored.According to laboratory research on the direct shear of rock joints,most of the selected sample materials are gypsum,cement,sandstone,granite,etc.[45-47].The compressive strengths of rocks are generally approximately 10-100 MPa,and the basic friction angle is approximately 10°-60°.Therefore,based on the above range,assuming that other parameters remain unchanged,we use Eq.(21) to study the effect of different compressive strengths and basic friction angles on wear behaviour.
Fig.15 shows the wear depth of rock joints with different compressive strengths.From the perspective of rock mechanics,the higher the compressive strength of rock is,the stronger the ability of the rock to resist compressive stress.An asperity with high strength is more difficult to break and has stronger resistance to wear in shear.However,the lower rock strength is more prone to the extrusion and crushing of asperities,which increases the wear depth.In addition,we also found that the wear depth and compressive strength are strongly dependent on the range of 0-55 MPa,as shown in the grey zone in Fig.15.The wear depth and compressive strength are weakly dependent on the range of 55-100 MPa,as shown in the blue area in Fig.15.When the compressive strength of the rock is increased,the climbing ability of the rock joint is improved on the macro scale.However,at the microscale,the stress concentration phenomenon is more likely to occur at the asperity tip during climbing.Even if the compressive strength continues to be sufficiently high,there will still be stress concentration and breakage at the tip of some asperities.
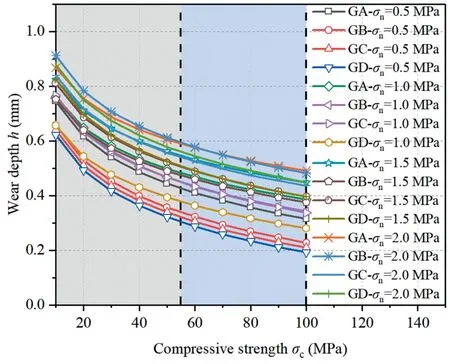
Fig.15.Wear depth of rock joints with different compressive strengths.
Fig.16 shows the wear depth of rock joints with different basic friction angles.In addition to the shear strength provided by the interlocking surface asperities,it is also contributed by a part of the contact friction.The increase in the basic friction angle directly increases the friction strength of the rock joint during contact and then increases the wear amount.
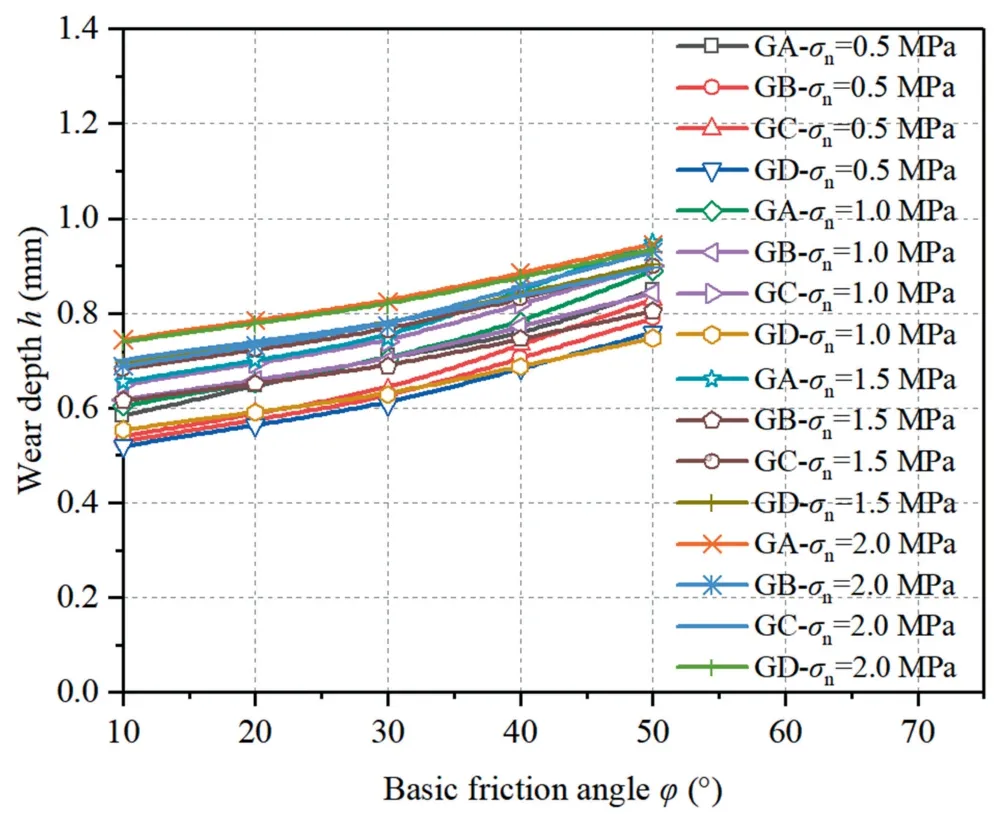
Fig.16.Wear depth of rock joints with different basic friction angles.
During the measurement process of surface topography by the Grasselli parameter,the apparent dip angle of the local triangular element may be very large.The reason for such a result may be measurement error.We also found that granite crystals easily peel off along the rock mass and produce small steep slopes.These small steep slopes may be isolated triangular elements or a slight asperity.The number of these steep elements is much smaller than the normal elements,and the value ofCis likely to remain unchanged during the fitting process.However,these steep elements significantly affect the value of the maximum apparentTherefore,we will study the effect of maximum apparent inclination on wear separately,as shown in Fig.17.When the range ofis 10°-90°,the maximum increase in the wear depth of specimen GA under the 0.5 MPa normal strength is 0.41 mm,andthe maximum increase in wear depth of specimen GA under the 2.0 MPa normal strength is 0.35 mm.The effect of the isolated maximum apparent dip angle on the wear depth is very significant,and the effect decreases with increasing normal strength.In fact,the new model evolved from the wear volume and followed wear theory.Because of the existence of steep asperities,the fragmented volume must increase during shearing.Interestingly,such isolated steep asperities or elements will be sheared directly during shearing,which will not affect the wear depth significantly.This is contrary to the theoretical results,which may be caused by the different failure mechanisms of asperities on joint surfaces.Isolated steep asperities are more fragile at the root and do not wear out even with very little force.Although these shear-off fragments increase the wear volume,they actually have little effect on the wear depth.Macroscopically,the actual wear volume on the joint surface increases with increasing normal strength.The wear volume of isolated steep asperities is unchanged,and the proportion of influence on the joint surface will also decrease relatively.Therefore,both the measurement error and the unreasonable steep asperities need to be removed to further reduce the influence on the result.
4.7.Limitations
Natural rocks are always incomplete and frequently contain rock joints.The mechanical characteristics and permeability of rock joints are typically influenced by wear.However,few reports can quantitatively describe the wear degree of the joint surface.In practice,it is difficult to separate a shear mechanism from a friction mechanism.The interaction of these different mechanisms makes wear prediction a difficult task.Measuring the wear surface morphology is an effective method to analyse the wear mechanism.Therefore,we obtained the wear depth of the joint surface based on wear theory and point cloud data.Although it is mixed with phenomena and empirical laws,the new model has a simple structure and easy-to-obtain parameters,which can quickly provide a quantitative evaluation standard for the wear degree of rock joints at the project site.
It is well known that the roughness of rock joints is usually anisotropic and depends on the shear direction.Liu et al.[48]studied the shear behaviour of anisotropic rock joints under different boundary conditions.They found that the critical unevenness of the same asperities under different shear directions was significantly different,which led to different shear wear degrees of joint surfaces in different directions.Therefore,the anisotropy of the joint surface must be considered in evaluating the wear of the joint surface.The new model proposed in this study contains the variables ξultand the Grasselli parameter,whose computation relies on point cloud data.The combination model used seems to consider different shear directions,which is helpful in evaluating the wear of anisotropic rock joints.However,this is not yet sufficiently accurate and complete.In addition,the new model is based on wear theory,and the upper limit of wear depth is the ultimate dilation.In essence,it is only suitable for joint shear with small displacement.
With the rapid development of the finite element numerical method,the wear model has gained significant interest.The numerical simulation allows accurate calculation of the shear wear of the rough surface interface.It is relatively easy to simulate with commercial FEM software,which is widely used in wear machinery and manufacturing.The numerical model based on Archard theory has been successfully applied many times.The wear model first proposed by Marshek and Chen [49] incorporates a local version of contact pressure and has been widely used to simulate the wear depth.Põdra and Andersson[50]improved the numerical calculation method to simulate wear under sliding conditions.Olofsson et al.[51]used a numerical calculation method based on wear theory to simulate the rolling and sliding conditions in rolling bearings.Blanchet [52] also explored wear theory and numerical simulation methods.However,the wear simulation of the shear process of rock joints has not yet been attempted.In future work,we will continue to apply the established model to finite element numerical simulation software.Then,we will develop a numerical simulation method that can reflect the wear characteristics of the joint surface.
5.Conclusions
We conducted laboratory direct shear experiments on joint surfaces with different roughness and normal strengths.Additionally,we utilized three-dimensional scanning technology to quantitatively measure the wear characteristics of asperities.The theoretical analysis focused on the wear depth and roughness degradation of rock joints.The research results can help clarify the hydraulic permeability of rock joints and rock mechanics.The main conclusions are as follows:
(1) The shear behaviour and wear characteristics of the asperities on the joint surface were investigated through a laboratory test.These experimental results showed the contribution of joint wear to roughness degeneration,including the height,zone,and volume of asperity degeneration.Normal stress and roughness significantly affect the shear behaviour of rock joints and the wear characteristics of asperities.
(2) The friction force on the joint surface is calculated based on the real contact area of the joint surface and Grasselli’s model.Based on the experimental results,a regression relationship between the friction coefficient and wear coefficient in the shear process has been established.A more significant innovation is that a method for calculating the wear depth of joints is proposed based on wear theory.The new method of measuring wear depth will be helpful in studying the problem of rock joint aperture.
(3) The ultimate dilation of the joint surface was determined by searching for point cloud data.The relationship between the ultimate dilation and wear depth was analysed.A quantitative parameter(m),which can reflect the wear degree of the joint surface,and a calculation model for roughness degradation are proposed.Good agreement between analytical predictions and laboratory-measured values demonstrates the capability of the developed model,and all parameters in the model are easy to obtain.
Acknowledgements
The authors thank the financial support from the National Natural Science Foundation of China (Nos.52079077 and 52209141)and the Natural Science Foundation of Shandong Province,China(No.ZR2021QE069).
- 矿业科学技术学报的其它文章
- Selective flotation of chalcopyrite from pyrite via seawater oxidation pretreatment
- Numerical modeling on strain energy evolution in rock system interaction with energy-absorbing prop and rock bolt
- Effect of particle gradation on pore structure and seepage law of solution in weathered crust elution-deposited rare earth ores
- Experimental study on instability mechanism and critical intensity of rainfall of high-steep rock slopes under unsaturated conditions
- Polysaccharides-based pyrite depressants for green flotation separation:An overview
- Mechanical properties and damage characteristics of solidified body-coal combination in continuous driving and gangue backfilling