Stochastic analysis of excavation-induced wall deflection and box culvert settlement considering spatial variability of soil stiffness
Ping Li,Shiwei Liu,Jin Ji,Xunming Ding,Mengdie Bo,*
a College of Civil and Transportation Engineering,Hohai University,Nanjing,210098,China
b School of Civil Engineering,Chongqing University,Chongqing,400044,China
Keywords:Three-dimensional (3D)Geostatistical analysis Random finite element modelling (FEM)Spatial variability of soil stiffness
ABSTRACT In this study,a three-dimensional (3D) finite element modelling (FEM) analysis is carried out to investigate the effects of soil spatial variability on the response of retaining walls and an adjacent box culvert due to a braced excavation.The spatial variability of soil stiffness is modelled using a variogram and calibrated by high-quality experimental data.Multiple random field samples (RFSs) of soil stiffness are generated using geostatistical analysis and mapped onto a finite element mesh for stochastic analysis of excavation-induced structural responses by Monte Carlo simulation.It is found that the spatial variability of soil stiffness can be described by an exponential variogram,and the associated vertical correlation length is varied from 1.3 m to 1.6 m.It also reveals that the spatial variability of soil stiffness has a significant effect on the variations of retaining wall deflections and box culvert settlements.The ignorance of spatial variability in 3D FEM can result in an underestimation of lateral wall deflections and culvert settlements.Thus,the stochastic structural responses obtained from the 3D analysis could serve as an effective aid for probabilistic design and analysis of excavations.
1.Introduction
Over the past decades,a number of underground infrastructures(e.g.car parks and shopping malls)have been constructed to meet the increasing demand of congested megacities.Excavation is considered as the most commonly used means to create urban underground space.However,the removal of a large amount of soil mass during excavation can induce ground stress relief and deformation in the ground,causing significant disturbances to existing structures in close proximity to excavation (Ng and Yan,1998).Deep excavations can induce additional stresses and displacements in existing structures such as pile foundations (e.g.Poulos and Chen,1996;Cui et al.,2018;Meng et al.,2020;Yu et al.,2021;Cui et al.,2022,2023;Shi et al.,2022a),tunnels,and pipelines (e.g.Shi et al.,2015a;2022b;Chen et al.,2015).For example,Chen et al.(2015) reported the collapse of a deep excavation in Hangzhou,which caused significant subsidence of a major road and a damage of a water main below the road.It is imperative to have a good understanding about excavation induced soil-structure interaction for robust engineering design and analysis of underground infrastructures.
Present practices commonly investigate soil-structure interaction during braced excavations using empirical or deterministic approaches without considering uncertainties associated with soil parameters,which could possibly result in serviceability and stability problems(Wang et al.,2017a).Recently,a growing number of studies have revealed that the spatial variability of soil properties plays an important role in solving different geotechnical problems such as stability of dams and slopes(e.g.Griffiths and Fenton,2000;Santoso et al.,2011;Jiang et al.,2014,2015;Li et al.,2015;Zhang et al.,2021,2022a,b;Chen et al.,2022;Gu et al.,2023),tunnel deformation (e.g.Huang et al.,2017a,b;Zhang et al.,2021),structural responses of retaining wall systems(e.g.Sert et al.,2016;Luo et al.,2020;Qin et al.,2021)and strengths of cement-admixed soils(e.g.Tyagi et al.,2020;Pan et al.,2021).In addition,advanced methods have been proposed for characterization of spatial variability and modelling of random fields (e.g.Wang et al.,2019a)considering both horizontal and vertical correlation lengths (e.g.Zhang et al.,2021a,b),and even Bayesian updating of associated parameters using measurement records (e.g.Lo and Leung,2019;Qin et al.,2021).By integrating spatially varying soil properties with finite element modelling (FEM) for probabilistic analysis of a braced excavation,Luo et al.(2020) found that the structural responses (i.e.bending moments and shear force) of retaining walls are significantly affected by the scale of fluctuations (SOF) and coefficient of variation (COV) of soils.It is worth mentioning that previous studies mainly rely on assumed random field parameters(e.g.mean,standard deviation,and SOF) for stochastic analysis of geotechnical problems (e.g.slope,excavation,tunnelling,and foundation)(Zhang et al.,2020).
In geotechnical engineering,the spatial variability of soil properties is commonly modelled using random field theory or geostatistical methods (e.g.ordinary Kriging),which are often combined with two-dimensional (2D) FEM for stochastic analysis(Fenton and Griffiths,2008).Note that a well-defined spatial correlation structure (e.g.covariance function and variogram) normally requires the explicit specification of various governing parameters such as correlation length and COV,which normally requires a prior knowledge of local soil conditions.Due to the lack of available site-specific data,the autocorrelation function or variogram is rarely calibrated or verified by experimental data.In practice,it is conventional to carry out sensitivity and probabilistic analysis using different combinations of assumed random field parameters (e.g.Sert et al.,2016;Qin et al.,2021).Although this practice enables the explicit consideration of soil spatial variability,the assumed parameters may deviate from the ground truth values,leading to unconservative design.On the other hand,previous studies (e.g.Wu et al.,2012;Nguyen and Likitlersuang,2021)mainly focus on evaluating the effects of spatially varying strength parameters such as undrained shear strength and friction angle on the performance of excavations,and unfortunately the influence of spatial variability of soil stiffness on responses of retaining walls and adjacent structures is rarely explored.In reality,precise predictions of excavation behaviour require an accurate characterization of small-strain stiffness (Atkinson,2000).It is also noted that many studies (e.g.Luo et al.,2011;Sert et al.,2016;Kawa et al.,2019) investigate the response (e.g.deflection) of retaining structures using 2D random finite element analysis of excavations in greenfields without considering potential effects on existing adjacent structures (e.g.culvert box).Furthermore,the true threedimensional (3D) soil-structure interaction incorporating spatial variability of soil stiffness has not been reported.
To address the above-mentioned problems,this study presents a 3D FEM method to investigate excavation-induced wall deflections and settlement patterns of an existing box culvert considering vertical spatial variability of soil stiffness.The spatially varying soil stiffness is explicitly modelled using geostatistical analysis and calibrated by high-quality experimental laboratory data.The generated multiple random field samples(RFSs)of soil stiffness are then integrated with a back-analysed FE model for stochastic analysis of soil-structure interaction during excavation by Monte Carlo simulation.
2.The site
An excavation site in Nanjing,a coastal city along eastern shoreline of China,was reported in this study.Fig.1a shows the plan view of the excavation.The excavation site is approximately rectangular with dimensions of 250 m × 130 m (length × width).The excavation was retained using bored pile walls.Each reinforced bored pile has a diameter of 1.2 m and a centre-to-centre spacing of 1.4 m.A concrete box culvert with a cross-sectional area of 4.35 m×14 m(height×width)is in parallel with the length of the excavation pit.The closest distance between the box culvert and the retaining wall is about 10 m.
Fig.1b shows the elevation view of the excavation along crosssectionA-A′.The ground level was +7.4 m and the final excavation level was-8.4 m,resulting in a total excavation depth(He)of 15.8 m below the ground surface.The basement was supported by three levels of props at +6.35 m,+1.05 m and -4.3 m (or 1.05 m,6.35 m and 11.7 m below the ground surface),respectively.These three levels of reinforced concrete props have a cross-sectional area of 0.7 m × 0.7 m.The props at each strut level were arranged in a grid with an equal spacing of approximately 8 m between adjacent props along both longitudinal and lateral directions.To counterbalance the self-weight of the props,rectangular reinforced concrete columns with dimensions of 0.45 m × 0.45 m were installed as kingposts in the middle of the pit.The founding level of the kingposts was -22.1 m,which was the same as that of the bored pile wall.To prevent potential water inflow from outside the pit during dewatering and construction stages,a 0.7 m thick grout curtain was constructed along the perimeter of the basement.The toe of the grout curtain reached-46 m or 2 m into the completely decomposed granite(CDG).For the box culvert,it was divided into two rectangles by a 0.2 m think concrete slab.The founding level of the box culvert was +0.85 m (or 6.55 m below the ground level).Note that the left side wall of the box culvert was 24 m away from the bored pile wall,which was well within the primary influence zone of 2He(=31.6 m) as reported by Hsieh and Ou (1998).Therefore,the serviceability of the box culvert may be affected during basement excavation.
2.1.Construction sequences
Table 1 summaries the key construction sequences of the basement excavation.Firstly,the kingposts,grout curtain,bored pile walls were installed.Next,the excavation was conducted step by step.In total,the soil within the pit was removed in four stages.For the first three stages,the excavation was terminated at 0.5 m below the designed prop level to create extra room for casting reinforced props.Prior to each excavation stage,multiple dewatering pumps within the basement were operated continuously to keep the water head at 1 m below the actual excavation level.After erecting all the props and reaching the final excavation level of-8.4 m,the bottom slab with a thickness of 1 m was cast.Since the basement had a relatively large plan area,the whole area was divided into 12 zones for stage-construction.
2.2.Geology
A site investigation campaign comprising both in situ and laboratory tests was carried out to determine soil stratigraphy and associated soil parameters for design and analysis.In total,more than 100 boreholes were performed at the site.A series of laboratory tests was carried out to obtain parameters of each soil layer.Fig.2 shows the soil parameter profiles derived from the site investigation.The ground had a relatively constant water level at +5.4 m or 2 m below the ground surface.It is found that the stratigraphy mainly consists of seven soil types.The top three soil layers (i.e.fill,soft clay and silty clay) have a total thickness of 14.4 m and are predominantly fine-grained materials,underlaid by a 32.3 m-thick silty sand layer.In addition,CDG had a depth of 43.2 m below the ground surface,and two thin layers of silty clay and gravel lay between the silty sand and CDG.The final excavation level and founding level of the box culvert are-8.4 m and+0.85 m,respectively.It is anticipated that the performance of the retaining walls and the existing box culvert will be mainly affected by soft clay,silty clay and silty sand.Soil layers with larger water content normally have a smaller unit weight and a larger void ratio.By conducting triaxial consolidated undrained test,the friction angles of the top four soil layers vary between 25.0°and 31.6°,and the cohesion is in a range of 4.3 kPa-8 kPa.By carrying out oedometers tests,the measured constrained modulus at an axial stress level of 100-200 kPa is around 5 MPa for all soil types,except that silty sand has a mean constrained modulus of approximately 15 MPa.
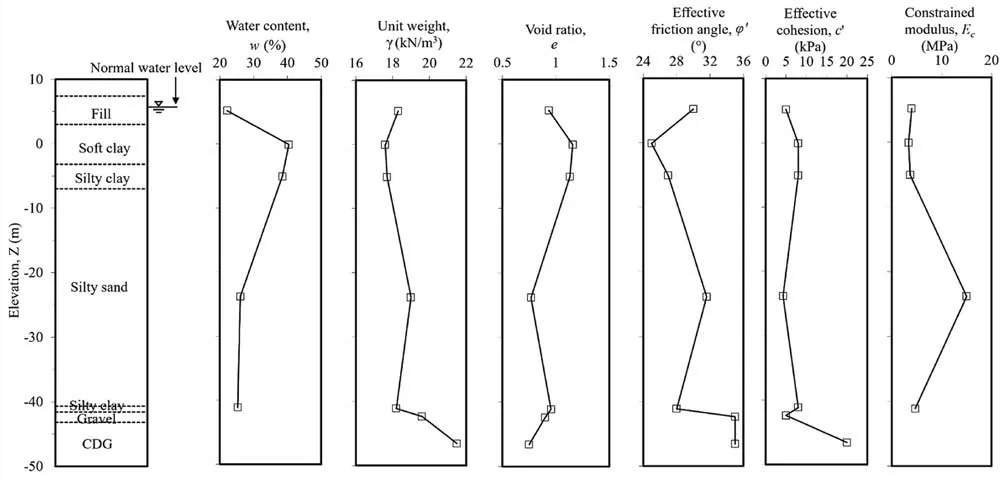
Fig.2.Typical soil profile and geotechnical properties.
2.3.Soil modulus
The soil modulus is a key parameter for estimating soil deformation characteristics and can be either directly estimated from laboratory tests or derived indirectly based on empirical correlations with other in situ tests,such as core penetration test(CPT)and standard penetration test (SPT).By conducting one-dimensional(1D) compression tests,the constrained modulusEcunder an axial stress of 100-200 kPa was estimated.The final excavation level was -8.4 m,and theEcvalues of the top four soil layers (see Fig.2)were anticipated to have a significant effect on the responses of retaining walls and the adjacent box culvert.In this study,the topmost public fill was quite variable and its stiffness was taken as the mean value estimated from multiple compression tests.Fig.3 shows a comparison ofEcversus elevation for the other three soil layers (i.e.soft clay,silty clay and silty sand).The moduli of the former two clay layers ranged between 1.78 MPa and 4.8 MPa.This observation is consistent with the findings of Ni et al.(2021),the moduli of silty clay and soft silty clay for an excavation site in Nanjing scattered around 5 MPa.In comparison,theEcof the silty sand is much stiffer and varies between 11.64 MPa and 18.6 MPa,which is almost three times as those for soft clay and silty clay.The spatial variability of the soil modulus is modelled using geostatistical method,which will be discussed in Section 4.
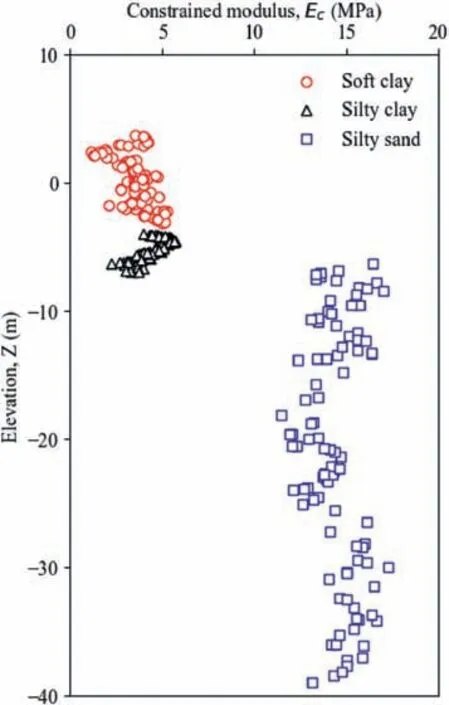
Fig.3.Variation of constrained modulus with elevation.
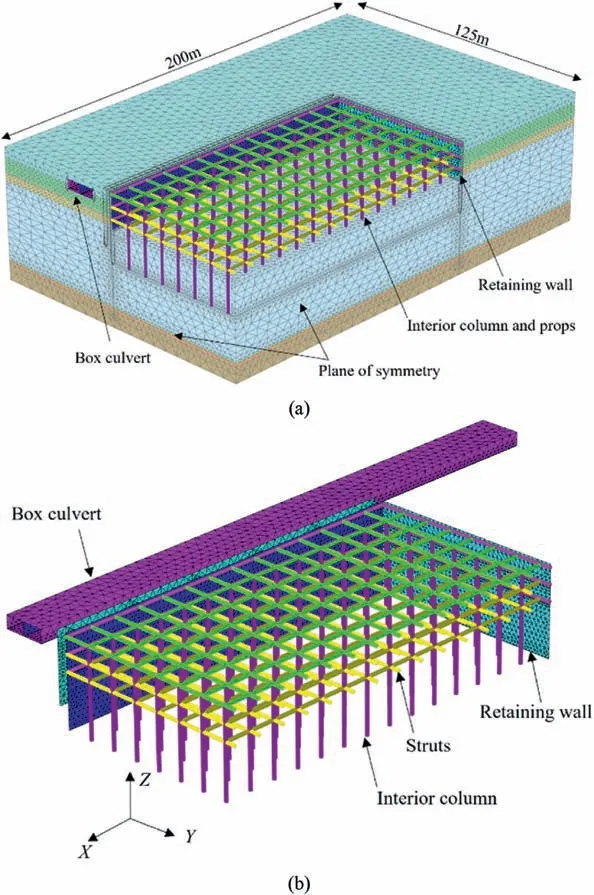
Fig.4.3D finite element mesh of excavation and box culvert: (a) 3D FEM and (b) Box culvert and excavation support system.
2.4.Instrumentation
In this site,various instruments were installed to monitor ground and structure deformations induced by the basement excavation.More specifically,the lateral deflection of bored pile walls was measured by inclinometers.In total,22 inclinometer tubes were installed along the perimeter of the pit(see Fig.1a).To monitor the deformation of the box culvert during stagedconstructions,two rows of building settlement markers (BSMs)were mounted on the base slab near the corners.Each row comprises 29 BSMs,and the typical spacing between adjacent BSMs is 10 m.As the inclinometers and BSMs could only measure absolute differences between successive measurements,benchmark points were set at stationary locations far from the basement.
3.Numerical modelling
3.1.Finite element and boundary conditions
A 3D finite element modelling(FEM)using Plaxis3D was carried out to back-analyse the performance of the box culvert due to the braced basement excavation.Fig.4a shows the 3D finite element mesh adopted in this study to investigate the complex basementsoil-culvert interaction.Subsurface stratigraphic uncertainty is important and can possibly influence the serviceability of geotechnical systems (e.g.Shi and Wang,2022;Wang et al.,2022)such as excavations.Based on the site investigation report,the stratigraphic boundaries between different soil layers are predominantly horizontal.For computational efficiency,a quarter of the full domain was modelled.As a result,the excavation pit has dimensions of 125 m long,65 m wide and 15.8 m high.In comparison,the full FE model had dimensions of 200 m(length) × 125 m (width) × 57.4 m (height).The closest distance between the excavation and model boundary is 60 m,which is equivalent to approximately 3.8 times of excavation depth (i.e.15.8 m).Therefore,it is considered that the model boundaries have minimal effects on the final calculation results.Fig.4b shows the 3D FE mesh of the structures involved in the basement excavation.The bored pile retaining walls were modelled as plate elements using equivalent bending rigidity.Similarly,the box culvert was also modelled using plate elements.The box culvert is made of concrete slabs with a grade of C35 and has a thickness of 0.3 m.In comparison,beam elements were used to model the kingposts and props with dimensions of 0.45 m × 0.45 m and 0.7 m × 0.7 m,respectively.Table 2 summaries the input geometrical and mechanical properties of all the structural elements.

Table 2Summary of geometrical and mechanical properties of structural elements.
In total,the FE model consists of 772,099 10-noded tetrahedral elements and 1,106,641 nodes.Roller supports were imposed on all the vertical sides of the model.This means the soil domain was allowed to deform in the vertical direction.Pin supports were assigned to the base of the model.Therefore,the movements at the base of the model were restrained in all directions.The water table was set as 2 m (i.e.+5.4 m) below the ground surface.All the structural elements were assumed impervious in the numerical simulation.
3.2.Soil model and parameters
In this study,the stress-strain behaviours of soils were modelled using a hardening soil model with small-strain stiffness (HSS),which could capture small-strain responses of soils during excavation process (Atkinson,2000).Table 3 summaries the key HSS model parameters adopted for back-analysing the performance of the braced excavation.Note that the key parameters of HSS model governing the deformation of the excavation system are secant stiffness () in standard drained triaxial test,tangent stiffnessfor primary oedometer loading,and reloading stiffness()from drained triaxial test.Ideally,all the moduli should be directly determined from laboratory tests.In practice,empirical correlations derived from comparable sites within the same region were used to determine HSS model parameters if there were no direct measurements.As a first approximation,the tangent stiffness for primary oedometer loadingis often taken as equal to the constrained modulusEc,which is directly measured in this study:

Table 3HSS model parameters used in the numerical back-analysis.
In practice,it is also relevant to use the typical value for the ratio between(e.g.Lim et al.,2010;Surarak et al.,2012):
A higher ratio may be assumed for loose granular soils or soft clays.Note that excavation process is closely related to soil shearing behaviour.Triaxial tests were carried out to determine shear strength parameters (i.e.friction angle and cohesion),but the soil modulus was not directly measured.On the one hand,the shear modulus measured by conventional triaxial apparatus is relevant for a shear strain between 0.1% and 10%.However,the strain governing the behaviour of retaining structures for excavations ranges between 0.01% and 0.1% (Atkinson,2000),which is beyond the capacity of conventional triaxial apparatus.On the other hand,local codes(DG/TJ,2018)in Shanghai,China,have established empirical correlations between oedometric modulus and the shear modulusat small strain stiffness for different soils (e.g.clay and silty clay).For example,=(2.5-4.9).In this study,the exact proportionality constant for the small-strain shear modulus was back-analysed and calibrated against real lateral deflections of retaining structures and the settlement of the box culvert.Other relevant soil parameters adopted for the back-analysis are tabulated in Table 3.
3.3.Numerical modelling procedures
The adopted numerical modelling procedures essentially follow the major construction stages summarized in Table 1.The numerical simulation started with the establishment of the initial stress condition before excavation by activating the box culvert and removing soils within the box culvert.After reaching stress and strain equilibrium,the excavation proceeded to install bored pile walls and the kingposts,followed by four major excavations or staged-constructions in Plaxis3D.Each excavation level was set at 0.5 m below each prop level,and the ground water table simultaneous lowered to 1 m below the excavation level.The water level outside the excavation remained constant.After each excavation stage,corresponding props were activated to provide lateral support to the excavation.
4.Modelling the spatial variability of soil modulus
4.1.Ordinary kriging
Spatial variability is an inherent property of soils,and Kriging(e.g.ordinary Kriging)is a commonly used geostatistical method for characterization of soil spatial variability and quantification of soil heterogeneities based on spatial covariance model or variogram function(e.g.Webster and Oliver,2007;Wang et al.,2017b,2019b;Balasubramani and Dodagoudar,2022).Kriging is established based on the first law of geography (Tobler,2004),which says that everything is related to everything else,but near things are more related than distant things.As shows in Fig.3,more than 100 soil samples are retrieved from the site for evaluation of soil modulus.Previous studies (e.g.Luo et al.,2020) observed that horizontal spatial variability was far less significant than vertical spatial variability for the majority of soil parameters.Therefore,the first part of this study only focused on the vertical spatial variability of soil modulus.LetZ(xα)denote the random variable(i.e.soil modulus)at depths xα,α=1,2,3 …n,wherendenotes the total number of samples.The first step for establishing Kriging model is the removal of trend associated with the variable.In practice,linear or secondorder polynomial functions are often used to detrend a variable(Zhao et al.,2018).After detrending,the second-order difference between pairs of points at a prescribed spatial correlation length h can be combined and averaged,yielding an experimental variogramγdisas follows (Wackernagel,2003):
whereDdenotes the data domain.The variogramγdisis a simple measure of dissimilarity and can be effectively rewritten in terms of spatial covariance function:
whereC(h)is the covariance between any pair of points with a separation of h.Exponential covariance function is the most commonly used form to model spatial dependence(Firouzianbandpey et al.,2015;Wang et al.,2020).Based on the assumption of intrinsic stationarity that the spatial autocorrelation is only related to the spatial correlation length (h) between two points in space,the theoretical exponential variogramγdis(h)is expressed as follows:
whereais the nugget;λvis the vertical correlation length,which defines a distance where the initial value of the covariance function decreases by a factor ofe.
Note that the parameters required for defining an exponential variogram includes mean,variance,nugget and vertical correlation length,which are determined by fitting experimental variogram or average second-order dissimilarities between pairs of measurements.With the obtained hyper-parameters,it is possible to establish a theoretical exponential variogram for the soil modulus can be established,which can be adopted for generating multiple RFSs of soil modulus profile using different random seeds.
4.2.Automatic random FEM
Section 3.3 mainly explains the procedures for the numerical back-analysis of the basement-soil-culvert interaction.The calibrated model was subsequently combined with generated multiple RFSs of soil modulus for onward random finite element modelling (RFEM).To facilitate the automation of RFEM,a Python script was developed to run all the simulations in this study.A typical modelling procedure (including both pre-processing and post-processing) comprises setting up geological model,mapping soil parameters on FEM mesh,calculations and result output.More specifically,the key steps are outlined as follows:
(1) The soil stratigraphic model is generated based on the geological cross-section interpreted from in situ borehole logs.
(2) The moduli of soft clay,silty clay and silty sand are modelled as random variables using the geostatistical method.Multiple RFSs of moduli are generated and mapped on the FEM mesh.More specifically,the soft clay and silty clay layers are further refined into sublayers of 1 m thickness.In comparison,silty sand is divided into multiple 3 m-thick sublayers.
(3) Multiple staged construction steps are specified to execute the excavation procedures.
(4) A number of FEM models established following above steps 1-3 are executed repeatedly under a framework of Monte Carlo simulation using the Python script.The key results(e.g.wall deflection and settlement of the box culvert) are exported and save as files for subsequent comparison and interpretation.
5.Validation of numerical analysis by field measurements
5.1.Lateral wall deflection
The calibration proceeds by iterating the hyperparameters (e.g.) until the calculated mean absolute error between the measured and computed lateral wall deflections reaches minimal.Fig.5 shows a comparison of measured and computed lateral wall deflections at different excavation stages.As excavations could induce vertical and horizontal stress reliefs,the lateral earth pressure in front of the wall reduces as well.The force imbalance around the retaining walls causes a lateral wall deflection towards the basement,and the lateral deflection tends to increase as the excavation depth increases.The black line with pentagon markers denotes the maximum lateral wall deflection resulted from the first excavation stage(i.e.He=2.2 m)is about 6.6 mm.Note that the toe of the bored pile wall remains almost stationary.When the excavation proceeds to -0.1 m (i.e.He=7.5 m),there is a dramatic increase in the maximum lateral deflection from 6.6 mm to 21.8 mm(i.e.0.29%He),and the location of the maximum deflection shifts from the top of the wall to 6.35 m below the ground surface.This can be attributed to the additional lateral constraint imposed by the first props at elevation of+4.2 m,which prevents the further inward deflection at locations close to the top of the wall.Similarly,there is minimal wall movement at the toe of the wall.When the excavation depth further increases toHe=12.8 m andHe=15.8 m,the maximum wall deflection rises significantly to 39.8 mm(0.31%He)and 56.6 mm(0.36%He),respectively.The maximum deflection at the final excavation stage falls well within the limit of 0.4%Hestipulated by the Chinese code (GB 50497,2019) and 0.5%Hespecified by BS 8002(1994),which may imply that the bored pile wall is an effective support system to control excessive ground deformations.As pointed out by Shi et al.(2015a)and Ni et al.(2021),the maximum lateral deflection could range between 0.05%Heand 0.85%He,depending on the support types and construction methods.The lateral movement at the toe of the bored pile wall gradually develops as the excavation proceeds,and finally reaches a maximum of 11.3 mm(i.e.20%of the maximum lateral deflection).In comparison,there is minimal movement at the top of the wall as a result of strengthening effects imposed by multiple layers of props.
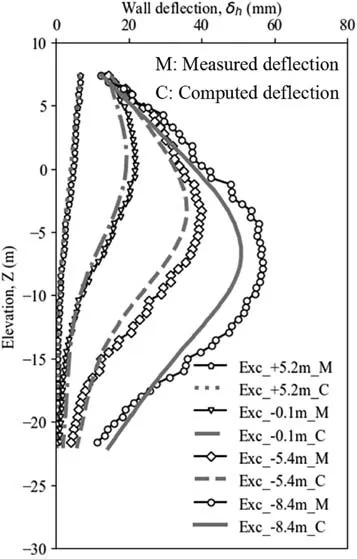
Fig.5.Comparison between measured and calculated lateral deflections at Inclinometer 6 (INC6).
To investigate the stress-transfer mechanisms,a numerical back-analysis using the soil parameters listed in Table 3 was carried out.The computed results are replotted in Fig.5 for comparison.It is found that the computed lateral deflection almost overlaps with the measured profile during the first excavation stage (i.e.He=2.2 m).Observable differences occur during the second excavation stage (i.e.He=7.5 m) and continue to enlarge with a final maximum difference of about 5.7 mm,which is only 10%of the measured maximum lateral deflection.The good agreement between the computed and measured results indicates that the constitutive model and model parameters adopted in this study are suitable.The calibrated numerical model can then be combined with multiple RFSs of soil modulus to investigate effects of spatial variability of soil stiffness on basement-soil-culvert interaction.The adopted Hardening soil model enables the accurate modelling of degradation of shear modulus with shear strain.In comparison,if the Mohr-coulomb principle is adopted,the nonlinear stiffness cannot be accurately modelled.Instead,the elastoplastic model with relatively small shear modulus tends to overestimate the lateral wall deflection and box culvert settlement.
5.2.Settlement of box culvert
Fig.6 shows a comparison of measured and computed box culvert settlements due to the adjacent basement excavation.Similarly,solid lines with pentagon and triangle markers represent settlements of box culvert when the excavation depth reaches 2.2 m and 7.5 m,respectively.Different from the lateral wall movement shown in Fig.5,the settlement of box culvert is quite small even with an excavation depth of 7.5 m.This can be attributed to the fact that the base slab of the box culvert has an embedment depth of 6.55 m as shown in Fig.1b.Significant settlements are induced in the box culvert when the excavation depth increases to 12.8 m.It can be seen that there is a rapid increase in the measured settlement at a longitudinal distance (X) between 20 m and 70 m.This is attributed to the fact that the excavation pit mainly locates atX=50-175 m and the portion of the box culvert lying closest to the ongoing excavation is more prone to suffering settlements.During the final excavation stage,the box culvert experiences a two-fold increase in the measured maximum settlement from 10 mm to about 25 mm.The longitudinal angular distortion,calculated as the ratio between consecutive settlement difference and longitudinal separation distance,is 1/1400.The general accepted limits are 1/500 for serviceability criteria and 1/150 for structural damage in the UK,and the limiting angular distortion for tunnelling projects ranges between 1/700 and 1/1000(Wahls 1981).For this particular excavation case,the excavation-induced angular distortion along the box culvert lies well below the various limits.The computed results have also been superimposed in Fig.6 for comparison.In general,there is a good fit between the measured and computed results particularly during the first three excavation stages (i.e.He=12.8 m or excavate to-5.4 m).The computed settlement at the final excavation stage tends to underestimate the actual settlement with a maximal difference of approximately 5 mm,accounting for 16.7% of the measured maximum settlement.The consistency between measured and computed settlement profiles further validates the adopted modelling procedures and soil parameters summarized in Table 3.The longitudinal settlement of the box culvert cannot be captured if conventional 2D numerical analyses are carried out,which further emphasizes the importance of 3D analysis in this study.
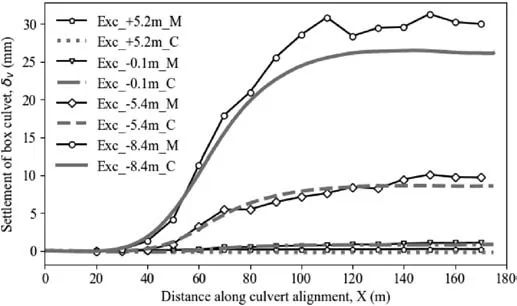
Fig.6.Measured and computed box culvert settlements due to basement excavation.
6.Results from geostatistical analysis
As mentioned above,detrending is required before establishing a variogram function.Fig.7 shows the detrending results for constrained modulus for the three soil layers(i.e.soft clay,silty clay and silty sand).It can be seen that the overall trend of constrained modulus for each soil layer can reasonably be described by a secondorder polynomial function.The goodness-of-fit values measured by theR2of determination are 0.26,0.69 and 0.16 for soft clay,silty clay and silty sand,respectively.Detrending is a challenging process as the form of the trendfunction(eitherlinearornonlinear)isnot knownfor sure in practice (e.g.Wang et al.,2019a),and selection of the trend functions should be consistent with local geology (e.g.Uzielli et al.,2005).In literature,the trend function is simply estimated by regression analysis using either linear or polynomial curve fittings(Dasaka and Zhang,2012).Stationarity of the data is often achieved using a low-order polynomial trend of no higher than quadratic(Lumb,1974;Brooker,1991),and a high-order polynomial trend function tends to induce overfitting problem.Due to the nonlinearity of the constrained modulus with depth,a quadratic function is adopted to fit the measurements in this study.After detrending,experimental variograms can be evaluated from the residual of constrainedmodulusdatausingEq.(4).Exponentialcorrelationfunctions are used to fit the experimental variograms using the least-square method,and the associated parameters (e.g.variance and vertical correlation length)can be determined accordingly.The goodness-offit values measured by theR2coefficient of determination are 0.56,0.64and0.09forsoft clay,siltyclayandsiltysand,respectively.Ideally,the variogram function form should be selected from the data using advanced technologies such as Bayesian model selection (Cao and Wang,2014).The exponential autocorrelation function is commonly adopted for random field modelling of soil properties(e.g.Dasaka and Zhang,2012;Wang et al.,2020;Wu et al.,2022).To align with the conventional practice,exponential function is used to model the spatial variability of constrained modulus.The results of the fitted variograms are shown in Fig.8.Essentially,the intercept of the fitted variogram represents the nugget,which denotes the abrupt change at a very small scale.The value corresponding to the plateau represents the variance of constrained modulus.Fig.8a shows the fitted variogram for soft clay.Obviously,the obtained exponential variogram can reasonably capture the spatial variation of the experimental variogram.It is found that the estimated nugget,variance and vertical correlation length are 0.4,0.92 and 1.55 m,respectively.In comparison,the estimated variances for the silty clay (see Fig.8b) and silty sand(see Fig.8c)are 0.11 and 3.23,respectively.Corresponding vertical correlation lengths are 1.32 m and 1.59 m.Note that the vertical correlation lengthforthe constrained modulus has a narrow variation of between 1.3 m and 1.6 m,which is essentially consistent with the recommended range of 0.4-5 m for Young’s modulus in tunnelling and shallow foundation projects(Huang et al.,2017b;Lo and Leung,2019;Lu et al.,2020).The results in Fig.8 actually provide valuable parameters for random field modelling of constrained modulus for excavation projects.
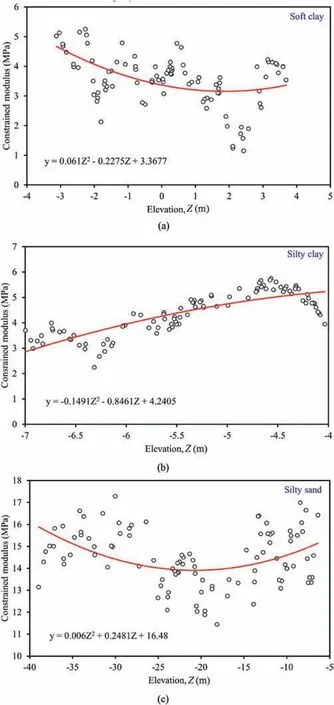
Fig.7.Detrending of constrained modulus with elevation: (a) Soft clay;(b) Silty clay;and (c) Silty sand.
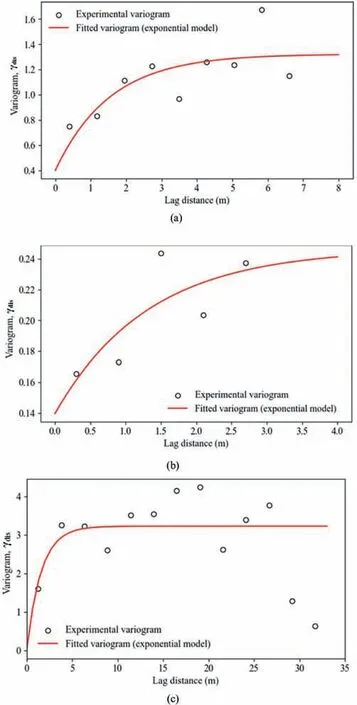
Fig.8.Estimated variogram for constrained modulus: (a) Soft clay;(b) Silty clay;and(c) Silty sand.
With the obtained hyperparameters for theoretical variograms,multiple RFSs of soil modulus can be generated for soft clay,silty clay and silty sand following the procedures described in Section 4.1.Fig.9 shows the generated 100 RFSs of constrained modulus for different soils.It can be seen that soft clay (see Fig.9a) mainly distributes at a depth of between +3 m and -3 m with a range of 1-6 MPa.In comparison,the modulus of silty clay in Fig.9b is more concentrated with a small oscillation between 2.5 MPa and 4.5 MPa,which is consistent with the small variance shown in Fig.8b.In addition,Fig.9c shows the multiple RFSs of constrained modulus for silty sand,which has a large thickness and a relatively wild variation in the modulus.
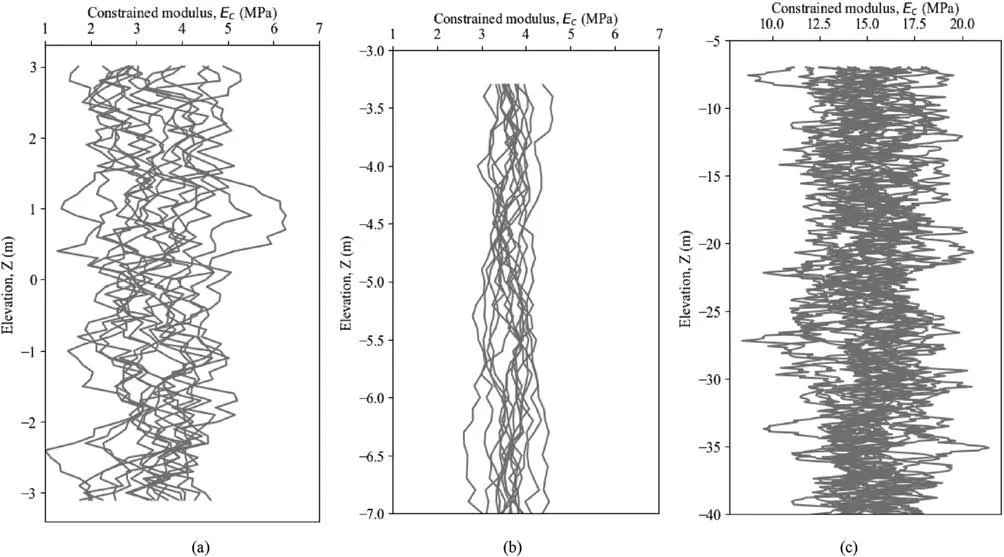
Fig.9.RFSs of soil constrained modulus: (a) Soft clay;(b) Silty clay;and (c) Silty sand.
7.Stochastic structural responses induced by excavation
Each of the 100 RFSs was mapped on the FE mesh for 3D numerical analyses by Monte Carlo simulation.Due to the large number of elements and nodes,the time required for each numerical analysis was about 10 h using a computer with Intel (R)Core(TM) i7-10750H CPU @ 2.60 GHz and 32 GB RAM.
7.1.Stochastic wall deflection
Fig.10a shows the stochastic results for the lateral wall deflection.The black line with circle markers denotes the wall deflection along INC6 after reaching the final excavation level (i.e.He=15.8 m).The grey lines represent the deflection profiles resulted from multiple Monte Carlo samples.The maximum lateral deflection ranges between 40 mm and 65 mm,equivalent to 0.25%Heand 0.41%He,respectively.There is a possibility for the lateral wall deformation exceeding the serviceability limit if the acceptable deflection is set as 0.4%He(GB 50497,2019).Similarly,the pile toe exhibits a large movement towards the excavation side,and the value varies between 10 mm and 31 mm,which almost accounts for half of the computed maximum wall deflection.The large variation is mainly attributed to the vertical spatial variability of constrained modulus for silty sand.Based on the 100 deflection profiles,the best estimate and associated 90% confidence interval (i.e.5% and 95%percentiles) can also be derived.It can be seen that the best estimate (i.e.the red solid line) reasonably follows the measured deflection profile with the largest discrepancy occurring close to the wall toe.In comparison,the 90%confidence interval(i.e.the red dashed lines) can almost fully enclose the measured profile.The wall deflection calculated using deterministic design soil parameters has a chance of underestimating or deviating from the “true”wall deformation,which further demonstrates the importance of taking spatial variability of soil property into consideration.As the majority of the supporting pile lies in the silty sand,it is anticipated that the spatial variability of stiffness for silty sand has an overwhelming effect on the lateral wall deflection and the box culvert settlement.If the spatial variability is ignored,the predicted response of lateral wall and box culvert tend to resemble the deterministic predictions in Figs.5 and 6.With the obtained multiple deflection curves,it is also possible to carry out rational probabilistic design based on a specified risk level.For example,for monitoring of lateral wall deflections,the alarm level can be set as the lower 90% threshold.Once the level is exceeded,the real construction activities and ground conditions should be revisited to enable an updated analysis.The adoption of a lower 90%threshold as the alarm level provides flexibility for adjustment.A separate analysis was also carried out to compare the results from 2D RFEM and 3D RFEM along the centreline of the excavation.Results indicate that 2D RFEM tends to slightly overestimate the lateral wall deflection and is considered appropriate for practical engineering design and analysis if the maximum value is the primary interest.On the other hand,3D RFEM should be conducted upon realistic soil-structure interaction.
The maximum lateral wall deflection estimated from each Monte Carlo sample can be collected and concisely represented within a single histogram plot.Fig.10b shows the statistical analysis of the maximum wall deflection.Clearly,the obtained deflection values can reasonably be described by second-order statistics,i.e.mean (μ) and standard deviation (σ),withμ=51.8 mm andσ=4.6 mm.It is also observed that one out of the 100 obtained maximum wall deflection is more than the serviceability limit of 63.2 mm (or 0.4%He).In other words,the probability of serviceability failure (pf) is 0.01 (=1/100).From the variogram result of silty sand in Fig.8c and generated RFSs in Fig.9,the associated COV is estimated to be around 0.1 (=3.23°.5/15),which is quite close to the lower bound of typical COV range for vertical spatial variability of soil parameters (Sert et al.,2016).It is anticipated that the probability of serviceability exceedance will increase if the vertical spatial variability of soil modulus increases.
Fig.11 shows the relationship between the maximum lateral wall deflection(δhm)and excavation depth(He).The red triangles represent the measurements from INC6 in this study.As expected,there is a continuous increase in the maximum wall deflection with excavation depth.In addition,all the measurements are essentially lie well below the line of 0.35%He.The 90%confidence intervals estimated from multiple RFSs (i.e.the red dashed lines) can well enclose the measuredδhm.For comparison,the data collected from different excavation sites using different retaining structures are superimposed.More specifically,three sites from the USA (i.e.Chicago and San Francisco)and Oslo using sheet pile walls (Mana and Clough,1981) are included.In addition,cases histories of excavation in soft clays from Singapore and China (i.e.Taipei and Shanghai) are also incorporated(Hulme et al.,1989;Wallace et al.,1993;Wang et al.,2005;Shi et al.,2015b),and these projects mainly rely on diaphragm walls (DW) for providing lateral support.Essentially,the measured maximum deflections in this study are quite close to the upper bound of reported deflections in Shanghai,which mainly lie below the line of 0.35%He.In addition,some deflection data from China (e.g.Taipei) and Singapore are less than the measuredδhmin this study but with a large scatteredness of between 0.05%Heand 0.85%He.In other words,the bored pile wall used in this study is a relatively flexible retaining system as compared with the DW system.In contrast,the data from Chicago,Oslo and San Francisco record a large wall deflection,which is of the magnitude of 0.85%Heor larger,because soldier pile walls or sheet pile walls are used to support the basement excavation.Clearly,sheet pile walls (SPWs) are considered more flexible than the bored pile wall used in this study,and flexible retaining systems are expected to result in relatively large lateral wall movements.In other words,the performance of a braced excavation is significantly affected by the stiffness of retaining walls.If there are important or sensitive structures located within the influence zone of a basement excavation,stiff retaining systems such as DW should be adopted.
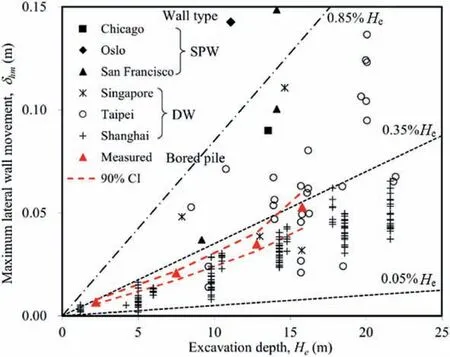
Fig.11.Relationships between maximum lateral movement and excavation depth.
7.2.Stochastic settlement patterns of box culvert
Fig.12a shows the stochastic settlements of the box culvert at the final excavation stage(i.e.He=15.8 m).The black solid line with circle markers denotes the measured settlements from BSMs.The multiple grey lines represent settlement curves estimated from 100 Monte Carlo samples of soil modulus.Note that the computed settlement curves exhibit an increasing trend with the horizontal distance along the alignment(X)of the box culvert,and vary wildly with a range of 20-37 mm atX>120 m,which almost accounts for 50% of the measured maximum settlement.Note that the box culvert has an embedment depth of about 6.55 m.It is anticipated that the settlement profile may be more severe if with a shallower embedment.The results can be concisely represented by the best estimate and 90% confidence interval.It can be seen that the derived best estimate (i.e.the red solid line) exhibits an S-shaped pattern,which grows rapidly from 0 mm to about 28 mm atX=125 m and becomes stable thereafter.Despite the scatteredness of the measured settlement curve,the best estimate can capture reasonably the overall trend.In addition,the 90% confidence interval (i.e.the red dashed lines) can fully enclose the measured settlement curve.Note that the 90% confidence interval is solely resulted from the vertical spatial variability of constrained stiffness.It may imply that the spatial variability of soil stiffness has a significant effect on the response of the box culvert in close proximity to a bulk excavation.Note that it is conventional to carry out 2D random finite element analysis for excavation problems.However,this practice cannot tackle the real 3D soil-structure interaction,as the case in this study.For example,a 2D analysis can only calculate the maximum settlement of box culvert but cannot evaluate the longitudinal settlement trough of the existing box culvert subjected to basement excavation.The angular distortionη,calculated as settlement difference over distance,is also derived from the settlement curves in Fig.12a and b.The derived angular distortion from measurements exhibits a large fluctuation with a peak of about 1/1667.For the results derived from Monte Carlo samples,there is a monotonic increase in the angular distortion when the horizontal distance increases from 0 m to 60 m,followed by a reduction to about 0 atX=125 m.The peak angular distortion of each curve predominantly occursX=60 m,and the peak angular distortions from multiple Monte Carlo samples vary between about 1/2000 to 1/1400.The derived 90% confidence interval can reasonably capture most variations inηderived from the measured settlement curve.It is also worth mentioning that although the computed values are well below the serviceability limit of 1/1000(Wahls 1981),the implication is that the vertical spatial variability of soil stiffness can significantly influence deformations of the box culvert.
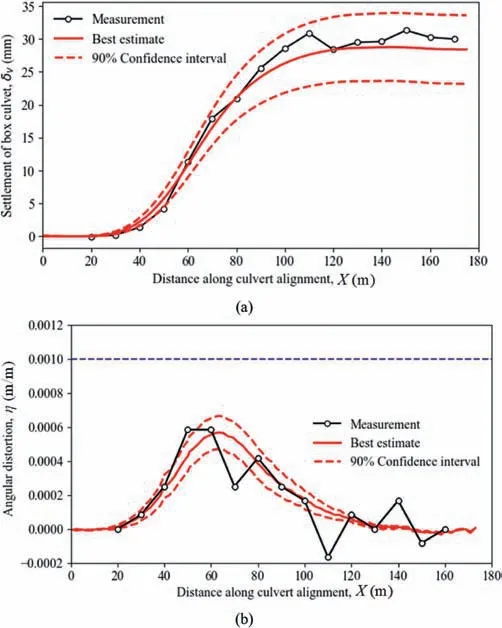
Fig.12.Response of box culvert at the final excavation stage from 100 random simulations: (a) Settlement;and (b) Angular distortion.
8.Effects of 3D spatial variability of soil stiffness
In the context,only vertical spatial variability of soil modulus is explicitly considered for the stochastic analysis of soil-structure interaction.Although some studies (e.g.Luo et al.,2020) show that the horizontal spatial variability is far less significant than the vertical spatial variability for a majority of soil parameters.It is still worthwhile to investigate the effects of horizontal spatial variability of soil stiffness to render an actual 3D stochastic analysis of soil-structure interaction in this study.
The horizontal variogram function can be established for different soil types.Due to page limit,only the horizontal variogram function for the stiffness of silty sand is shown in Fig.13.It is assumed that the horizontal variogram is isotropic,and the fitted horizontal variogram exhibits an exponential increase with the horizontal lag distance.The estimated horizontal SOF is 82 m,which is much larger than the vertical SOF shown in Fig.8c.In other words,the correlation of soil stiffness is weaker in the horizontal direction than that in the vertical direction.Using the fitted horizontal and vertical variogram parameters for different soils,a 3D exponential correlation function (Fenton and Griffiths,2008) is adopted to generate multiple 3D random fields,which serves as the input for 3D finite element analysis.
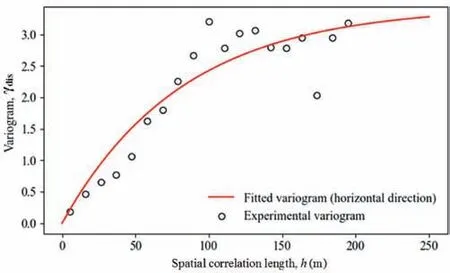
Fig.13.Horizontal variogram plot for silty sand.
Fig.14 shows the comparison of measured and computed wall deflections and box culvert settlements subject to 3D spatial variability of soil stiffness.The red lines in Fig.14a represent the best estimate and corresponding 90% confidence interval for the lateral wall deflection when only the vertical spatial variability of soil stiffness is considered.In comparison,the blue solid line is the best estimate of lateral deflection with explicit consideration of both horizontal and vertical spatial variability.The deflection under combined horizontal and vertical spatial variability merely changes the overall trend,and the largest discrepancy is less than 10%.Similarly,the blue dashed lines represent the corresponding 90% confidence interval subjected to 3D spatial variability.Although the trend of deflections is similar,the confidence interval slightly expands due to the consideration of horizontal spatial variability of soil stiffness.Fig.14b shows the comparison of box culvert settlements.When both horizontal and vertical spatial variability of soil stiffness is considered,the best estimate slightly increases by around 10%as compared with that induced by purely vertical spatial variability.There is also a slight expansion in the associated 90% confidence interval.The comparison in Fig.14 indicates that the horizontal spatial variability of soil stiffness has a minor effect on the overall soil-structure interaction.This is because the horizontal SOF is relatively large (i.e.82 m),and soil parameters are relatively homogenous in a localized region.Therefore,it is reasonable to conclude that the vertical variability of soil stiffness plays a significant role in determining the overall performance of the supporting walls and the box culvert in this study.
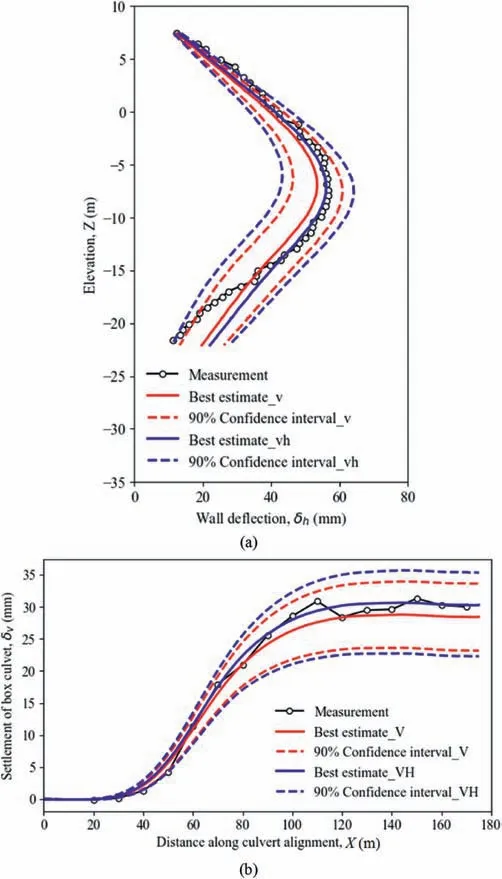
Fig.14.Effects of 3D spatial variability on soil-structure interaction: (a) Lateral wall deflection;and (b) Settlement of box culvert.
9.Conclusions
In this study,a 3D FEM analysis is carried out to investigate the effects of soil spatial variability on the wall deflections and settlements of an adjacent box culvert due to a braced excavation.Based on the measured and computed results,the following conclusions can be drawn:
(1) Upon completion of the basement excavation,the measured maximum lateral wall deflection is about 0.36%He.The magnitude is less than the typical deflection range induced by pipe pile walls but a bit more than that caused by DW.This indicates the bored pile wall system used in this study has intermediate support stiffness and is effective in preventing excessive wall deflections.In addition,the excavation induces considerable longitudinal differential settlements with a maximum angular distortion of 1/1667 in the existing box culvert,which is 10 m or 0.6Heaway from the excavation pit.
(2) The vertical spatial variability of soil constrained modulus can be modelled using geostatistical analysis.Based on the experimental data,the soil constrained modulus of three soils in the excavate site can well be fitted by an exponential variogram,and the associated vertical correlation length varies from 1.3 m to 1.6 m.
(3) The spatial variability of soil stiffness has a significant effect on the variations of retaining wall deflections and settlements of the adjacent box culvert.It shows that an analysis using deterministic design parameters tends to underestimate the wall deflections and culvert settlements,and the adopted RFEM analysis can better predict the responses of retaining wall and the box culvert,which provides a valuable tool for probabilistic design and analysis of excavations.The 3D numerical analysis enables the quantitative analysis of the longitudinal differential settlement or angular distortion induced in the existing box culvert in a probabilistic manner.
Declaration of competing interest
The authors declare that they have no known competing financial interests or personal relationships that could have appeared to influence the work reported in this paper.
Acknowledgments
The authors would like to acknowledge the financial support provided by the National Natural Science Foundation of China(Grant No.41977240)and the Fundamental Research Funds for the Central Universities (Grant No.B200202090).
 Journal of Rock Mechanics and Geotechnical Engineering2023年12期
- Journal of Rock Mechanics and Geotechnical Engineering的其它文章
- The formation of orthogonal joint systems and cuboidal blocks: New insights gained from flat-lying limestone beds in the region of Havre-Saint-Pierre (Quebec,Canada)
- Numerical analysis of the effects of vesicle distribution characteristics on the engineering properties of volcanic rocks
- A hybrid attention deep learning network for refined segmentation of cracks from shield tunnel lining images
- 3D limit analysis of rock slopes based on equivalent linear failure criterion with tension cut-off
- Mutual impact of true triaxial stress,borehole orientation and bedding inclination on laboratory hydraulic fracturing of Lushan shale
- Unloading-induced permeability recovery in rock fractures
