The formation of orthogonal joint systems and cuboidal blocks: New insights gained from flat-lying limestone beds in the region of Havre-Saint-Pierre (Quebec,Canada)
Shocheng Ji,Yvéric Rousseu,Denis Mrcotte,Noh John Phillips
a Département des Génies Civil,Géologique et des Mines,École Polytechnique de Montréal,Montréal,Québec,H3C 3A7,Canada
b Department of Geology,Lakehead University,Thunder Bay,Ontario,P7B 5E1,Canada
Keywords:Plato’s cuboids Orthogonal joints Fracture spacing Limestone Layered rock mechanics Appalachian geology
ABSTRACT Vertical orthogonal joints are a common feature in shallow crustal rocks.There are several competing theories for their formation despite the ubiquity.We examined the exceptional exposures of orthogonal joints in flat-lying Ordovician limestone beds from the Havre-Saint-Pierre Region in Quebec,Canada(north shore of Saint-Lawrence River)to test conceptual models of joint formation in a natural setting.In the region,the spacing of cross-joints is consistently larger than the spacing of systematic joints by a factor of 1.5 approximately.The joint-spacing-to-bed-thickness ratios(s/t)are much larger in these beds(s/t=4.3 for systematic joints,and 6.4 for cross-joints) than those in higher strained strata along the south shore of the Saint-Lawrence River (s/t=1),highlighting the effect of tectonic strain in decreasing fracture spacing and block size.The high values of s/t indicate that cross-joint formation was unlikely caused by a switch from compression to tension once a critical s/t ratio for systematic joints was reached(as hypothesized in previous studies).We proposed a new model for the formation of orthogonal joint systems where the principal stress axes locally switch during the formation of systematic fractures.The presence of ladder-shaped orthogonal joints suggests a state of effective stress with σ1*≫0 >σ2*>σ3* and where σ2*-σ3* is within the range of fracture strength variability at the time of fracture.This research provides a new mechanical model for the formation of orthogonal joint systems and cuboidal blocks.
1.Introduction
Plato,the Greek philosopher who lived in 424-347 BC,dedicated his life to understanding the world through philosophy.He believed that the ideal form of Earth’s building blocks was a cube because they could be tightly packed together without any gaps.Recent research by a team of mathematicians,physicists,and geologists from multiple universities has confirmed Plato’s theory by showing that the average shape of rock fragments on Earth’s surface is topologically a cube(Domokos et al.,2020).Cuboidal blocks form at the Earth’s surface when layered rocks in the upper crust are fragmented by orthogonal fractures or joints.Understanding the mechanics of orthogonal joint formation is therefore fundamental to perceive the formation of cuboidal blocks at Earth’s surface.
Orthogonal joints,consisting of two sets of mutually perpendicular opening fractures,are commonly found in flat-lying sedimentary rocks such as limestones and sandstones in foreland basins and platforms(Hancock et al.,1987;Dunne and North,1990;Pinet et al.,2015;Jiang et al.,2016;Li and Ji,2021).These joints exhibit two main patterns in flat-lying strata: (i) a ladder-shaped system in which cross-joints develop between long systematic joints but do not extend across them(Gross,1993;Rives et al.,1994;Rawnsley et al.,1998;Pinet et al.,2015),and (ii) a checkerboardshaped system,also known as a fracture grid-lock or crosscutting network,in which orthogonal sets of joints consistently intersect (Hancock et al.,1987;Rives et al.,1994;Caputo,1995;Li and Ji,2021).Erosion and weathering along these joints(Hencher,2014;Hencher and Knipe,2007) create unique landforms,such as tessellated pavements(Branagan,1983),rocky buttes in the southwest USA (Migoń et al.,2017;Li and Ji,2021),and Danxia-style landscapes in China(Ji,2019;Wang et al.,2020).Rocks containing orthogonal joints display increased permeability,reduced strength,and are more relevant to geotechnical excavation compared to rocks with a single set of joints (Cooke et al.,2006;Olson et al.,2009;Hardebol et al.,2015).Understanding the development of orthogonal joints is crucial for examining the fracture mechanics of layered rocks in their natural state,determining the orientation and magnitude of past stresses,evaluating the hydrological properties of jointed rocks,and exploring the development of complex landforms.
The development of orthogonal joints remains enigmatic despite their relative abundance.Joints are extensional (mode-I)fractures which develop normal to the minimum principal stress(σ3) (Bai et al.,2002;Van der Pluijm and Marshak,2004).Orthogonal joints therefore imply that rotation of theσ3direction by 90°has occurred(e.g.Hancock et al.,1987;Mandl,2005).This rotation has been interpreted to be regional in some cases and local in others.Regional stress rotations are hypothesized due to flexure in a forebulge setting(Billi et al.,2006;Pinet et al.,2015;Ferrill et al.,2021),waning compression in the foreland of a fold-and-thrust belt(Dunne and North,1990),or fluctuation of regional tectonic stresses(Hancock et al.,1987).Local stress rotations may be caused by a local swap betweenσ2andσ3axes (σ1remains vertical) due to (i)stress release on newly-created systematic fractures (Simón et al.,1988;Caputo,1995),or (ii) a stress switch from compressive to tensile below a critical joint-spacing-to-bed-thickness ratio (Bai et al.,2002;Boersma et al.,2018).For quartz arenite beds,it is suggested that checkerboard-shaped orthogonal joints can develop coevally from auxetic effects(i.e.a negative Poisson’s ratio;Li and Ji,2021)or from up-doming due to magma intrusion or salt diapirism(Adamovič and Coubal,2015).
This paper presents findings on ladder-shaped orthogonal joints in flat-lying middle Ordovician limestone beds in Havre-Saint-Pierre Region,Quebec,Canada.We conducted a systematic analysis of joint spacings and bed thicknesses to test the relationship between cross joint spacings and systematic joint spacings (as suggested by Gross,1993) and whether the formation of crossjoints depends on a critical joint-spacing-to-bed-thickness ratio in the systematic joints(s/t=1,as proposed by Bai et al.,2002).Our results show that a critical joint-spacing-to-bed-thickness ratio for systematic joints is not necessary for the development of crossjoints.Based on these findings,we proposed a new conceptual model for the formation of orthogonal joints in limestone beds in Havre-Saint-Pierre,which resulted in cuboidal blocks.This model may also be applicable to other foreland regions with layered sedimentary rocks.For general information on joints and the mechanics of rock fractures,readers may consult Hancock (1985),Engelder (1987),Pollard and Aydin (1988),Mandl (2005),and Gudmundsson (2011).
2.Geological setting
The tessellated pavements under investigation occur along the northern coast of the Gulf of Saint-Lawrence and are part of the middle Ordovician Mingan Formation.The Mingan Formation consists of a basal cross-bedded sandstone followed by a fossiliferous limestone,which signals a transition from a coastal to a marine environment(Desrochers and James,1988).This formation is conformably overlain by the Lower Ordovician Romaine Formation and unconformably overlies the high-grade metamorphic rocks of the Proterozoic Grenville Orogeny(Fig.1).Both the Mingan and Romaine Formations were deposited on the passive continental margin of Laurentia,located in the northwest of the Iapetus Ocean (St-Julien and Hubert,1975;Sanford,1993;Lavoie et al.,2003),and are part of the autochthonous Saint-Lawrence Platform (Pinet et al.,2014).During the Taconian Orogeny,the passive continental margin moved southeastward due to the subduction of the Iapetus Ocean under the Taconic island arc(Williams,1995;Van Staal,2005;Lavoie,2008).
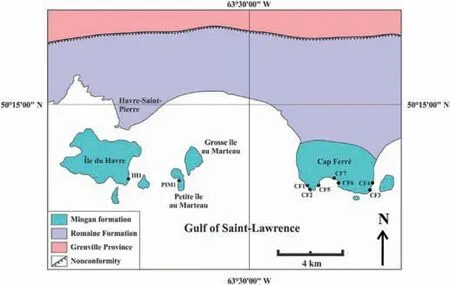
Fig.1.Study sites in Havre-Saint-Pierre,Canada.
The limestone of the Mingan Formation,where the orthogonal joints are developed,is primarily composed of calcium carbonates and contains less than 10% magnesium carbonates and less than 10%impurities,such as sandy and clay materials.This limestone is located far from the Appalachian deformation front(approximately 150 km from Logan’s Line that is the surface expression of the deformation front;Pinet et al.,2014).The limestone is weakly deformed,with orthogonal joints (Fig.2) being the only observed deformation structures at sites on the Mingan Islands and Cape Ferré.The bedding of the sedimentary rocks in the region of Havre-Saint-Pierre is almost flat-lying,with a gentle southward dip of no more than 3°,and lacks conspicuous folds or faults.
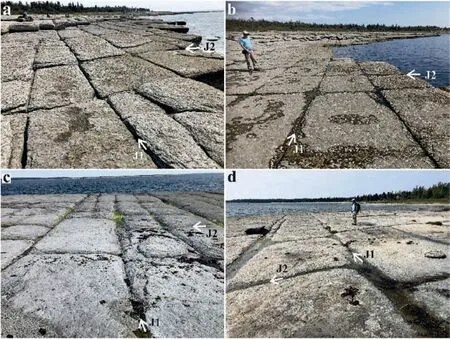
Fig.2.Typical outcrops showing orthogonal joints viewed on the bedding plane surface of limestone: (a-b) Site CF1;(c) Site IH1;and (d) Site CF7.
Orthogonal joints are well-developed within the limestone beds which are interlayered with thin layers of calcareous shale.These joints are clearly visible on remote-sensing images(e.g.on Anticosti Island,Bordet et al.,2010;Pinet et al.,2015) and on Google Earth(e.g.at checkered rocky sites on Ile du Havre,Ile aux Goélands,Ile Herbée,and Cape Ferré).Excellent exposures which extend continuously for several hundred meters provide an ideal location for detailed measurements of joint spacing and bed thickness and a unique opportunity to test hypotheses for the formation of orthogonal joints.
3.Observations and measurements
Orthogonal joints are examined at eight selected locations in the Havre-Saint-Pierre region (see Fig.1: sites CF1,CF2,CF3,CF4,CF6,CF7,IH1,and PIM1).At each site,two sets of orthogonal,planar,vertical to near-vertical (>80°) joints are observed (with one set striking approximately 100°and the other set striking approximately 010°,referred to as sets J1 and J2,respectively;see Figs.2-4).Sets J1 and J2 are opening mode fractures or joints which display no significant shear movement (Hancock,1985;Jiang et al.,2016;Bao et al.,2019;Ferrill et al.,2021;see Figs.2 and 3).J1 joints exhibit a consistent strike and are straight and persistent over distances of 20-50 m.J2 joints,mostly cross-joints,extend between intervals of long,parallel J1 joints,but typically do not cut across them,forming a ladder-like pattern.All the observed J1 and J2 joints are stratabound,meaning that they traverse individual limestone beds and terminate at their upper and lower contacts with adjacent shale layers.These orthogonal joints,in conjunction with the bedding plane,divide the limestone beds into right-angled cuboidal blocks.The result is a distinctive tessellated pavement pattern on the bedding plane (as described by Branagan,1983;Li and Ji,2021),giving the area a three-dimensional (3D) appearance of rectilinear limestone boxes.Water carrying abrasive materials are channeled through the joints,which,along with dissolution reactions,erode and weather the joints to form furrows in a ladder or checkerboard pattern (Figs.2 and 3).This phenomenon supports the argument that surface processes,such as unloading,dissolution,corrosion,weathering,erosion,and removal of micro-bridges,can enhance the visibility of joints at the Earth’s surface (e.g.Hencher and Knipe,2007;Hencher,2014).These surface processes primarily increase the apertures of joints formed by past tectonic brittle deformation,but do not alter their orientation or spacing.
Three types of geometric relationships between neighboring J1 and J2 joints have been observed in the Havre-Saint-Pierre region(Fig.3).Type 1 occurs when a J2 joint terminates at a J1 joint,indicating that J2 is relatively younger than J1 (Hancock,1985;Gross,1993;Rives et al.,1994;Jiang et al.,2016).The presence of plume structures composed of hackles shows that the J2 fracture was initiated from an irregularity on the existing J1 fracture and then propagated outward perpendicular to it (Fig.3d).Type 2 consists of cross-shaped (+) J1 and J2 joints,and their temporal relationship is indeterminate.The J2 joints are believed to have been initiated and propagated outward in both directions from the same flaw on the existing J1 joint.Type 3 occurs when a J1 joint abuts against a J2 joint,showing that the new J1 is locally younger than the older J2.These three types of joints are illustrated in Fig.3.
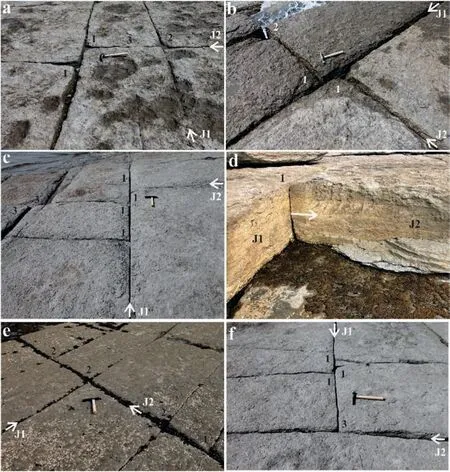
Fig.3.Abutting and crosscutting relationships between orthogonal J1 and J2 joints.Type 1: J2 joint terminating at J1 joint (a-d,and f);Type 2: J1 and J2 joints are mutually crosscutting,giving rise to a cross-shaped intersection(a-b and e).Type 3:J1 joint abuts against J2 joint(a,c and f).In(d),plume structures made up of hackles,indicating that the J2 fracture is initiated from the existing J1 fracture and then propagates outward perpendicularly to it (The hammer of 32 cm in length is displayed for scale).See the text for explanation.
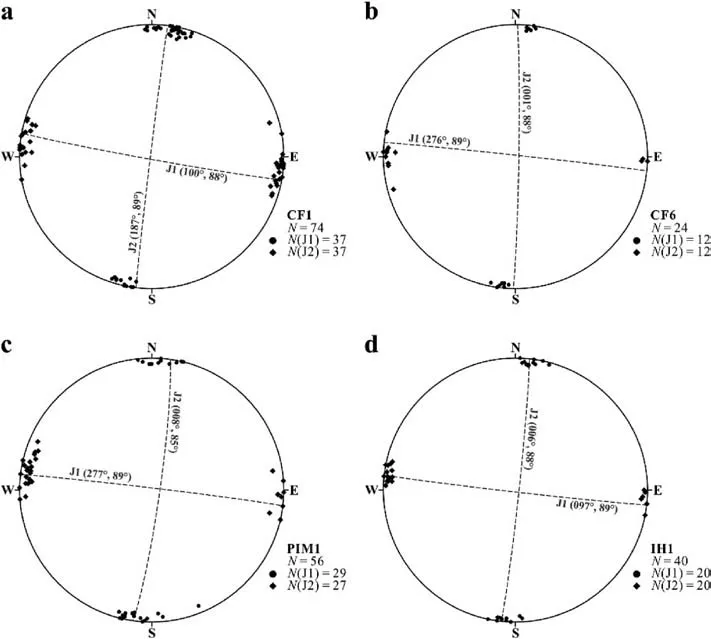
Fig.4.Lower-hemisphere,equal-area projection of J1 (dot) and J2 (diamond) joints measured from (a) Site CF1;(b) Site CF6;(c) Site PIM1;and (d) Site IH1.N: number of measurements.The best-fit plane for each set of joint data is displayed as a dashed great circle.
Fig.5 shows the relative proportion of each intersection pattern observed at five sites(as indicated in Fig.1).For example,at site CF1,types 1,2,and 3 represent 68.7%,25.1%,and 6.2% of the total joint population,respectively.At site IH1,however,the frequencies of types 1,2,and 3 are 82.4%,15.9%,and 1.7%,respectively.Data collected from these five sites (with a total of 785 measurements)indicate that types 1,2,and 3 represent 69%,25%,and 6% of the measured joint intersections,respectively.Types 1 and 2 intersections,where J2 joints were initiated from the existing J1 joint surfaces,are the most common and create the ladder pattern observed on bedding plane surfaces (Hancock,1985).
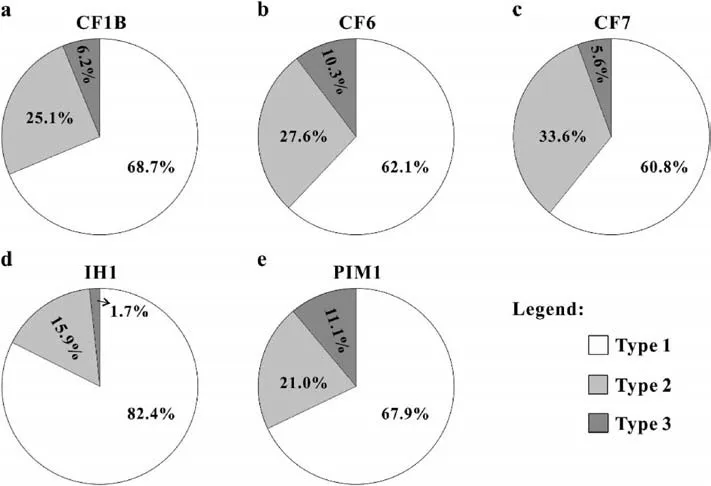
Fig.5.Frequency of each type of joint intersection observed at: (a) Site CF1;(b) Site CF6;(c) Site CF7;(d) Site IH1;and (e) Site PIM1.
The absence of perceivable mineral cement in both J1 and J2 joints (Figs.2 and 3) suggests that these joints were formed at temperatures below 60°C (Kirkwood et al.,2000),where the concentration of calcite or quartz was not sufficient for deposition and the pressure drop caused by fracture formation was not high enough to produce veins (e.g.Dunne and North,1990;Van Noten and Sintubin,2010).Previous studies (e.g.Chi et al.,2000;Brandstätter et al.,2018)have used the properties of cement,such as crack-seal textures and fluid inclusions,to determine the temperature,pressure,and relative timing of fracture development.This is not possible for the study region because of the lack of mineral deposits in the fractures.These barren joints are likely to form at shallow depths (mostly less than 3 km) during and after diagenesis,which is consistent with the maximum burial constraints indicated by sedimentary data (Desrochers et al.,2012).
Columnar joints (Fig.6) are present in the limestone layers at site CF5 and feature triple junctions at approximately 120°angles.These fractures were not created by drying and shrinking (Tang et al.,2006;Fossen,2019),as they are not filled with overlying sediment(shale or mudstone),but are instead extensional fractures that are likely of the same age as the orthogonal joints.
3.1.Joint spacing
The term“joint spacing”refers to as the perpendicular distance between consecutive joints within the same set.As shown in Fig.7,the joint spacing data for the J1 and J2 joints were measured at four representative sites (CF1,CF6,CF7,and IH1),with 436 and 446 measurements,respectively.The average J1 joint spacing was found to be 235.3 cm,while the average J2 joint spacing was 333.1 cm,both of which are wider than previously reported values in the literature (e.g.Gross,1993;Becker and Gross,1996;Ji et al.,1998,2021;Bai and Pollard,2000;Jiang et al.,2016;Bao et al.,2019).The skewness values,which indicate the deviation of the mean from the median,are 0.26 for J1 joints and 1.36 for J2 joints.This suggests that the mean of the joint spacing data is significantly greater than the median for J2 joints.
To gain insight into the physical mechanisms of joint formation(Rives et al.,1992;Pascal et al.,1997;Hooker et al.,2018),an analysis of the fracture spacing distribution was conducted.The Kolmogorov-Smirnov (KS) statistic and its corresponding p-value were calculated for six different distributions: normal or Gaussian(Rives et al.,1992;Ji and Saruwatari,1998),negative exponential(Priest and Hudson,1976;Rives et al.,1992),Gamma (Pascal et al.,1997;Gross,1993),log-normal (Rives et al.,1992),Weibull(Bardsley et al.,1990;Ji et al.,2021),and logistic(Wong et al.,2018).The KS statistic measures the degree to which the measured data fits a theoretical model(i.e.its goodness of fit),with a lower value indicating a better fit.The p-value of KS statistic,on the other hand,indicates the likelihood of obtaining a misfit equal to or greater than the calculated KS statistic (Ji et al.,2021).A larger p-value suggests a better fit to the measured data.The parameters of these six distributions are estimated using the maximum likelihood method and are presented in Table 1.

Table 1Statistical analyses of joint spacing data collected from limestone beds in the region of Havre-Saint-Pierre,Quebec,Canada.
The results of the calculations using the KS statistic and its corresponding p-value show: (i) For the spacing of J1 joints,the best-fit distribution function was the Weibull distribution for the sites CF6,CF7,and IH1 and the normal distribution for site CF1;and(ii) For the J2 joint spacing data,the best-fit function was the lognormal distribution for sites CF1,CF6,and IH1 and the Weibull distribution for site CF7.It is important to note that the p-values of KS statistic for the Weibull distribution were consistently higher than 0.18 (while all other distributions have some p-values less than 0.1),making it a suitable choice for comparing between data sets.The results from Table 1 also indicate that the gamma distribution provides a good fit to the data.
Kurtosis(more accurately excess kurtosis,Ku)was calculated for each set of joint spacing data (Fig.7).For J1 joints,theKuvalues were consistently negative,indicating a platykurtic distribution,which has fewer and less extreme outliers compared to the normal distribution.J2 joints,conversely,have more positive (leptokurtic)Kuvalues than negative values.At all the sites except CF7 (see Fig.7),the frequency distributions of J2 joint spacing display fatter tails than a normal distribution.
The coefficient of variation(Cv),a ratio of standard deviation to mean,is calculated for each set of joints from each site(Fig.7).TheCvvalues ranged from 0.37 to 0.94 for J1 joints,and from 0.36 to 0.77 for J2 joints.On average,theCvvalues were similar for both J1(0.55) and J2 (0.58) joints.
In addition,the mode/mean ratio (Mo/M) was used as an indicator for the degree of joint development.According to Rives et al.(1992),a low value (towards 0) indicates poorly developed joints,while a high value (towards 1) suggests that the joints are near saturation.The meanMo/Mratios for J1 and J2 joints were 0.83 and 0.75,respectively,indicating that both sets of joints are undersaturated.
3.2.Ratio of joint spacing to bed thickness (s/t)
The mean ratio of joint spacing (s) to bed thickness (t) is systematically higher for J2 joints than that for J1 joints across all study sites(Fig.8).For instance,at site CF1,the means/tratios for J1 and J2 joint sets are 5 and 7.9,respectively.The means/tratios for J1 joints range from 2.7 to 5.7,and for J2 joints from 3.2 to 8.4(Fig.8).These ratios are notably larger than those found in folded sedimentary rocks(e.g.sandstone and limestone)along the south coast of the Saint-Lawrence River (e.g.areas of Sainte-Anne-des Monts and Saint-Jean-Port-Joli),wheres/tratios typically vary between 0.8 and 1.2,with an average value of approximately 1 (Ji and Saruwatari,1998;Ji et al.,1998,2021).These findings suggest that the spacing of joints in the study area is generally wider than that along the south coast,and that J1 joints are more developed than J2 joints.The highers/tratios for J2 joints compared to J1 indicate that the formation of J2 joints may have been influenced by different mechanical conditions.
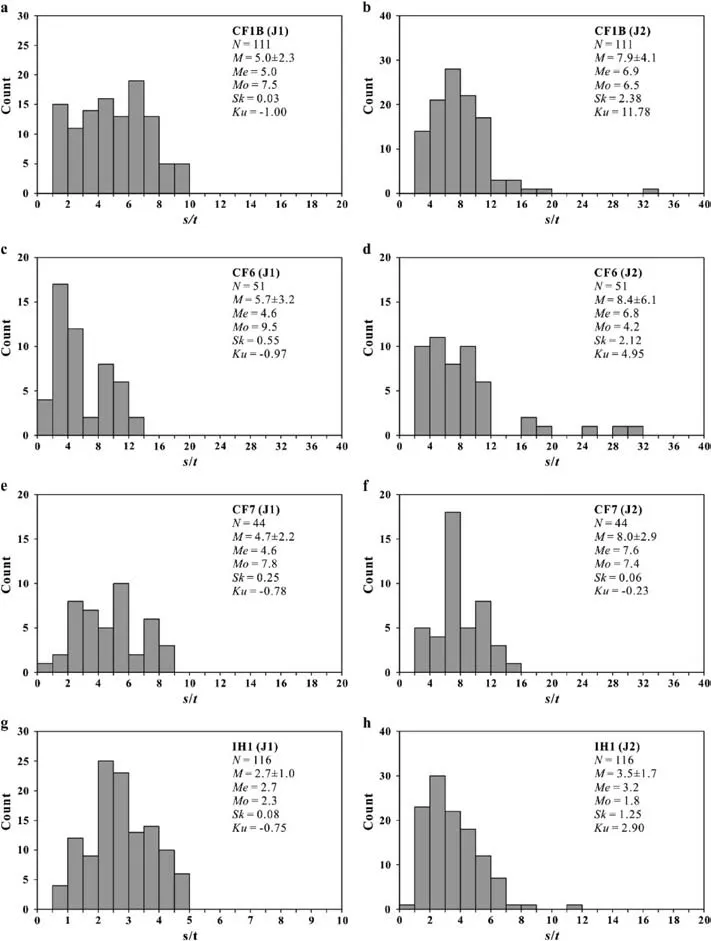
Fig.8.Histogram for joint-spacing-to-layer-thickness ratio(s/t)data for J1(left column)and J2(right column)sets,measured from:(a-b)Site CF1;,(c-d)Site CF6;(e-f)Site CF7;and (g-h) Site IH1).
3.3.Relationship between joint spacing and bed thickness
Following the work of Ji et al.(2021),thes-tdata can be fitted using a nonlinear relationship:
wherem=C/(2τ),n=1-1/k,andCrefers to the tensile strength of the rock,τ is the interfacial shear stress between the brittle and ductile layers,andkrepresents the Weibull modulus of the brittle layer.The τ value can be seen as the flow strength of the soft layer because the maximum interfacial shear stress cannot exceed this value(Ji et al.,1998;Li and Ji,2021).Materials with a higher Weibull modulus (k) possess a narrower distribution of fracture strength,making them mechanically more homogeneous (Zhu and Tang,2004).In contrast,a smallerkvalue suggests a broader distribution of strength.The Weibull modulus of a material is influenced by various factors such as the shape,size,orientation,and distribution of microscopic flaws within the material.It is possible for the Weibull modulus to decrease over time as fractures develop in a sequential,episodic manner.
The best fit to our data (Fig.9) for J1 joints is
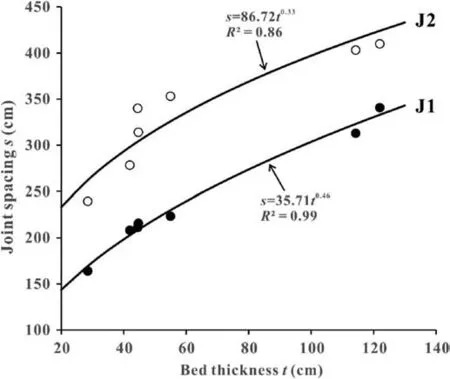
Fig.9.Plots of mean joint spacing versus bed thickness for J1(closed dot)and J2(open dot) sets in limestone for the region of Havre-Saint-Pierre,Quebec,Canada.
The results suggest that both systematic and cross-joints show a nonlinear increase in joint spacing with increasing bed thickness.Additionally,the spacing of J1 joints is noticeably smaller than that of J2 joints for a given bed thickness.Eqs.(2) and (3) indicate that the Weibull moduli are 1.85 during the formation of J1 joints and 1.49 during the formation of J2 joints.The lower Weibull modulus for later formed joints suggests that the mechanical homogeneity of the limestone decreased over time during the sequential development of joints.These estimated Weibull moduli are lower than those measured experimentally on carbonate marbles(k=2.03-4.29,Wong et al.,2006),which shows that a decrease in porosity during metamorphism can result in a higher Weibull modulus (Kittl and Diaz,1988;Keles¸ et al.,2013).
The values ofm(35.7 and 86.7 for J1 and J2 joints,respectively)for the flat-lying limestone in Havre-Saint-Pierre are significantly larger than those reported for the extensively folded limestone beds from other regions(as reported in studies by Ladeira and Price,1981;Angelier et al.,1989;Huang and Angelier,1989;Narr and Suppe,1991;Pascal et al.,1997;Ji et al.,1998,2021;Saein and Riahi,2019).This may be because these flat-lying limestone beds,which have interlayered thin shale layers,have experienced little regional tectonic deformation,such as folding and thrusting.The interfacial shear stress (τ) generated by the mismatch in strain between the stiffer and weaker layers is relatively low(apparently≤0.3 MPa at the natural strain rates),compared to the tensile fracture strength of the limestone (C≤25 MPa,as reported by Lockner,1995;see Eq.(8)in Discussion).This might explain why thes/tratios in the Havre-Saint-Pierre region are significantly greater than those reported from fold-and-thrust belts(e.g.Gross,1993;Ji and Saruwatari,1998;Ji et al.,2021).The higher theC/τ ratio,the larger thes/tratio will be (Ji et al.,1998,2021).The numerical modeling of Schöpfer et al.(2011) suggests that at highC/τ ratios,fractures are straight and regularly spaced;whereas at lowC/τ ratios,fractures become more curved and branched.Thus,the geometrical features(Figs.2 and 3)and the spacing distributions of fractures (Fig.7) indicate highC/τ ratios for the study region.We note that it is challenging to obtains-tdata from a large number of beds with varying thicknesses in the study area compared to sedimentary terrains with folded layers and closely spaced joints(e.g.Gross,1993;Ji and Saruwatari,1998;Ji et al.,1998,2021;Rawnsley et al.,1998).This is due to two factors: (i) the flat-lying nature of the beds,which results in only one bed being exposed over a large area and (ii) the widely spaced joints,which necessitates a large area to obtain statistically significants-tratios from a single bed.
3.4.Correlation between spacings of J1 and J2 joints
As shown in Fig.10,there is no correlation between our measured spacings of J1 and J2 joints.Some researchers (Gross,1993;Ruf et al.,1998) have suggested that cross joint spacing should be directly proportional to systematic joint spacing as the cross joints are bound by two systematic joints.However,our findings from Havre-Saint-Pierre show that systematic joint spacing has almost no effect on cross joint spacing(Fig.10).This is because the tensile stresses that lead to the formation of cross joints are transferred from the shear stresses acting along the contact between the brittle limestone layer and the surrounding soft shale layers,not from the ends of the stiff layer.These stresses cannot be transmitted across the open J1 joints,which act as free surfaces (i.e.have a negligible tensile strength).
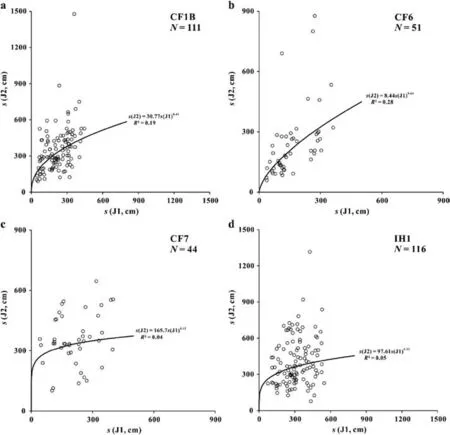
Fig.10.Plots of J2 joint spacings versus J1 joint spacings at: (a)Site CF1;(b) Site CF6;(c) Site CF7;and (d) Site IH1.Each pair of data corresponds to the length and width of each rectangle bounded by the orthogonal J1 and J2 joints when viewed on a bedding surface.
4.Interpretation and discussion
4.1.Distribution of joint spacing
Both the Weibull and Gamma distributions provide good fits to the joint spacing data(Table 1);however,we consider the Weibull distribution to be most relevant due to its prominence within theory of fracture mechanics (Weibull,1951;Kittl and Diaz,1988;Bardsley et al.,1990;Lobo-Guerrero and Vallejo,2006).The Weibull distribution is considered as the most relevant distribution for joint spacing data as it implicitly incorporates variations in the local tensile strength of rocks.These variations are dependent on the factors such as the shape,size,orientation,and distribution of microscopic flaws in the rock (Fischer and Polansky,2006).As a result,joint spacing is affected not only by local effective tensional stress (Bai et al.,2002;Chemenda et al.,2021;and De Joussineau and Petit,2021),but also by local tensile strength (Tang et al.,2008;and Hooker and Katz,2015).
The coefficients of variation(Cv)are used to quantify the degree of clustering in fracture spacing (e.g.Gillespie et al.,1999;Hooker et al.,2018).If the fractures are equally spaced,theCvvalue is 0;if the spacing is randomly distributed,theCvvalue is 1.ACvvalue greater than 1 indicates that the fractures are clustered,while a value less than 1 indicates that the fractures are anti-clustered.Our data suggest that the spacing of both J1 and J2 joints is anticlustered,but not randomly or periodically distributed.Therefore,the orthogonal joints,which have intermediateCvvalues,are fairly regularly spaced (e.g.Van Noten and Sintubin,2010).
The coefficient of kurtosis (Ku) has been used to quantify how much the tails of a frequency distribution deviate from those of a normal distribution(e.g.Ruf et al.,1998;Ji et al.,2021).Rouleau and Gale(1985)documented a kurtosis nearly equal to 0 (i.e.a normal distribution) for the spacing of joints in isotropic rocks (e.g.granites) where fracture spacings are essentially controlled by stress distributions and redistributions because microflaws are homogeneously distributed.However,in the region of Havre-Saint-Pierre,where limestone beds are interlayered with shale (Fig.7),the spacing of J1 joints consistently displays a platykurtic distribution(Ku<0,characterized by fewer values close to the mean),while J2 joints display a dominantly leptokurtic distribution (Ku>0,characterized by more values close to the mean).This deviation from the normal distribution is likely due to the heterogeneity in the mechanical properties of the layered composite rock system,which makes the distribution of joint spacings more dispersed than in isotropic rocks such as granites(Rouleau and Gale,1985).
4.2.Effect of tectonic strain on decreasing fracture spacing and block size
In this section,we will compare the orthogonal joint systems on the St.Lawrence Platform in the Havre-Saint-Pierre region (this study) with those of the Humber Zone in Southern Quebec.The Cambrian and Ordovician strata in the Humber Zone,exposed along the south shore of the Saint Lawrence River,are characterized by extensive deformation including steep bedding,tight folding,cleavage development,and thrust faulting (e.g.in the regions of Saint-Jean-Port-Joli and Sainte-Anne-des-Monts,Ji and Saruwatari,1998;Ji et al.,1998,2021).Conversely,similarly aged sedimentary successions exposed on the autochthonous St.Lawrence Platform(this study)are nearly horizontal and lack folds.The tectonic front between the autochthonous St.Lawrence Platform and theparaallochthonous Humber Zone of the Taconian orogenic belt (Pinet et al.,2014) is located close to the south shore of the Saint Lawrence River(<15 km),but is approximately 150 km from our study area on the north shore.This difference in proximity to the tectonic front explains why the sedimentary strata along the south shore show much higher tectonic strain than those along the north shore.
In the Havre-Saint-Pierre region,the average ratios of spacing to thickness(s/t)for J1 and J2 joints in flat-lying limestone beds are 4.3 and 6.4,respectively (Fig.8).These values are significantly higher than those observed in the folded sedimentary rocks along the south shore of the Saint-Lawrence River(e.g.areas of St-Jean-Port-Joli and Ste-Anne-des-Monts),wheres/tvalue typically ranges from 0.8 to 1.2 with an average value of approximately 1 (Ji and Saruwatari,1998;Ji et al.,1998,2021).Previous theoretical and numerical models suggest that a criticals/tratio of approximately 1 is needed for the formation of cross joints (Bai and Pollard,2000,2002).However,thes/tvalues in the Havre-Saint-Pierre area surpass the proposed criticals/tratio,indicating that this criticals/tratio is not a requirement for the formation and development of cross-joints.
4.3.Origin of orthogonal joints
Field observations indicate that the J1 set is more prominent than the J2 set,despite both sets being defined by straight and planar surfaces (Fig.2).In most cases,the J2 joints abut against J1 joints(intersections of Types 1 and 2),while it is rare to find the J1 joints to abut the J2 joints(Type 3 intersections;Fig.5).The ability of a subsequent joint to crosscut a previously formed joint is dependent on the tensile strength of the existing joint (Teufel and Clark,1984;Renshaw and Pollard,1995;Cooke and Underwood,2001).If the tensile strength of the existing joint is zero or very low,the subsequent joint will not crosscut it,leading to the formation of type 1 or type 3 intersections (Rives et al.,1994).If,however,there is a “rock bridge” over the previous joint that maintains some tensile strength (Zheng et al.,2015;Shang et al.,2018),the subsequent joint may propagate across it,resulting in a type 2 intersection (Dunne and North,1990;Cooke and Underwood,2001).It is worth noting that type 2 intersection may also occur due to the outward propagation of a cross-joint that is originated from a flaw on the surface of an existing J1 joint.Hence,the presence of type 2 joint intersection does not imply that the J1 and J2 sets of joints are formed simultaneously in the study area.
Bai and Pollard(2000)and Bai et al.(2002)proposed a model of stress transition to explain the origin of orthogonal cross-joints between systematic joints.They modeled the stress states surrounding four parallel fractures uniformly placed within a stiff bed between two soft layers and found that when the system is elastically deformed under uniform extension (ε=0.2%),the stress regime in the central region between two nearby fractures changes from tensile to compressive when a criticals/tratio of around 1 is reached.They hypothesized that cross-joints cannot form between two nearby systematic joints ifs(J1)/t>1,as the stress in the direction parallel to the systematic joints remains compressive.In their model,cross-joints only form whens/t<1 and the stress in the direction parallel to the systematic joints becomes sufficiently tensile.However,field observations in the study area show extensive cross-joint development in limestone beds with a means(J1)/tratio of 4.3,which is much larger than the critical value of 1 proposed by Bai and Pollard(2000)and Bai et al.(2002).This suggests that the conceptual model proposed by these authors may not fully capture the complexity of cross joint formation in real-world conditions.
According to Li and Yang (2007),the failure of the numerical model proposed by Bai and Pollard (2000) and Bai et al.(2002) to accurately predict the formation of orthogonal cross-joints is due to some inherent limitations.For example,the model assumes that new fractures would initiate at the midpoint between two preexisting fractures,while in nature fractures often occur at lithological interfaces or along pre-existing flaws or fracture surfaces(Rives et al.,1994;Cooke and Underwood,2001;Mandl,2005;Ji et al.,2021).The strain mismatch between stiffer and weaker layers causes the transfer of interfacial stress to tensile stress,resulting in local tension at the edges of the stiffer bed(Zhao and Ji,1997;Mandl,2005).Additionally,high concentrations of flaws,irregularities,and heterogeneities at bedding contacts result in sufficient wall-parallel tension to form extensional cracks that grow in a stable or subcritical manner (Rives et al.,1994;Mandl,2005;Paterson and Wong,2005;Boersma et al.,2018).
Recently,Ferrill et al.(2021) proposed a 5-stage model to explain the evolution of stress orientations during the formation of a fold and thrust belt.The five stages involve changes in the orientation of three principal stresses (σ1,σ2,andσ3) and are characterized by different tectonic regimes.
(i) Burial in normal faulting regime(σ1is vertical while bothσ2andσ3are horizontal);
(ii) Early horizontal compression in a strike-slip faulting regime(σ2becomes vertical);
(iii) Thrust belt compression in a thrust faulting regime (σ3is vertical);
(iv) Late horizontal compression and initial relaxation with return to a strike-slip faulting regime (σ2is vertical),and;
(v) Extensional relaxation and orogenic collapse in a normal faulting regime (σ1becomes vertical).
Stage 1 consists of two sub-periods: early regime 1A withσ2=σ3and late regime 1B(σ2>σ3).Ferrill et al.(2021)suggested that their model represents multiple “flips” in stress orientation from sedimentary deposition and burial to present-day conditions.According to their model,horizontal,bed-parallel,opening-mode veins are expected to develop at stage 3 and then are folded at stage 4.However,these veins have not been observed in our study area.Additionally,there are no signs of the characteristic strike-slip faults in stages 2 and 4 of the Ferrill et al.(2021) model.These differences are likely due to the fact that the study region is a farforeland basin,rather than a fold and thrust belt.As a result,it suggests believe that the two sets of orthogonal joints (J1 and J2)are formed under similar far-field stress conditions,with the vertical stress σ1and horizontal stressesσ2andσ3being perpendicular to J2 and J1 joints,respectively.These stress conditions are consistent with late regime 1B of Ferrill et al.(2021).If the stress field of early regime1A were regionally present,it would lead to the widespread formation of polygonal networks of vertical openingmode fractures(Tang et al.,2006;Fossen,2019).
Based on the available data,we proposed a conceptual model for the formation of J1 and J2 joints.J1 joints form when the internal tensile stress reaches or exceeds the fracture strength of the brittle layer (Fig.11a).The tensile stress in the brittle layer is transferred through interfacial shear between the stiff and soft layers,rather than directly through remote layer-parallel extension(Ji et al.,1998;Ji and Saruwatari,1998;Jain et al.,2007).The formation of a J1 joint causes a sudden release of the minimum principal stress(σ3)along the fracture plane and its adjacent “stress shadow” (Pollard and Segall,1987),as the opening fracture creates a free surface where the normal or shear stress approaches zero(Fig.11b).This leads to a local swap betweenσ2andσ3directions along the joint walls and adjacent areas,with their effective magnitudes being inverted although the remote stress field remains unchanged (Simón et al.,1988;Caputo,1995;Simón,2019).Subsequently,J2 joints begin to initiate from stress-concentrated flaws or heterogeneities along the walls of the J1 fracture or from mechanically weak locations within the brittle layer,and then propagate perpendicular to the existing J1 joints.
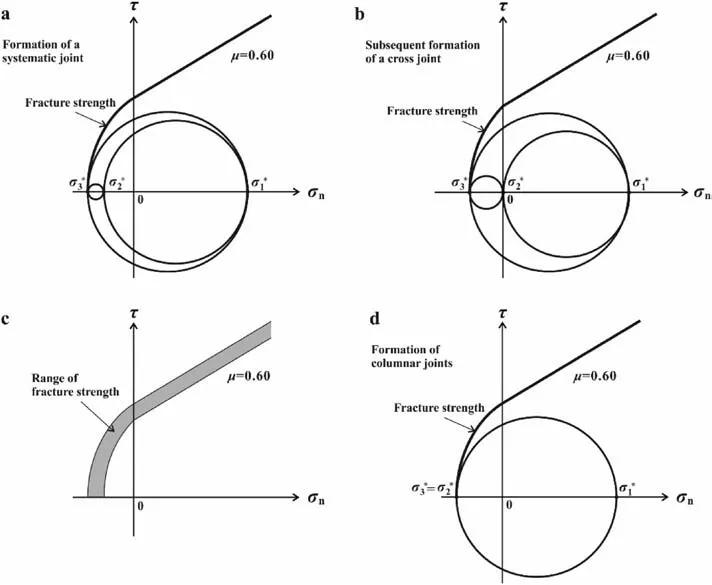
Fig.11.Conceptual model for forming cross joints where a stress swap between σ2*and σ3*due to stress relief produces a zero-stress state on a newly formed J1 joint:(a)Stress state at the moment when a systematic (J1) joint forms;(b) Stress state immediately after a systematic (J1) joint has formed where the development of a cross joint occurs;(c)Schematic representation of a range of fracture strengths (which depends on the shape,size,orientation and distribution of microscopic flaws within the rock);and (d) A biaxial stress state (σ1*≫0 >σ2*=σ3*),which forms a polygonal pattern of joints.
The regional maximum horizontal compressive stress (σ1) in Eastern Quebec is currently oriented in a NE-SW direction,due to ridge-push forces from the Mid-Atlantic (Adams and Bell,1991;Reiter et al.,2014).This stress orientation is not aligned with either set of J1 or J2 joints documented in our study.Therefore,the formation of these orthogonal joints was not related to the opening and expansion of the Atlantic Ocean or current deformation processes.
The formation of the orthogonal joints in the study region is assumed to have occurred in a diagenetic or post-diagenetic setting,at a depth of approximately 3 km (Pinet et al.,2015).During this time,the regional stress field was characterized by a vertical maximum principal stress (σ1),and minimum and intermediate principal stresses(σ3andσ2)oriented respectively in the directions of N10°and N100°in the horizontal plane.The effective stressσ1* (σ1minus fluid pressurePf) was compressive,while the effective stressesσ2*(σ2minusPf)andσ3*(σ3minusPf)were tensile,with a relatively small difference in magnitude betweenσ2* andσ3* (Fig.11a).The stress field was characterized byσ1*≫0 >σ2* >σ3*,which is typical in a far-foreland basin environment located more than 100-200 km from the deformation front.
Generally speaking,when the tectonic stresses are absent or negligible,the stress state,which depends on pore-fluid pressure and overburden,can be described byσ1*>σ2*=σ3*:
whereρis the mean density of the overlying rocks,νis the Poisson’s ratio,gis gravitational acceleration,zis the depth,andλis the pore fluid factor:
Eqs.(4)and(5)were derived based on uniaxial-strain boundary conditions,where strain only occurs in the vertical direction while no strain occurs in the horizontal direction.Considering that opening-mode fractures(no shear fractures)develop only whenσ1-σ3≤4C(Etheridge,1983),we have:
Since the tensile strength of natural rock is generally one order of magnitude lower than the shear strength (Paterson and Wong,2005),the unique occurrence of extension joints without shear fractures in the study region suggests that the differential stress was low.Takingν=1/3 for calcite limestone (Ji et al.,2002),we have
For dry rocks with a density of 2560 kg/m3under lithostatic conditions(λ=0),the values of minimum tensile fracture strength at burial depths of 1 km,2 km,3 km and 4 km are calculated to be approximately 3.1 MPa,6.3 MPa,9.4 MPa and 12.5 MPa,respectively.These values are in line with experimentally measured data(e.g.Jaczkowski et al.,2017) and those estimated from layered carbonate rocks at Akarnania(Greece)and Somerset,Southern UK(3-8 MPa,Caputo,2010),but lower than those assessed for the Miocene Monterey Formation at Santa Barbara coastline,California(13-57 MPa,Gross,1993).However,under hydrostatic conditions with a pore fluid factor of 0.39,the values of minimum tensile fracture strength at burial depths of 1 km,2 km,3 km and 4 km is reduced to 1.9 MPa,2.8 MPa,5.7 MPa,and 7.7 MPa,respectively.This highlights the significant impact of fluid pressure on the fracture strength of rocks subjected to tectonic stresses.
The actual stress state in the Havre-Saint-Pierre far-foreland basin deviated from the biaxial stress state (σ1*≫0 >σ2*=σ3*,Fig.11d) due to the superposition of a small,horizontal tectonic compressive stress from the Appalachian orogenic belt.This resulted in a triaxial stress state(σ1*≫0 >σ2*>σ3*,Fig.11a),which in turn created orthogonal joints in the limestone beds.In contrast,at a local level,such as at site 5 (Fig.6),a biaxial stress state(characterized byσ1*≫0 >σ2*=σ3*,Fig.11d) may be present,leading to the formation of a polygonal pattern of joints.This highlights the importance of considering both tectonic and gravitational compression when analyzing the stress state of a farforeland basin.
In a region experiencing remote stress,the systematic joints(J1)successively developed (Fig.11a).The release of stress from the formation of each J1 joint leads to a local reversal in the magnitude ofσ2*andσ3*and a subsequent change in their directions(Fig.11b).In the brittle rock located in between two adjacent J1 joints and especially near J1 joints,σ3rotates from being perpendicular to parallel with J1 joints,whileσ2becomes perpendicular to J1 joints.As a result,cross-joints (J2) initiate at weaknesses and spread orthogonally across the area between two neighboring systematic joints.This process repeats to form the observed geometric relationships between J1 and J2 (Figs.2 and 3) and patterns of joint intersections (Fig.5).
The tensile fracture strength of rocks can vary greatly from sample to sample,even when a set of nominally identical specimens are tested under the same conditions.This is due to the shapes,sizes,orientations,and distribution of microscopic flaws in the rock(Weibull,1951;Fischer and Polansky,2006).Early-formed joints initiate from flaws that have larger length-to-width ratios and are aligned perpendicular to the minimum principal stress.Additionally,the shapes,sizes,and distribution of flaws in the rock change both spatially and temporally during deformation.As a result,the fracture strength follows a probability function,such as the Weibull distribution,and varies within a certain range along the stress axis (Fig.11c).The probability that the tensile stress will exceed the local rupture strength is higher forσ3*than that forσ2*.This is why more joints form perpendicular to remoteσ3than normal toσ2.The mean fracture spacing is larger for J2 joints compared to J1 joints,with ratio values ranging from 1.29 to 1.68.These ratios reflect the relative magnitudes ofσ2* andσ3* with respect to the mean tensile strength of the rock during brittle deformation.
The development of cross-joints in response to stress relief from newly formed systematic joints (J1) is dependent on the presence of tensile stress in bothσ2* andσ3*,as well as their contrast in magnitude.Ifσ2*is positive andσ3*is negative(Fig.12a),the stress relief on a newly formed J1 joint will not result in a swap betweenσ2* andσ3* (Fig.12b),and as a result,no cross-joints will form between adjacent systematic joints.This phenomenon was observed in greywacke beds interlayered with shale in the Appalachian Humber Zone at Petite Vallée,Quebec,Canada (Li and Ji,2021),where a single set of closely spaced joints developed without any cross-joints,even when the joint spacing-to-bed thickness ratio (s/t) was 0.1-0.2.
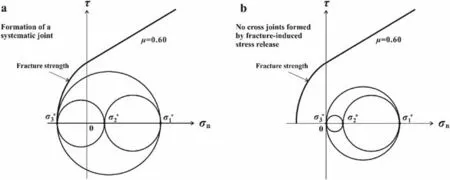
Fig.12.Stressstates for forminga setof closely-space joints without associated cross joints: (a) >>0 >when a systematic(J1) jointforms;and(b) Stress state immediatelyafter formation of asystematic joint.Thefracture-induced stress reliefleads toa stress statewhere>>=0 andnocross joint formation.
As demonstrated in Fig.11a and b,the pore fluid pressure must be higher thanC0+νρgz/(1-ν)forσ3* to become tensile.This condition is known to occur in far-foreland basins(Maltman,2012),leading to a widespread occurrence of orthogonal,opening-mode joints.This is likely to be related to hydraulic fracturing (Engelder and Lacazette,1990;Boersma et al.,2018).However,in dry and low-porosity rocks where the pore fluid pressure is negligible,bothσ2andσ3can locally become tensile only in specific tectonic environments.This can occur at the extrados of a dome with gentle dip closure (Reches,1983;Hancock,1985).Additionally,laterally tensile stresses can develop due to the Poisson’s effect,such as in a rock bed subjected to longitudinal stretching (Ji et al.,2018).This can induce layer-parallel shortening in the lateral direction,leading to layer-parallel tensile stresses in the lateral direction if elastic strain is constrained (Gross,1993;Mandl,2005;Boersma et al.,2018).This has been demonstrated through experiments on clay layers on an inflated balloon(Simón et al.,1988)and brittle coatings on buckling or stretching PVC plates(Rives et al.,1994).Pinet et al.(2015) related the origin of orthogonal joints to upper crustal flexure at the extrados of the northern Appalachian lithospheric forebulge (Billi and Salvini,2003;Billi et al.,2006;Lash and Engelder,2007;Ferrill et al.,2021).
The models in Fig.11 are based on the premise that extensional fractures form under tensile stress(negative);however,it has been established that they can also form under primarily compressive conditions (σ3*>0).For instance,extensional fractures are frequently observed in rock samples subjected to triaxial tests where all macroscopic principal stresses are compressive (e.g.,Griggs and Handin,1960;Ji et al.,2000;Paterson and Wong,2005).These fractures occur when the local extensional strain in the brittle material surpasses a critical value (e.g.Bridgman,1938).In fact,even when all macroscopic stresses are compressive,local tensile stresses can always be found near the ends of flaws (e.g.microcracks,ellipsoidal voids,or heterogeneities such as fossils)where the longest and shortest axes are parallel to the maximum and minimum principal stresses,respectively.As long as these flaws or heterogeneities are present,extensional fractures can initiate and propagate along theσ1σ2plane,even thoughσ3* is compressive (Scholz,2019;Mandl,2005;Paterson and Wong,2005;de Joussineau and Petit,2007).Microcracks with larger length/width ratios concentrate higher levels of local tensile stress near their tips and can propagate more easily in a stable or subcritical manner.These microcracks therefore control the local fracture strength and the development of joints in areas of elevated extension.
Moreover,the presence of columnar joints forming triple junctions at approximately 120°angles(at site 5,Fig.6)implies that the stress field in the horizontal plane is approximately equal in all directions during the joint formation process (Tang et al.,2006;Fossen,2019),while the maximum principal stress(σ1)was vertical at the time of fracturing.This suggests that the difference between the magnitudes of horizontalσ2* andσ3* was minimal,leading to the formation of orthogonal joints in the Havre-Saint-Pierre region during the diagenetic and post-diagenetic periods.At the local level,the magnitudes ofσ2*andσ3*were nearly equal,resulting in the formation of columnar joints (at site 5).
5.Conclusions
The weakly deformed,flat-lying middle Ordovician limestone beds in Havre-Saint-Pierre,Quebec,Canada have two sets of perpendicular,opening-mode joints arranged in a ladder pattern.The orthogonal joints,along with the bedding surface,result in large cuboidal blocks of limestone.The intersection of the systematic and cross joints suggests that the cross-joints initiated and propagated outward from flaws on existing systematic joints.It implies that these two orthogonal joints did not form simultaneously.The joints exhibit exceptionally large fracture spacings (s) relative to bed thickness (t) with the means/tratio values reaching 4.3 for systematic joints (100°) and 6.4 for cross-joints (010°).These ratios,obtained from the autochthonous Saint-Lawrence Platform along the north coast of the Saint-Lawrence River,are significantly greater than the values(s/t=1)observed on the south shore of the river in the folded and faultedpara-allochthonous Humber zone.The difference ins/tratios highlights the impact of tectonic deformation on reducing fracture spacings and block sizes.There is no correlation between the spacing of systematic and cross-joints.The Weibull function provides a good statistical description of the joint spacing frequency distributions in the study region,indicating that the joint spacings are influenced by both the local fracture strength of the rock(determined by the shape,size,and distribution of microscopic flaws) and the local effective tensile stress.The power-law relationships between joint spacing and bed thickness yield a Weibull modulus(k)of 1.85 and 1.49 for the limestone when the systematic and cross-joints were formed,respectively.It suggested a decrease in the mechanical homogeneity of the limestone as joint formation progressed.The formation of cross-joints in the limestone beds is suggested to be the result of local stress release on each newlyformed systematic joint,rather than due to a stress switch from compressive to tensile once a critical joint-spacing-to-bed-thickness ratio(s/t~1)is reached.This criticals/tratio of systematic joints is not a requirement for the formation of cross-joints.Cross-joints can develop only between long,parallel systematic joints whenσ1*>0 >σ2*>σ3*and the difference between the initial magnitudes ofσ2*andσ3*is smaller than the range of the flaw-dependent local fracture strength.In contrast,the columnar joints that produced triple junctions at 120°angles formed when the local stress field in the horizontal plane was more or less equal in all directions.
Declaration of competing interest
The authors declare that they have no known competing financial interests or personal relationships that could have appeared to influence the work reported in this paper.
Acknowledgments
The authors express their gratitude to the Natural Sciences and Engineering Research Council of Canada for financial support through a Discovery Grant (Grant No.06408).They also acknowledge Dr.Le Li for drawing Figs.5-9 and Dr.S.E.Laubach for valuable discussion.Finally,they thank the editor and three anonymous reviewers for their constructive criticism and suggestions.
 Journal of Rock Mechanics and Geotechnical Engineering2023年12期
- Journal of Rock Mechanics and Geotechnical Engineering的其它文章
- Numerical analysis of the effects of vesicle distribution characteristics on the engineering properties of volcanic rocks
- A hybrid attention deep learning network for refined segmentation of cracks from shield tunnel lining images
- 3D limit analysis of rock slopes based on equivalent linear failure criterion with tension cut-off
- Mutual impact of true triaxial stress,borehole orientation and bedding inclination on laboratory hydraulic fracturing of Lushan shale
- Unloading-induced permeability recovery in rock fractures
- An open-end high-power microwave-induced fracturing system for hard rock
