Anisotropic characteristics of layered backfill: Mechanical properties and energy dissipation
Huisheng Qu,Lng Liu,b,*,Yonglu Suo,b,Mengbo Zhu,Pn Yng,Cixing Zhng,Geng Xie
a Energy School,Xi’an University of Science and Technology,Xi’an,710054,China
b Key Laboratory of Western Mines and Hazards Prevention,Ministry of Education of China,Xi’an,710054,China
Keywords:Layered backfill Delamination parameters Anisotropic mechanical behavior P-wave velocity Energy dissipation characteristics Acoustic emission (AE)
ABSTRACT Layered backfill is commonly used in mining operations,and its mechanical behavior is strongly influenced by delamination parameters.In this study,13 specimens with different numbers of delamination and delamination angle were prepared to investigate the anisotropic mechanical behavior,energy dissipation characteristics and crack development of backfill.P-wave velocity,uniaxial compression,scanning electron microscope (SEM),and acoustic emission (AE) experiments were conducted.The results indicate that: (1) The P-wave velocity has linear and elliptical relationships with the number of delamination surface and delamination angle,respectively;the strength,delamination parameters and P-wave velocity show a high degree of coincidence in terms of their function relationship,which can realize the rapid prediction of strength.(2) The microstructure of the delaminated surface is looser than that of the matrix,leading to a decrease in strength and an increase at the pore-fissure compaction stage.The number and angle of delamination increase linearly with the anisotropy coefficient.(3) The energy evolution in angle-cut backfill can be divided into four stages,with a decrease in the proportion of elastic energy at the initiation stress and peak stress with increasing number of delamination planes and delamination angle.(4) Crack development increases with the number of delamination surface and delamination angle,resulting in a decrease in energy dissipation coefficient and peak AE energy.These findings provide valuable insights for the design of filling materials and processes in mining operations.
1.Introduction
Solid waste filling mining is an effective and eco-friendly approach that can help achieve the dual-carbon vision.China alone has produced 4.56 billion tons of raw coal in 2022.Due to the mismatch between the large-sized goaf and existing filling capacity,as well as high load placed on retaining walls by a single filling,different filling ratios and slurry mixtures were tested to achieve layer-by-layer segment filling.This was the optimal choice in terms of cost and efficiency (Cao et al.,2015;Yang and Li,2015).As an illustration,the Mahuangliang Coal Mine in Yulin,Shaanxi Province,China,extracting coal beneath a building by implementing the four-round filling replacement strip paste filling mining technology,which is known as ‘mining 8 and leaving 24’,is illustrated in Fig.1a.The dimensions of the strip are 8 m × 10 m × 120 m(length × width × height).During the filling process of the front and rear slurry inlet pipes,the flow and settling of particles were affected by the filling height in both vertical and horizontal directions.The effects are demonstrated in Fig.1b and c.During the operation,the coarse-grained aggregate and high-concentration slurry tend to accumulate on one side of the strip,closer to the rock wall.In contrast,the fine-grained and low-concentration slurry flows towards the opposite side of the rock wall,resulting in the formation of a belt as depicted in Fig.1d.A layered backfill structure with dip can be found in Fig.1e and f,showing downhole real shots.The formation of a layered surface during this process compromises the structural integrity of the backfill body,similar to the impact of joint fissures and weak planes on rock stability (Xu et al.,2013;Zhang et al.,2021).The mechanical properties of the layered backfill structure are significantly influenced by the layered parameters.Therefore,it is crucial to investigate the mechanical behavior of structural backfills with varying layered parameters to gain insight into the formation of stable backfill structures (Yang et al.,2015a;Li et al.,2016).
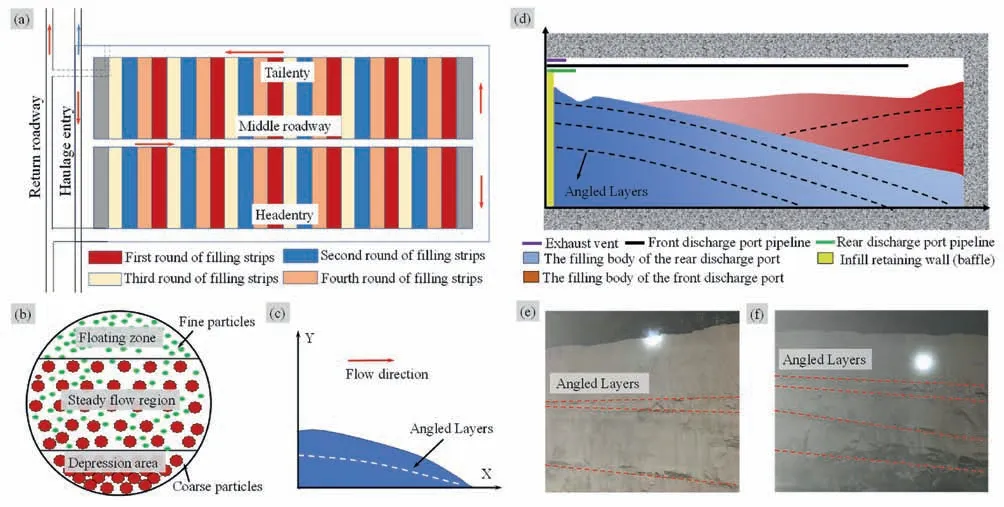
Fig.1.Schematic diagrams of the formation mechanism of the angle layered filling: (a) Schematic diagram of filling mining layers in Mahuangliang Coal Mine;(b) Schematic diagram of strip filling mining process in Mahuangliang Coal Mine;(c)Particle settling of filling slurry;(d)Settlement of filling slurry along the horizontal direction;and(e)and(f)Photographs of the filling body with inclined layers.
In addressing the challenges of stability in layered rock mass engineering,researchers have proposed the concept of anisotropy(e.g.Wawersik and Fairhurst,1970).A significant body of research has then been dedicated to investigating rock anisotropy,with a focus on two main areas:
(1) Utilizing ultrasonic wave velocity to establish the relationship between elastic parameters and characterize rock anisotropy (Wang et al.,2008).Lekhniskij et al.(1970)deduced the general equation of anisotropic elasticity theory using the generalized form of Hooke’s law,which is the theoretical basis for studying the anisotropic properties of rocks.Sayers (1988) used graph inversion theory to conduct a semi-quantitative analysis of the P-wave velocity of rocks.Deng et al.(2020) obtained the U-shaped distribution characteristics of mechanical parameters in the range of 0°-90°and tested the longitudinal wave velocity,uniaxial and triaxial compression strength of seven types of bedding sandstone samples with different dip angles.
(2) Mechanical property testing has been employed to establish the correlation between rock compression,tension,and bedding dip.Tavallali and Vervoort (2010) obtained the relationship between the tensile strength of layered sandstone and the bedding dip angle through mechanical tests.Yin et al.(2023) studied the relationship between crack development law and failure mode and bedding dip angle of the understory rock in three-point bending test.Tien et al.(2006) studied the failure characteristics of anisotropic material samples at different angles and summarized the failure modes of anisotropic material samples.
As mentioned above,there is also a structural weak surface formed by the slurry flow settlement for the filling body.Cao and Song (2017) defined this kind of filling body with strength reduction caused by layering as a structural filling body.Research of the mechanical properties of structural filling typically encompasses three main areas:
(1) Mechanical experiments on the filling body,taking into account its structural characteristics.Researchers have investigated the effects of different filling intervals,proportions,and surface angles on the static parameters of layered filling bodies under varying confining pressures and loading paths.These investigations led to the definition of the strength reduction coefficient concept (Cao et al.,2018).The fractal characteristics and energy evolution of the layered backfill specimen during the failure process were obtained by nondestructive monitoring methods such as acoustic emission(AE),electromagnetic emission,and coda wave interference(Jia and Tang,2008).In practical engineering applications,it is recommended that the angle of sub-layers should not exceed 15°.Additionally,The dynamic performance and failure mode of two-layered backfill specimens with two different lime-sand ratios under single and multiple impacts using split Hopkinson pressure bar(SHPB)testing have been investigated (e.g.Zhang et al.,2017).The evolution of its meso-mechanical parameters was numerically obtained through particle flow code (PFC) (Gao et al.,2022).
(2) Another key aspect of the mechanical properties of structural filling involves the development of constitutive models.Based on the theory of continuous damage,it has been proposed that the failure process of structural filling involves delamination,loading,and their interaction.A damage constitutive equation has been established using the Lemaitre strain equivalence principle,and its strength failure criterion has been derived (Fu et al.,2020).
(3) A significant development in the study of structural filling mechanical properties is the coupling mechanism between the backfill and surrounding rock.This includes investigations into the deformation and failure behavior of the combined body under two different conditions: standard cylinder specimens of the backfill body wrapped by surrounding rock with varying diameter ratios,and direct combinations of surrounding rock and backfill body with varying dip angles (Wang et al.,2019).Through FlAC3Dand similar experiments,the problem of surface subsidence in multi-layer paste filling was addressed by Li and Aubertin(2014).
Structural backfill is commonly used in backfill mining,which exhibits complex structural and mechanical differences due to variations in geological conditions and construction techniques.However,there is to date no mature research that considers both the number of fillings and the angle of the filling surface.To address this gap,this study focuses on a structural filling body with four layers and four layering angles,as described by Cao et al.(2016,2018).Building on Cao’s concept of a structural filling body,we further defined an angle layered structure filling body as a filling body with stratified layers inclined at angles between 0°and 15°,formed by the layered filling process and sedimentation of the filling slurry.We also investigated the strength parameters and the characteristics of energy dissipation during fracture process,providing a theoretical basis for improving our understanding of the mechanical properties of this type of structural filling body.
2.Test procedure and method
2.1.Sample preparation
In the current study,four types of materials were utilized,i.e.coal gangue,cement,coal gasification slag,and sodium sulphate.The specific proportions were determined based on a solid-toadhesive ratio of 2:8 and a mass concentration of 80%,resulting in a composition of 20% coal gangue,10% cement,70% coal gasification slag,and 2%sodium sulphate(Qu et al.,2022).Among them,the particle size grading of coal gangue is calculated by Taylor grading formula,and the particle size ranges are 0-2.5 mm,2.5-4 mm,4-5 mm,5-8 mm and 8-10 mm.The main elements in coal gangue are Si,Fe,Al,k,Ti and Ca,as well as a small amount of S,Mn,Sr and Cu.The raw slag of coal gasification slag contains numerous oxides,mainly Al2O3,CaO,Fe2O3,SiO2,accounting for more than 50% of the total mass.The particle size distribution of coarse coal gasification slag after grinding is shown in Fig.2 (Qu et al.,2022).
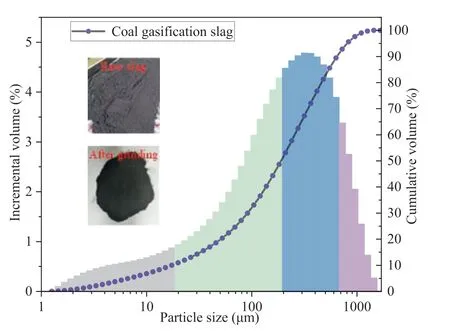
Fig.2.Particle size distribution diagram (Qu et al.,2022).
Based on the experimental preparations mentioned above,the required materials for each experiment were measured using an electronic scale,and then thoroughly mixed in a mixer.The mixture was then poured into a custom cylindrical mold (ϕ50 mm × 100 mm),with a layer of silica gel applied on the surface incompatible with the slurry to aid in demolding.The filling interval was set to 12 h.The specific parameters of the specimens are listed in Table 1(The number consists of the number of layers and the angle of layers.For example,1-5 indicates that the number of layers is 1 and the angle of layers is 5°).The specimens were labeled and placed in a curing tank at a constant temperature (20 ±1)°C and a humidity of(95±1)%using standard curing conditions.The test method of the sample follows the ISRM guidelines (ISRM,2007).The manufacturing steps of the angled-layered fill samples are as follows:
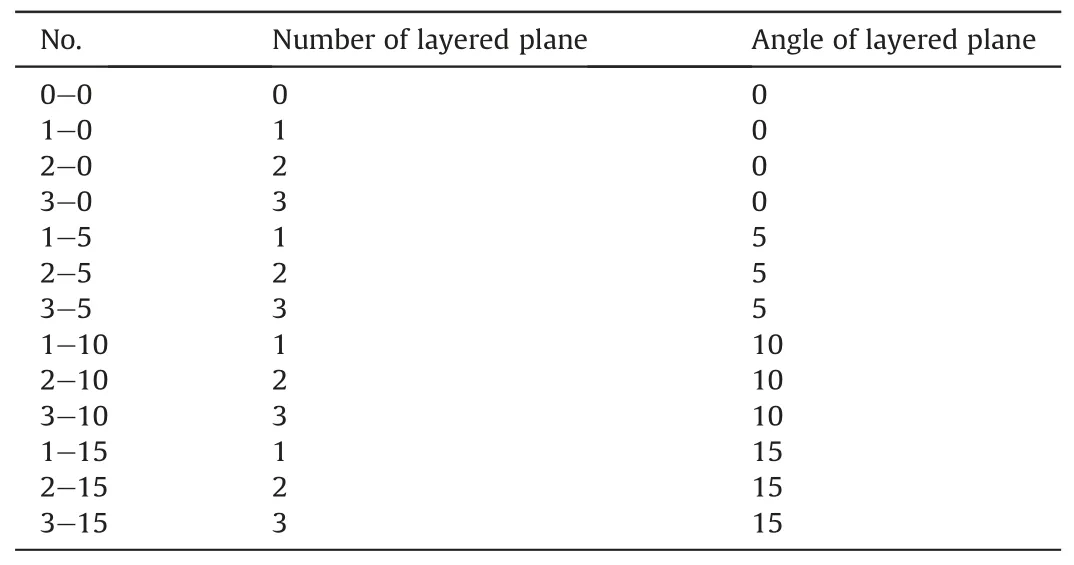
Table 1Sample configuration for testing.

Table 2Fitting relationship of peak intensity and strain by number of layered planes.

Table 3Fitting relationship of peak intensity and strain by angle of layered planes.
(1) Make a custom transparent acrylic mold.The size of the mold is the same as that of the standard mold,and five drainage holes with a diameter of 3 mm being uniformly distributed across the bottom.The mold cuts a closed slit along the axial direction to facilitate demolding (see Fig.3a).
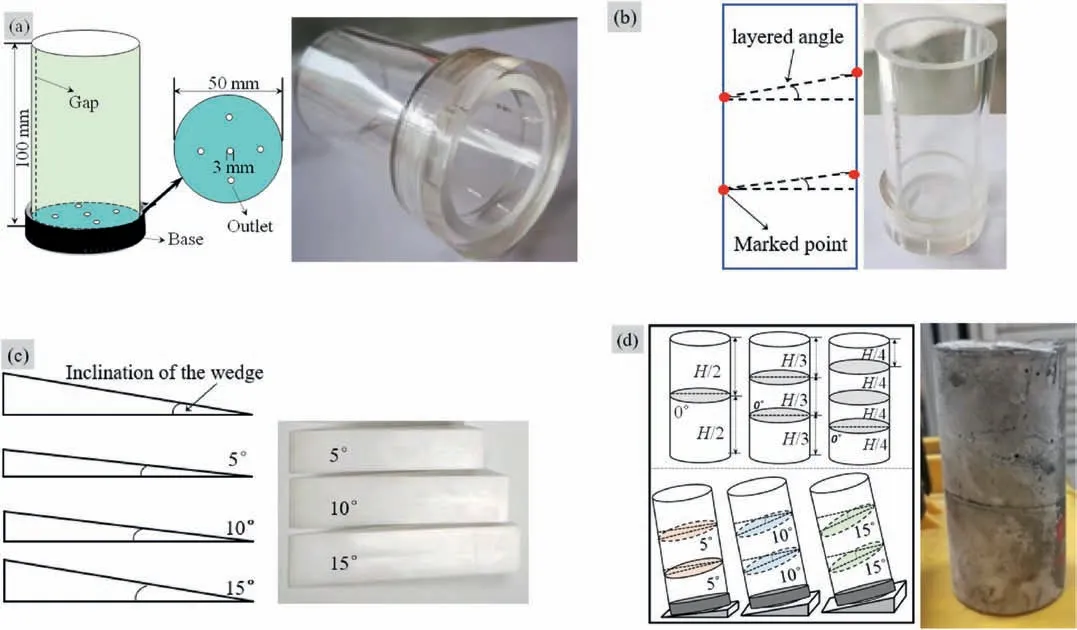
Fig.3.Production of angled-layered filling samples: (a) Custom clear acrylic molds,(b) marked distance points,(c) wedge,and (d) angle-layered specimens.
(2) Mark the position of the angle layered filling body slurry at the set angle on the mold according to the test plan to improve the accuracy of the layering angle (see Fig.3b).
(3) Place the mold on the triangular wedge with the preset angle and observe the positions of the slurry and the marked points to ensure that the layers are evenly distributed in strict accordance with the set angle.Ensure that the layers are smooth and flat to improve the success rate of sample preparation (see Fig.3c).
(4) Put the filling specimens poured in layers and intervals into the curing room for the pre-set time (see Fig.3d),for subsequent testing.
2.2.Servo-motor system
The uniaxial compression test was performed using the displacement control method with the Mechanical Testing &Simulation (MTS) testing machine.The specimen was loaded at a rate of 1 mm/min till failure.During the test,the uniaxial compressive strength(UCS)of the specimen was recorded,and the axial strain,elastic modulus,and Poisson’s ratio were calculated using the software provided with the testing machine.The elastic modulus was calculated using the 20% two-point secant slope method in the literature and was taken at 80% of the maximum stress on the stress-strain curve(Alainachi and Fall,2021).
2.3.Ultrasonic testing
The ultrasonic wave velocity test was conducted using the highperformance AE system (PCI-2) developed by American Physical Acoustics Corporation(PAC)(Shiotani et al.,2001),which is suitable for high-end AE research.The system is capable of conducting ultrasonic wave speed tests.The system has a built-in 18-bit A/D converter with a frequency range of 1-3 MHz.Two AE channels with low noise,built-in waveform and HIT processor are integrated into a standard 32-bit on a PCI card.The processor is suitable for low-amplitude,low-threshold (17 dB) settings,with a maximum signal amplitude of 100 dB,and the dynamic range greater than 85 dB.The digital signal processor meets the requirements of high precision and reliability,and can adjust the AE characteristic parameters/waveform for real-time processing.Only two sensors are needed for testing:one sensor is used to transmit pulse signals,and the other is for receiving signals.
2.4.AE monitoring system
During the test,AE monitoring was initiated simultaneously with the servo system(see Fig.4a).At the height of 2 cm and 8 cm of each specimen,4 probes were evenly arranged in the counterclockwise rotation direction(see Fig.4b and c).The DS5 AE system consists of control software,an AE collector,preamplifier,and AE probe,as shown in Fig.4d-g,respectively.The parameter setting for the AE system includes a threshold value of 50 dB,a sampling frequency of 1 MHz,and a preamplifier magnification of 40 times;The probe and the surface of the test piece are fully attached by applying a Couplant (Vaseline™),and then connected to the input port and output port of the preamplifier to the collector.The collector is controlled by the software for debugging and collection.
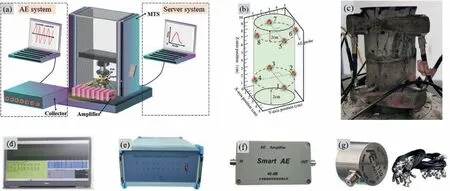
Fig.4.AE monitoring system and probe layout: (a) Experimental system,(b) schematic diagram of AE probe arrangement,(c) AE probe arrangement,(d) interface of the AE operating software,(e) collection host,(f) amplifier,and (g) probe and connecting wire.
2.5.Scanning electron microscope
To observe the microstructure of the specimens with different ratios,a scanning electron microscope(SEM)was used.A small part of the broken test piece in the target area was taken according to the test purpose after the strength test.The sample size was set according to the requirements and fixed on the copper sheet with conductive glue.Coating treatment was conducted to form a conductive film to avoid charge accumulation and thermal damage.The microstructure of the specimens was observed using the conductive film.During shooting,the acceleration voltage was 10 kV,and the working distance was about 15 mm.
2.6.Energy calculation theory
According to the principle of conservation of energy,the deformation and failure of the filled test block are accompanied by the dissipation and release of energy.From the perspective of energy,the deformation and failure of the filling body can be better analyzed.External force work transfers energy in two main forms:one is the one-way irreversible energy dissipated due to the loss of confinement of the particle unit of the material specimen,and the other is the elastic energy stored in the specimen due to external work(see Fig.5).
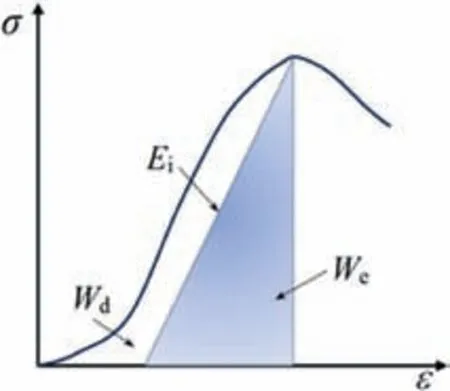
Fig.5.Schematic representation of energy calculation.Ei is the unloading elastic modulus,Wd is the irreversible dissipated energy in the failure process of the specimen,and We is the reversible elastic energy stored in the specimen.
According to the first law of thermodynamics,it is assumed that the experimental environment is closed,and the total energy input from the outside satisfies the following relationship(Ai et al.,2016;Zhou and Zhang,2021):
whereWrepresents the total input energy in the sample;Worepresents the energy released through heat radiation and heat exchange,which is negligible compared to other forms of energy dissipation.The energy of the filling body unit is
whereσ1,σ2,σ3are the effective stresses of the three principal stress directions of the backfill;ε1,ε2,ε3are the strains corresponding to the three principal stress directions;and,,are the strains generated by the elastic energy corresponding to the three principal stress directions.
According to Hooke’s law,Eq.(3) can be rewritten as
whereEis the initial elastic modulus,andμis the Poisson’s ratio.In uniaxial compression,it can be simplified as
According to the concept of calculating area by definite integral,the calculation formula of total energyUis
where(MPa)is the stress at each point in the stress-strain curve,and(%) represents the strain at each point in the stress-strain field.
3.Results and analysis
3.1.Anisotropy of angular layered fillings
3.1.1.P-wave velocity anisotropy
Previous studies have shown that the longitudinal wave velocity is a better indicator of the anisotropic characteristics of samples(Deng et al.,2020).Therefore,in this study,the longitudinal wave velocity of the backfill with four layers and four layer angles was measured,and the relationship between the backfill’s longitudinal wave speed and its structural factors were plotted (see Figs.6 and 7).
The results in Fig.6 indicate that the inclination angle of the layers has a significant effect on the P-wave velocities of the filled samples,even when the number of structural planes is constant.When there are two structural planes and the inclination angle of the layersβis 0°,the longitudinal wave velocity is low,with an average value of 1960 m/s.Atβ=90°,it reaches a maximum with a mean value of 2412 m/s.The mean value of the wave velocity in the two directions differs by 18.74%,which is consistent with the trend obtained for anisotropic samples in previous studies (Xi et al.,1995).
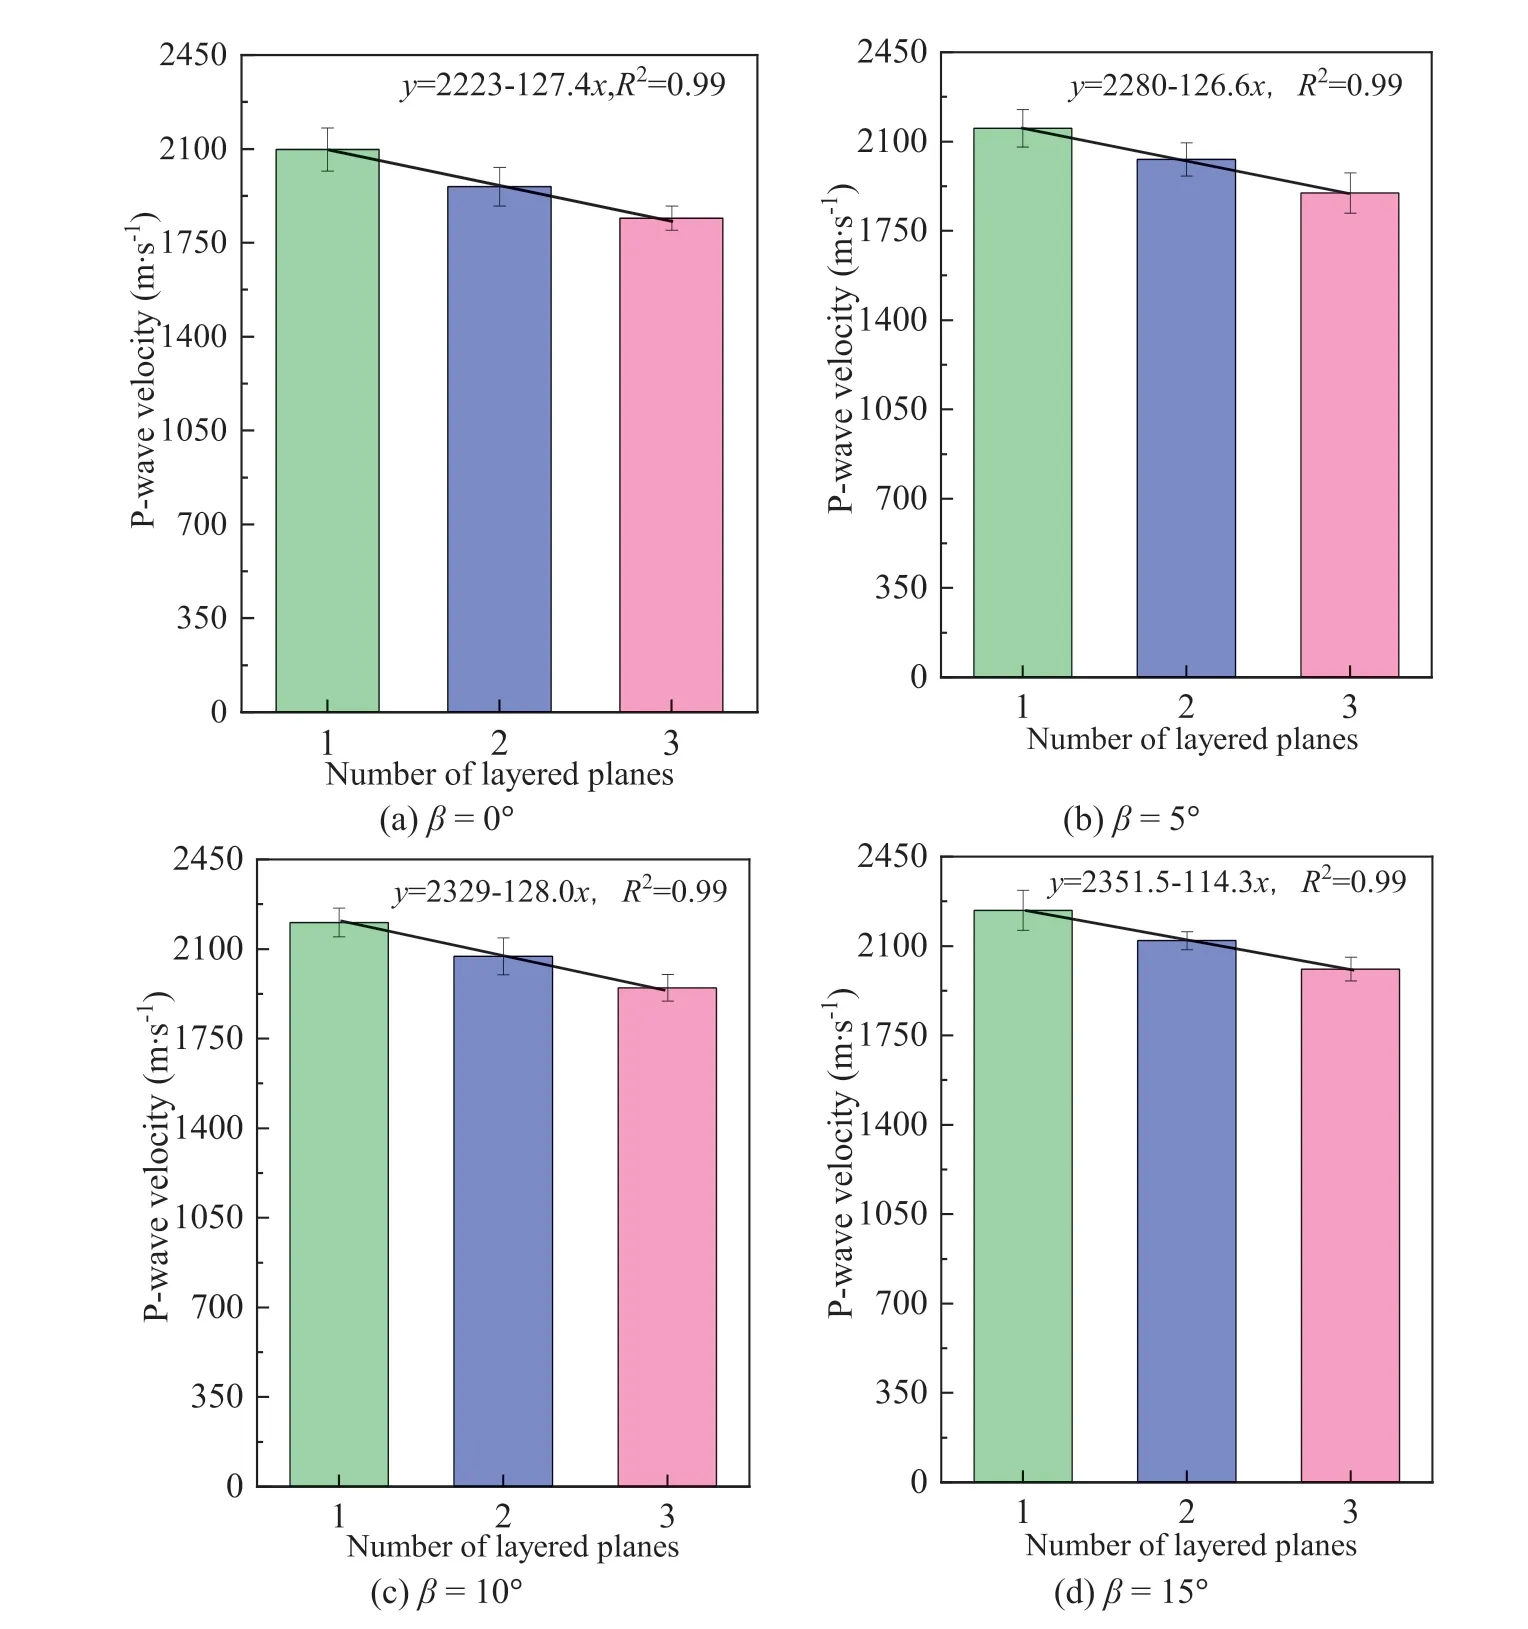
Fig.6.Relationship between P-wave velocity and number of layered planes.R2 is the coefficient of determination,and β is the inclination angle of the layers.
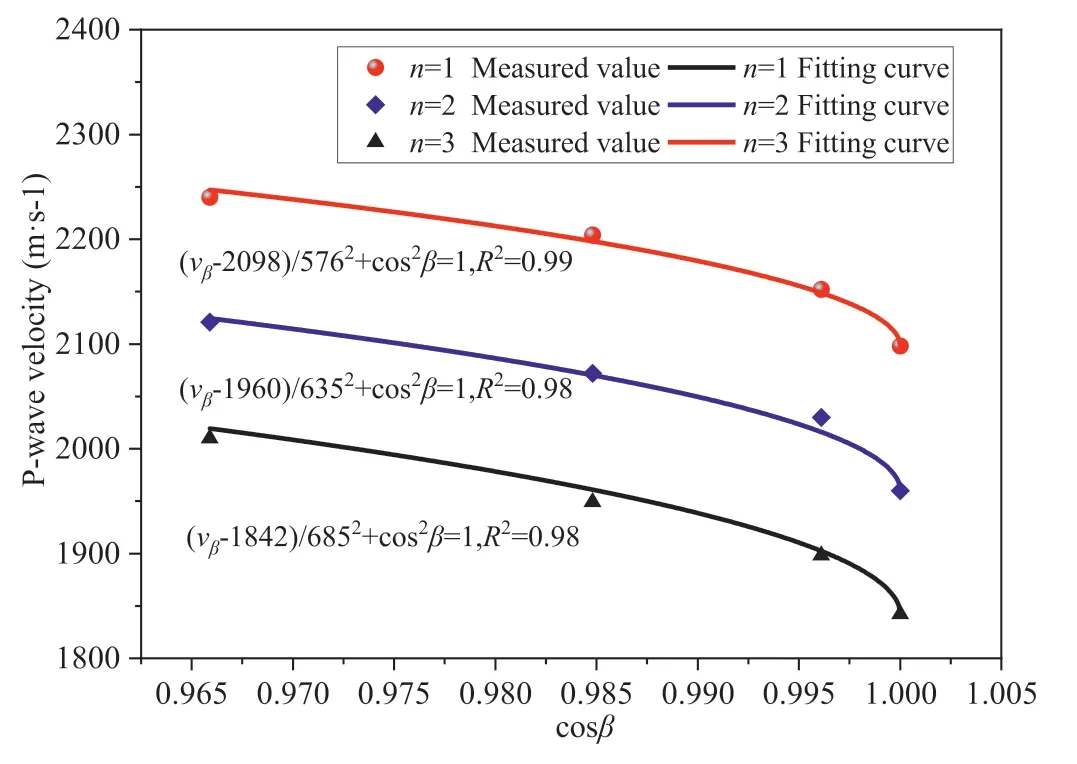
Fig.7.Relationship between P-wave velocity and angle of layered planes.vβ is the longitudinal wave speed velocity of the filling body when the angle of stratification is β.
When the inclination angle of the structural plane remains unchanged,there is a difference between the longitudinal wave velocities of the CCCPB specimens with different structural planes,and this value has a linear relationship with the structural planes,as shown in Fig.5.When the bedding inclination angleβ=0°and the numbers of layered planes are 1,2,and 3,respectively.The Pwave velocity is low,with an average value of 2635 m/s.The P-wave velocity exhibits a nonlinear and gradual increase with increasing bedding inclination.A bedding dip angleβof 90°results in the maximum P-wave velocity,with an average value of 3233 m/s.The mean value of the wave velocity in the two directions differs by 22.69%,corresponding to an anisotropy value of 1.23.
It can be seen above that the longitudinal wave velocity of a backfill with a structural plane is mainly related to the number of layers and the inclination angle.After conducting trial calculations and comparative analysis,it was observed that the relationship between the cosine(cosβ)of the longitudinal wave velocity and the bedding inclination angle is elliptical (see Fig.6).Therefore,the elliptic curve equation is used to express the longitudinal wave velocity with the same number of structural planes and different structural plane angles.The specific expression is shown as (Deng et al.,2020;Li et al.,2021):
where two subscripts of wave speedvrepresent the number of layers and the inclination angle,respectively.For example,vn,βrepresents the wave velocity when the number of layers in the backfill isnand the angle of layers isβ.
It can be further simplified as
At the same time,when the inclination of the structural plane is 0°and 90°,there is a linear relationship between the numbers of structural planes.The fitting formulae are shown in Eqs.(9) and(10):
These equations can be substituted into Eq.(1) to obtain the relationship between the longitudinal wave velocity between different numbers of structural plane and inclination angles:
This formula can be interpreted as considering the influence of the number of layered planes on the basis of the elliptical equation.It can be used to calculate the reduction of the longitudinal wave velocity for each layered plane,from which the relationship between the structural filling and the wave velocity can be obtained.Therefore,the P-wave velocity of a layered filling body at any angle can be calculated by simply measuring the wave velocity for just one structural plane at the inclination angles of 90°and 0°.
The influence of the angle of the layered plane on the wave velocity of the longitudinal wave can be explained as follows:when the angle of the layered plane(β)is 0°,the propagation direction of the longitudinal wave is perpendicular to the weak plane of the layer.This causes the longitudinal wave to be refracted and reflected on the weak plane of the layer,hindering the propagation of the longitudinal wave,which results in a reduction of the longitudinal wave velocity passing through the sample.For longer time,the wave velocity of the corresponding sample is slower(Takemura et al.,2003).When the angle of the layered plane (β) is 90°,the propagation direction of the longitudinal wave is parallel to the weak plane of the bedding,the longitudinal wave mainly propagates in the matrix,and the weak plane of the bedding has a great influence on the propagation of the longitudinal wave.Whenβis small,the wave velocity of the corresponding sample is relatively fast(Kern et al.,1997;Kano and Tsuchiya,2002);whenβincreases from 0°to 90°,the angle between the propagation direction of the longitudinal wave and the weak plane of the layer gradually decreases to 0°.Meanwhile,as the number of weak bedding planes distributed in axial direction of the test gradually reduces,the proportion of the low-velocity medium part decreases.This,in turn,weakens the wave reflection and reduces the energy attenuation,resulting in a shorter time for the longitudinal wave to pass through the sample and an increase in the longitudinal wave velocity(Zang et al.,1996).The influence mechanism of the number of layers on the wave velocity is discussed in Section 3.1.2.
3.1.2.Strength anisotropy
In Fig.8,taking the stress-strain curve of complete filling body specimen as an example,the stress-strain behavior of the angle layered backfill can be divided into five typical compression stages:(I) pore-crack compaction stage,(II) elastic deformation stage,(III)stable development stage of micro-elastic cracks,(IV) unstable rupture development stage,and (V) post-rupture stage (Cai et al.,2004).The peak strength (σf) and peak strain (εf) of the angled layered backfill decreased with increase of the number of layers and the layer angle,as shown in Fig.9.
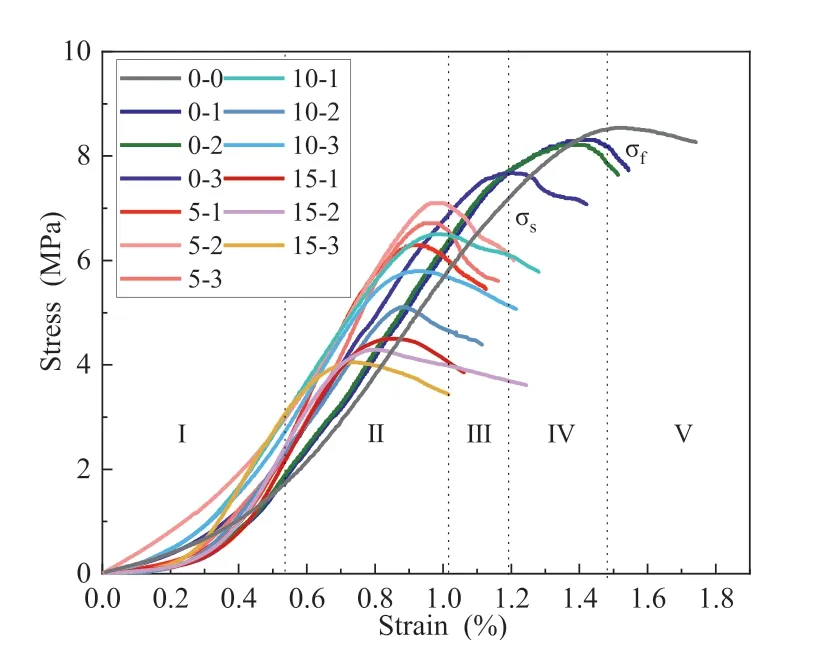
Fig.8.Stress-strain curve.
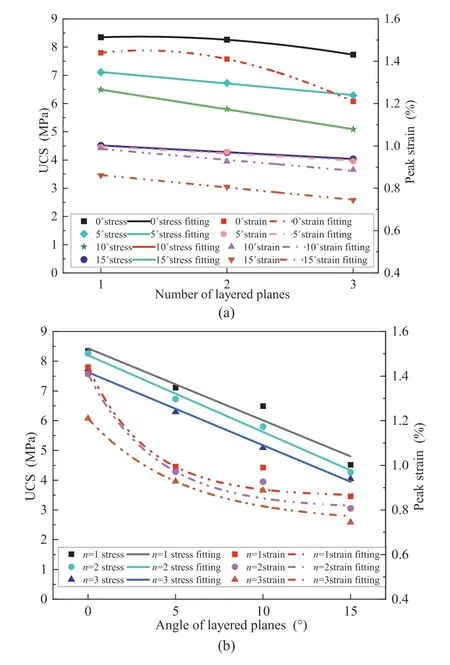
Fig.9.Peak stress and peak strain: (a) Number of layered planes and (b) angle of layered planes.
(1) On the whole,the peak strength and strain of the backfill decrease with the increase of the number and angle of layers.
(2) The angle of layer is used as a variable: Forβ=0°,σf,εfand the number of layers are all exponentially related;forβ=5°,10°,15°,σf,εfand the number of layers are all linear functions(see Tables 2 and 3).
(3) The number of layers is used as a variable,n=1,2,3,σf,εfand the layer angle are all exponentially related.Specifically,the strength of the complete filling body is 8.58 MPa.
To analyze the impact of layered parameters on the anisotropy of backfill specimen strength,the strength of the intact unlayered backfill and the P-wave velocity are taken as the reference values.The ratio of strength to wave speed of the layered backfill at each angle is defined as the anisotropy coefficient at that angle,which is given by Eqs.(12) and (13) (the calculated results are summarized in Table 4 and Fig.10).The influences of the delamination parameters on the strength of the backfill specimen (Amadei,1996;Li et al.,2019) are given by
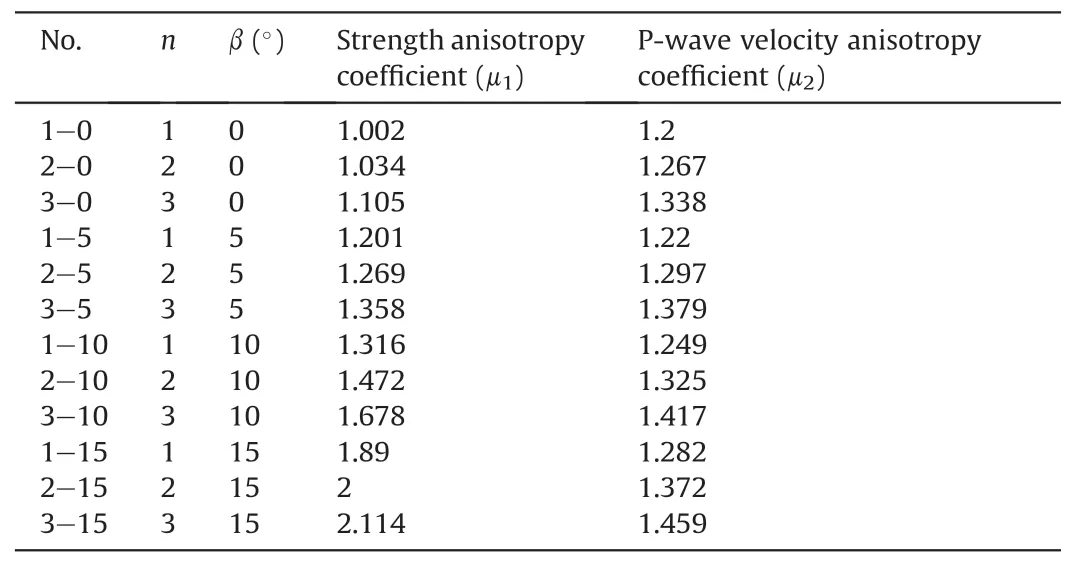
Table 4Anisotropy coefficients.

Table 5Fitting relationship at each stage according to the number of layered planes.
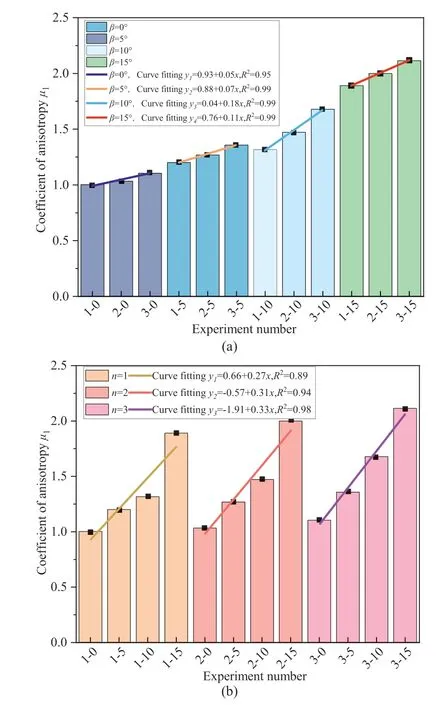
Fig.10.Anisotropy coefficient μ1: (a) Number of layered planes and (b) angle of layered planes.
whereσfis the UCS of the complete unlayered filling;μ1is the anisotropy of the P-wave velocity of the layered filling;μ2is the anisotropy of strength of the layered filling;vis the P-wave velocity of the intact unlayered filling specimen;andσn,βis the P-wave velocity of the filled specimen with the number of layersnand the layer angleβ.
As can be seen from Table 4 and Fig.10,the anisotropy coefficient of backfill body gradually increases with the increase of layer number and angle.For example,when the sub-layer numbern=2 and the layered planes angleβ=5°,10°,15°,the ratio ofμ1of horizontal backfill body increases by 0.235,0.438,and 0.966,respectively.When the sub-layer angleβ=10°and sub-layer numbern=2,3,the value ofμ1with one sub-layer filling body increases by 0.156,0.215,respectively.In addition,according to Fig.10,it can be clearly seen that the slope of linear fitting in Fig.10b is greater than that in Fig.10a,that is,the impact of sub-plane angles on anisotropy is more significant.The increase rate ofμ1increases with the increase of the angle of stratification as the number of layered planes increases from 1 to 3.
Fig.11a and b illustrates the microscopic morphology of the matrix and delamination surface of the filled test block,respectively (× 2000 times).The matrix structure appears to be denser,more complete,and integrated.In contrast,the delamination surface represents the weak part of the filling body test piece,which can compromise the mechanical properties of the specimen and reduce its strength (Li et al.,2018;Zou et al.,2018).Further,the influence of delamination number and delamination angle on the whole structure of backfill is analyzed.Fig.11c-e is a microstructure with the number of delamination 2 and the angles of delamination 0°,5°,10°,and 15°,respectively.Fig.11f-i is the microstructure when the angle of delamination is 10°and the numbers of delamination are 0,1,2,3,respectively.The magnification of the above SEM images is 500 times.As the delamination angle and the number of delamination increase,the delamination surface of the filled specimen shows a more developed pore fracture structure and an increased degree of fragmentation.Similarly,affected by the loose structure of the stratification plane(Takemura et al.,2003),P-wave velocity shows strong anisotropy (Xu et al.,2021),i.e.the propagation velocity of acoustic wave in the matrix is greater than the weak plane of stratification (Li et al.,2022).When an acoustic wave passes through a stratification plane,it experiences energy loss,which is reflected in the decrease of wave velocity.Based on the transmission characteristics of acoustic wave,it can be assumed that the energy loss caused by the acoustic wave passing through a stratification plane with the same dip angle is a constant value.Therefore,the reduction in wave velocity is also a constant value.As a result,the acoustic wave loss is a multiple of the number of delamination planes.The effect of the delamination angle on strength is mainly due to the slip of the upper and lower matrix along the structural plane.Within the range of 0°-15°,this scenario becomes more pronounced with increasing angle (Yin et al.,2023).

Fig.11.Matrix and layered microstructure.
3.1.3.Relationship between P-wave velocity and intensity
The anisotropy coefficients calculated based on P-wave velocity and peak intensity in the first two sections suggest that the angularly layered backfill can be considered as a transversely isotropic medium with homogeneous properties (Sayers,2015).The anisotropic characteristics of the filled specimens increase as the angle increases.Due to the strong operability of P-wave velocity measurement in engineering practice,the relationship between the two differently defined anisotropy coefficients can be established.This allows for the prediction of the strength of backfill with any number of layers and layer angles,based on only the strength of the fully filled specimen and the P-wave velocity of the aforementioned specimen.Eq.(14) provides a reference for the strength design of the construction site,allowing for quick and accurate strength prediction.
According to the relationship between the two anisotropy coefficients with different stratification parameters in Fig.12,and substituting into Eqs.(11)-(13),we have
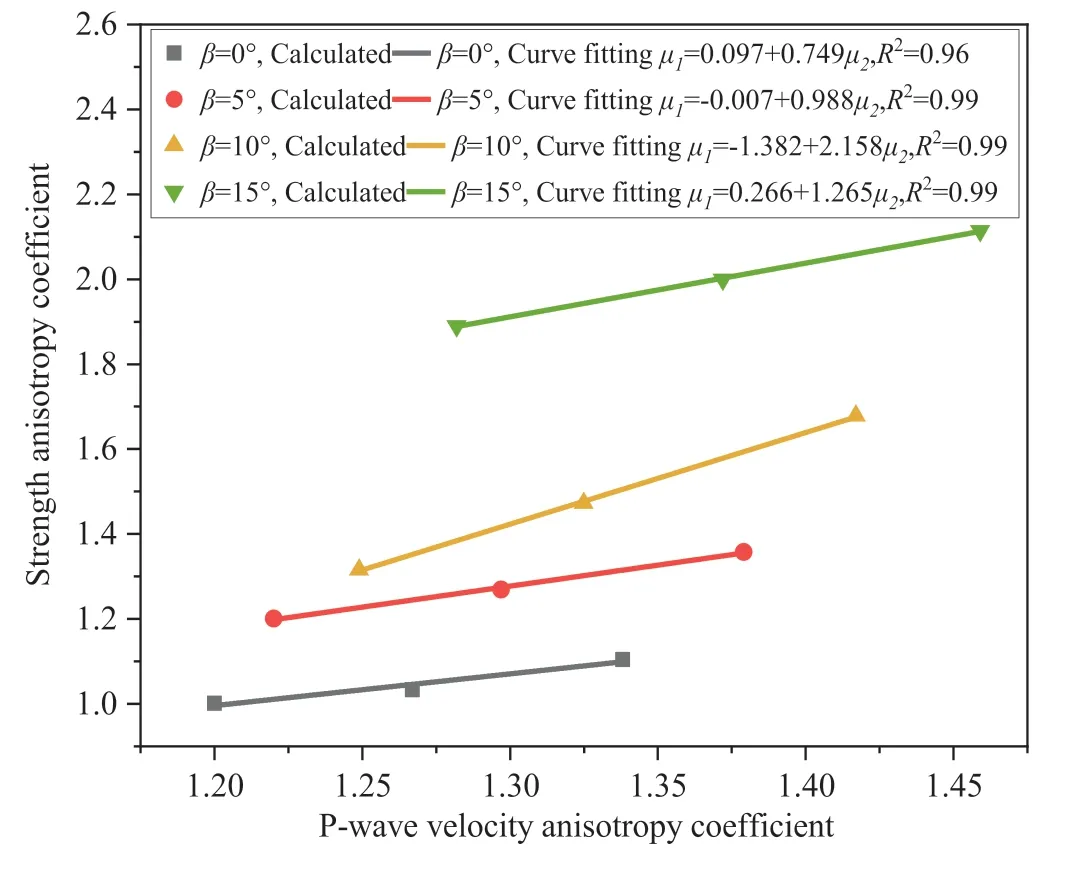
Fig.12.Matrix and layered microstructure.
wherea,bare the slope and intercept in the linear relationship ofμ1andμ2in Fig.12 whenβ=0°,5°,10°,and 15°,respectively.
3.2.Energy evolution characteristics
3.2.1.Analysis of energy consumption characteristics of angle layeredfilling body
The energy dissipation curve for the filling body at each layer angle was obtained using the calculation formula presented in Section 2.6,based on the theory of energy calculation.The values of total energy and elastic energy increasing with strain during loading are calculated at the same time (see Fig.13).The energy evolution process of the specimens filled with layers at various angles can be divided into four stages according to the five processes manifested in the stress-strain curve,as shown in Fig.8(Shiotani et al.,2001;Alkan et al.,2007;Wang et al.,2008).
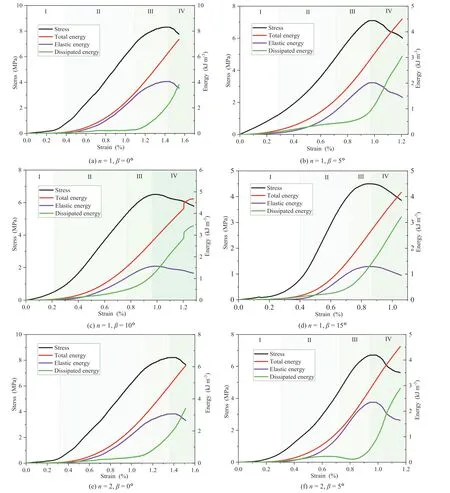
Fig.13.Relationship between total energy,elastic strain energy,dissipated energy and axial strain.
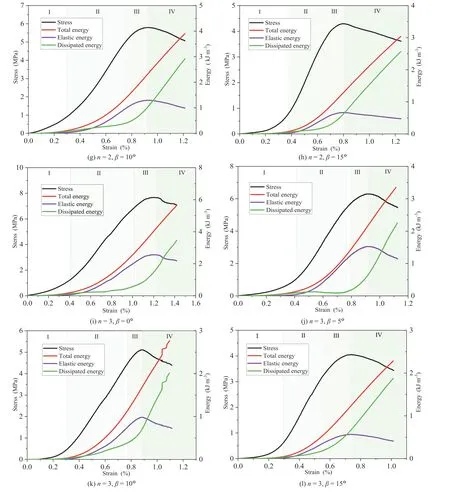
Fig.13.(continued).
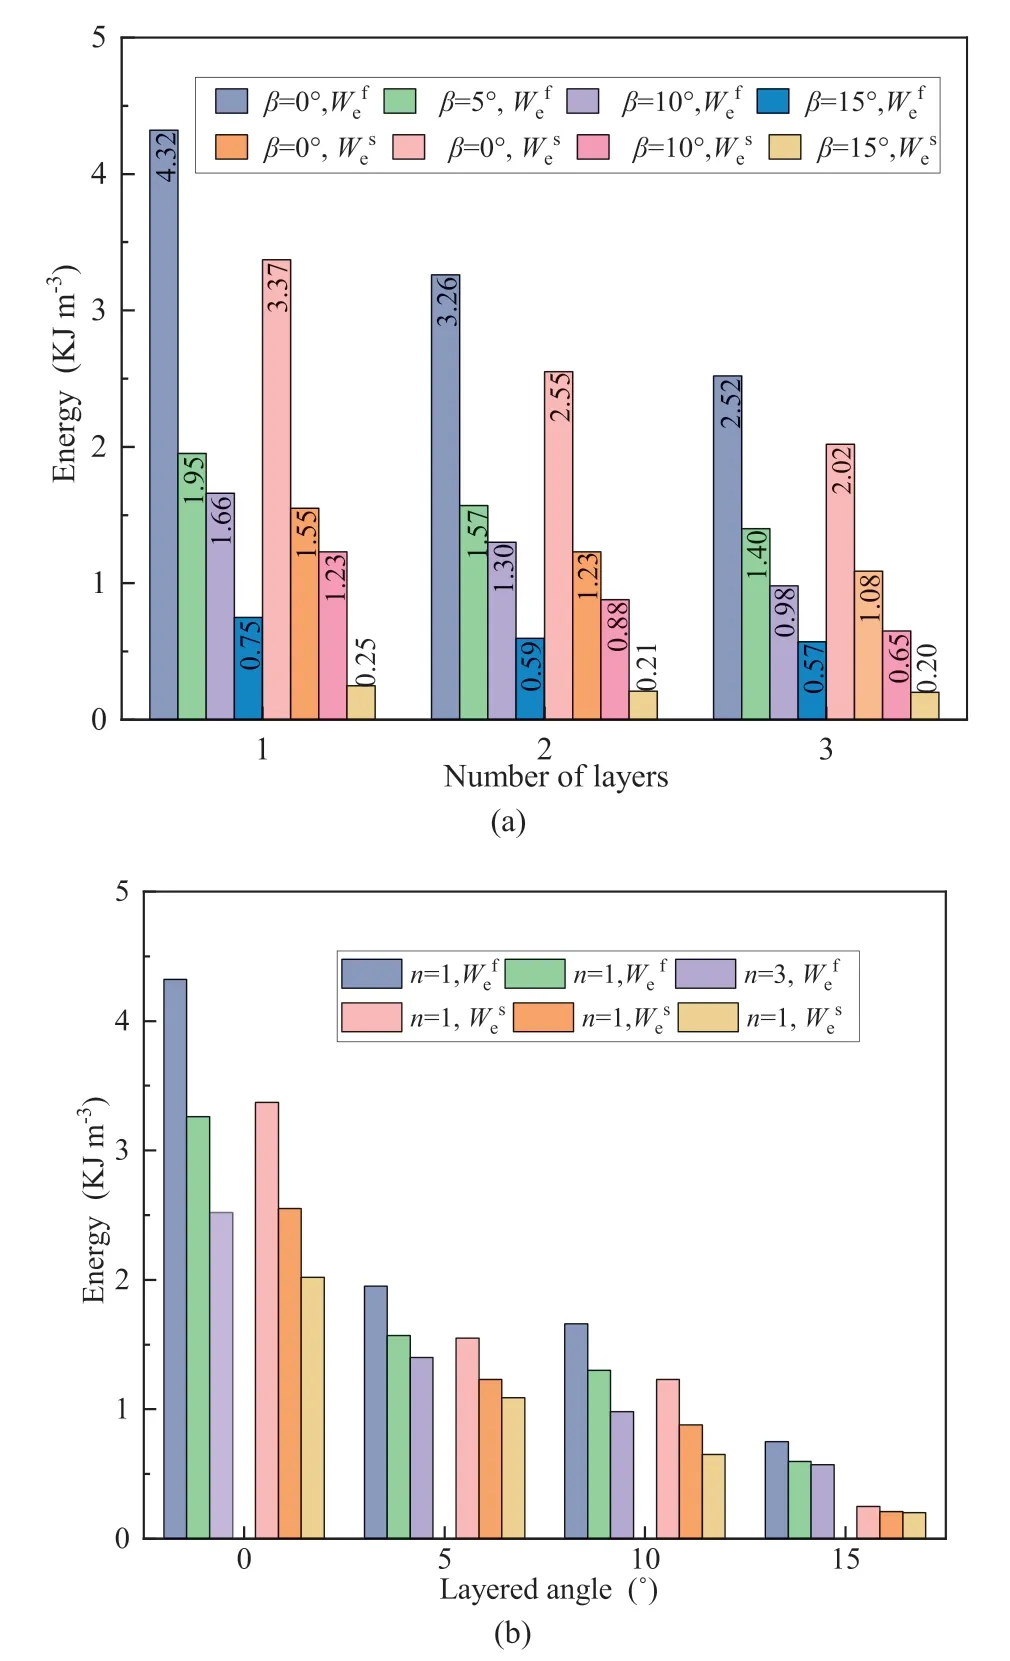
Fig.14.Evolution Law of Elastic Energy and Dissipative Energy:(a)Number of layered planes and (b) angle of layered planes.
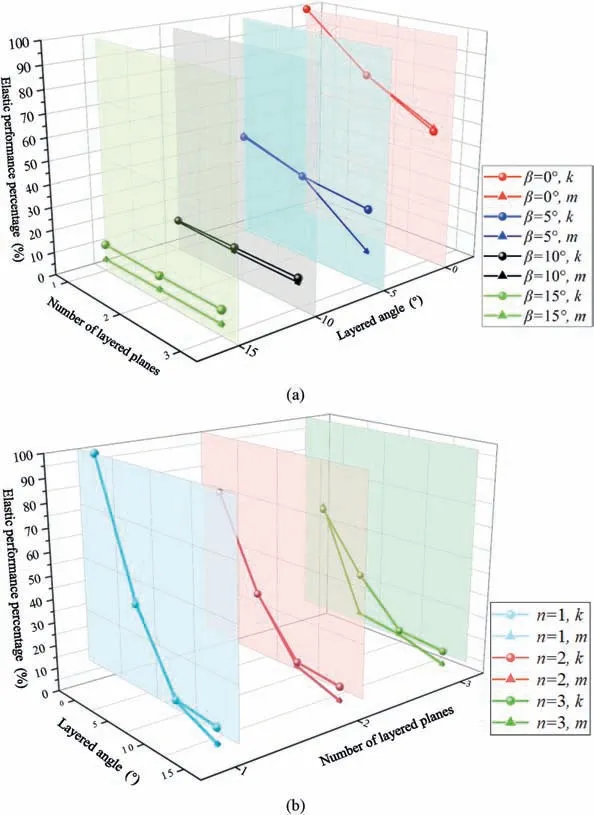
Fig.15.Evolution law of m value and k value: (a) Number of layered planes and (b) angle of layered planes.
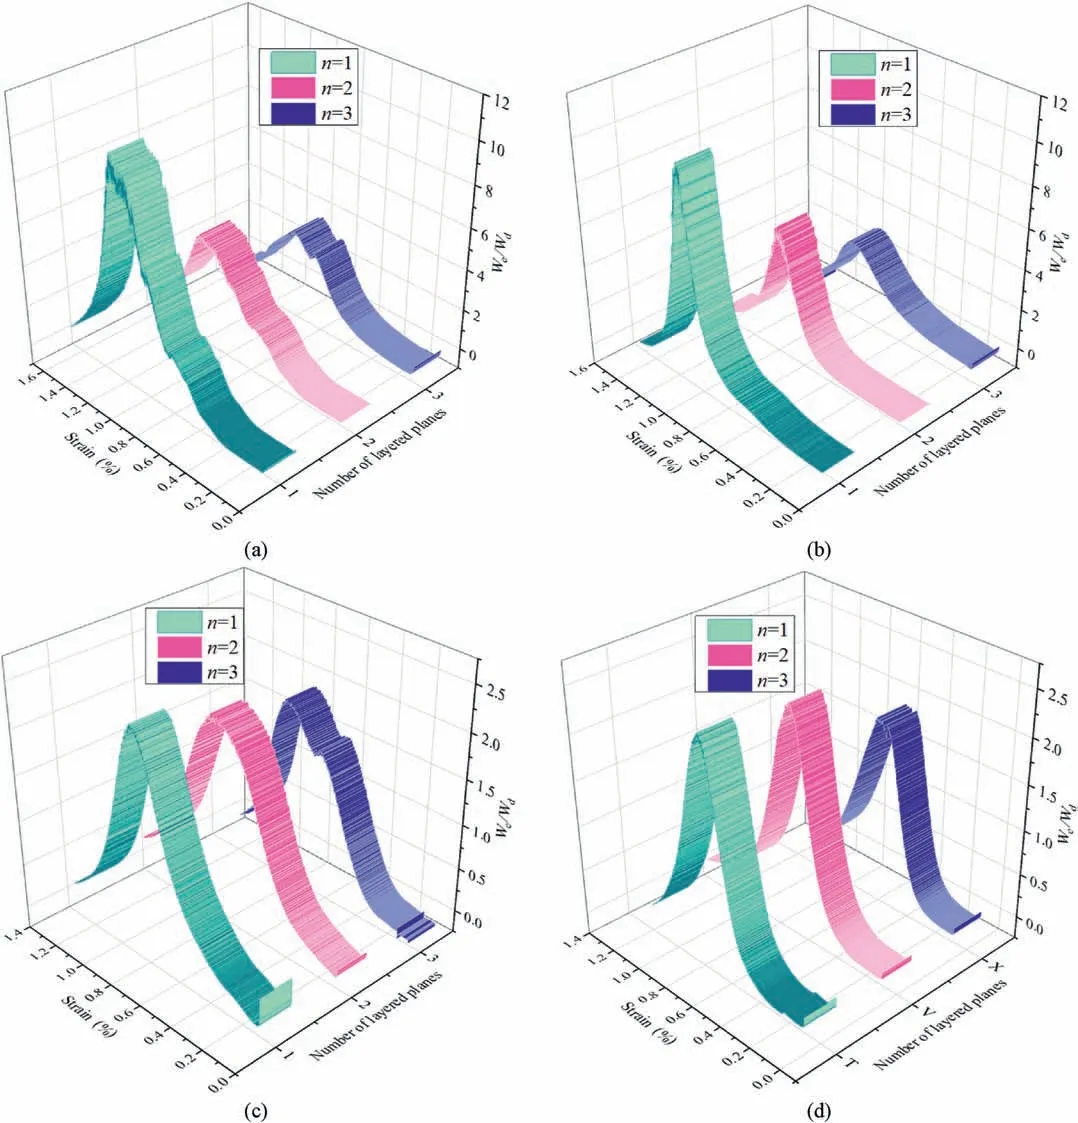
Fig.16.Relationship between energy dissipation coefficient and strain at different numbers of layered planes: (a) β=0°,(b) β=5°,(c) β=10°,and (d) β=15°.
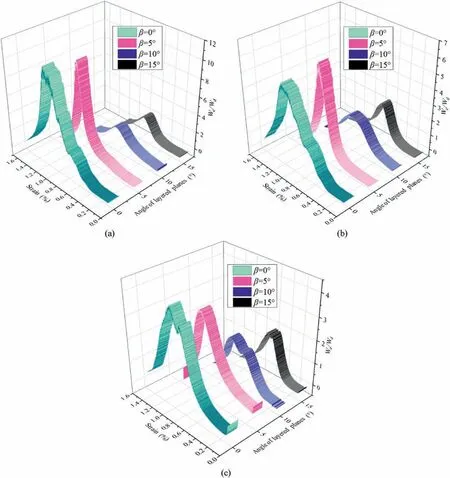
Fig.17.Relationship between energy dissipation coefficient and strain at different angles of layered planes: (a) n=1,(b) n=2,and (c) n=3.
(1) The initial loading stage is characterized by fissure compaction and elastic deformation,and is the stage of energy input and accumulation.At this stage,the input energy curve overlaps with the elastic strain energy curve,while the dissipated energy is negligible.The elastic strain energy curve increases gradually with increase of the strain,mainly because the initial crack of the sample is compressed,resulting in an increase in the stored strain energy per unit strain.
(2) The stage of stable crack propagation after the crack initiation stress is exceeded.When the stress exceeds the crack initiation stress,the cracks begin to grow and expand,causing a decrease in the stiffness of the specimen.As a result,the rate of growth of elastic strain energy decreases gradually,while the dissipation energy gradually increases,albeit slowly.
(3) The stage of unstable crack propagation after exceeding the damage stressσs.At this stage,the growth rate of the elastic strain energy curve decreases significantly and gradually moves away from the input energy curve,while the growth rate of the dissipated energy curve increases significantly.
(4) At the post-peak stage,after the peak stress is reached,the elastic strain energy curve decreases abruptly while the dissipated energy curve increases stepwise.This is mainly due to the release of a large amount of strain energy at the moment of the main crack penetration.At this stage,the sample retains a certain bearing capacity.As the crack continues to expand,the energy is gradually dissipated,resulting in a gradual decrease in the elastic strain energy curve and a gradual increase in the dissipated energy curve.
3.2.2.Analysis of energy evolution characteristics
The elastic strain energy eigenvalues corresponding to damage stressσsand peak stressσfare denoted as,respectively.The total input energy eigenvalue corresponding toσfisWf.According to Eqs.(15)and(16),mandkare defined as the variations of elastic energy of nodes representing damage stress and peak stress.
Figs.14 and 15 indicate that both the values ofanddecrease with the increase of the number of layers and the angle thereof.For two layered planes at angles of 5°,10°,and 15°,theof the 0°backfill specimen decreases by 51.84%,60.12%,81.68%,anddecreases by 51.76%,65.49%,and 91.76%,respectively.The logarithmic relationship between the changing rates ofm,kand the layered plane decreases.The two rates also decrease with increase of the layered angle,following a more complicated functional relationship,as shown in Tables 5 and 6.The aforementioned variation of elastic energy atmandkindicates that as the number of filling body increases and the filling surface angle increases,the sample becomes less compact,and the amount of energy stored before reaching the peak stress decreases (Qiu et al.,2022).From the damage stress to the peak stress,the proportion of elastic energy gradually decreases,and the dissipative energy increases (He et al.,2021).Before the filling specimen fails,the internal microcracks develop rapidly due to the pressure until they penetrate and reach the maximum bearing capacity.Then specimen enters the stage of strain softening and residual strength (Triantis,2018).
3.3.Analysis of filling layer effect
3.3.1.Analysis of layered effect of energy dissipation coefficient
To describe the transformation of energy accumulation and dissipation at different loading stages,the energy transformation coefficientqis defined to quantitatively reveal the process(Yu et al.,2022):
According to the law of energy conservation,the energy accumulation and release characteristics of the infill specimens with different layering parameters during deformation under loading are also varied at different stages (Liu et al.,2020a,2020b).In Section 3.2,the energy-conversion relationship of the anglelayered filling body at different stress-strain stages was analyzed by estimating the delamination effect of the angle-layered filling body at each stage based on the number of layers and the angle of layering,as shown in Figs.16 and 17.As external energy is input,the specimen undergoes destruction,and after reaching its maximum value,the energy dissipation coefficient decreases.The transformation of total energy is still dominated by elastic performance.Nevertheless,the rate of growth of elastic energy decreases and the dissipated energy increases,primarily at the plastic stage.Figs.16 and 17 demonstrate that when the energy dissipation coefficient reaches the maximum,the proportion of elastic energy in the specimen is the largest and the proportion of dissipated energy is the smallest.As the composite test piece changes from elastic to plastic,the crack accelerates in its expansion,and the severity of fracturing of the test piece continues to increase until it loses its bearing capacity.With the increase of the number and angle of layers,the deformation capacity of the filling body specimen decreases,its energy storage efficiency decreases,and it is easier to store the energy required to cause the failure of the specimen,i.e.the energy dissipation coefficient of the specimen decreases.The energy evolution analysis of each stage is as follows:
(1) Initial compaction stage
In the initial compaction stage,the load increases slowly from 0,and the micro-cracks and the pores of the stratified layer are closed.In this process,the extrusion and friction between particles produce energy consumption,resulting in greater dissipated energy than the elastic energy(Wang et al.,2021b).Based on the relativekvalue of the layered filling body at each angle and the end time of the initial compression stage in Tables 6 and it can be observed that with increase in the number of layers,the amount of elastic energy stored at the initial stage also increases.Additionally,as the number and angle of layers increase,the initial compaction stage becomes longer due to the increase in particle friction within the packing body as a result of the complex layered structure,which causes hysteresis in elastic energy storage.The energy transfer process at this stage is described as:
(2) Crack development stage
At the elastic stage,the internal particles of the layered filling body are compacted according to their angles,resulting in the compaction of the layered structure.The external input energy is stored inside the specimen in the form of elastic energy,and the growth rate of elastic energy is higher than that of dissipated energy (Sun et al.,2022).Meanwhile,as the load continues to increase,micro-cracks gradually develop.At the elastic deformation stage,the crack development is relatively slow,and the rate of increase of the dissipated energy is small (Hou et al.,2021).After entering the elastic-plastic deformation stage,a large number of new cracks rapidly develop and extend,and some existing cracks penetrate the sample.As a result,the dissipative energy increases at a higher rate than at the previous stage(Zhou et al.,2016).Table 6 shows that when the peak strength is reached,the dissipated energy increases and thek-value decreases as the layering angle increases.When the layering angle is 0°,5°,and 10°,qis consistently greater than 1.When the layering angle is 15°,the change in theq-value can be expressed using

Table 6Fitting relationship at each stage according to the angle of layered planes.
(3) Post-peak stage
At the post-peak stage,the main crack inside the specimen penetrates and merges,the strength begins to decrease,the elastic energy decreases,and the dissipated energy continues to increase(Yang et al.,2015b).When the layering angle is 15°,q-value is constantly less than 1;when the layering angle is 0°,5°,and 10°,the change process of theq-value is shown in the following formula.The trend of theq-value at this stage shows that as the number of layers and the angle of layers increase,the rate of increase of the dissipative energy of the filling test block also increases,and the failure time of the test piece decreases.Particularly at the post-peak stage,the dissipative energy increases rapidly.The change process of theq-value can be expressed by
3.3.2.Analysis of the effect of layering on the peak AE energy and energy storage limit
(1) Analysis of stratification effect on peak AE energy
According to the stress-strain curve and AE monitoring data,the delamination effect of the angle layered filling was quantitatively investigated in terms of energy (Li et al.,2011;Yang et al.,2015b).AE cumulative energy and cumulative events exist in the following stages with increasing loading(Yan et al.,2020;Wang et al.,2021a),as shown in Fig.18:
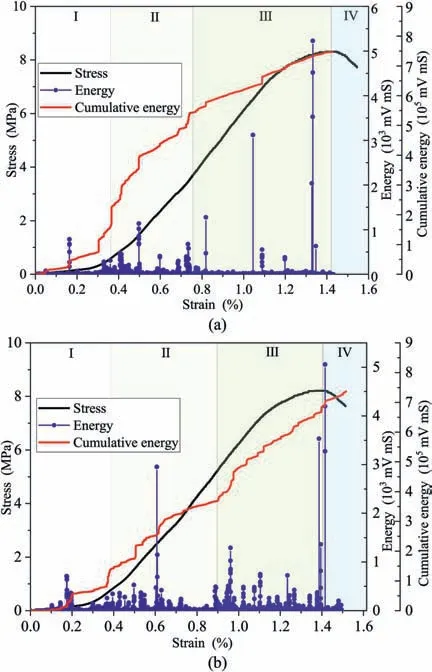
Fig.18.AE energy evolution of specimens: (a) n=1,β=0°,and (b) n=2,β=0°.
(i) Quiet period.At this stage,the number of oscillations of the signal crossing the set threshold is small,and the accumulated energy is low.At the initial stage of loading,the primary micro-pores and cracks are closed under loading,and there is almost no crack development.The particles inside the specimen are compressed and the micro-defects are closed.The AE energy is of a low level and there is no energy release.This stage corresponds to the compaction stage as reported in Sagar et al.(2012).
(ii) Slow growth stage.This stage is characterized by occurrence of signals that continue to increase as the specimen begins to release energy under the load.Local micro-cracks are initiated within the specimen,and the particles are compacted into the elastic stage until the initiation of these microcracks.Due to the release of a portion of the energy stored at the initial compaction stage,the AE energy and ringing count increase gradually.
(iii) Rapid growth stage.At this stage,as the load continues,the specimen reaches the plastic fracture stage,and new pores and cracks are rapidly initiated and expand.Most of the energy stored in the specimen is released,and the microcracks begin to connect and expand.This leads to a rapid increase in the AE energy and ringing count(Qiu et al.,2020).Therefore,more energy begins to be released at this stage and enters the yield stage.After rupture,a small amount of residual energy continues to be released,and eventually the failure of the specimen causes a loss of bearing capacity.
The AE energy of the specimen decreases with the decrease of UCS,and the change is well synchronized.Fig.19 shows that the peak energy and accumulated energy of AE gradually decrease as the number of layers and angle of layers increase.The cumulative energy reduction rate ranges from 3.74% to 45.04%.Moreover,the influence of the number of layered planes on the peak energy and cumulative energy is gentle on the whole;while,for the angle of layered planes is 10°-15°,it leads to the decrease of the peak energy and increase of cumulative energy,and the maximum reduction rate of cumulative energy is 33.13%.
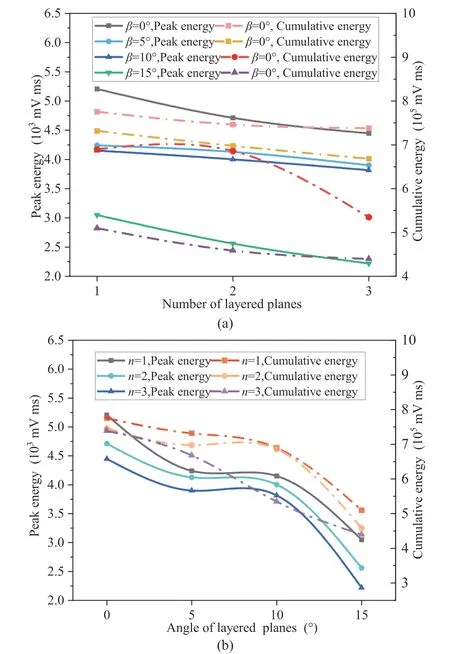
Fig.19.Relationship between different delamination parameters and energy: (a)Number of layered planes,and (b) Angle of layered planes.
(2) Delamination effect analysis of elastic energy storage limit
As explained in Section 3.2,there are multiple stages of energy evolution during uniaxial stress loading.Among these stages,the elastic energy gradually decreases and is released during the loading process after the accumulation peak point until the specimen is fully damaged.The accumulation peak point is considered as the elastic energy storage limit,which can be used as a reference value to evaluate the severity of failure and instability of the angle layered filling.The energy storage limit can be calculated by
whereis the elastic energy storage limit,andσfis the peak intensity.
With increase of the number and angle of layers,the elastic energy storage limit gradually decreases,as shown in Fig.20.The value ranges from 0.034 MJ m-3to 0.413 MJ m-3.The reduction rate ranges from 8.1%to 98.1%.When the stored energy of the specimen reaches the limit value,the loading continues.At this time,the elastic energy is released rapidly,resulting in the increase of dissipated energy,and the damage degree of the specimen is accelerated.The results indicate that an increase in the number of layers and angle of layering leads to a decrease in the energy storage required for specimen failure,resulting in a decrease in failure strength.
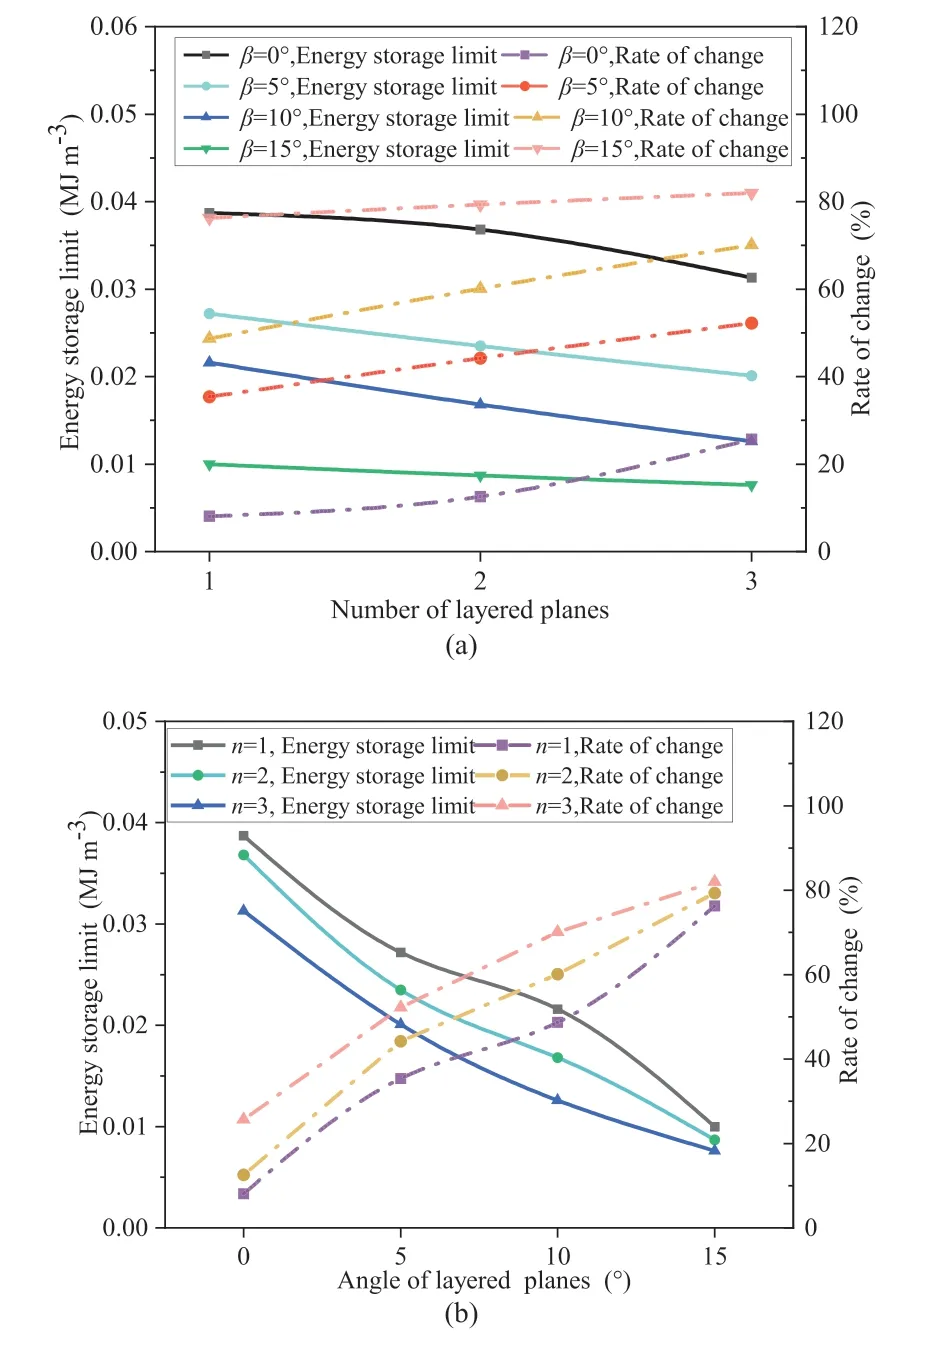
Fig.20.Relationship between the limit of energy storage and layering parameters:(a)Number of layered planes,and (b) Angle of layered planes.
3.4.Destruction mode
The formation and characteristics of cracks during the loading process of the backfill specimen are closely related to its layered features,and cracks can be considered as an irreversible and effective means to record the structural characteristics of the specimen (Qiu et al.,2020).The failure mode of angular layered backfill is shown in Fig.21.Analyzing the crack development of infill specimens with layered parameters involved selecting a number of layers ofn=3 and an angle of layering ofβ=0°,5°,10°,and 15°,and the propagation of cracks.In the case ofn=3 andβ=0°,the surface crack in the filling specimen was first observed in the right section of the upper test.As the loading process continued,the crack gradually propagated downward to the first layer of the sample,while a new crack initiated from the second layer in the upper part and extended towards the middle.The two cracks eventually connected to form the main crack in the upper right corner.Additionally,two non-coplanar tensile cracks developed vertically downwards at the upper end of the specimen(the backside of the view in Fig.21).Subsequently,several wingshaped cracks were formed on the 2nd,3rd,and 4th sub-layers.Whenn=3,andβ=5°,the surface crack of the filling sample first appeared in the upper part,and finally part of it fell off,forming a ‘serrated’ crack that penetrated the first layer,passed through the first layer,and extended to the upper left of the second layer.Wing-shaped cracks also appeared in the 2nd,3rd,and 4th layers.Whenn=3 andβ=10°,the initial surface crack of the backfill sample appeared on the upper left side.With the increase in loading,a large number of filling fragments in the first layer fell off,and a major crack on the left extended to the bottom of the third layer.In the middle of the second layer,a major crack was also initiated and guided by the first layer.Additionally,a narrower crack that penetrates the second layer on the left side of the crack.Meanwhile,two strip-shaped,wing-like cracks appeared and connected the layers.Whenn=3 andβ=15°,the initial surface crack of the filling sample appeared on the upper left part,and the outer circle of the first layer fell off.A sloping and penetrating main crack was formed in the second layer due to the increase in loading.Two non-coplanar tensile cracks appeared at the upper end of layer 1(the backside of the view in Fig.21)and developed downward to the second layer,forming wings extending upward and downward from the first layer in the first and second layers.Overall,as the number and angle of sub-layers increase,the number and area of cracks also increase,leading to the development of secondary cracks and larger cracks penetrating multiple sub-layers.The expansion of cracks towards the periphery further confirms the weakening effect of sub-layers as a weak point on the strength of the angle layered filling specimen.
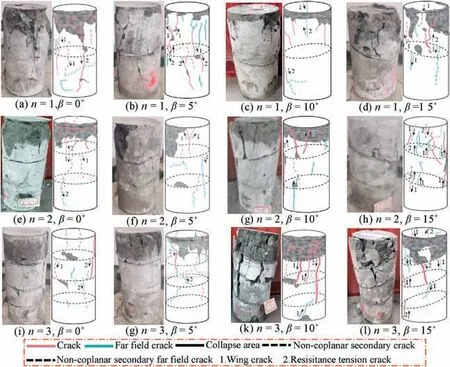
Fig.21.Photograph and schematic diagram of crack development of angle layered backfill specimens.
4.Discussion
4.1.Weakening effect of delamination on backfill strength
For underground engineering,strength is of utmost importance.Whether it is natural rock mass or a‘layered filling body’formed by filling technology,the presence of discontinuities due to various factors significantly weakens the overall strength,leading to anisotropy at various failure mode,crack development,deformation.This is the main reason that affects the safety of underground structures.As shown in Fig.22,the study investigates the change in strength under various conditions,including different mass concentrations,numbers of layers,sand-cement ratios,and three filling times,as well as changes in middle layer height and sand-cement ratio.The results indicate that,for filling times of 1-4,the strength of the horizontal layered filling body decreases as the number of layers increases.In addition,Wang et al.(2019,2020a)tested the cemented tailings fill with 1-4 layers and 0 MPa,0.2 MPa,0.5 MPa and 0.8 MPa confining pressures through triaxial cyclic loading and unloading experiments.The results showed that the strength of the cemented tailings fill under each confining pressure decreased with increase of the number of layers.Sun et al.(2022)carried out split Hopkinson pressure bar experiment on the filling specimens with three cement sand ratios and three horizontal layers.The findings indicate that as the number of layers increases,the dynamic peak stress decreases,and the failure predominantly occurs on the layer surface,which is consistent with the present study.The weakening resulting from delamination on the overall strength of the filling body has been previously explained as the discontinuity and loaded slip caused by delamination.These investigations support implications for practical applications,especially for strength design of baffles(walls),pumping capacity,adjustment of filling slurry fluidity (fluidity and sedimentation),and enhancement of the filling process (such as appropriate selection of the slurry delivery pipeline feed opening location and material ratio of slurry between different layers) to ensure stable filling structure and minimize costs.
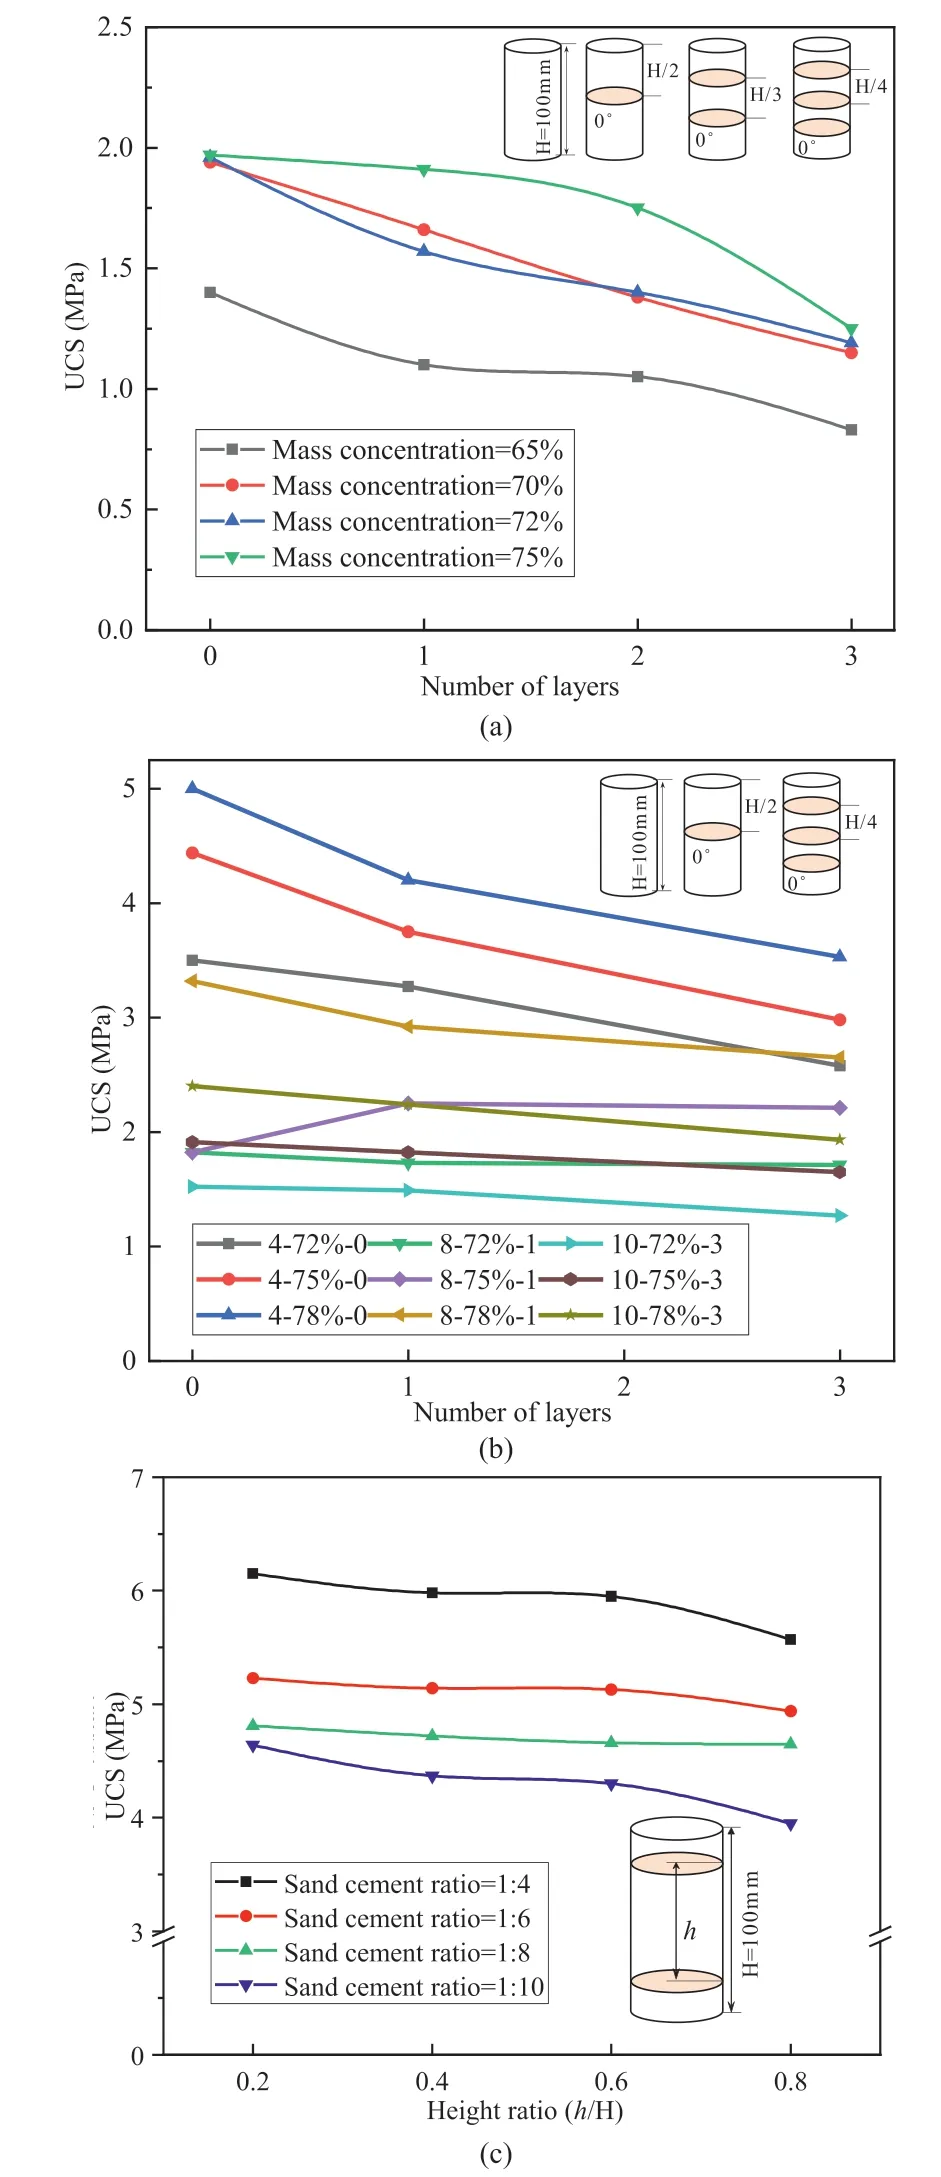
Fig.22.Effect of horizontal delamination parameters on strength:(a)Number of layers(modified from Cao et al.,2018),(b) Number of layers (modified from Xu et al.,2019),and (c) Middle layer parameter (modified from Wang et al.,2020b).
4.2.Limitations
In this study,standard cylinder test specimens of sizeϕ50 mm × 100 mm were produced,with delamination numbers ranging from 1 to 4 and delamination angles of 0°-15°.The anisotropy of the test specimens was quantitatively characterized by P-wave velocity and strength,and their relationship was established.The study also obtained information on energy dissipation and crack evolution during load-induced failure.The results indicate that for large-sized goaf filling bodies,the angle of delamination has a greater impact on strength than the number of delamination.To provide further design guidance for filling mining,it is important to strengthen the application of the flow and settlement law of filling slurry,in order to avoid the formation of large angle delamination in the filling body.
To obtain accurate mechanical parameters,in situ testing provides the most direct and accurate results,but is generally limited by the size and cost of the test (Ku et al.,2004).The mechanical parameters of rock mass and filling body,whether complete or with structural planes,exhibit a size-effect where the strength or elastic modulus decreases with increasing specimen size (Yang et al.,2015b).However,the study on the size effect of filling body is focusing on the complete filling body under uniaxial or triaxial compression,and there is limited research on filling bodies with delamination,which are more complex in practical engineering(Wang et al.,2022).Conversely,the influence of structural planes on rock mass should be comprehensively understood,and representative elementary volume(REV)is used to obtain a certain rock mass strength for engineering practice(Wang et al.,2022).To apply the angle layered structure filling body in complex engineering directly,it is essential to understand its size-effect law and obtain the REV value.Therefore,experiments on angle layered structure filling bodies of different sizes should be conducted to gain further information.
5.Conclusions
In this study,various raw materials including cement,coal gasification slag coarse slag,and coal gangue were used to prepare filling specimens with customized acrylic molds.Four types of layers and layer angles were utilized,and several testing methods such as uniaxial compression,AE,ultrasonic wave,and SEM were employed to investigate the microstructure,energy evolution characteristics,delamination effect,and failure mode of the anglelayered filling from the perspectives of anisotropy,energy,and crack evolution.The following conclusions can be drawn:
(1) The relationship between P-wave velocity and number of layers,and that between P-wave velocity and angle of the layer are linear and elliptical equations,respectively.The relationship between the layered parameters and wave speed is established.It is possible to calculate the wave velocity of the layered filling body at any weak part of the angle layered filling body.Anisotropy coefficients established by acoustic and mechanical parameters can characterize this feature.A relationship between UCS and P-wave velocity is obtained,and the intensity can be determined by measuring a small number of wave velocities.
(2) During the failure process of angle-layered backfill under load,the proportion of elastic energy at the crack initiation strength and peak strength decreases with increase of the number of backfill layers and angle of the backfill surface.The rate of decrease increases gradually.
(3) As the number and angle of layers increase,the layer effect becomes more pronounced.Specifically,the peak energy of AE decreases,and both the energy dissipation coefficient and energy storage capacity of the specimen decrease.Notably,the energy dissipation coefficient exhibits varying evolutions at different stages of the stress-strain curve.As the number and angle of delamination increase,the initial compaction stage becomes longer,and the rate of energy dissipation in both the crack development and post-peak stages becomes greater.
(4) The number of cracks increases with increase of the number and angle of delamination surfaces,mainly extending and expanding along the delamination surface to form ‘wing cracks’.These results indicate that the delamination surface,as a weak part,reduces the overall strength of the specimen.
Declaration of competing interest
The authors declare that they have no known competing financial interests or personal relationships that could have appeared to influence the work reported in this paper.
Acknowledgments
This research was supported by the National Natural Science Foundation of China (Grant Nos.52222404,51874229,51504182).
List of symbols
σfPeak strength
σsDamage stress
εfPeak strain
EModulus of elasticity
nNumber of layered planes
βAngle of layered planes
μPoisson’s ratio
μ1Strength anisotropy coefficient
μ2P-wave velocity anisotropy coefficient
WTotal input energy
WeElastic energy
WdDissipated energy
Energy dissipation coefficient
qThe energy storage limit
Elastic strain energy eigenvalues corresponding to damage stressσs
Elastic strain energy eigenvalues corresponding to damage stressσf
 Journal of Rock Mechanics and Geotechnical Engineering2023年12期
- Journal of Rock Mechanics and Geotechnical Engineering的其它文章
- The formation of orthogonal joint systems and cuboidal blocks: New insights gained from flat-lying limestone beds in the region of Havre-Saint-Pierre (Quebec,Canada)
- Numerical analysis of the effects of vesicle distribution characteristics on the engineering properties of volcanic rocks
- A hybrid attention deep learning network for refined segmentation of cracks from shield tunnel lining images
- 3D limit analysis of rock slopes based on equivalent linear failure criterion with tension cut-off
- Mutual impact of true triaxial stress,borehole orientation and bedding inclination on laboratory hydraulic fracturing of Lushan shale
- Unloading-induced permeability recovery in rock fractures
