ELM-Based Impact Analysis of Meteorological Parameters on the Radio Transmission of X-Band over the Qiongzhou Strait of China
Cheng Yang ,Yafei Shi ,Jian Wang,3,* ,Jianguo Ma
1 School of Microelectronics,Tianjin University,Tianjin 300072,China
2 Qingdao Institute for Ocean Technology,Tianjin University,Qingdao 266200,China
3 Shandong Engineering Technology Research Center of Ocean Information Awareness and Transmission,Qingdao 266200,China
4 School of Micro-and Nano-Electronics,Zhejiang University,Hangzhou 310058,China
Abstract: Communication in the evaporation duct layer is greatly affected by the variation of meteorological parameters.Based on the experimental result of the radio transmission of the X-band over the Qiongzhou Strait of China,the characteristic of the duct and its influence on the transmission effect is analyzed.The results indicate that the evaporation duct height(EDH)has a negative Spearman’s rank correlation of-0.90 with the relative humidity and a positive correlation coefficient of 0.84 with the wind speed.Based on the Extreme Learning Machine (ELM)network,we proposed a Met-ELM model that can provide efficient support in predicting propagation characteristics at nighttime.The predicted results of the Met-ELM model are consistent with the measurements;the root-mean-square-error is 1.66 dB,with the correlation coefficient reaching 0.96,while the proportion of mean absolute error less than 2 dB has reached 81.41%.The data-derived Met-ELM model shows great accuracy in predicting propagation characteristics at nighttime,which also meets the acceptable requirements for radio wave propagation.
Keywords: evaporation duct;neural network;prediction model;propagation characteristic
I.INTRODUCTION
An evaporation duct often occurs close to the sea surface and may lead to anomalous effects in electromagnetic wave propagation,such as expanded detection range or blind zone in radar systems [1,2],and interference,interruption,or enhanced effects in a communication system [3,4].It is a unique atmosphere boundary layer structure that lies at the bottom of the troposphere and often appears in the ocean[5,6].Electromagnetic waves may be confined in the evaporation duct layer and propagate with low energy loss that can exceed the normal propagation range of the electromagnetic wave.The trapped signal frequency is generally higher than Public Land Mobile Network(PLMN),so the evaporation duct communication system can be realized within a wide bandwidth and high transmission rate.Moreover,the less cross-frequency band with the existing PLMN can be used more effectively with less interference in marine communication applications[7].
The evaporation duct is greatly affected by meteorological parameters;accurate knowledge of duct characteristics could play an important role in the operational performance of radio systems [8–10].Practical support for exploring new communication methods using evaporation ducts can be provided by accurately analyzing the influence of meteorological parameters on radio wave propagation and evaluating the path loss for wireless communication systems under different marine environments[11,12].The deep learning algorithms were introduced from two different perspectives in recent years,modeling the characteristic of evaporation ducts and the effect on a communication system.Yan et al.propose a numerical profiling method that adopts the artificial neural network (ANN) and training data from the remote sensing meteorological dataset and the evaporation duct model [13].Zhu et al.outlined a new method based on a multilayer perceptron (MLP) to predict evaporation duct height (EDH) [14].Han et al.illustrated a classifying-inversion method of atmospheric duct parameters using Automatic Identification System (AIS) signals combined with a genetic algorithm(GA)and deep neural network(DNN)[15].Sit et al.apply a multilayer perceptron machine learning(ML)regression approach to infer electromagnetic duct heights within the marine atmospheric boundary layer (MABL) using sparsely sampled EM propagation data obtained within a bistatic context[16].Moreover,Dang et al.demonstrated a multiscale decomposition prediction method for predicting the propagation loss in oceanic tropospheric ducts by extracting the data characteristics of different frequencies [17].The previous findings mainly focus on the combination of artificial intelligence (AI) and the duct characteristics,or modeling the effect in a communication system based on the propagation loss data.However,analyzing and modeling radio wave propagation characteristics based on meteorological parameters are rarely reported.
The SCS is located in tropical subtropics,and the intense sunlight enhances the evaporation intensity of the sea surface;the Kuroshio current and the Taiwan Current also provide new fuel for the occurrence of ducts [18].According to the statistical result in[19,20],the probability of the evaporation duct in the SCS is about 85%,while the average duct strength is 35 M-unit.The height remains stable in the central SCS,within a range of 10.0 to 12.0 m[21],providing favorable communication conditions under the evaporation duct mechanism.This paper aims to provide an approach to predicting and analyzing radio transmission characteristics based on the correlation between meteorological parameters and transmission effect.The National Center for Atmospheric Research(NCAR)database is applied to analyze the characteristics of ducts statistically [22],and path losses with the Naval Postgraduate School (NPS) model and the parabolic equation (PE) method were also illustrated in Section II.Section III introduced experiment results over the Qiongzhou Strait of China,a Met-ELM model was built based on the Extreme Learning Machine (ELM) network,and model validation and discussion are drawn in Section IV.
II.CHARACTERISTIC ANALYSIS OF EVAPORATION DUCTS
The atmospheric duct is a kind of phenomenon with an abnormal refractive index structure in the troposphere;signals can propagate in the ducting layer with low energy loss exceeding the normal transmit range.
The tropospheric electrical property can be expressed by the dielectric constantεor the atmospheric refraction indexn=c/v=wherecandvare the transmit speed of the electromagnetic wave in free space and the medium,respectively.Slight changes in the refraction index can significantly affect radio wave propagation,and the radio refractivityNis usually defined.Radio refractivityNcan be obtained based on the relationship with meteorological parameters,including atmospheric temperatureT,pressurep,and water vapor pressuree[8]
wherenis the atmospheric refraction index.
Instead of radio refractivity,the modified refractivityMis defined as[8]:
wherereis the Earth’s radius andhis the altitude.
2.1 Impact of Meteorological Parameters on the Evaporation Duct Height
According to the meteorological parameters of the designated location,the modified refractivity profile can be analyzed with the evaporation duct model.Moreover,the height and strength of the evaporation duct are revealed.
In this paper,the NPS model is introduced to analyze the characteristics of evaporation ducts.The NPS model is less sensitive to input parameters and produces the best agreement with radio wave propagation measurements[23–26].One of the specific features of the NPS model is that it first obtains the vertical profile of temperature and specific humidity.During the calculation,the scale parameters and thermodynamically roughness height of the sea surface are defined by the COARE 3.0 algorithm [27,28].And the wind speed and temperature under stable conditions are calculated by the profile stability functionsψh[27]:
whereξ=z/L,zis the altitude,Lis the Monin-Obukhov length,ah=bh=5,ch=3,Bh=
Meteorological parameters were drawn to calculate the modified refractivity profile,and the NCAR Climate Forecast System Reanalysis (CFSR) database was selected[22].The NCAR datasets are drawn from meteorological measuring platforms,including land,surface,ships,radiosonde,aircraft,and satellites.The products here are available at 1760 x 880 grid points hourly,which supplied data with 0.205°~0.204°from 0°E to 359.795°E and 89.843°N to 89.843°S.Table 1 shows the statistics results of meteorological parameters around Qiongzhou Strait in September 2019.According to the statistical results,the variation of meteorological parameters is mainly reflected in an air-sea temperature difference(ASTD),relative humidity,and wind speed,with a slight change in the pressure.
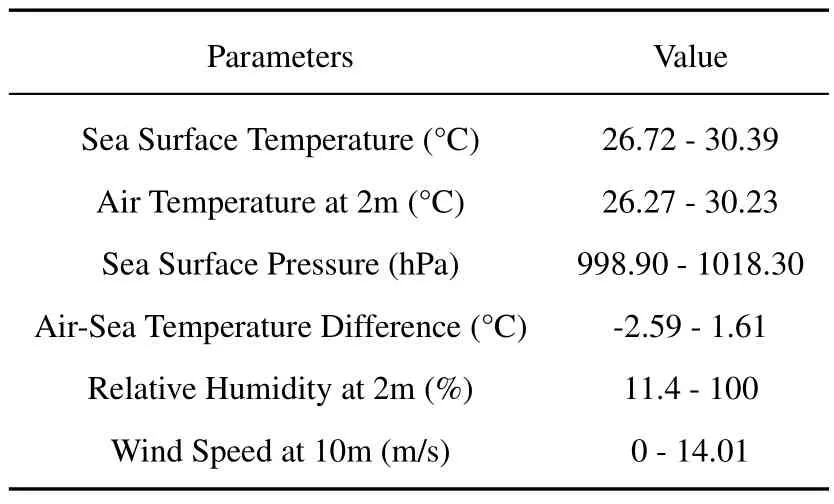
Table 1.Atmospheric parameters around Qiongzhou Strait.
The analysis results of the EDH to meteorological parameters using the NPS model are displayed in Figure 1.In this figure,the sea surface temperature(SST)is fixed at 30°C,the sea surface pressure is set at 1010
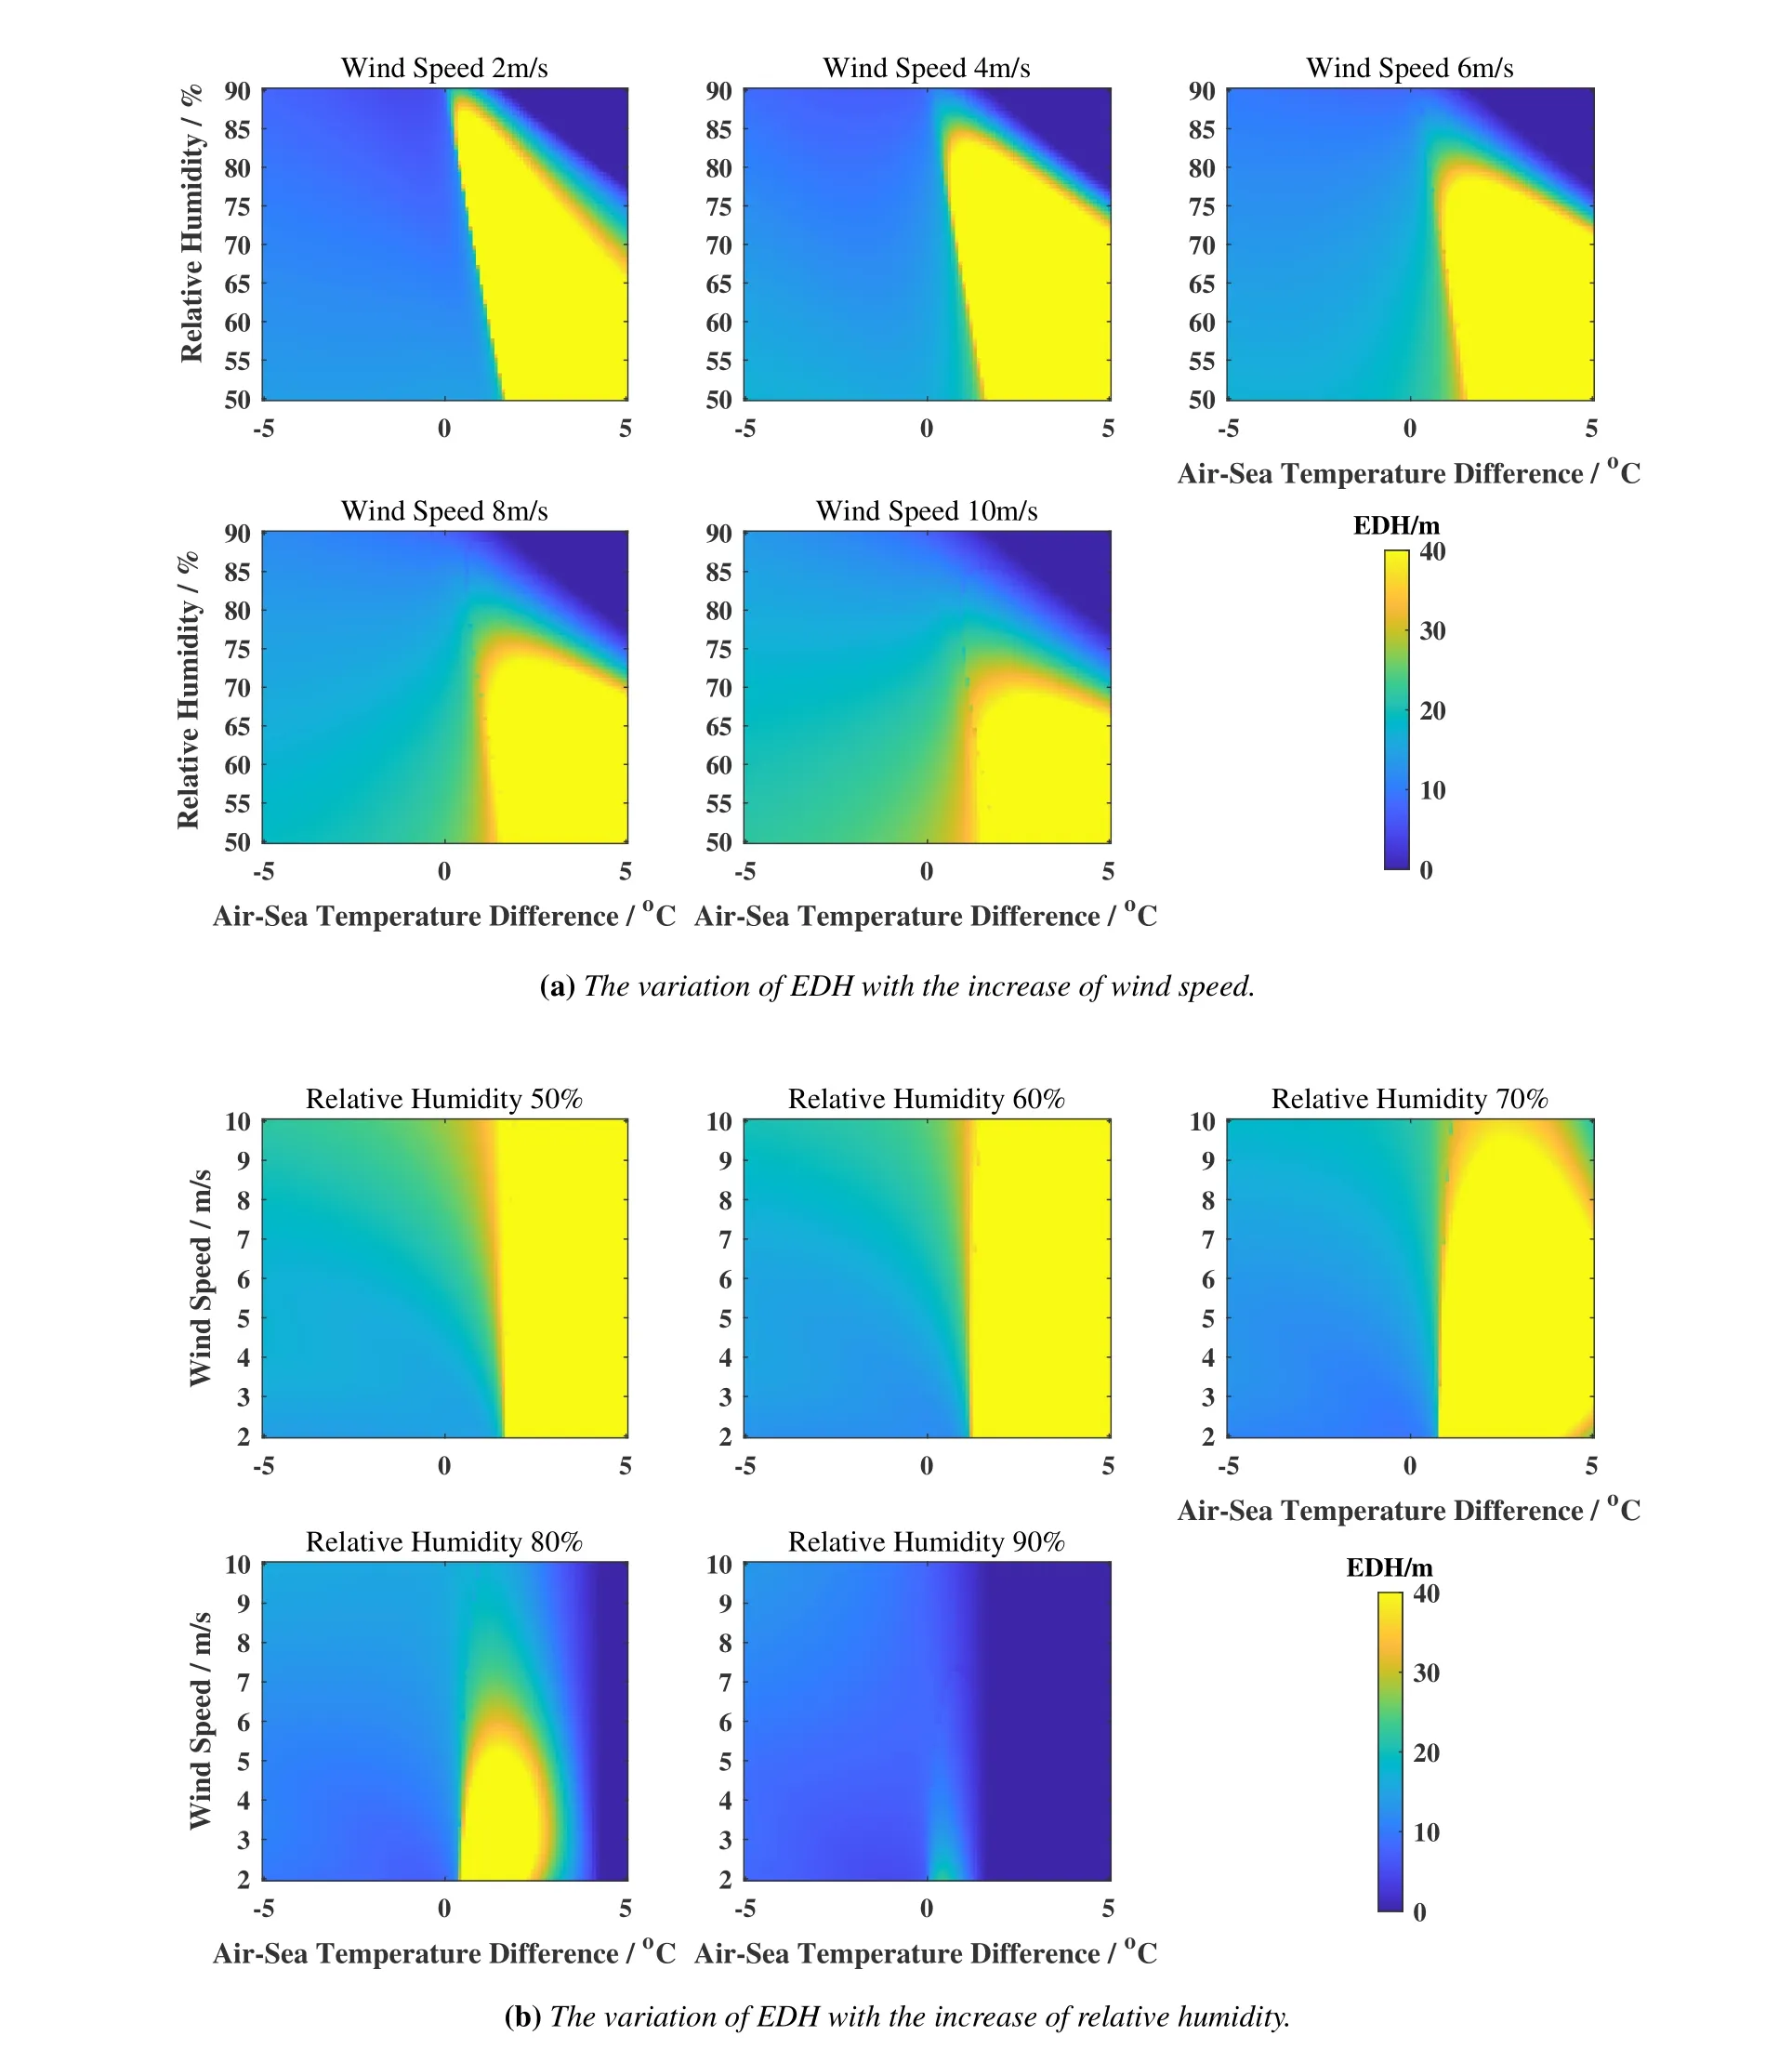
Figure 1.Sensitivity analysis of EDH to meteorological parameters.
hPa,and the other meteorological parameters are from Table 1.
1.Figure 1a shows the variation of EDH with the wind speed increase.The EDH increases slowly with the decrease of relative humidity and the increase of wind speed under an unstable state(ASTD<0°C).And the EDH reduces faster when the relative humidity increases.The EDH reaches 40 m rapidly under a stable state (ASTD>0 °C),and EDH decreases with the increase in wind speed and relative humidity.
2.Figure 1b shows the variation of EDH with the relative humidity increase.The EDH decreases gradually with the decrease of wind speed and relative humidity increase under an unstable state.When the ASTD exceeds 0 °C and the relative humidity changes between 50% and 70%,the EDH will rise to 40 m immediately while ASTD reaches a certain value which may decrease with the increase of relative humidity.The EDH rapidly reduces with wind speed increases when the relative humidity is above 80%.
The EDH is more sensitive to meteorological parameters under a stable state (ASTD>0 °C) than that under an unstable state (ASTD<0 °C).The variation of EDH is complex with meteorological parameters,and it can be at a high level with lower relative humidity,lower wind speed,and higher ASTD.Variations in the unstable state are more stable;the higher the ASTD,the greater the wind speed and the lower the relative humidity,which is conducive to the evaporation of the ocean and the formation of a strong evaporation duct.
2.2 Impact of Meteorological Parameters on the Radio Transmission Characteristics
Considering that the characteristics of ducts are mainly affected by the ASTD,relative humidity,and wind speed,we simulated modified refractivity profiles and path loss at 9.6 GHz under different meteorological parameters,the results are shown in Figure 2.During the simulation,the NPS model was used to analyze the modified refractivity,and the PE method is adopted in calculated the path loss with transceiver height fixed at 9 m.
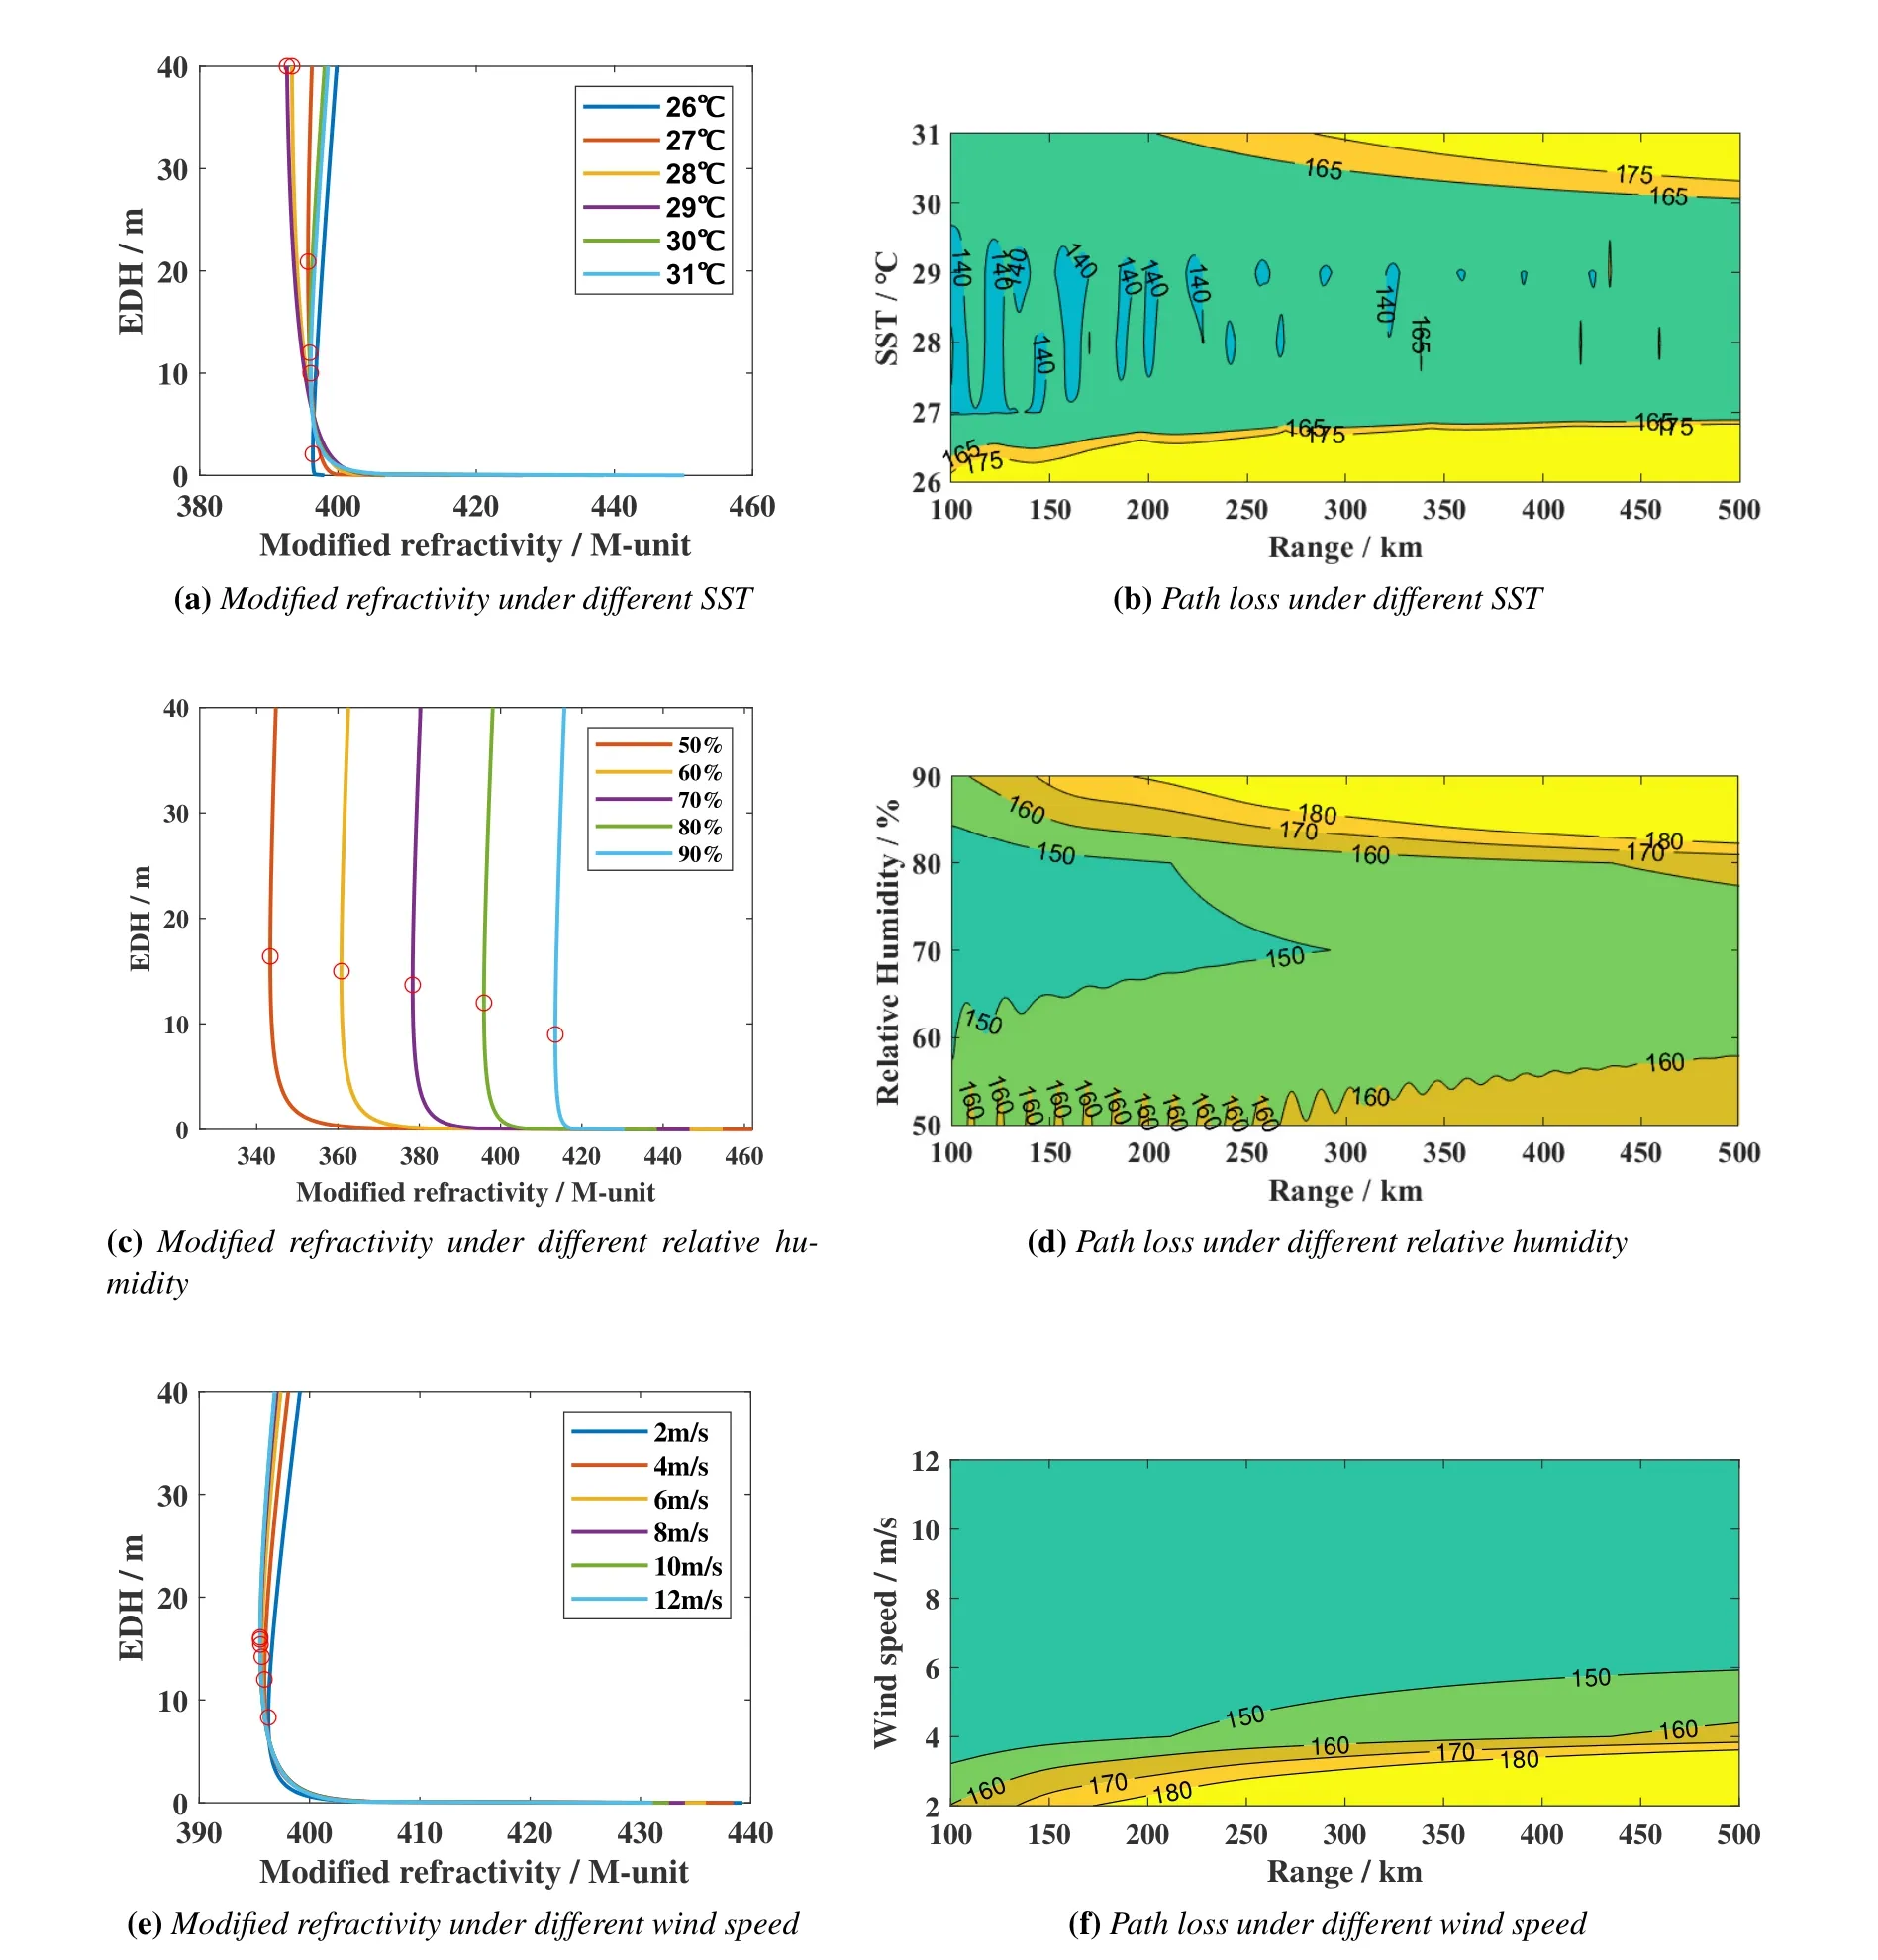
Figure 2.Modified refractivity and path loss at 9.6 GHz under different meteorological parameters.
The PE approximates the wave equation and can be used to simulate the propagation in the conical region along the paraxial direction.It has become the main method for numerical calculation of propagation and analysis of radio wave propagation characteristics in atmospheric ducts[29,30].
1.Figure 2a and 2b show that the analysis results of the SST vary from 26 °C to 31 °C when the air temperature is 30°C,the wind speed is 4 m/s,the relative humidity is 80%,and the pressure is 1010 hPa.The evaporation duct height and strength rise rapidly first and then decline rapidly with the increase of SST,and the path loss shows selectivity of meteorological parameters with the optimum transmission effect when the SST varies between 28°C and 29°C.
2.Figure 2c and 2d show the analysis results of the relative humidity vary from 50% to 90% when SST is 30 °C,the air temperature is 30 °C,the wind speed is 4 m/s,and the pressure is 1010 hPa.The evaporation duct height and strength decrease gradually with the increase of relative humidity,and the path loss drops at first and then starts to increase,with the optimal transmission effect occurring when the relative humidity is 70%.
3.Figure 2e and 2f show the analysis results of the wind speed varying from 2 m/s to 12 m/s when SST is 30°C,the air temperature is 30°C,the relative humidity is 80%,and the pressure is 1010 hPa.The evaporation duct height and strength increase slightly as the wind speed increases,and the path loss decreases rapidly.The path loss gets lowest with the wind speed of 12 m/s.
III.METHODOLOGY
3.1 Modeling Data
To analyze the influence of meteorological parameters on the beyond line-of-sight(BLoS)transmission in the ducting layer,an experiment link was set up across the Qiongzhou Strait [31–33].The distance of the BLoS transmission link is 87 km,with the transmitter located at Zhanjiang,Guangdong,and the receiver at Haikou,Hainan.During the experiment,the signal was transmitted at 9.6 GHz with an output power of 40 dBm,and horn antennas with a maximum gain of 30 dBi were set up at 9 m above sea level for both the transmitter and receiver.Moreover,meteorological sensors are set a 1 Hz sampling interval.
During the experiment,the received signal power and meteorological parameters at the receiving position were collected at nighttime from 20:00 September 15,2019,to 06:24 September 16,2019.We took the Local time (Beijing time) to explore the pattern between meteorological parameters and the characteristic of the duct or the transmission effects.The local sunrise time of 6:24 is used to distinguish the experimental results of nighttime and daytime,and the ASTD in this period is also less than 0°C.
The relative humidity varies on a large scale,and it fluctuates as a sinusoidal wave with a change period of approximately 6 hours,maintaining a low level between 2:00 and 3:00.Compared to the relative humidity,the wind speed is kept at a low level and varies more on a small scale with the range of 0-2 m/s.In terms of the received signal strength,it gradually decreased with the increase of relative humidity at the beginning of the night.The signal strength drops to the lowest at 1:00,close to the bottom noise of -140 dBm.Similar to the variation in wind speed,the received power also presents a small-scale fading feature.
Figure 3 shows the variation of the modified refractivity profile and EDH with the NPS model and the meteorological parameters at the receiving position.As in Figure 3,the evaporation ducts are unstable at nighttime.Before 22:00,the EDH is discretely distributed and fluctuates with the wind speed when the relative humidity is less than 90%.And modified refractivity increases significantly when the relative humidity rises gradually and exceeds 90%;with this comes the relative stability of the EDH.The relative humidity drops to less than 90% after 2:00,and EDH shows more discrete characteristics and rises to the highest in this period.Overall,the changes in duct characteristics are significantly affected by meteorological parameters.
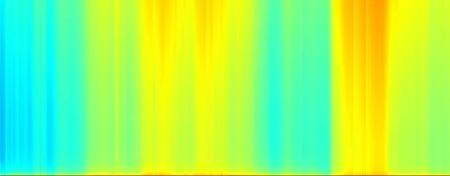
Figure 3.Variations of modified refractivity at nighttime.
3.2 Modeling Idea
Spearman’s rank correlation coefficient and mutual information were introduced to evaluate the relationship between duct characteristics and meteorological parameters [34,35].Definitions of these metrics are listed in Table 2.
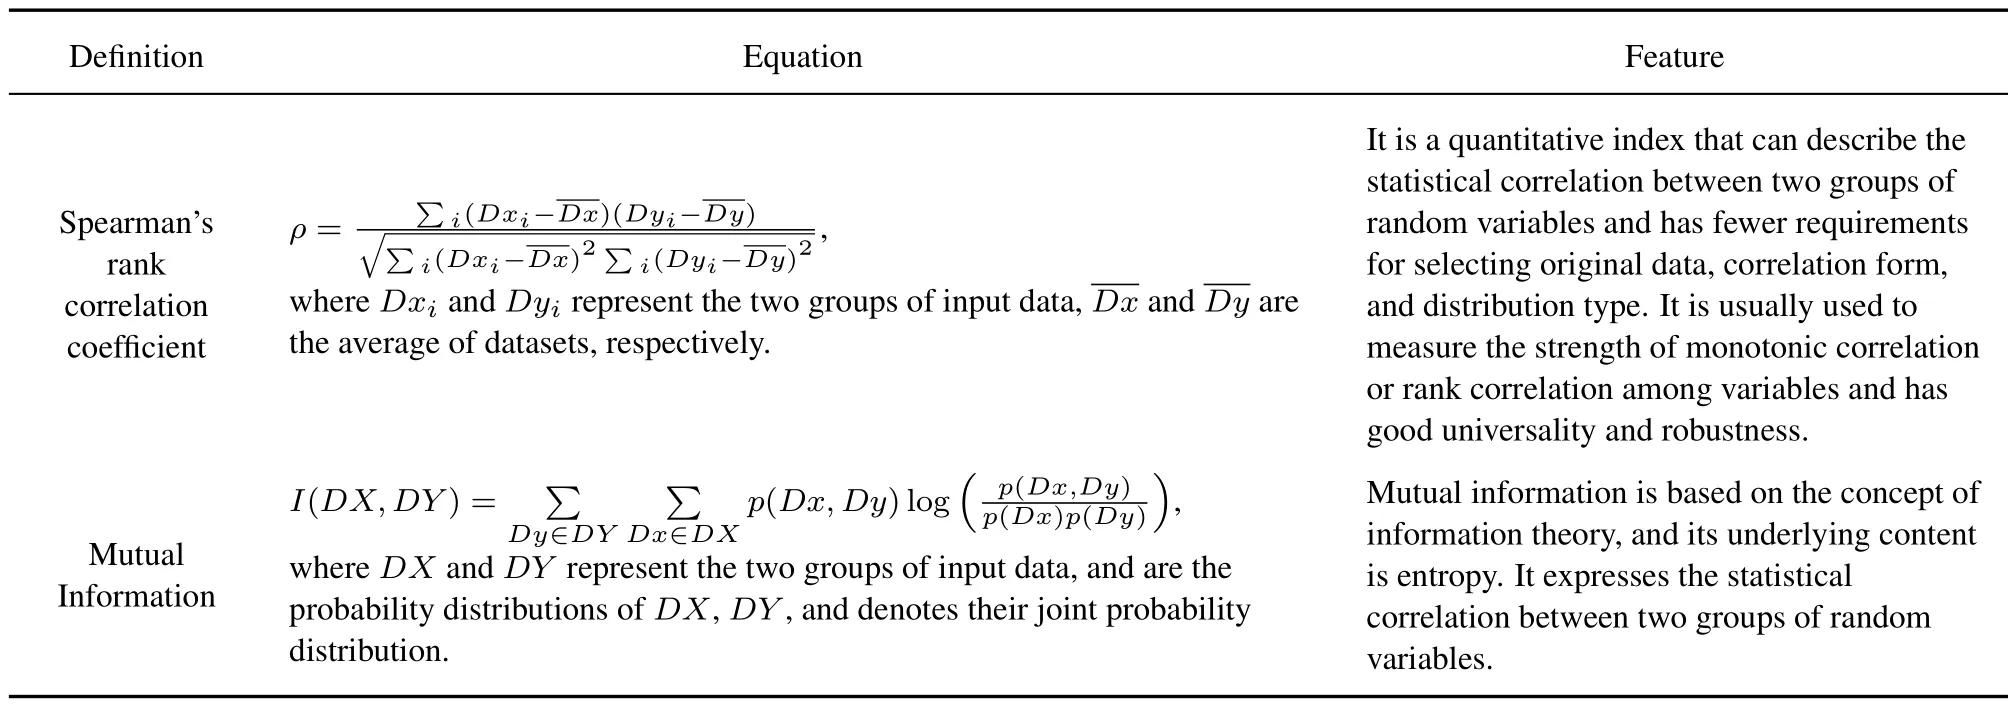
Table 2.Definition of performance metrics.
The corresponding relationship between the meteorological parameters and the EDH is analyzed with a 60 Hz sample interval.Figure 4 illustrates the statistical results of EDH with the vibration of relative humidity and wind speed at nighttime.Furthermore,Spearman’s rank correlation coefficient between meteorological parameters and EDH shows in Table 3.
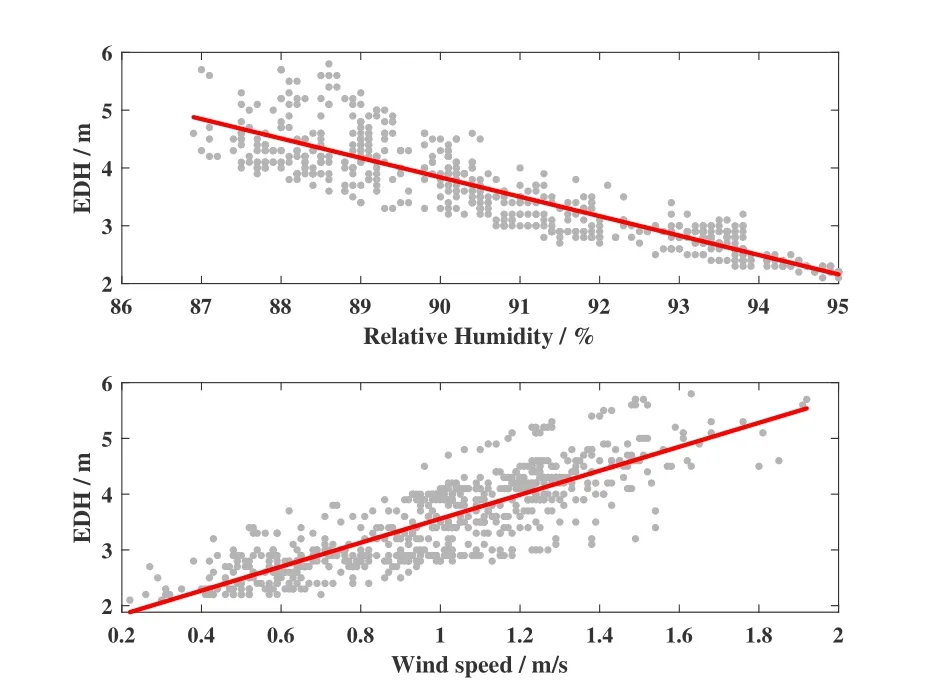
Figure 4.EDH varies with meteorological parameters at nighttime.
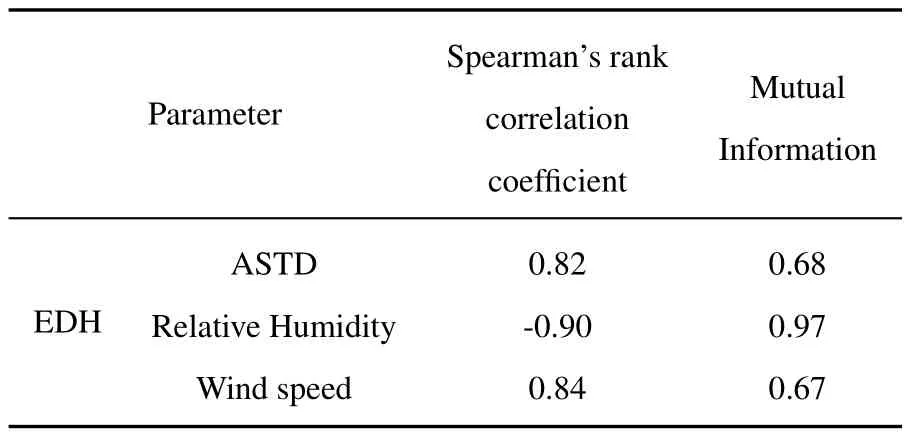
Table 3.The Correlation between EDH and meteorological parameters.
As in Figure 3,the EDH is closely related to meteorological parameters.In an unstable state (ASTD<0°C),the height rises gradually with the increase of air temperature and SST,the decrease of relative humidity,and the rise in wind speed.The experimental results are consistent with the simulation results.In Figure 4,the ASTD is less than 0 °C,and the EDH linearly decreases with relative humidity;the EDH increases linearly with the increase of wind speed.Relative humidity negatively correlates with EDH,and Spearman’s rank correlation coefficient is-0.90,while the mutual information is 0.97.Besides,wind speed strongly correlates positively with EDH,the correlation coefficient is 0.84.Under unstable conditions,the seawater will evaporate faster as the wind speed increases and the relative humidity decreases,forming strong evaporation ducts.
Considering the strong correlation between the meteorological parameters and the EDH under an unstable state(ASTD<0°C),the transmission effect in the ducting layer may also be determined.This paper aims to provide an engineering approach to predict and analyze the radio transmission characteristics under an unstable state in the future,with the correlation between meteorological parameters and received power.
3.3 Modeling Method
This paper introduces ELM to model the radio transmission characteristics of a microwave wireless communication link[36].Considering the number of measurement datasets in practical application and the generalization of prediction methods,we have used the ELM modeling method to train the behavior of radio transmission characteristics with memory effects and improve from two different perspectives.Firstly,the ELM method is easy to train and needs minimal human intervention time due to fewer parameters needing to be adjusted.In addition,fewer iterations are required,and the learning speed is accelerated without losing the accuracy and generalization performance of the developed model [37].Relationships between meteorological parameters and received signal power have strong nonlinearity.Since ELM can universally approximate any continuous nonlinear functions on the compact set [38],we chose it as the learning method in this work.
Moreover,the accuracy of modeling with N distinct samples is theoretically guaranteed,which makes ELM more attractive over conventional deep learning methods [39–41].The inputs of the proposed model could be any input parameters,including air-sea temperature difference,relative humidity,and wind speed.The output of the proposed model is the received signal power.
ELM is a feed-forward neural network with a single hidden layer.This network is proposed to simplify the calculation caused by nonlinear optimization,such as determining the input weights,the optimal value of the hidden layer bias,and analytically calculating the optimal value of the output weights.During the model building,input weights and hidden layer bias are randomly generated,then the output weights can be obtained.The basic architecture of the ELM Network is shown in Figure 5,composed of the input layer,hidden layer,and output layer from bottom to top.
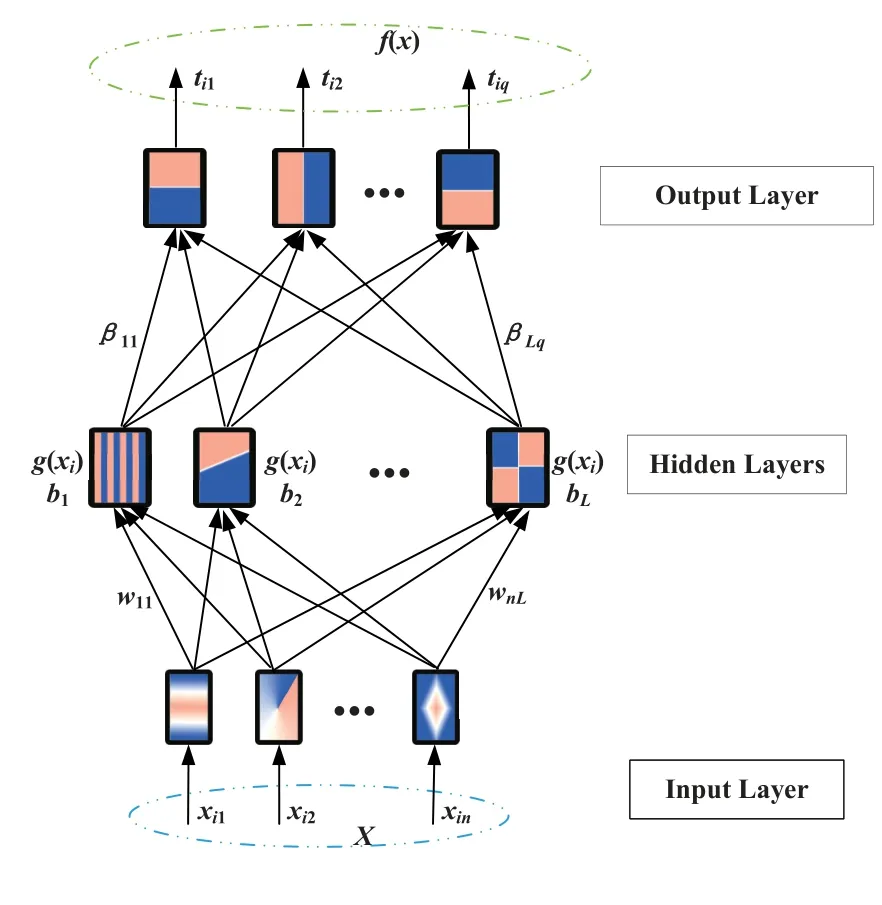
Figure 5.Basic architecture of ELM network.
For the training datasetsU=(xi,ti),i=1,2,...,N,thei-th training dataset withn-dimensional input can be expressed asxi=[xi1,xi2,...,xin]T∈Rn.Similarly,the out-put vector withmdimensions can be expressed asti=[ti1,ti2,...,tim]T∈Rm.The mathematical model of the ELM network withLhidden layer neurons is
where the output weight vector of the node in thej-th hidden layer isβi,and the activation function isg(·).The input weight iswi,and the hidden layer bias isbi.
Different from the general learning method,the input weightwand the hidden layer biasbare randomly generated,and then the output weightBis obtained.The training error can be minimized through these calculations,and better generalization effects can be achieved.According to the ELM network,Eq.(4)can be rewritten as follows:
The output matrix of hidden layer nodeHis
whereLis the number of hidden layer nodes.
The output weight matrixBis
The output matrixTis
The training steps of ELM Network are as follows:
Step 1:Select the appropriate activation function and the number of hidden layer nodesL,and the input weightswiand hidden layer biasbiare randomly generated,1≤i≤L;
Step 2:Calculate the output matrix of the hidden layer;
Step 3:Calculate the output weight matrix.
3.4 Modeling Process
Different from the traditional,BP network repeatedly selecting and adjusting the parameters,the ELM network directly analyzes and calculates the output weight matrix by randomly selecting a single hidden node.The algorithm can improve learning efficiency and simplifies parameter learning.
During the modeling process,the design of the ELM network and the selection of corresponding parameters will also greatly influence the prediction accuracy of training data so that the related parameters need to be adjusted systematically.The modeling process for ELM network design mainly includes data selection and normalization,the determination of hidden neurons,and the activation function selection.
3.4.1 Data Selection and Normalization
To avoid the burst jitter of the training data,data preprocessing was carried out at intervals of 1 minute[42],and an average dataset with a number of 624 was obtained.
According to the input vector of the ELM network,the input meteorological parameter matrix is defined as
whereASTDis the air-sea temperature difference,RHis the relative humidity,WSis the wind speed,andNis the number of datasets of 624.
The output vector is the received signal power,which can be expressed as
wherePis the received signal power.
For data acquisition,we randomized and split the measured data using the hold-out method,with a ratio of 70%training dataset and 30%testing dataset.The hold-out method is a common way to directly split the dataset into two mutually exclusive sets,one of which is used as the training set and the other as the testing set to estimate the generalization error.
Generally,the units of the original measurement data in each dimension are different,which will cause these feature values to be distributed over a wide range.Although feature values with a wide range may play a dominant role when calculating the Euclidean distance between different samples,simply adjusting parameters to adapt to varying ranges of feature values may lead to a decrease in training efficiency.Therefore,preprocess the samples and normalize the feature values of each dimension to the same range,which may eliminate the correlation to obtain ideal results.In this paper,scaling normalization is used to normalize the range of each feature value to[-1,1].
where max(x)and min(x)is the maximum and minimum value of the input feature vectorx,separately.
3.4.2 Determination of Hidden Neurons
The basic component of a network is the neuron;while the difference between the training and the testing error is slight,the chosen neurons can be considered appropriate.The prediction error decreases first and then increases may imply that the number of neurons is large;in this case,it is necessary to reduce the number to control the overfitting.Therefore,the number of neurons needs to be adjusted according to the specific situation,including the weight and the number of biases in the neural network.
Considering that the number of neuronsLin the ELM network should be far less than the number of training samples[37],we simulate from 1 to 200 and choose the optimal number of neurons as 166.
3.4.3 Selection of Activation Function
g(·) is the activation function of the hidden layer,which can limit the input information to a certain range.The structure of the ELM network transfers with the activation function changes,which can map the output nonlinear into a certain range with[-1,1]or[0,1],generally.
The common activation function of the Sigmoid is chosen in this manuscript,which squeezes the input values over a wide range into the output value range with[0,1].
After the above steps,we finally completed the construction of the Met-ELM model with the meteorological parameters based on the ELM network.
IV.MODEL VALIDATION AND DISCUS SION
This paper mainly uses the prediction function of the ELM algorithm to model the propagation characteristic base on the meteorological parameters.To analyze the performance of the Met-ELM model,we introduce accuracy evaluation indexes,including root-mean-square-error(RMSE),mean absolute error(MAE),and Spearman’s rank correlation coefficient.
The RMSE can evaluate the overall deviation and the stability of the accuracy of the predictions.
wherenis the number of samples,andPiis the predicted and measured values,respectively.
The absolute error was used to evaluate the absolute deviation between the predicted valueand measured valuePi,and it is not susceptible to extreme values.
Table 4 shows the statistical prediction results of the Met-ELM model,the predicted results of the Met-ELM model are consistent with the measurements,the RMSE of the 624 sets of data is 1.66 dB,and the Spearman correlation coefficient is 0.96.The statistical results of prediction error with a yellow bar also reflect the same pattern,and the MAE for 81.41% of datasets is less than 2 dB,showing good prediction accuracy.
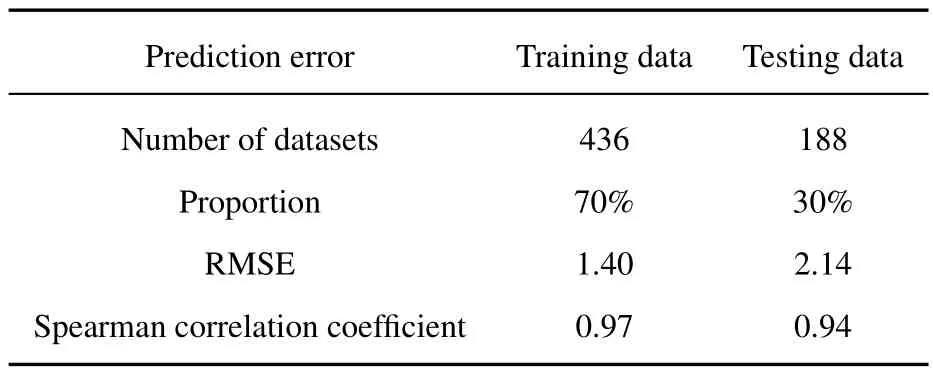
Table 4.Prediction results of the Met-ELM model.
Statistical analysis of the testing data is carried out in the form of scatter plots and bar charts in Figure 6.It can be seen that the statistical histogram of prediction error conforms to the normal distribution,theRMSE is 2.14 dB,while the Spearman correlation coefficient is 0.94.The Statistics Result of testing data shows that the Met-ELM model greatly generalizes the global data.
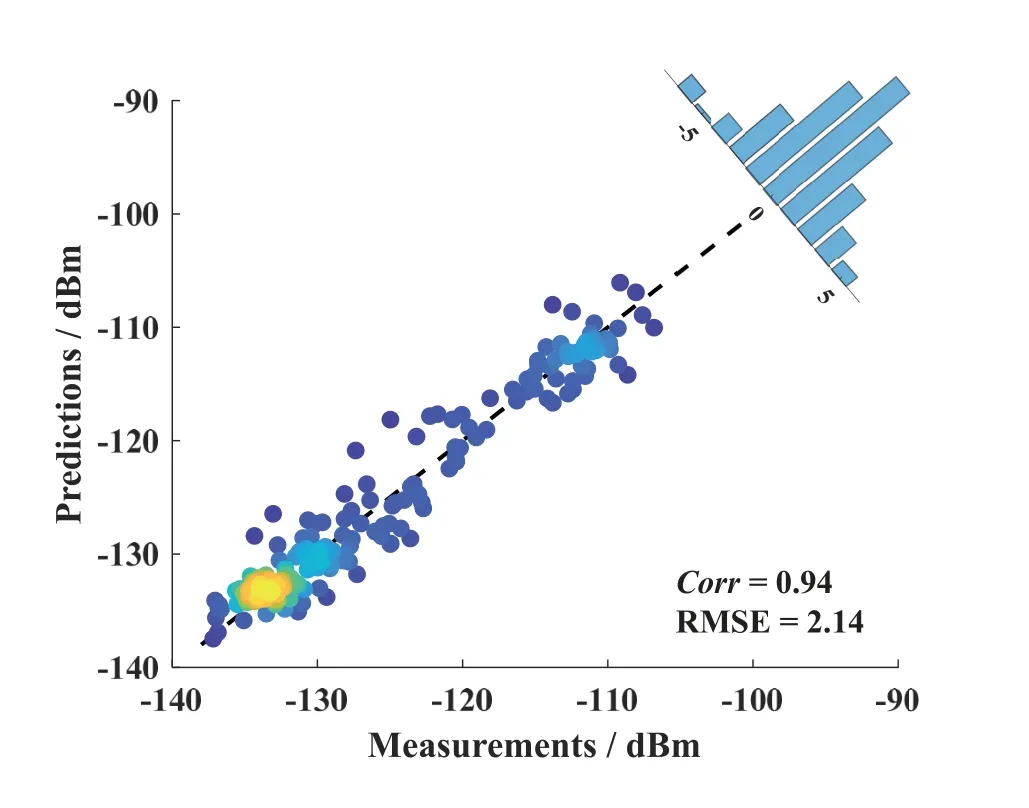
Figure 6.Error distribution of testing datasets.
The Met-ELM model was constructed based on the experimental link of the X-band over the Qiongzhou Strait in September 2019,and the ASTD during the nighttime was less than 0°C.The evaporation duct is in an unstable state(ASTD<0),the evaporation intensity of seawater increases along with the relative humidity increases,and the wind speed decreases.During the experiment,the overall meteorological parameters were relatively stable.The relative humidity fluctuated in the range of 86%to 95%,and the wind speed varied from 0 m/s to 2 m/s,showing a relatively stable correlation with path loss in Figure 2,which provides favorable conditions for this data-derived prediction model.The overall prediction results show that the Met-ELM model can provide great support for predicting the transmission effects of Qiongzhou Strait with high-precision training based on the meteorological parameters when the ASTD is less than 0°C.
V.CONCLUSION
This paper describes the impact of meteorological parameters on the propagation characteristics based on the experimental datasets in the X-band transmission link over the Qiongzhou Strait of China.The dependence of the evaporation duct height,strength,and radio transmission characteristics on meteorological parameters from the perspectives of simulation and experiment results are presented.
A strong correlation lies between the meteorological parameters and the EDH under an unstable state(ASTD<0 °C),the EDH has a negative Spearman’s rank correlation of -0.90 with the relative humidity and a positive correlation coefficient of 0.84 with the wind speed based on the experimental results.The Met-ELM model was proposed to predict and analyze transmission characteristics based on the correlation between meteorological parameters and transmission effect.The predicted results are consistent with the measurements,and a good consistency is maintained in the local maximal or minimal value.The RMSE of the testing dataset is 1.66 dB,which can provide effective support for radio wave propagation prediction[43–45].The MAE for 81.41%of datasets is less than 2 dB,showing a good prediction accuracy.The trained Met-ELM model can provide favorable support for predicting transmission effects of Qiongzhou Strait with high-precision training at nighttime,based on the meteorological parameters,including ASTD,wind speed,and relative humidity.
Until now,the propagation characteristics prediction model was only derived from data on the 87-km experimental link across the Qiongzhou Strait during the nighttime in September 2019.In the future,more communication links will be conducted to analyze and verify the feasibility of the method regionally.
ACKNOWLEDGEMENT
This work was supported by National Natural Science Foundation of China (No.61821001) and Science and Technology Key Project of Guangdong Province,China(2019B010157001).
- China Communications的其它文章
- Spatial Modeling and Reliability Analyzing of Reconfigurable Intelligent Surfaces-Assisted Fog-RAN with Repulsion
- An Efficient Federated Learning Framework Deployed in Resource-Constrained IoV:User Selection and Learning Time Optimization Schemes
- IoV and Blockchain-Enabled Driving Guidance Strategy in Complex Traffic Environment
- Multi-Source Underwater DOA Estimation Using PSO-BP Neural Network Based on High-Order Cumulant Optimization
- Secure Short-Packet Transmission in Uplink Massive MU-MIMO Assisted URLLC Under Imperfect CSI
- A Privacy-Preserving Federated Learning Algorithm for Intelligent Inspection in Pumped Storage Power Station

