
Constructing a CeO2/ZnxCd1-xIn2S4 S-Scheme Hollow Heterostructure for Efficient Photocatalytic H2 Evolution
2023-12-08 03:15:08XiaoyanCaiJiahaoDuGuangmingZhongYimingZhangLiangMaoZaizhuLou
物理化学学报 2023年11期
Xiaoyan Cai ,Jiahao Du ,Guangming Zhong ,Yiming Zhang ,Liang Mao ,*,Zaizhu Lou
1 School of Safety Engineering,China University of Mining and Technology,Xuzhou 221116,Jiangsu Province,China.
2 School of Materials Science and Physics,China University of Mining and Technology,Xuzhou 221116,Jiangsu Province,China.
3 Jiangsu Key Laboratory of Coal-based Greenhouse Gas Control and Utilization,China University of Mining and Technology,Xuzhou 221008,Jiangsu Province,China.
4 Guangdong Provincial Key Laboratory of Nanophotonic Manipulation,Institute of Nanophotonics,Jinan University,Guangzhou 511443,China.
Abstract: With the exhaustion of fossil energy,the energy crisis is becoming increasingly serious,which greatly hinders the sustainable development of society.Therefore,the development of new energy technologies as a substitute for non-renewable and highly polluting fossil energy is extremely urgent.The environmental benefits and high energy density of hydrogen (H2) make it an ideal clean energy source.Photocatalytic water splitting,which was first demonstrated in the pioneering work on TiO2 photoelectrodes under UV-light irradiation,has been extensively researched and has been shown to be an effective method for addressing the global energy crisis.However,most of the photocatalysts used for H2 production still suffer from low solar energy utilization and fast photogenerated charge recombination,which seriously limit their practical applications in the field of solar-tohydrogen energy conversion.Therefore,it is necessary yet greatly challenging to develop a visible-light-responsive photocatalyst with efficient photogenerated charge separation through reasonable modification strategy.Layered structured ZnIn2S4 (ZIS) is a promising photocatalyst to split water for H2 evolution owing to its suitable electronic structure,strong light absorption,chemical stability,and low toxicity.However,its low charge separation efficiency renders its photocatalytic performance unsatisfactory.Herein,to overcome this issue,a band structure regulation strategy that integrates solid solution formation with heterostructure construction was proposed.By growing ZnxCd1-xIn2S4 (ZCIS)nanosheets on the surface of CeO2 hollow spheres in situ,a novel hollow heterostructure CeO2/ZCIS with efficient charge separation was constructed as photocatalyst for H2 generation.The introduction of the Cd cation in ZIS upshifts the conduction band (CB) and valence band (VB) of ZCIS,enhancing the built-in electrical field on the interface.Those electronic band changes induce the S-scheme structure in CeO2/ZCIS,promoting charge separation for photocatalysis.Moreover,the upshift of the CB generates photoelectrons with high H2 generation ability.As a result,the optimal 1:6-CeO2/Zn0.9Cd0.1In2S4 heterostructure exhibits 4.09 mmol·g-1·h-1 H2 generation during photocatalysis,which is 6.8-,3.0-,and 2.2-fold as those of ZIS,ZCIS,and CeO2/ZIS,respectively.This work provides one efficient strategy to develop highly active S-scheme photocatalysts for hydrogen generation.
Key Words: Photocatalysis; Hydrogen generation; S-scheme heterostructure; Build-in electrical field;Charge separation
1 Introduction
With high energy density,green hydrogen (H2) energy is expected as substitute of the non-renewable and high-polluting fossil energy1–3.Among the various H2production technologies,solar-driven photocatalytic water splitting is the most attractive due to its low cost,non-polluting emissions,and non-toxicity4–6.Exploring stable and low-cost photocatalysts with high-activity is key to promote solar-driven water splitting for practical applications7–10.With the layered crystal structure of AB2X4group,the ternary metal sulfide ZnIn2S4(ZIS) with narrow band gap for strong visible light absorption and suitable band position for water splitting has been applied in photocatalytic hydrogen generation11–13.However,the poor charge carrier mobility of ZIS makes the unsatisfied photocatalytic performance,which restricts its practical application in H2production14,15.
For the sake of improving the photocatalytic activity of ZIS,Zouetal.introduced Cd cation dopants into ZIS to widen the valence band (VB) and upshift the conduction band (CB),which promoted the mobility of photogenerated holes as well as the reactivity of photogenerated electrons16.However,singlecomponent photocatalysts with visible-light absorption usually suffer from the problem of rapid charge recombination17–20.For this reason,various heterostructures by coupling two or more semiconductors with matched band structures have been developed21–25.As a commonly non-toxic semiconductor material,CeO2with a wide band gap,unique electron orbital structure,exceptional optical properties,and high storage capacity,is widely used in the field of photocatalysis26,27.In our recent study,it was found that the ZIS nanosheets and CeO2nanorods have CB and VB positions located at -0.73 and 1.67 eV,and -0.57 and 1.80 eV,respectively,and the formed ZIS/CeO2heterostructure exhibited highly efficient charge separation28.The strong internal electric field at the interface of heterostructure is expected to further promote the carrier separation29–33.Considering the adjustable band structure of ZnxCd1-xIn2S4(ZCIS) solid solution34–36,integrating ZCIS with CeO2is promising for obtaining a photocatalyst with an intensified internal electric field and desired H2evolution performance.
Besides the regulation of chemical composition,the efficient photocatalytic reaction largely depends on the rational design of catalyst structure.To improve the activity and stability of photocatalytic H2production,Louetal.synthesized a hierarchical cage-structured Co9S8/ZnIn2S4,which enhances the separation and transfer of photogenerated charges37.Hollow photocatalysts with large surface area provide abundant active sites and short carrier transport distance to promote charge separation and accelerate catalytic process.Moreover,hollow structure usually improves the utilization of sunlight by increasing the light reflection and scattering37–39.
In this work,CeO2hollow spheres were firstly prepared by using SiO2as the structural template,and then used to synthesize the hollow CeO2/ZCIS heterostructures byinsitugrowing twodimensional ZCIS nanosheets on CeO2surface.The various spectroscopy and photoelectrochemical studies were carried out to reveal the S-scheme mechanism of the charge transfer in CeO2/ZCIS heterojunction.Such an S-scheme charge transfer pathway in the hierarchical hollow photocatalyst allowed the simultaneous realization of efficient charge collection and highly reductive ability of photoelectrons for H2generation.Therefore,the 1:6-CeO2/Z0.9C0.1I2S4sample at its optimal ratio displays a H2generation rate of 4.09 mmol·g-1·h-1under visible-light,which is 6.8,3.0,and 2.2 times as those of ZIS,ZCIS,and CeO2/ZIS,respectively.
2 Experimental section
2.1 Materials
Cerium nitrate (AR),sodium hydroxide (AR),zinc chloride(AR),indium chloride (AR),cadmium chloride (AR),thioacetamide (AR),sodium sulfite (AR),ammonia (28%) and tetraethyl silicate (AR) were purchased from McLean Reagent Co.China.Sodium sulfite from Aladdin Reagent Co.,China.Anhydrous ethanol from Jiuding Reagent Co.,China.All reagents are analytically pure and do not require further purification during use.The water used during experiments was deionized water.
2.2 Sample preparation
Fig.1 illustrates the process of sample preparation.The CeO2/SiO2complex was synthesized by hydrothermal decomposition of Ce(NO3)3on the surface of SiO2microspheres(Step I).The SiO2template was removed by using NaOH aqueous solution,obtaining CeO2hollow spheres (Step II).Then the CeO2hollow spheres were dispersed into a solution containing ZnCl2,CdCl2,InCl3and thioacetamide (TAA),resulting in theinsitugrowth of ZnxCd1-xIn2S4(ZCIS)nanosheets on CeO2surface.Through a low temperature oil bath process,hierarchical hollow structured CeO2/ZCIS composite was prepared (Step III).
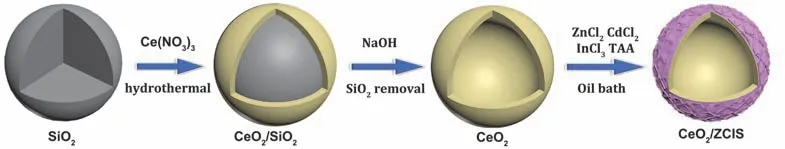
Fig.1 Schematic illustration of the formation process of the CeO2/ZCIS composite.
2.2.1 Preparation of SiO2microspheres
The mixture of 9 mL ammonia (28%),16.25 mL ethanol,and 24.75 mL deionized water was stirred and referred to as solution A.Solution B was prepared by dissolving 4.5 mL of tetraethyl silicate (TEOS) in 45.5 mL of ethanol.Then,solution B was quickly added into solution A under intense stirring.The mixture was stirred for 2 h at room temperature before the resulting precipitation was centrifuged and washed three times with ethanol.It was then dried at 60 °C for 5 h.
2.2.2 Preparation of CeO2hollow spheres
CeO2hollow spheres were fabricated according to the method reported in the literature40.A hydrothermal method was firstly employed to prepared CeO2/SiO2.0.1 g SiO2spheres were added into 40 mL water.After ultrasound for 30 min,0.3474 g Ce(NO3)3·6H2O was added.Following a 20 min stirring period,the mixture was moved to a 100 mL Teflon-lined reactor and placed in an oven at 200 °C for 24 h.After natural cooling,the precipitation was centrifuged with deionized water for 6 times and dried in the oven at 50 °C.Then the resulting CeO2/SiO2powder was heated at 450 °C for 2 h (with a heating rate of 3 °C·min-1).Afterward,the SiO2template was removed by putting CeO2/SiO2in an alkaline solution containing 6.4 g NaOH and 80 g deionized water.Finally,CeO2hollow spheres was obtained after centrifuging with water and alcohol for 6 times and drying at 50 °C for 2 h in vacuum.
2.2.3 Preparation of CeO2/ZCIS heteostructure
ZnxCd1-xIn2S4(ZCIS) nanosheets were grown on the surface of CeO2hollow spheres by a low temperature solvothermal method.First,0.0188 g CeO2was dispersed in 30 mL aqueous solution (pH = 2.5).Subsequently,0.0734 g ZnCl2,0.0110 g CdCl2,0.1326 g InCl3and 0.090 g TAA were added.After being stirred for 30 min,the mixture was placed in an oil bath at 80 °C for 2 h while being stirred.The resulting product was then centrifuged,washed six times with deionized water and alcohol,and subsequently dried under vacuum at 50 °C.The resulting sample was labeled as 1:6-CeO2/Z0.9C0.1I2S4,where the prefix represented the theoretical mass ratio of CeO2and ZCIS in the CeO2/ZCIS composite,and the subscript represented the theoretical molar ratio of Zn,Cd,In and S in the ZCIS component.A series of 1:x-CeO2/Z0.9C0.1I2S4(x= 4,6,8) and 1:6-CeO2/ZxC1-xI2S4(x= 1,0.9,0.8) composites were obtained by changing the ratio of precursor materials.
2.2.4 Preparation of ZIS and ZCIS nanosheets
0.0816 g ZnCl2,0.1326 g InCl3,and 0.090 g TAA were evenly dissolved in 30 mL aqueous solution (pH = 2.5).The mixture was then stirred in an oil bath at 80 °C for 2 h.The resulted precipitate was centrifugally washed with deionized water and alcohol for 6 times,and dried at 50 °C for 2 h in vacuum to obtain ZIS nanosheets.Z0.9C0.1I2S4nanosheets were prepared by replacing 0.0816 g ZnCl2with 0.0734 g ZnCl2and 0.0110 g CdCl2in the precursor under the same conditions.The CeO2/ZCIS and ZCIS samples used for characterization and performance testing in this work were 1:6-CeO2/Z0.9C0.1I2S4and Z0.9C0.1I2S4,respectively,unless otherwise specified.
2.3 Materials characterization
The product’s phase was analyzed using a D8 Advance X-ray diffractometer (XRD) from Bruker (Germany),with a scanning range of 2θ= 10°–80°.Morphology and microstructure were examined with a SU8220 field emission scanning electron microscope (SEM) from Hitachi (Japan) and a Tecnai G2 F20 field emission transmission electron microscope (TEM) from FEI (USA),while the proportion and distribution of elements were analyzed with the equipped X-ray energy dispersive spectrometer (EDS).The samples’ composition and chemical valence states were determined with X-ray photoelectron spectroscopy (XPS) from Thermo Fisher Company (USA).The spectral absorption and band structure of the samples were analyzed with a cary 300 ultraviolet-visible diffuse reflection spectrometer (UV-Vis DRS) from Varian (USA).The materials’free radicals were analyzed with an A300 electron paramagnetic resonance (EPR) from Bruker (Germany),using 5,5-dimethyl-1-pyrroline-N-oxide (DMPO) as the free radical trapping agent.To analyze the recombination of electron-hole pairs and the lifetime of photo-generated carriers in the samples,steady-state photoluminescence (PL) spectroscopy and time-resolved photoluminescence (TRPL) spectroscopy were used.Lastly,the electrochemical performance of the samples was analyzed with a CHI-660D electrochemical workstation from Shanghai Chenhua (China).
2.4 Photocatalytic activity measurement
To evaluate the photocatalytic activity of the sample,the amount of H2produced through water splitting under visiblelight irradiation was measured.The experimental procedure consisted of placing 10 mg of photocatalyst in a 30 mL glass tube,adding 15 mL of Na2S/NaSO3solution (0.25 mol·L-1Na2S and 0.5 mol·L-1NaSO3),and dispersing the mixture through ultrasonication for 30 s.The glass tube was then sealed with a rubber stopper and a sealing film,and purged with Ar gas for 20 min prior to illumination.The glass tube was illuminated from the side with a 300 W Xenon lamp (400 nm cut-off filter mounted on the Xenon lamp) with a light intensity of 458 mW·cm-2,and the sample was continuously stirred on the magnetic agitator.An external circulating cooling water device was used to cool the samples during the test.500 μL gas was taken from the upper space of the glass tube every 0.5 h and injected into the gas chromatography (GC-2030,Shimadzu,Japan) for analysis.By testing the H2production over the samples under 365,400,450,500,550 nm monochromatic light with light intensity of 0.11,0.19,0.24,0.37,and 0.33 mW·cm-2,respectively,the apparent quantum efficiency (AQE) was calculated using the following equation:
3 Results and discussion
3.1 Compositions and morphologies
The crystal structures of the sample were characterized by XRD.Fig.2a shows the XRD patterns of pure CeO2,Z0.9C0.1I2S4solid solution and a series of 1:x-CeO2/Z0.9C0.1I2S4(x= 4,6,8)composites.The XRD patterns of the sample match with the cubic phase of CeO2(JCPDS No.34-0394),where the peaks located at 28.4°,33.0°,47.2°,and 56.2° correspond to (111),(200),(220),and (311) planes,respectively41.The XRD pattern of Z0.9C0.1I2S4is signed to the hexagonal ZnIn2S4(JCPDS No.65-2023).The diffraction peaks at 21.2°,27.2°,47.1° and 52.0°are corresponded to (006),(102),(110) and (116) plane of ZnIn2S4,respectively42.From the XRD patterns of the three 1:x-CeO2/Z0.9C0.1I2S4samples,it is clear that CeO2/ZCIS composites have the characteristic peaks of CeO2and ZCIS.However,with the increase of ZCIS content in CeO2/ZCIS composites,the peak intensity of CeO2component decreased relatively.Fig.2b is the XRD patterns of 1:6-CeO2/ZxC1-xI2S4(x= 1,0.9,0.8)composites,showing the influence of Cd incorporating on the lattice structure of ZIS.For comparison,the XRD patterns of the prepared CeO2/ZIS are similar with CeO2/Z0.9C0.1I2S4and CeO2/Z0.8C0.2I2S4.However,the incorporation of Cd causes the{110} peak of ZIS component to shift towards the lower angle,which is caused by the larger Cd2+ion (0.97 Å) substituting for the Zn2+ion (0.74 Å) in the ZIS lattice43.
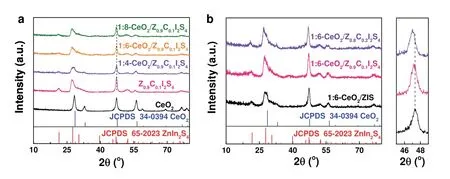
Fig.2 XRD patterns of (a) CeO2,Z0.9C0.1I2S4,and 1:x-CeO2/Z0.9C0.1I2S4 (x = 4,6,8),and (b) 1:6-CeO2/ZxC1-xI2S4 (x = 1,0.9,0.8).
SEM and TEM were used to analyze the morphologies of the samples.As shown in Fig.3a,the SiO2prepared in this study exhibits uniform microspheres with smooth surfaces and a diameter of 200 nm.After the Ce(NO3)3loading,the composited CeO2/SiO2become larger microsphere with a dimeter of 250 nm(Fig.3b).After the SiO2removal,the CeO2microspheres are obtained with tightly packed nanoparticles on rough surface(Fig.3c),and the clear hollow structure is observed in some broken CeO2microspheres.Fig.3d,e show the morphologies of CeO2/ZIS and CeO2/ZCIS samples,respectively.The CeO2hollow microspheres are completely coated by ZIS or ZCIS nanosheets,forming a hierarchical heterostructure.If the CeO2hollow microspheres are absence during synthetic process,the obtained ZIS nanosheets have a serious aggregation and larger size over 2 μm (Fig.3f).Compared to ZIS nanosheets,the ZCIS solid solution has the similar morphologies with a small size stacked lamellar-structure (Fig.3g).TEM images further demonstrate the internal hollow structure of the CeO2microspheres (Fig.3h) and the shell formed by tightly packed nanoparticles.The hollow mesoporous structure of CeO2provides ample surface area for the reaction solution and promotes rapid gas evolution.TEM image of CeO2/ZCIS (Fig.3i) shows that the ZCIS nanosheets grow on the surface of CeO2hollow microsphere,forming a hierarchical hollow heterostructures.The chemical composition and elemental distribution of CeO2/ZCIS are analyzed by EDS mapping as shown in Fig.3j.The Ce and O elements are mainly distributed on center of the heterostructure having a similar microstructure with CeO2hollow microsphere.While,other elements are mainly located on the surface of nanosheets assigned to ZCIS.
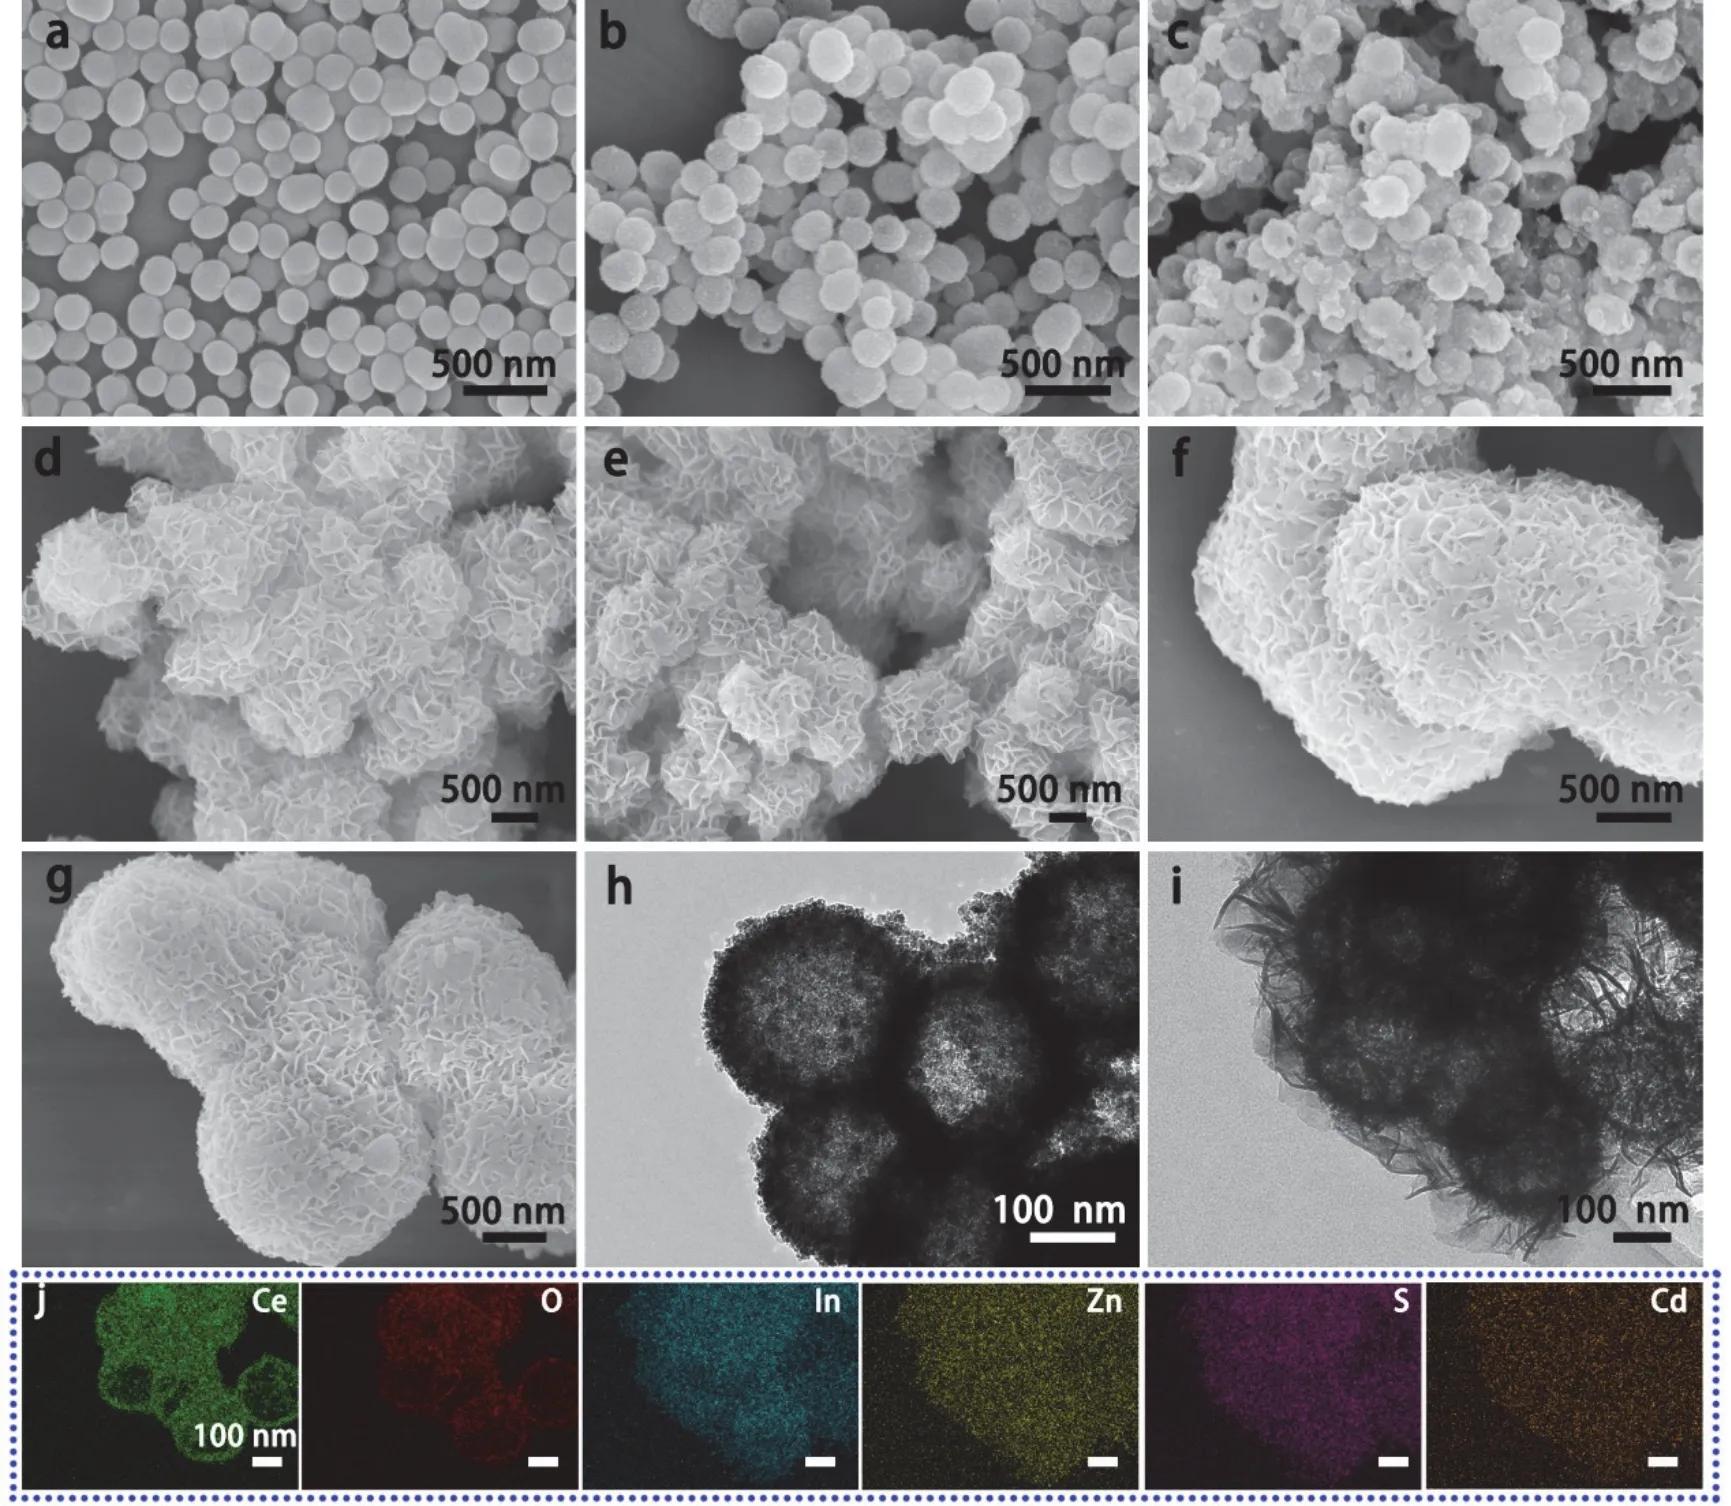
Fig.3 SEM images of (a) SiO2,(b) CeO2/SiO2,(c) CeO2,(d) CeO2/ZIS,(e) CeO2/ZCIS,(f) ZIS,(g) ZCIS.TEM images of (h) CeO2 and (i) CeO2/ZCIS.(j) EDS elemental mapping of CeO2/ZCIS.
XPS analysis was conducted to examine the elemental valence states and chemical environment of CeO2,ZCIS and CeO2/ZCIS.As illustrated in Fig.4a,the high-resolution XPS of O 1srevealed that the peaks at 531.8 and 533.1 eV corresponded to the lattice oxygen and adsorption oxygen of CeO2,respectively44.The Ce 3dspectrum can be divided into eight peaks (Fig.4b).The peaks at 900.8,907.5,916.6,882.2,888.7 and 898.2 eV are labeled as u1,u3,u4,v1,v3and v4,respectively,which can be attributed to Ce4+.And the peaks at 903.9 (u2) and 884.3 eV (v2)correspond to Ce3+45.In Fig.4c,the Zn 2pspectrum of ZCIS is comprised of two peaks at 1021.7 and 1044.8 eV,which correspond to Zn 2p3/2and Zn 2p1/2,respectively,indicating that Zn is present in the form of Zn2+46.In Fig.4d,two peaks with binding energies of 445.0 and 452.5 eV separately represent In 3d5/2and In 3d3/247.Fig.4e displays the S 2pspectrum,which can be resolved into two peaks with binding energies of 161.4 and 162.5 eV for S 2p3/2and S 2p1/2,respectively48.The Cd 3dspectrum (Fig.4f) exhibits two peaks,namely Cd 3d5/2at 404.7 eV and Cd 3d3/2at 411.4 eV,both corresponding to Cd2+49.Notably,the binding energies of Ce 3dand O 1sin CeO2/ZCIS exhibit negative shifts in comparison to those of CeO2,while the S 2pand Cd 3dpeaks in CeO2/ZCIS shift positively by 0.2–0.4 eV relative to ZCIS to balance the electron distribution within the composite.These shifts in binding energy suggest that electrons transfer from ZCIS to CeO2,leading to the negative shift of S 2pand the positive shift of O 1s.
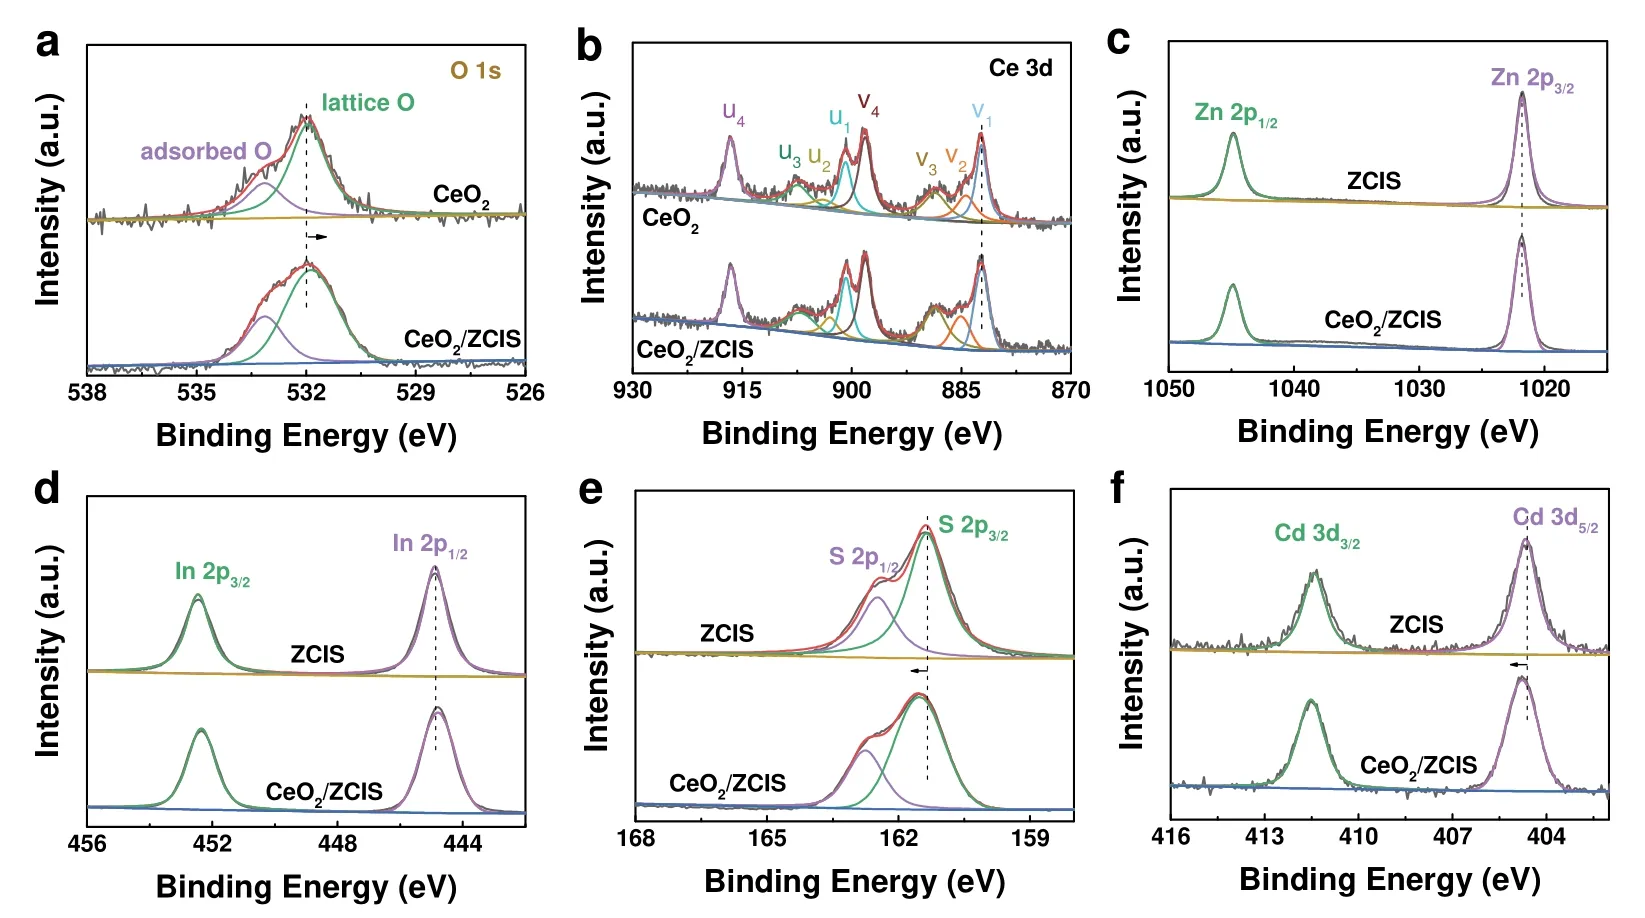
Fig.4 High resolution XPS of (a) O 1s,(b) Ce 3d,(c) Zn 2p,(d) In 3d,(e) S 2p,(f) Cd 3d of CeO2,ZCIS and CeO2/ZCIS.
3.2 Photocatalytic hydrogen generation
The photocatalytic H2generation performances of the samples were tested under visible-light (λ> 400 nm) using Na2S and Na2SO3as hole scavengers,in the absence of co-catalyst.Fig.5a shows the time-varying H2evolution over CeO2,CeO2/ZCIS,CeO2/ZIS,ZCIS and ZIS.While CeO2hollow spheres exhibit negligible photocatalytic activity,ZIS nanosheets catalyze the water splitting to produce 1.50 mmol·g-1H2under illumination for 2.5 h.The addition of Cd to ZIS lattice enhances its performance by 2.3 times.When ZIS nanosheets are incorporated onto the surface of CeO2,the resulting composite exhibits higher photocatalytic activity than ZIS and ZCIS,with a H2production rate of 4.72 mmol·g-1at 2.5 h.Among the samples,CeO2/ZCIS shows the highest performance,surpassing those of ZIS,ZCIS,and CeO2/ZIS by 6.8,3.0,and 2.2 times,respectively.This suggests that the simultaneous formation of a solid solution and construction of a hollow heterojunction more effectively improve the photocatalytic activity of ZIS.The loading amount of ZCIS on CeO2surface and the Cd content in ZCIS are optimized.As shown in Fig.5b,the H2generation rate of 1:6-CeO2/ZCIS composite is the highest,reaching 4.09 mmol·g-1·h-1.Excessive loading of ZCIS blocks the light absorption of CeO2,which in turn lowers the rate of H2generation over CeO2/ZCIS.Fig.5c is the performance comparison of a series of CeO2/ZxC1-xI2S4(x= 1,0.9,0.8)samples,in which CeO2/Z0.9C0.1I2S4exhibits the highest H2generation rate.AQE is calculated by testing the H2production over CeO2/ZIS and CeO2/ZCIS under monochromatic light irradiation,and the results are shown in Fig.5d,e.The AQE plot of CeO2/ZIS and CeO2/ZCIS is basically consistent with their respective absorption spectra,indicating that the photocatalytic activity originates from optical excitation.The optical absorption of CeO2/ZIS and CeO2/ZCIS at 400 nm is basically the same,but their respective AQEs are 5.1% and 9.5%,indicating the enhanced photon utilization of CeO2/ZCIS.The photocatalytic performance of CeO2/ZCIS was found to be superior to other metal sulfide-based photocatalysts used for H2evolution,as demonstrated by the comparison presented in Table S1.Fig.5f shows the cycling stability of CeO2/ZCIS,and there is no significant decay on H2yield after 5 cycles.For the recycled CeO2/ZCIS sample,no obvious change in the crystal structure is observed after 12.5 h of photocatalytic test (Fig.S1).Moreover,the high resolution XPS of Ce 3dof the CeO2/ZCIS recycled after photocatalytic reaction shows a basically constant Ce3+/Ce4+ratio,indicating that Ce3+and Ce4+circulation has no effect on the reaction.
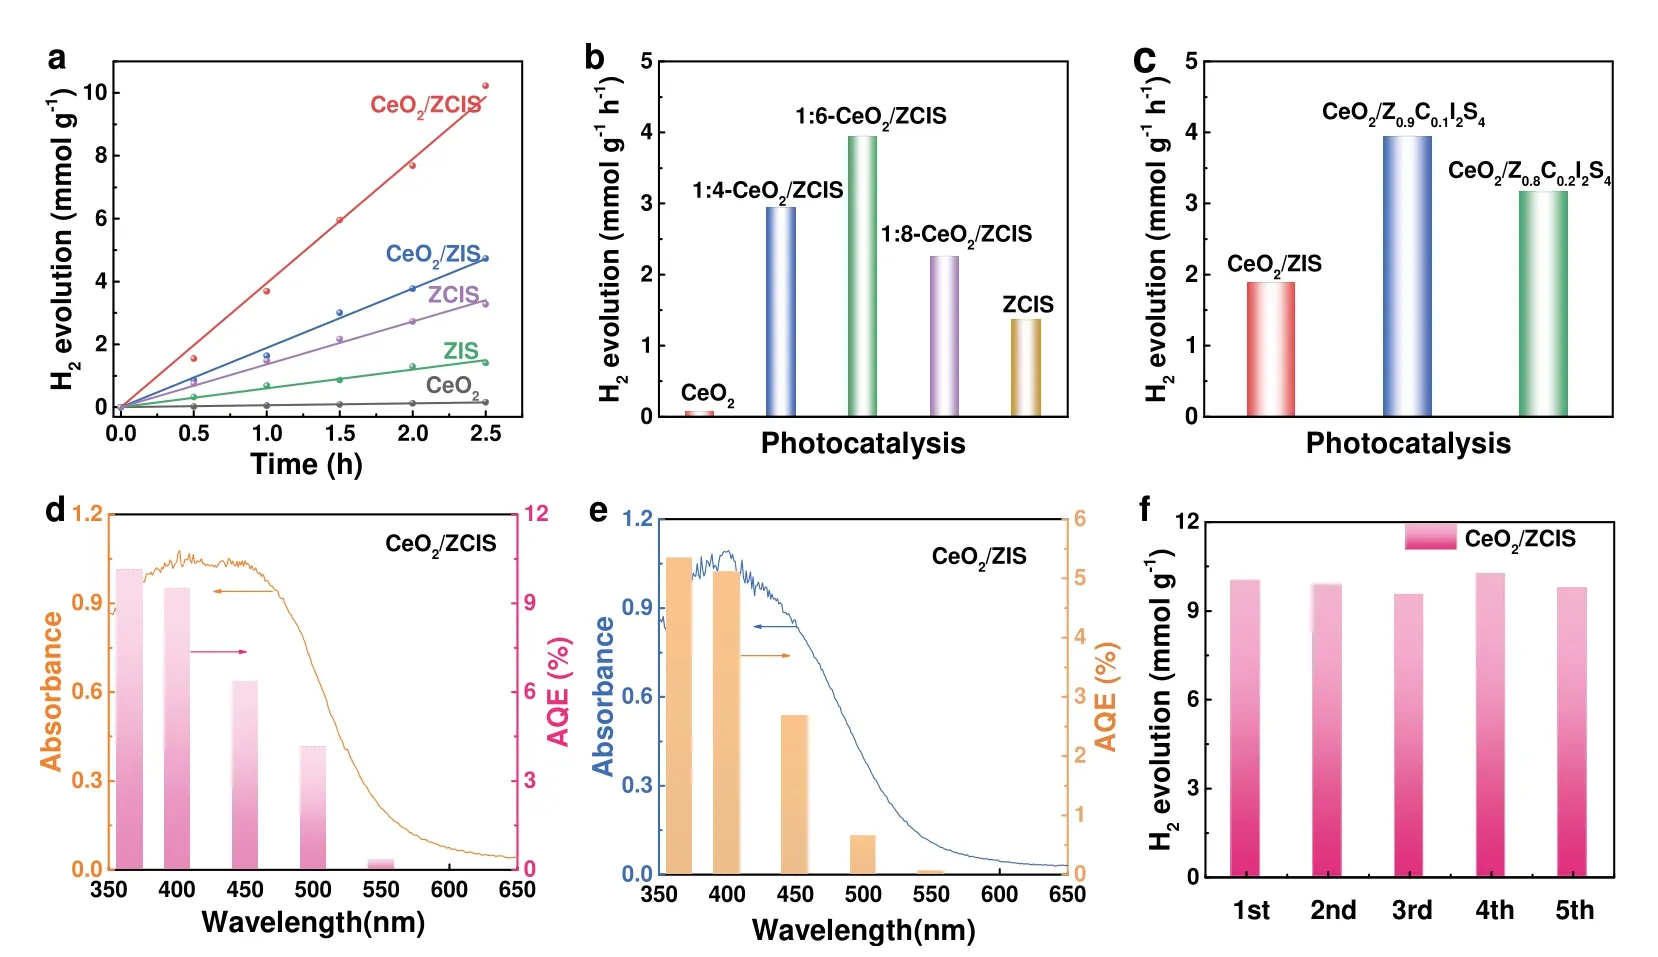
Fig.5 (a) Photocatalytic H2 evolution over different samples under visible light (λ > 400 nm).Comparison of photocatalytic H2 evolution rate of (b) 1:x-CeO2/ZCIS (x = 4,6,8) and (c) 1:6-CeO2/ZxC1-xI2S4 (x = 1,0.9,0.8) samples.AQE and UV-Vis DRS of (d) CeO2/ZIS and(e) CeO2/ZCIS.(f) Photocatalytic stability investigation of the recycled CeO2/ZCIS.
3.3 Photocatalysis mechanism
Favorable band structure covering wide optical absorption and appropriate CB and VB position is the basis of efficient photocatalysis.The optical response of ZIS and CeO2ranges from ultraviolet to visible region,with an absorption band edge about 590 and 420 nm,respectively (Fig.6a).Introducing Cd cations into ZIS results in the shift of absorption band edge to 620 nm.In our previous work,we confirmed the direct and indirect band structure of ZIS and CeO2using first-principles calculations28.Therefore,the electronic bandgaps of ZIS,ZCIS and CeO2can be derived from the Tauc curves in Fig.6b,c,which are 2.09,2.00 and 2.95 eV,respectively.The absorption spectra of CeO2/ZIS and CeO2/ZCIS cover the absorption characteristics of both components.The flat band potential (Vfb)of the samples is analyzed by Mott-Schottky (M-S)measurements,showing that theVfbof ZIS,ZCIS and CeO2are-0.52,-0.64 and -0.31 Vvs.RHE,respectively (Fig.6d).The positive slope of the M-S curves indicates that ZIS,ZCIS and CeO2are n-type semiconductors,so their respective valence band maximum (VBM) potential can be determined to be 1.47,1.26 and 2.54 Vvs.RHE.After Cd incorporating,the conduction band minimum (CBM) of ZIS nanosheet upshifts by 0.12 eV.Considering the decrease of bandgap and the upward shift of CBM,the VBM of ZCIS is calculated to be upshifted by 0.21 eV compared to ZIS.As depicted in Fig.6e,afterinsitugrowth of ZIS on CeO2surface,the Fermi level aligns to the same level(-0.42 Vvs.RHE) due to their tight connection.It can be concluded that a built-in electric field is formed at the CeO2/ZIS interface originating from the Fermi level differences between ZIS and CeO2components10,50,51.Furthermore,the upshift of the CBM enlarges the conduction band energy difference between ZCIS and CeO2,ultimately resulting in an upshift of the Fermi level (-0.53 Vvs.RHE) (Fig.6f).As a result,the built-in electric field on CeO2/ZCIS interface enhances,which allows a faster electrons migration from ZCIS to CeO2.
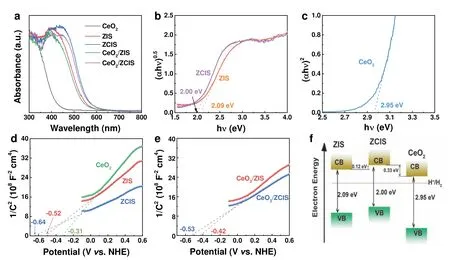
Fig.6 (a) UV-Vis DRS spectra of different samples.Band gap energies of (b) ZIS and ZCIS,and (c) CeO2.Mott-Schottky plots of(d) ZIS,ZCIS and CeO2,and (e) CeO2/ZIS and CeO2/ZCIS.(f) Schematic diagram of the band alignment of ZIS,ZCIS and CeO2.
The photoelectrochemical (PEC) and electrochemical measurements confirmed the efficient charge carrier transfer process in the CeO2/ZCIS composite.The time-varying photocurrents of the various electrodes,as presented in Fig.7a,exhibited the same order as the observed photocatalytic performance in Fig.5a.The CeO2/ZCIS electrode demonstrated the highest photocurrent,indicating the effective separation of charges at the interface.Fig.7b illustrates the electrochemical impedance spectroscopy (EIS) of different electrodes,where the arc radius of the EIS Nerst curve directly corresponds to the electrode resistance.The smaller the arc radius of the EIS Nerst curve,the lower the resistance of the electrode52.Thus,the charge separation efficiency of CeO2/ZCIS is higher compared to CeO2,ZIS,and ZCIS,resulting in efficient separation and transfer of photogenerated electrons and holes to the electrode surface.Fig.7c shows steady-state PL spectra of ZIS,ZCIS,CeO2and CeO2/ZCIS samples,where the emission peak of ZIS,ZCIS and CeO2is roughly located at 580,590,and 550 nm,respectively.The luminescence intensity of ZCIS decreases compared with that of ZIS,indicating that the introduction of Cd cation partly promotes the charge separation.The emission of CeO2/ZCIS is further weakened because of the luminescence quenching originated from charge transfer between ZCIS and CeO2.The carrier lifetime of the materials is characterized using TRPL spectra,and the fitted results are presented in Fig.7d and Table 1.The average lifetime of photogenerated carriers in CeO2/ZCIS (163 ns) is longer compared to CeO2(97 ns),ZCIS(139 ns),and ZIS (124 ns).These results indicate that the formation of a solid solution and construction of a hollow heterostructure effectively prolong the carrier lifetime53.
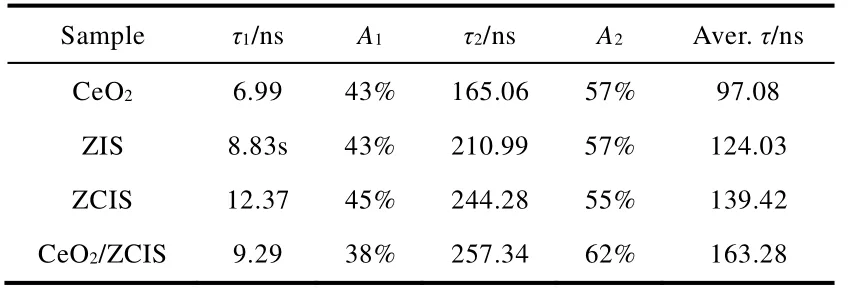
Table 1 Lifetime (τi) and amplitudes (Ai) of the transient fluorescence decays of different samples.
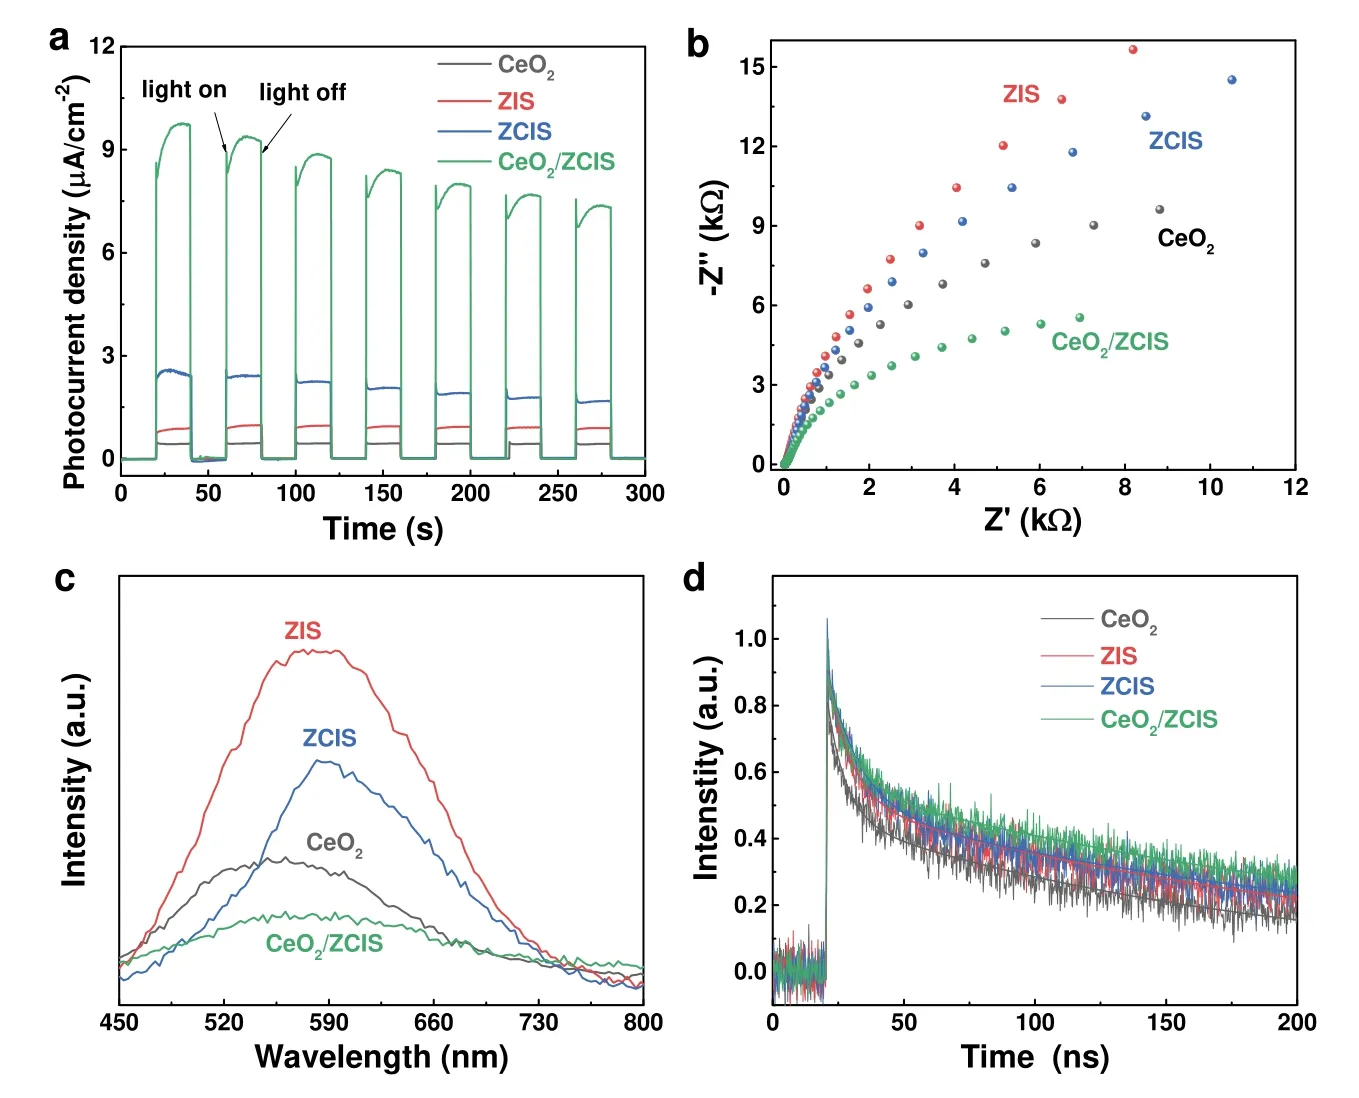
Fig.7 (a) I–t plots and (b) EIS Nernst curves of different photoelectrodes.(c) PL and (d) TRPL spectra of different samples.
EPR was performed to detect the superoxide radical (·O2-)generated by photogenerated electrons and the hydroxyl radical(·OH) generated by photogenerated holes during the photocatalysis.In aqueous solution,DMPO (5,5-dimethyl-1-pyrroline-N-oxide) was employed for the trapping of ·O2-and ·OH,resulting in the formation of DMPO-·O2-and DMPO-·OH54.As shown in Fig.8a,the CeO2sample shows the weakest DMPO-·O2-EPR signal.The EPR signal of ZCIS is slightly stronger compared to that of CeO2,which can be attributed to the more negative conduction band minimum(CBM) of ZCIS.CeO2/ZCIS composite exhibits the strongest DMPO-·O2-EPR signal,suggesting the substantively enhanced photocatalytic reductive activity.All samples display DMPO-·OH signals in the EPR spectrum (Fig.8b),in which the signal intensity of CeO2is significantly higher than that of ZCIS,because the VBM of CeO2is more positive than that of ZCIS.The DMPO-·OH signal intensity of CeO2/ZCIS is much higher than that of CeO2.These results suggest that the photoinduced holes in the CeO2/ZCIS composite retain their oxidative ability,indicating no reduction during the formation of the heterojunction.Moreover,the experimental observations suggest that the charge transfer mechanism in the composite follows the S-scheme rather than Type-II,where the photogenerated electrons accumulate in the ZCIS component due to its negative CBM potential,while the holes remain in the CeO2component with a positive VBM position55.
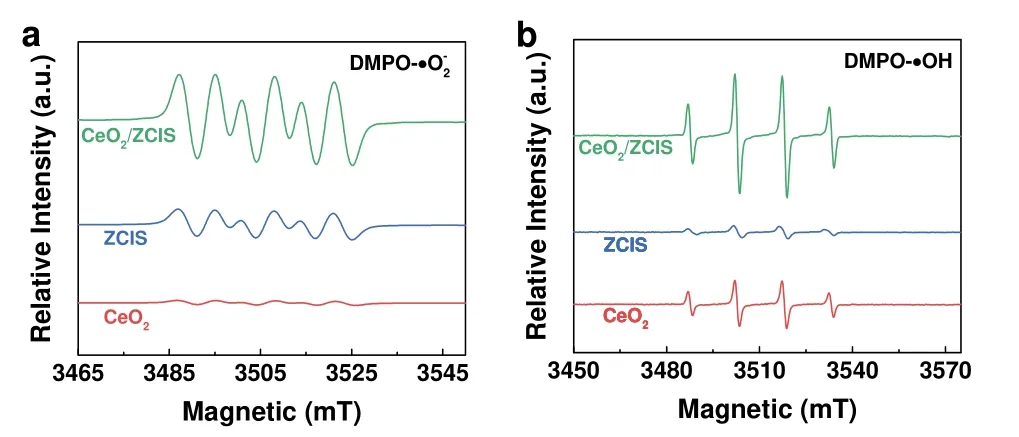
Fig.8 EPR signals of (a) DMPO-·O2- and (b) DMPO-·OH adducts in methanol over CeO2,ZCIS and CeO2/ZCIS under illumination for 2 min.
Building upon the experimental findings and analyses described above,a charge separation and transfer mechanism for the CeO2/ZCIS heterojunction is proposed,as illustrated in Fig.9.CeO2can be classified as an oxidative photocatalyst according to its band structure,where photogenerated holes are active and photogenerated electrons are “useless”.In contrast,ZCIS typically acts as a reductive photocatalyst,with higher CB and VB positions and a smaller hydrogen evolution reaction (HER)barrier relative to CeO2(Fig.9a).With the intimate contact between ZCIS and CeO2,free electrons in ZCIS spontaneously transfer to CeO2across their interface (Fig.9b).As a result,ZCIS in the interface region obtains a positive charge as it loses electrons,while CeO2acquires a negative charge due to electron accumulation,leading to the formation of a built-in electric field from ZCIS towards CeO2.Because of the electron redistribution,the band edges of ZCIS and CeO2will bend at their interface.Subsequently,the Fermi levels of CeO2and ZCIS are slowly aligned to the same level due to their Fermi level difference (Fig.9c),followed by the bending upward and downward of the band edges of ZIS and CeO2,respectively.This phenomenon can be likened to the flow of water where it goes down,resulting in the recombination of photogenerated electrons in the conduction band (CB) of CeO2with photogenerated holes in the valence band (VB) of ZIS.When exposed to light,the highly reductive photoelectrons and oxidative photoholes remain in the CB of ZIS and the VB of CeO2for reduction and oxidation reactions,respectively,while the inefficient charge carriers recombine at the interface.Therefore,such an S-scheme heterostructure not only accelerates charge separation in space,but also preserves the strong reducibility of CeO2/ZCIS,which is favorable for photocatalytic H2production.It is worth mentioning that the hierarchical hollow structure constructed in the CeO2/ZCIS heterojunction shortens the bulk-surface distance,which not only speeds up the separation of photogenerated carriers but also provides a large surface area and abundant active sites.Furthermore,the creation of the ZCIS solid solution elevates both the conduction band minimum (CBM) and valence band maximum (VBM) of ZIS.This enhancement boosts the capacity of the conduction band electrons in ZCIS for reduction and increases the Fermi level difference between ZCIS and CeO2.Consequently,a greater number of free electrons can be transmitted from ZCIS to CeO2,producing a more robust builtin electric field and achieving more effective charge separation.Thus,the photocatalytic performance of CeO2/ZCIS is significantly enhanced.

Fig.9 The S-scheme charge transfer route in CeO2/ZCIS heterojunction: (a) before contact,(b) after contact,and (c) under light irradiation.
4 Conclusions
S-scheme heterostructured CeO2/ZCIS photocatalyst was constructed byinsitugrowth of ZCIS nanosheets on the surface of CeO2hollow spheres.CeO2/ZCIS was subjected to phase structure,morphology,and composition analysis using XRD,TEM,and XPS,respectively.The photocatalytic performance of the composite was assessed based on its ability to split water into H2under visible light.Notably,in the absence of a co-catalyst,CeO2/ZCIS exhibited the highest photocatalytic H2evolution rate of 4.09 mmol·g-1·h-1compared to CeO2/ZIS,ZIS,and ZCIS.The photogenerated charge transfer kinetics in CeO2/ZCIS were studied through PL,TRPL and PEC measurements,showing that the band structure regulation strategy based on solid solution formation and hollow heterostructure construction was beneficial to the charge separation.EPR results showed that the band alignment in CeO2/ZCIS heterojunction is conducive to the establishment of S-scheme charge transfer pathway.The inclusion of Cd cations in ZIS resulted in an upward shift of both the VB and CB,thereby increasing the Fermi level difference between ZCIS and CeO2.Coupling ZCIS with CeO2accelerated the free electrons transfer to facilitate an enhanced build-in electric field at their interface.The synergistic effect of these two factors facilitated the effective separation of photogenerated electrons and holes,augmented the redox capacity of charge carriers,and consequently led to a substantial enhancement in the photocatalytic performance of CeO2/ZCIS.
Supporting Information: available free of chargeviathe internet at http://www.whxb.pku.edu.cn.

- 物理化学学报的其它文章
- 欢迎订阅《大学化学》
- 欢迎订阅《物理化学学报》
- Construction of Z-Scheme MnO2/BiOBr Heterojunction for Photocatalytic Ciprofloxacin Removal and CO2 Reduction
- Holey Graphene for Sodium-Ion Battery Anode Material
- Ir Single Atoms and Clusters Supported on α-MoC as Catalysts for Efficient Hydrogenation of CO2 to CO
- Methylene Blue Incorporated Donor-Acceptor g-C3N4 Nanosheet Photocatalyst for H2 Production