Data analysis of HF surface wave radar in Zhoushan sea area
LI Cheng,YANG Yang*,DING Feng,SHI Xiaoxiao,ZHENG Bing,YIN Jiatong
1.National Marine Data and Information Service,Tianjin 300171,China;
2.The Agricultural Bank of China,Tianjin 300202,China
Abstract: Multi-frequency high frequency radar with small circular array was deployed in Zhujiajian and Shengshan to detect the winds, waves, and currents in the overlapping area operationally in 2007. No. 1509 typhoon Chan-hom landed in the coastal areas of Jujiajian,and then moved north by east,passing the HFSWR detection area.This paper compared the HFSWR observed data to anchoredbuoy observed data and ASCAT satellite remote sensing large area wind data respectively. The results of comparison indicated that HFSWR basically reflected the real distribution of wind and current of Zhoushan area during typhoon Chan-hom, showing the HFSWR is qualified to detect the winds and currents under complex marine conditions.
Keywords:HF surface wave radar, typhoon,satellite remote sensing,wind
1 Introduction
High frequency surface wave radar[1]makes use of the specialty that vertical polarized high frequency electromagnetic wave has a lesser attenuation when spread in ocean surface to detect sea surface dynamic parameters,such as winds and currents,and low velocity moving objects at sea beyond visual range[2]. In contrast to traditional marine detection equipment, HFSWR has the advantage of wide coverage, good real-time character, all-weather and cheap to operate. HFSWR works at different frequency simultaneously, which greatly increase the sea surface dynamic parameters of one echo and has better inversion results, give consideration to long ranging and high detection accuracy. In addition, variant frequency radar has a strong self-correcting capability,anti-electromagnetic interference,and more stable via data fusion[3].
No. 1509 typhoon Chan-hom, which reached super typhoon grade, was formed at 8 p.m on 30 June, 2015, and then moved northwestward. It landed in Zhujiajian Town,Zhoushan City, Zhejiang Province at about 16:40, 11 June, and moved north by east after its landing, passing by Yellow Sea and to close the Korean Peninsula, with its intensity decreasing. In this case, the typhoon center passed by detection area, continuous observation data under extreme sea environment was obtained by the radar. Part of the observation data is displayed in this paper, comparison and analysis of radar observation data to buoy observation data and the first Advanced Scatterometer (ASCAT) satellite remote sensing are carried out to analyze the accuracy of detected hydrologic parameters and evaluate the capability of the radar.
2 Data comparison with buoy data
The small array high frequency conversion radar is formed by two intermediate range high frequency radars, located at Sitia(122.4275º E, 29.8931º N) and Shenshan(122.8358º E, 30.7019º N) respectively, with a distance of about 100 km. The radiation angle of each radar is 90°, as the result of terrain limitation. The radar, with a measuring range of 200km and 0.05°(longitudinal and latitudinal), covers the area south by east to Zhoushan Islands and sweeps once per 10 mins.A 3-meter integrated anchoredbuoy, 30 km from Shengshan radar station, was placed in the detection area to detect winds, currents,and waves for three month comparing observation. Fig. 1 shows the locations of radar,buoy and track of typhoon Chan-hom.

Fig.1 Locations of radar,buoy and track of typhoon Chan-hom
An acoustic Doppler current profiles is installed beneath the buoy to observe current profiles, and the 3.1 m depth current data is compared with radar observation data for a tidal period of 25 h. Fig. 2 shows the comparison results of radar radial flow to lytic radial current from ADCP. There is a good consistency between the radar radial currents and ADCP radial currents, showing that the radar observation accuracy is qualified. The comparison results of Shengshan radar station is better than that of Zhujiajian Station,because the buoy is nearer with Shengshan station, and the normal angle is smaller. So you can see that the closer distance from radar,the better the quality of the data, so does the normal angle[4].The comparison results show that the radar can reflect the real marine dynamics and all of the mean absolute error, root-mean-square error, and coefficient of association are in reasonable range(Tab.1). Fig.3 is the comparison result between radar synthetic vector currents and ADCP data. The results show that both the velocity and direction of the currents are of good consistency.The comparison results of flow direction show that the currents are reciprocating,conforms with the characteristic of local flow field.

Tab.1 Radial flow comparison results

Fig.1 Radial flow comparison

Fig.2 Vector flow comparison
Wind measuring transducer(YOUNG 05103)is installed on the top of buoy,and starts observe at whole point with a frequency of half-hour.The transducer collects data every 3 s as the instantaneous wind velocity and direction for 10 mins, and then the mean velocity and direction of the 10 minutes are calculated as the mean velocity and direction at the end of the 10 minutes[5].The comparison time of data is from 1:30,16 June to 23:30 11 August.The actual sample number of radar data is 8 041, 98.4% for the obtain rate of data,although it should be 8 170.
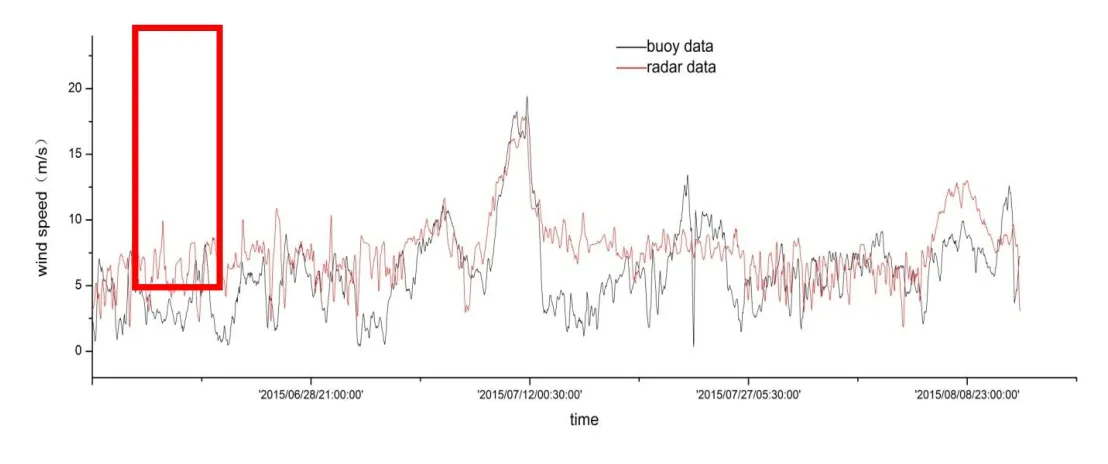
Fig. 4 shows the comparison results for radar observation wind data with buoy observation wind data. The results show that the radar obtained the complete records of wind velocity variation trend during the time that typhoon passing the detection area,especially the wind increase and decrease process from 7:00,9 July to 2:30 12,July 2015.Among the detection time series, the maximum observation wind velocity is 18.5 m/s,which occurs not much during the detection time series, so the root-mean-square error of 3.26 m/s basically meets the demand of radar. The error indicates the radar has a good capability of wind detection to a certain degree.

Fig.4 Wind speed comparison
Fig. 5 shows the comparison results for wind direction.The results indicates that the radar observation wind direction has good coherence to buoy data, especially that the radar data better reflects all the changing process of sea surface direction during the landing of typhoon.

Fig.5 Wind direction comparison
The radar of 7.5~8.5M frequency band is deemed to detect wind field above 5 m/s,according to radar detection theory[6]. So the wind data over 5m/s is filtered out to be compared with buoy data. The results(Fig. 6) indicates the root-mean-square error is smaller than all the data, showing that the greater the wind speed is , the better radar detection capability.The wind direction is mainly northbound before the arrival of typhoon,while it turn to northwest from west when typhoon passing by, as the buoy was on the eastern way of typhoon. The wind direction observed at the buoy position turned to southeast along with the typhoon heading further north. The observed wind direction is a well matched with the wind shift characteristics of typhoon in northern hemisphere.
In Fig.6,radar observed wind direction changes lags behind the buoy observed wind direction changes, because the buoy directly obtain observed data via transducer, while radar needs to invert ocean scattering echo,which cost some time,to obtain wind direction data.

Fig.6 Wind speed comparison(when wind speed greater than 5m/s)
Overall, radar observed wind speed is greater than buoy observed wind speed, the mean absolute error, root-mean-square error radar are in reasonable range(Tab. 2). Also the radar can basically reflect the real wind change process and can meet the performance requirements.
3 ASCAT satellite wind data comparison
More wind data comparison between radar and satellite is necessary,since the fixed point observation is limited by its small coverage and low spatial resolution.
The first Advanced Scatterometer(ASCAT) was launched on the EUMETSAT MetOp-A satellite in October 2006. It became fully operational in May 2007 and continues to operate today. Scatterometers are essentially radars that transmit microwave pulses down to the Earth's surface and then measure the power that is returned back to the instrument[7]. This "backscattered" power is related to surface roughness. For water surfaces, the surface roughness is highly correlated with the near-surface wind speed and direction. Hence, wind speed and direction are retrieved from measurements of the scatterometer's backscattered power.Fig. 7 and Fig. 8 show the large area wind distribution inverted by radar and ASCAT satellite wind data.As can be seen from the charts,radar inverted wind field agrees with ASCAT satellite wind data basically, mirrors the wind field distribution during the typhoon, indicates that the HFSWR is qualified to detect the winds under complex marine conditions and extraordinary weather disasters.

Fig.7 Wind distribution observed by radar

Fig.8 ASCAT wind distribution 20150711-20:40(NOAA/NMSDIS/Center for Satellite Applications and Research)
4 Conclusion
After Winds and currents data obtained by HFSWR during typhoon Chan-hom are analyzed in this paper. In total, HFSWR is qualified to observe winds and currents by the comparison with buoy observed data and ASCAT satellite wind data,proving that radar can detect the winds under complex marine conditions and extraordinary weather disasters.
Three methods of marine surveys are compared in this paper, radar has its advantage over fixed buoy and satellite. Buoy observation is for fixed point, and, cannot meet the demands of mesoscale to small scale marine observation,because it is limited by its small range and weak resistance to destroy. Satellite remote sensing data has the advantage of high sampling rate and wide coverage[8],but there are drawbacks,such as it cannot detect for a continuous long time in a particular area and data loss exists, as a result of the limitation of satellite orbit and period.In addition,satellite observed wind speed is valid only if the speed is less than 24 m/s,or its accuracy decreases when the typhoon is strong enough. High frequency surface wave radar is able to do large area, real-time,long-term marine dynamic parameters detection, it is the foundational tool of realizing marine real-time monitoring plane, can make up the deficiency of the conventional marine monitoring of China, improve abilities of marine environment real-time monitor in China Sea region.
 Marine Science Bulletin2023年1期
- Marine Science Bulletin的其它文章
- Characteristics of storm surge disasters along Fujian coast in recent 10 years
- Leveraging open source software and programming best practices for sustainable web applications in support of marine data sharing-BCO-DMO case
- Methods and empirical research on Chinese sea area resource assets value accounting
- Design and development of international buoy data operational processing system
- Isolation and purification of diketopiperazines with antialgal activity from marine macroalgae
- Priority conservation pattern and gaps of Guangxi sea area based on systematic conservation planning
