
Short-term tunnel-settlement prediction based on Bayesian wavelet: a probability analysis method
2023-11-18 08:43YangDINGXiaoweiYEZhiDINGGangWEIYunliangCUIZhenHANTaoJIN
Yang DING, Xiaowei YE, Zhi DING, Gang WEI, Yunliang CUI, Zhen HAN, Tao JIN
Research Article
Short-term tunnel-settlement prediction based on Bayesian wavelet: a probability analysis method

1Key Laboratory of Safe Construction and Intelligent Maintenance for Urban Shield Tunnels of Zhejiang Province, Hangzhou City University, Hangzhou 310015, China2Zhejiang Engineering Research Center of Intelligent Urban Infrastructure, Hangzhou City University, Hangzhou 310015, China3Department of Civil Engineering, Hangzhou City University, Hangzhou 310015, China4Department of Civil Engineering, Zhejiang University, Hangzhou 310058, China5Nanjing Metro Operation Co., Ltd., Nanjing 210012, China
As urbanization accelerates, the metro has become an important means of transportation. Considering the safety problems caused by metro construction, ground settlement needs to be monitored and predicted regularly, especially when a new metro line crosses an existing one. In this paper, we propose a settlement-probability prediction model with a Bayesian emulator (BE) based on the Gaussian prior (GP), that is, a GPBE. In addition, considering the distortion characteristics of monitoring data, the data is denoised using wavelet decomposition (WD), so the final prediction model is WD-GPBE. In particular, the effects of different prediction ratios and moving windows on prediction performance are explored, and the optimal number of moving windows is determined. In addition, the predicted value for GPBE based on the original data is compared with the predicted value for WD-GPBE based on the denoised data. One year of settlement-monitoring data collected by a structural health monitoring (SHM) system installed on the Nanjing Metro is used to demonstrate the effectiveness of WD-GPBE and GPBE for predicting settlement.
Metro construction; Settlement probability prediction; Structural health monitoring (SHM); Wavelet denoising; Gaussian prior (GP); Bayesian emulator (BE)
1 Introduction
Metro is an important part of urban rail transit (Cheng et al., 2020; Qu et al., 2023). In recent years, it has become the trend in urban development, and is an effective way to solve urban traffic congestion, save energy, and reduce pollution. However, the ground settlement caused by its construction process is an urgent problem to be solved (Kong et al., 2020; Liang et al., 2022). For example, on Mar. 28, 2007, construction of Beijing Metro Line 10 resulted in the collapse of the project. On July 1, 2003, construction of Shanghai Metro Line 4 caused a high-rise building to collapse. The sand layer of Qingdao Metro Line 2 collapsed on Apr. 13, 2018 (Wu et al., 2018). Sysyn et al. (2021b) studied the mechanism of sleeper–ballast dynamic impact in the void zone. The results of experimental in situ measurements of rail deflections showed significant impact accelerations in the zone even for lightweight, slow vehicles. Furthermore, the group presented theoretical and experimental studies directed at the development of methods for sleeper-support identification (Sysyn et al., 2020a). Among other approaches, they used track-side and on-board monitoring methods to avoid or delay the development of local instabilities such as ballast breakdown, white spots, and subgrade defects. For example, they used high-speed video-recording and digital-imaging correlation methods to measure dynamic rail displacements (Sysyn et al., 2021a). In addition, they proposed a practical method of void parameter quantification (Sysyn et al., 2020b). Obviously, irregular rates of settlement will lead to an increase in maintenance costs, thereby affecting the reliability and availability of transportation. Therefore, it is necessary to conduct long-term monitoring of settlement and predict it based on massive data to avoid potential accidents.
At present, structural health monitoring (SHM) systems are mainly used for real-time monitoring of settlement; these include level gauges, strain gauges, and other sensors that can obtain real data (Ng et al., 2013; Gómez et al., 2020). For settlement prediction, theoretical analysis methods and machine learning methods are used (Samui, 2008; Yao et al., 2018; Li et al., 2021). For example, Mu et al. (2021) used the numerical model to simulate and predict the tunnel-lining deformation of Foshan Metro Line 2, and compared it with the monitoring data. Qu et al. (2021) combined the measured deformation data with the circular sliding theory to study the deformation based on the limit equilibrium method. Xiang et al. (2008) estimated the possible additional settlement of pile foundation using empirical and theoretical analysis and numerical simulation of the construction process.
Obviously, the expressions of theoretical prediction models are complex and difficult to solve. In addition, a large number of soil parameters are required, which increases the uncertainty of the predicted value (Liu et al., 2022; Wang et al., 2022; Ding et al., 2023e, 2023f). In contrast, the settlement-prediction model based on machine learning algorithms only requires settlement data, that is, the machine-learning algorithm can fully mine the information from the data and then predict the next settlement value (Gong et al., 2014; Li et al., 2019; Ye et al., 2019, 2020; Ding et al., 2023c). Machine-learning prediction models are primarily divided into two categories: deterministic prediction and uncertain prediction (Chitsazan et al., 2015; Chen et al., 2019; Law et al., 2020). For deterministic methods, the predicted settlement is a definite value, while for the uncertain method, it is an interval value. For example, Ji et al. (2014) proposed a time-series method based on least square support vector regression (LSSVR) to predict dynamic lateral deformation and surface subsidence of support structures in deep foundation pit engineering. Wang et al. (2013) used the smooth correlation vector machine with wavelet kernel to study how the land subsidence caused by tunnel excavation develops. Shahin et al. (2005) presented the uncertainties associated with settlement prediction and combined Monte Carlo simulations with deterministic neural network models to obtain possible distributions of predicted settlements.
The SHM system faces two major difficulties during operation, namely that it powers off, which leads to data loss, and it is subjected to external interference, which leads to data distortion (Farrar et al., 2006). Therefore, it is necessary to reduce noise and supplement monitoring subsidence data. Tay (2021) developed a recursive graph median filter that can be highly localized and implemented through distributed processing. Huang et al. (2019) proposed a new approach that combines displacement entropy and spectral substitution with integrated empirical mode decomposition (EMD). Jiang et al. (2007) developed a Bayesian discrete wavelet packet transform denoising method and studied the influence of noise in measured data on structural system identification. Zhang et al. (2017) proposed a new hybrid approach that integrates wavelet packet transform and an LSSVM to improve the accuracy and reliability of daily tuning-induced land-settlement estimates. Ding et al. (2011) established a stochastic model and regarded the settlement data as a time series and the measurement error as a stable and normally distributed random process.
In this study, a settlement-probability prediction model is established with a Bayesian emulator (BE) based on the Gaussian prior (GP), that is, a GPBE. Specifically, the BE probability prediction model is derived based on the Bayesian theorem and GP. The original settlement-monitoring data are denoised based on wavelet decomposition (WD), and thus the final model is WD-GPBE. The application of GPBE and WD-GPBE models of settlement is verified based on SHM data collected from the Nanjing Metro.
2 Methodology
2.1 Wavelet decomposition method
In general, monitoring sequence data has waveform characteristics, while real-time sequence data has repeatability characteristics (Sandham et al., 1998). Therefore, sequence data can be represented as an infinite waveform function (He et al., 2010). The WD method decomposes monitoring data step by step by way of high and low frequencies, that is, it decomposes time-series data by wavelet function (Wang and van der Schaar, 2006):
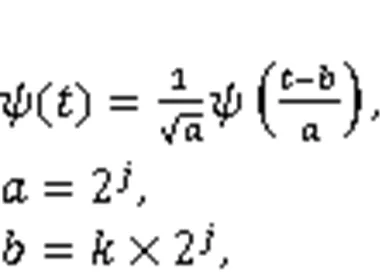
whereis the time,is the scale factor,is the translation factor,is the scale coefficient, andis the translation coefficient.
By setting the thresholdfor the above wavelet coefficients, the high-frequency data in the monitoring data can be filtered out; the noise information contained in the wavelet function which surpasses the threshold is completely eliminated (Hashemi and Beheshti, 2014). Nowadays, the Bayes Shrink threshold-estimation method is used to determine the threshold (Sendur and Selesnick, 2002). With this method, the wavelet function is modeled based on the statistical characteristics, and then the thresholdis obtained according to Bayesian estimation (Hashemi and Beheshti, 2010):

wherenis the standard deviation of noise, andwis the standard deviation of the initial wavelet function.
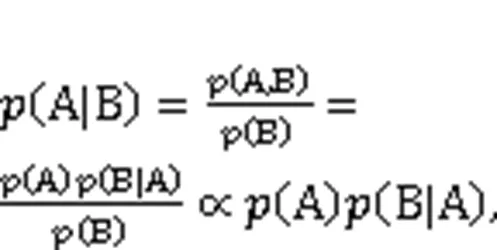
2.2 Bayesian emulator
The BE is a probability model based on Bayesian theory, which can be expressed by
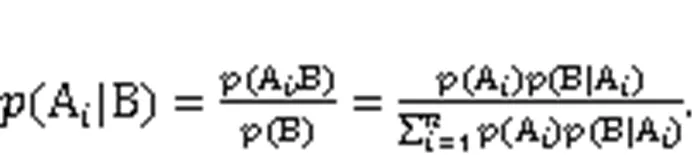
Furthermore, when there arerandom events, that is, A1, A2, …, A, then
2.3 Gaussian prior

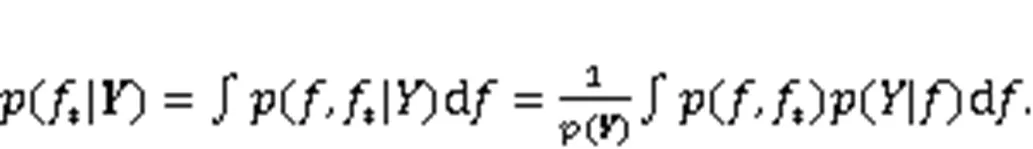
When all parameters in Eq. (5) can be expressed by Gaussian distribution, the posterior distribution of prediction output can also be expressed by Gaussian distribution, that is, by a GPBE prediction model (Ye et al., 2021; Ding et al., 2023b).
In addition, it can be seen from Eq. (6) that determination of the covariance function is the key to calculating the predicted value. Possible approaches include the squared-exponential (SE) method, Matern (MA) covariance function, and periodic (PE) covariance function. Here, we select SE covariance function to derive the mean and variance of the predicted value, that is,
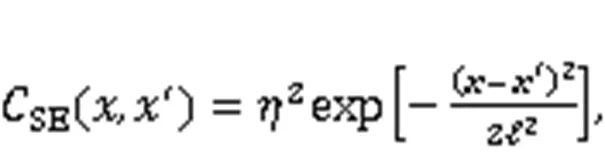
The SE covariance function is clearly smooth, that is, with continuous variableinput, the output curve is very smooth, without singular characteristics. Therefore, when the original data is processed by the WD method, it can be perfectly combined with the GPBE.
3 Illustrative application: Zhongsheng Station of Nanjing Metro
Tunnel-settlement monitoring is a necessary method of understanding and controlling changes in tunnel structure, finding dysfunction in time, and judging the safety risks. During operation, due to the reciprocating movement of subway trains, dynamic fatigue load will form, leading to settlement of the tunnel. Therefore, real-time monitoring of settlement is needed. During the maintenance phase, when the settlement value returns to the safe range after reinforcement measures, maintenance can be stopped and the tunnel can continue to operate. The early warning index of subsidence is formulated according to the technical specification for safety protection of urban rail transit structure (MOHURD, 2013) and monitoring regulation of urban rail transit engineering of Jiangsu Province of China (Jiangsu Provincial Department of Housing and Urban Rural Development, 2015). Once the early warning value is exceeded, the tunnel needs to be reinforced and maintained. Therefore, sedimentation can be used as a preventive index during operation. In the maintenance phase, it can be used as a target indicator.
The Zhongsheng Station on the new Nanjing Metro Line 7, which is planned to open to traffic in 2023, crosses the existing Zhongsheng Station of Metro Line 10, with a station scale of 270 m×21.9 m×21.1 m (Ding et al., 2023d). The Zhongsheng Station, on the existing Metro Line 10, was completed in 2004, and the initial value monitoring during the operation period was completed in Aug. 2005. The SHM system at Zhongsheng Station includes 31 settlement-monitoring points before the construction of Metro Line 7 (J1–J31) and four settlement-monitoring points after the construction of Metro Line 7 (M1–M4) (Ding et al., 2023b). The reinforced and existing columns and monitoring system at Zhongsheng Station are shown in Fig. 1.
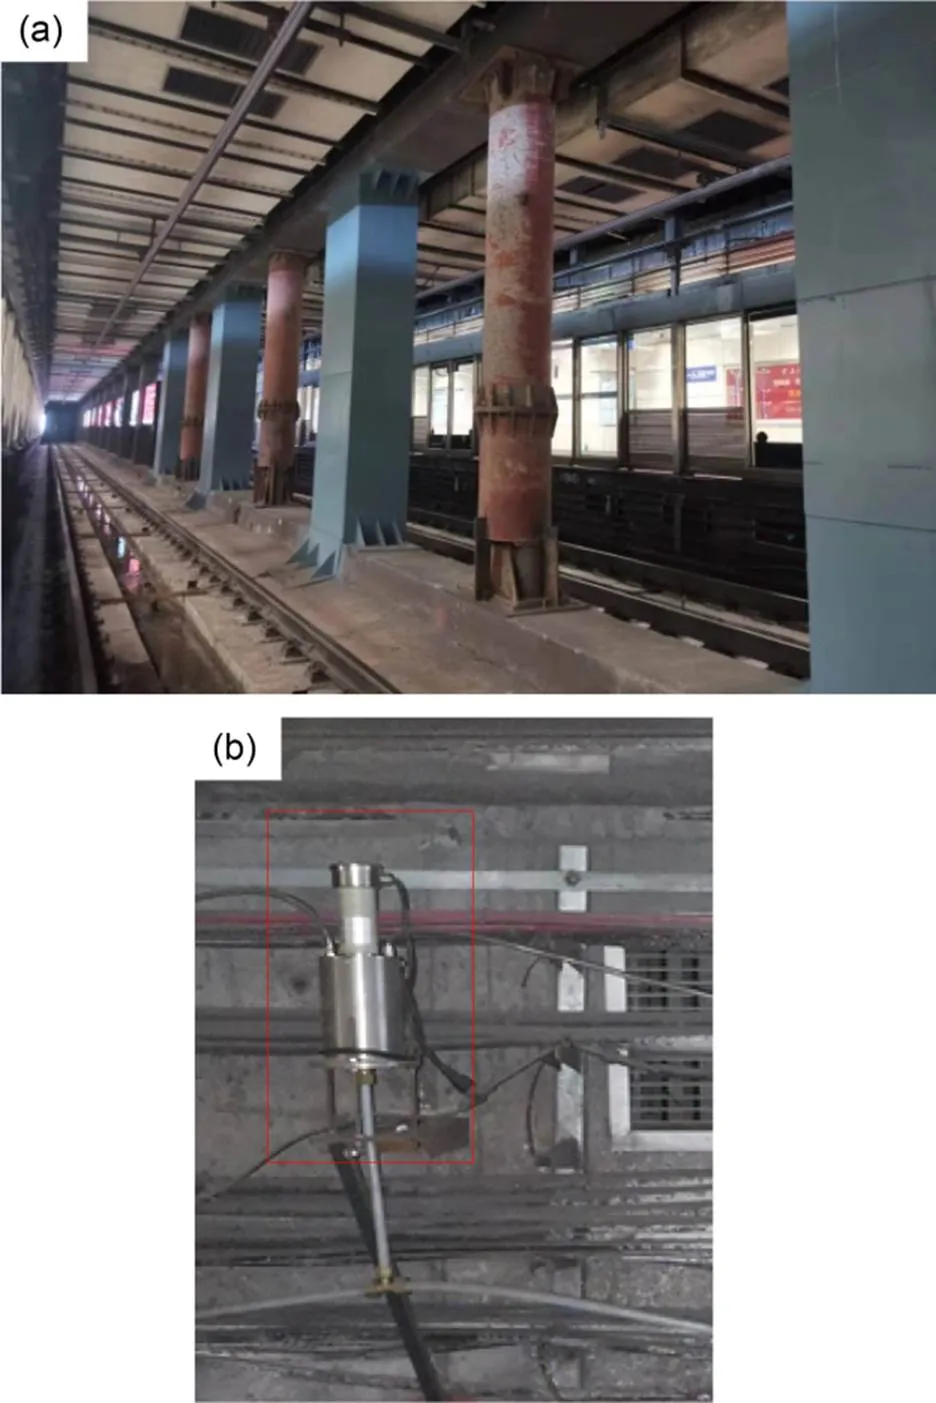
Fig. 1 Photographs at Zhongsheng Station: (a) reinforced columns (M1–M4) and existing columns (J1–J31); (b) monitoring system. The distance between adjacent existing columns is 10 m, and the distance between adjacent existing and reinforced columns is 5 m
Therefore, the settlement of monitoring points M1–M4 can represent the impact of the new metro on the existing metro. The original settlement-monitoring data from Mar. 19, 2021 to Jan. 19, 2022 is shown in Fig. 2a (Ding et al., 2023b) and the denoised data from Mar. 19, 2021 to Jan. 19, 2022 is shown in Fig. 2b. It can be seen from Fig. 2 that the settlement value at the monitoring point first increases and then decreases, that is, the settlement value in the growth phase is about 1.0–3.0 mm, while it is about 1.0–1.5 mm in the stable stage. This is because the settlement value increases due to disturbance of excavation construction in the growth stage. In order to avoid excessive settlement, the operation unit reinforced the column by the metro jet system (MJS) method and established subway protection measures, so as to control settlement changes and stabilize the tunnel. By comparing Figs. 2a and 2b, we can see that the settlement curve was smoother after noise reduction by the WD method; the WD method was able to delete anomalous data present in the monitoring data.
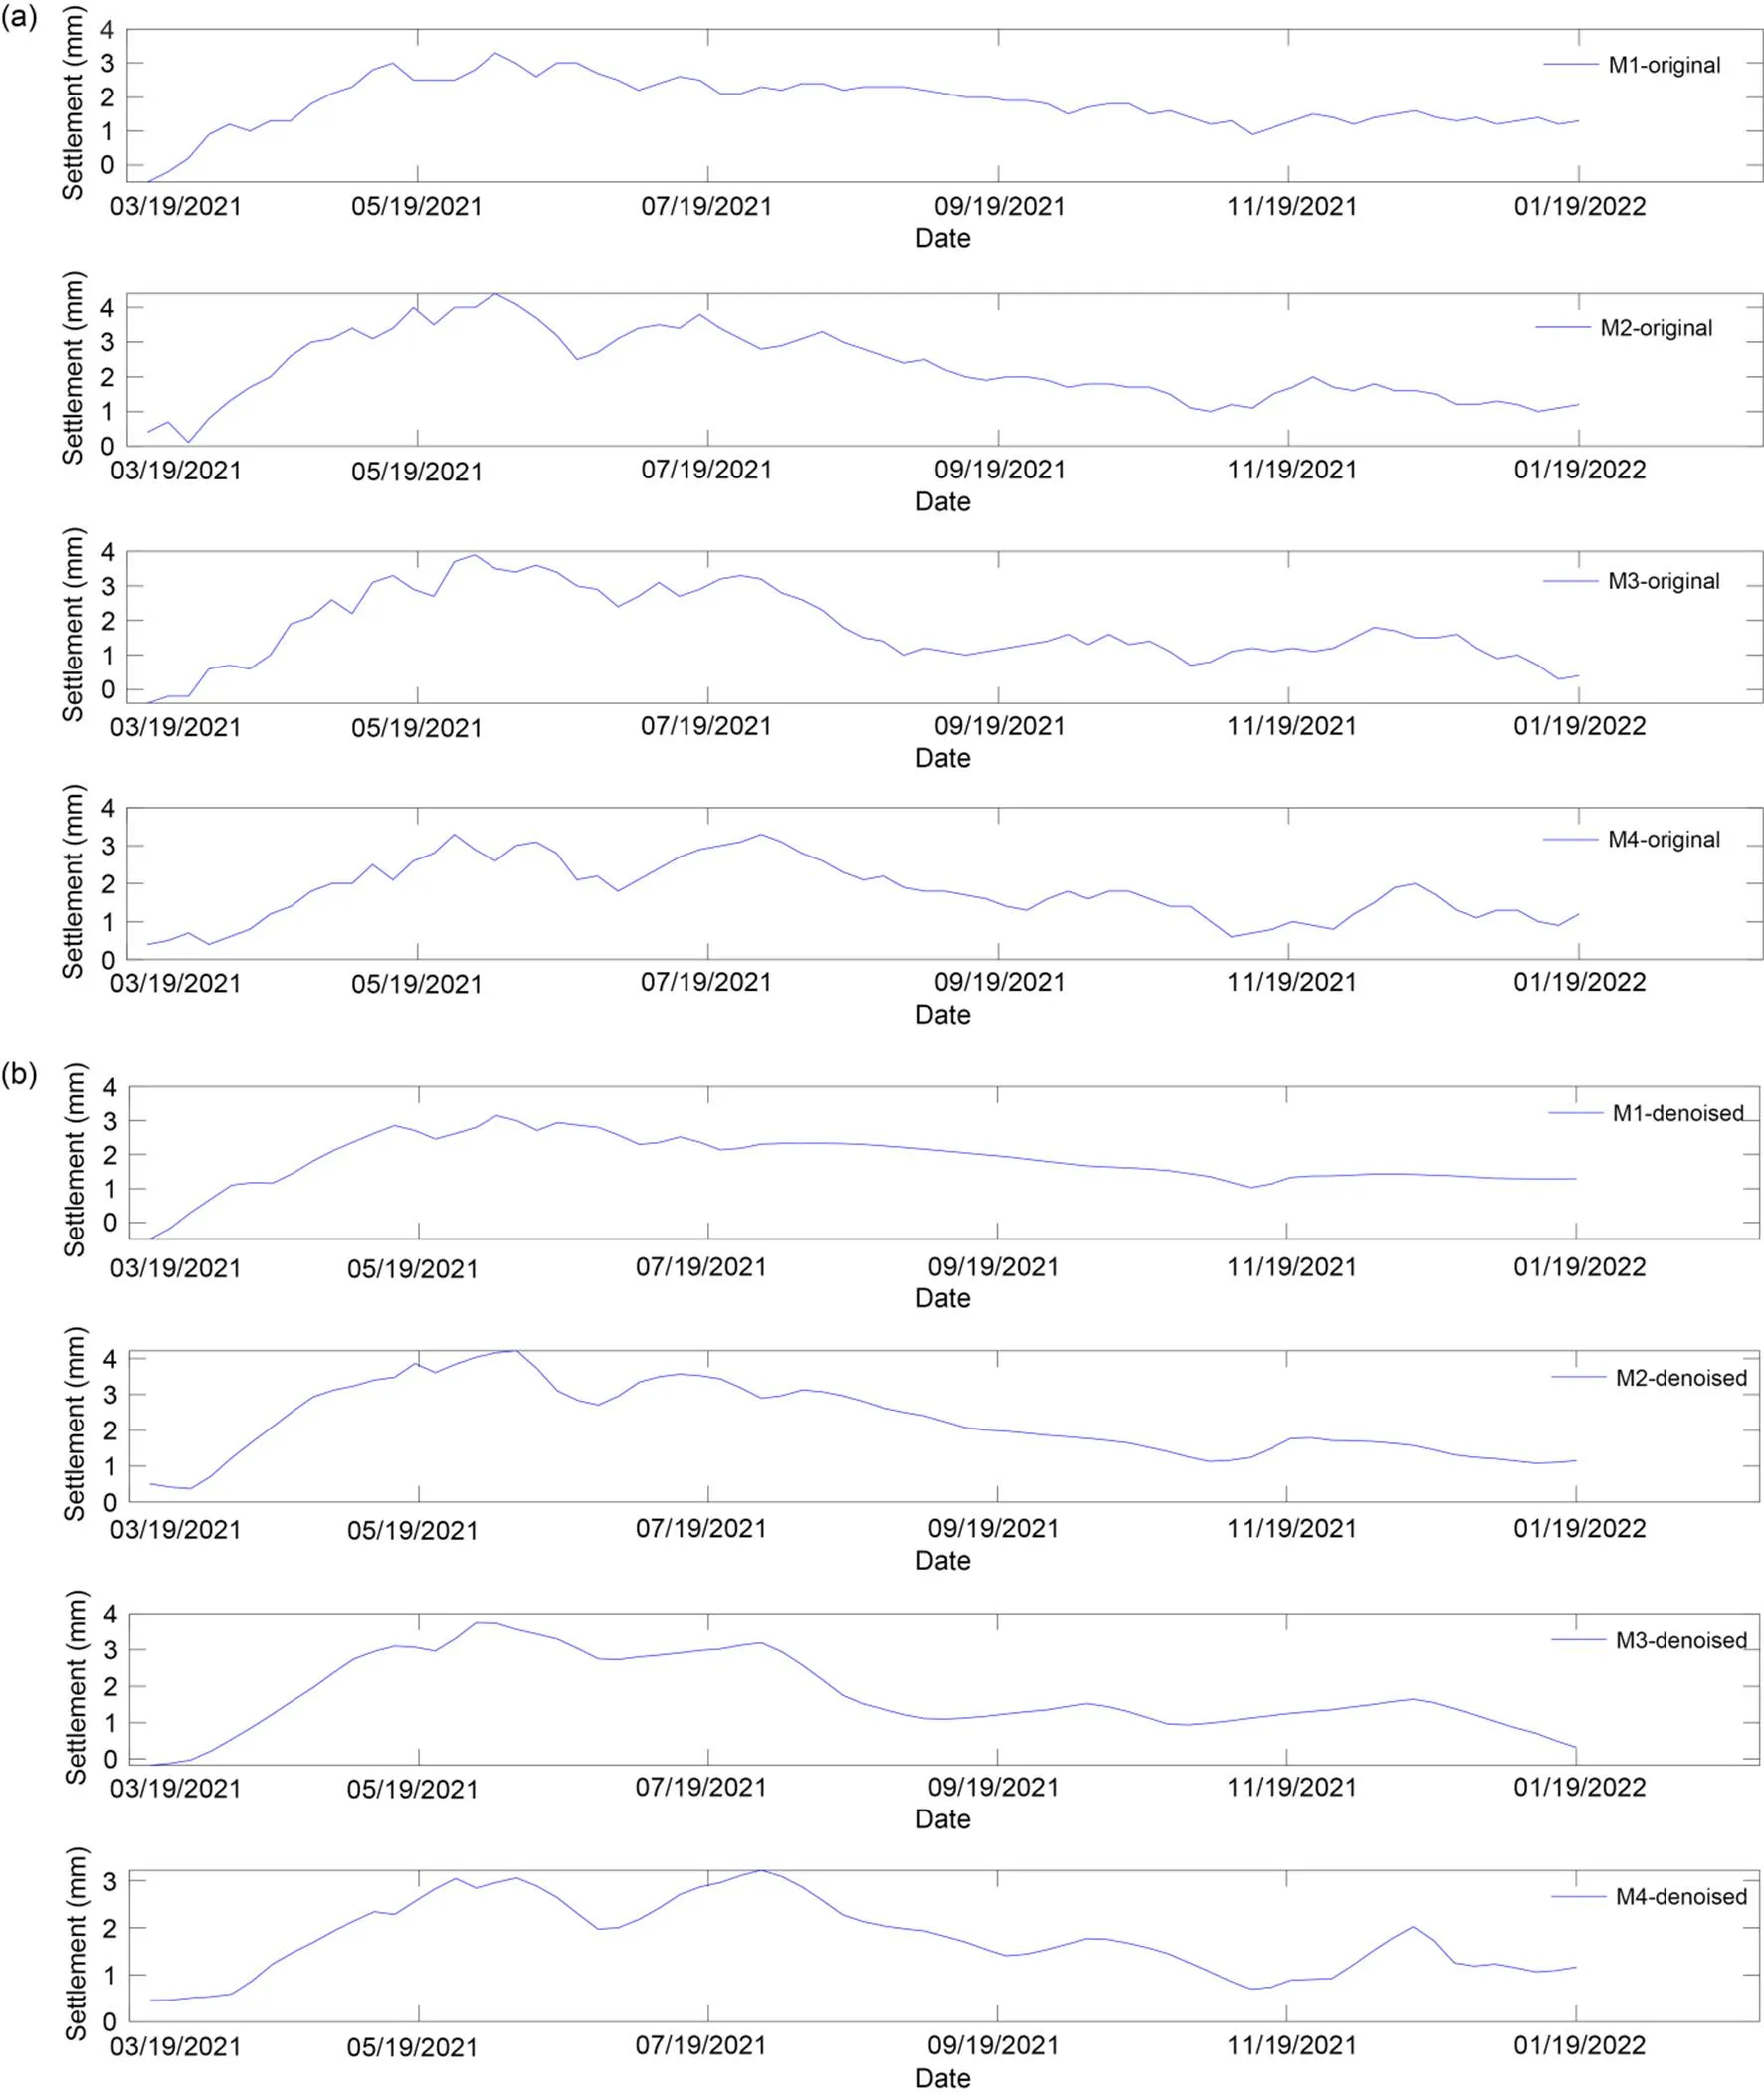
Fig. 2 Settlement data for M1–M4: (a) original data (Ding et al., 2023b); (b) denoised data
In the settlement-prediction probability model based on GPBE, there are two key parameters that need to be determined: prediction ratios and the moving window. The prediction ratios are the proportion of the predicted ratios in the data set. The moving window is the correlation between the settlement value and the firstdata;indicates the moving window. For example, when the moving window is 10, the first 10 data values are selected to predict the next data values. Also, the prediction curve is drawn by starting from the 11 original data points, which leads to the starting points of the-axis in the prediction curve and original data being different.
In this section, we discuss the influence of different moving windows and prediction ratios on the prediction performance of the proposed model. When the moving window is 1 and the predicted ratio is 1%, the prediction results based on the GPBE model are as shown in Fig. 3. Specifically, Fig. 3a shows the prediction results for the original data, and Fig. 3b shows the prediction results for the denoised data.
Similarly, when the moving window is 1 and the predicted ratio is 5%, the prediction results of the GPBE model are as shown in Fig. 4. Fig. 5 shows the prediction results with a moving window of 1 and predicted ratio of 10%. Fig. 6 shows the prediction results with a moving window of 5 and predicted ratio of 1%. With a moving window of 5 and a predicted ratio of 5%, the prediction results are as shown in Fig. 7. When the moving window is 5 and the predicted ratio is 10%, the prediction results based on GPBE model are shown in Fig. 8. When the moving window is 10 and the predicted ratio is 1%, the prediction results based on GPBE model are shown in Fig. 9. When the moving window is 10 and the predicted ratio is 5%, the prediction results based on GPBE model are shown in Fig. 10. When the moving window is 10 and the predicted ratio is 10%, the prediction results based on GPBE model are shown in Fig. 11.
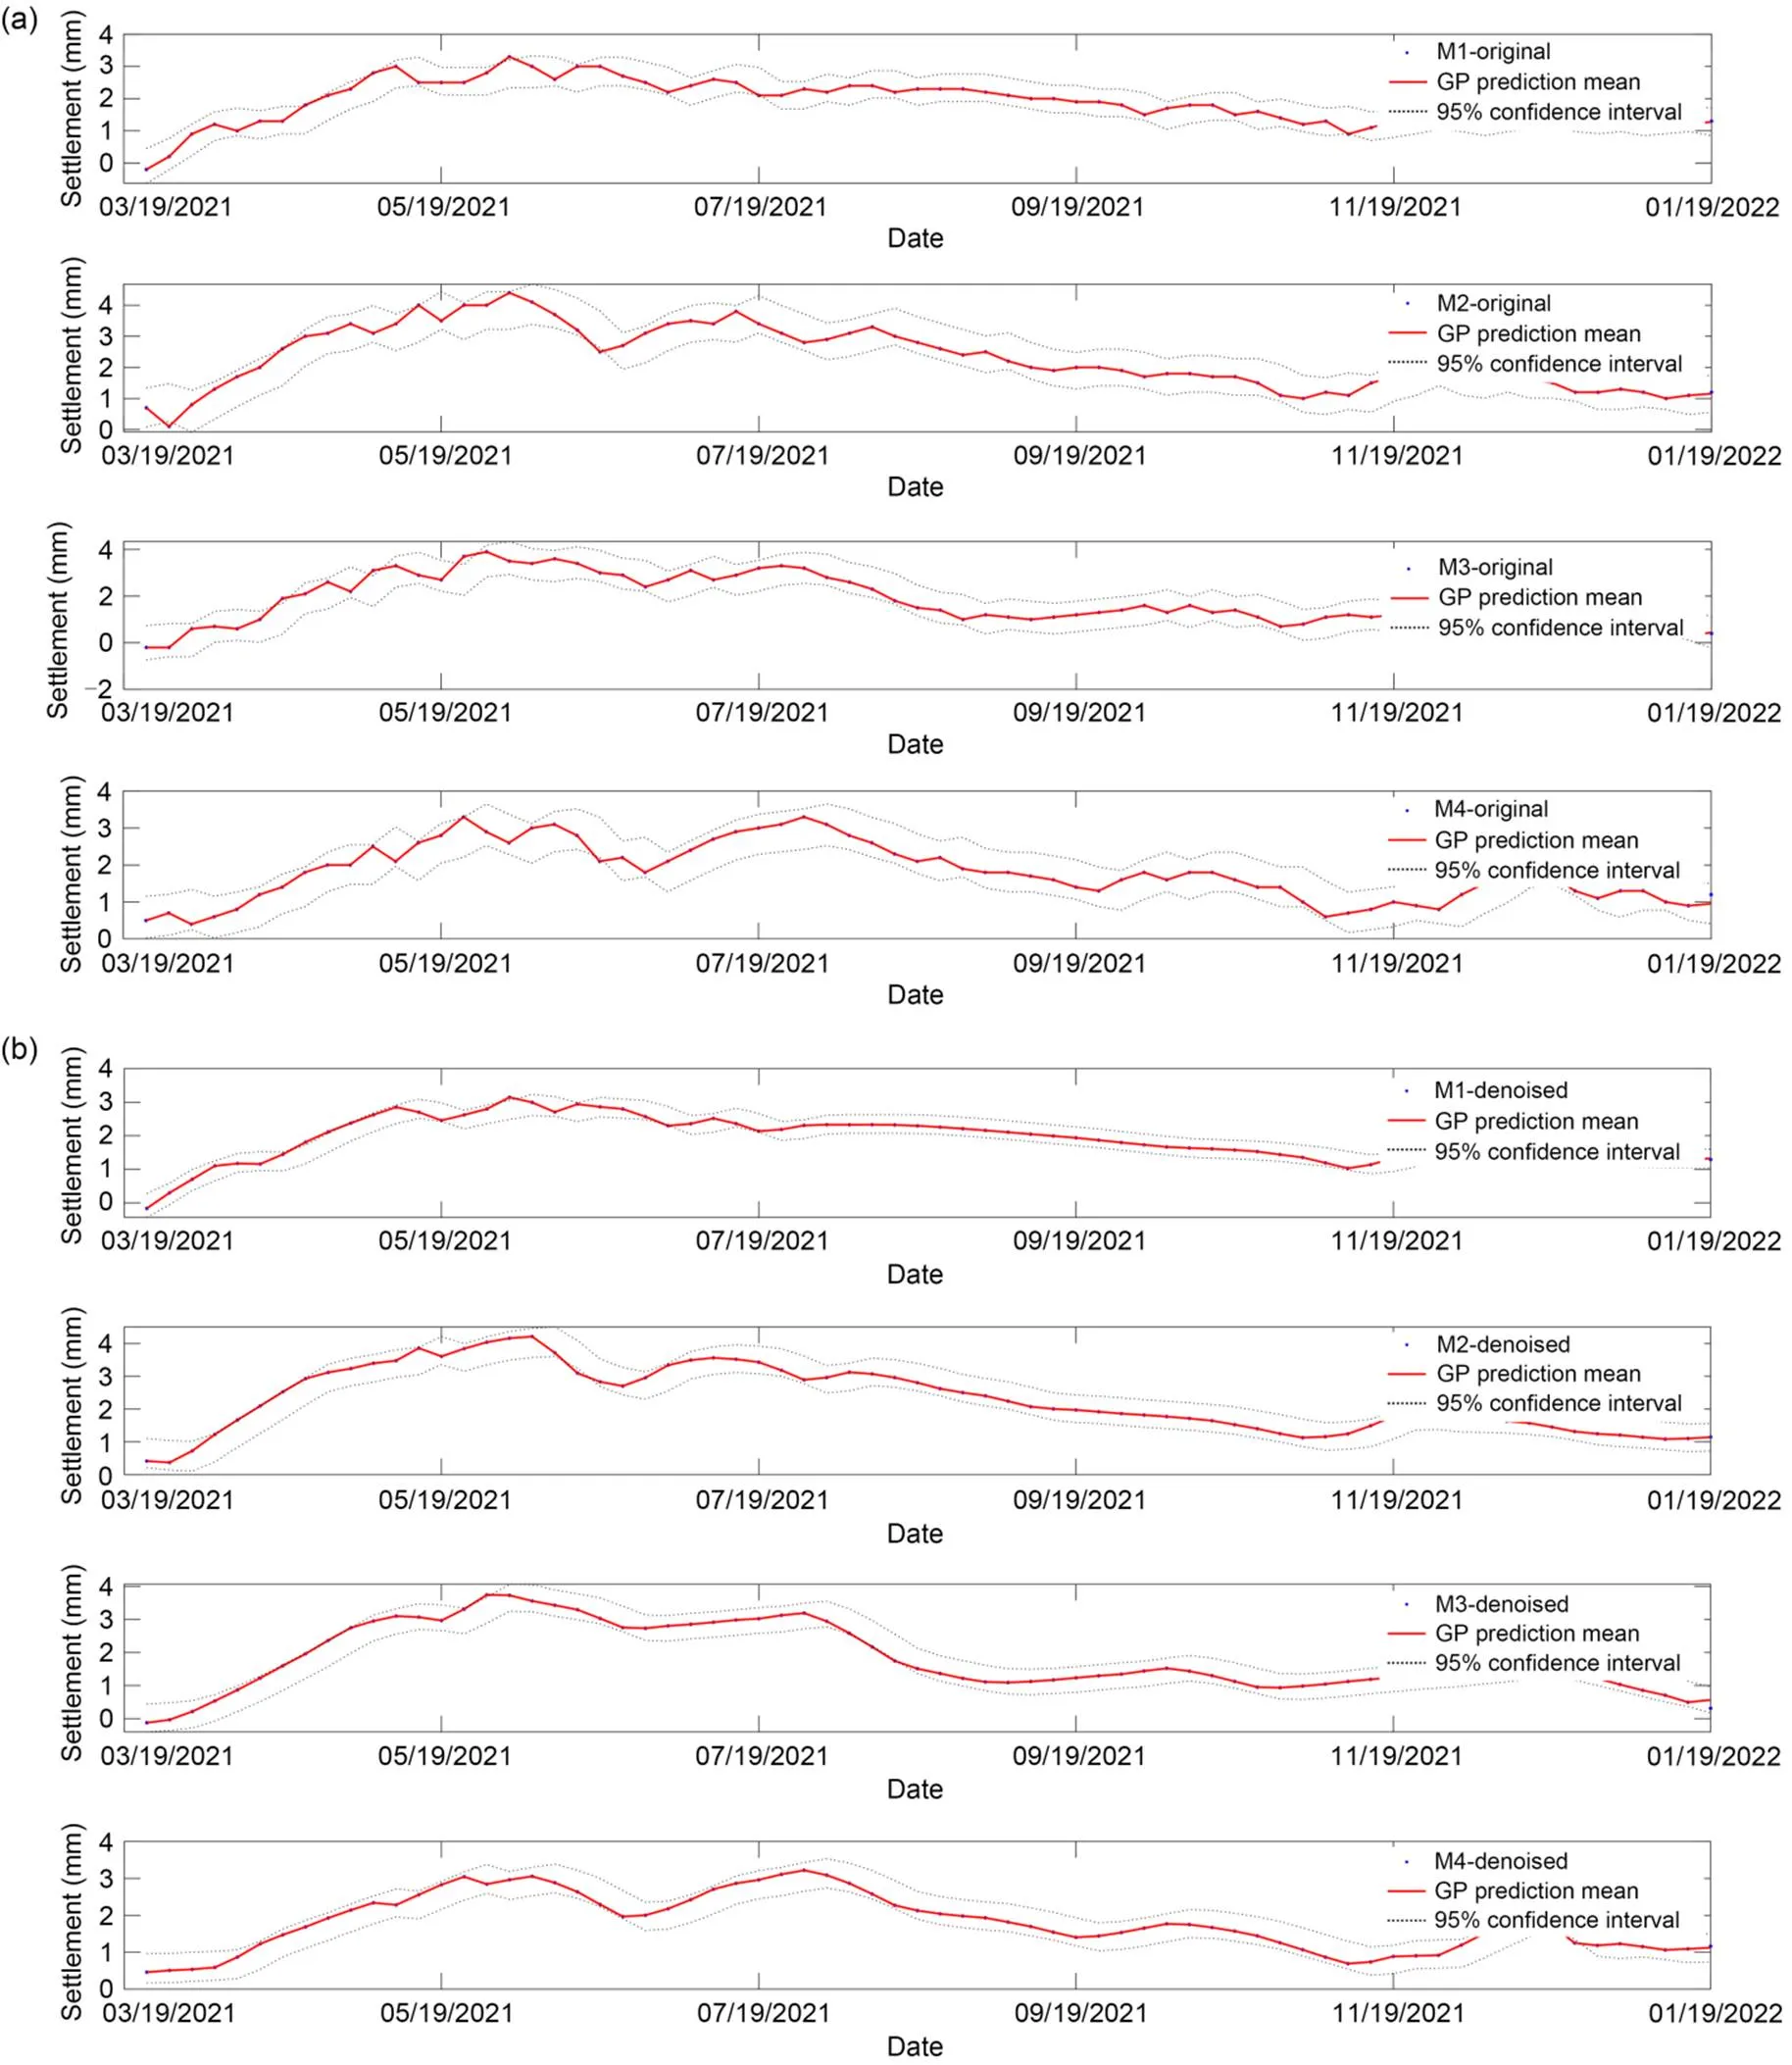
Fig. 3 Settlement probability prediction with a moving window of 1 and predicted ratio of 1%: (a) probability prediction based on original data; (b) probability prediction based on denoised data
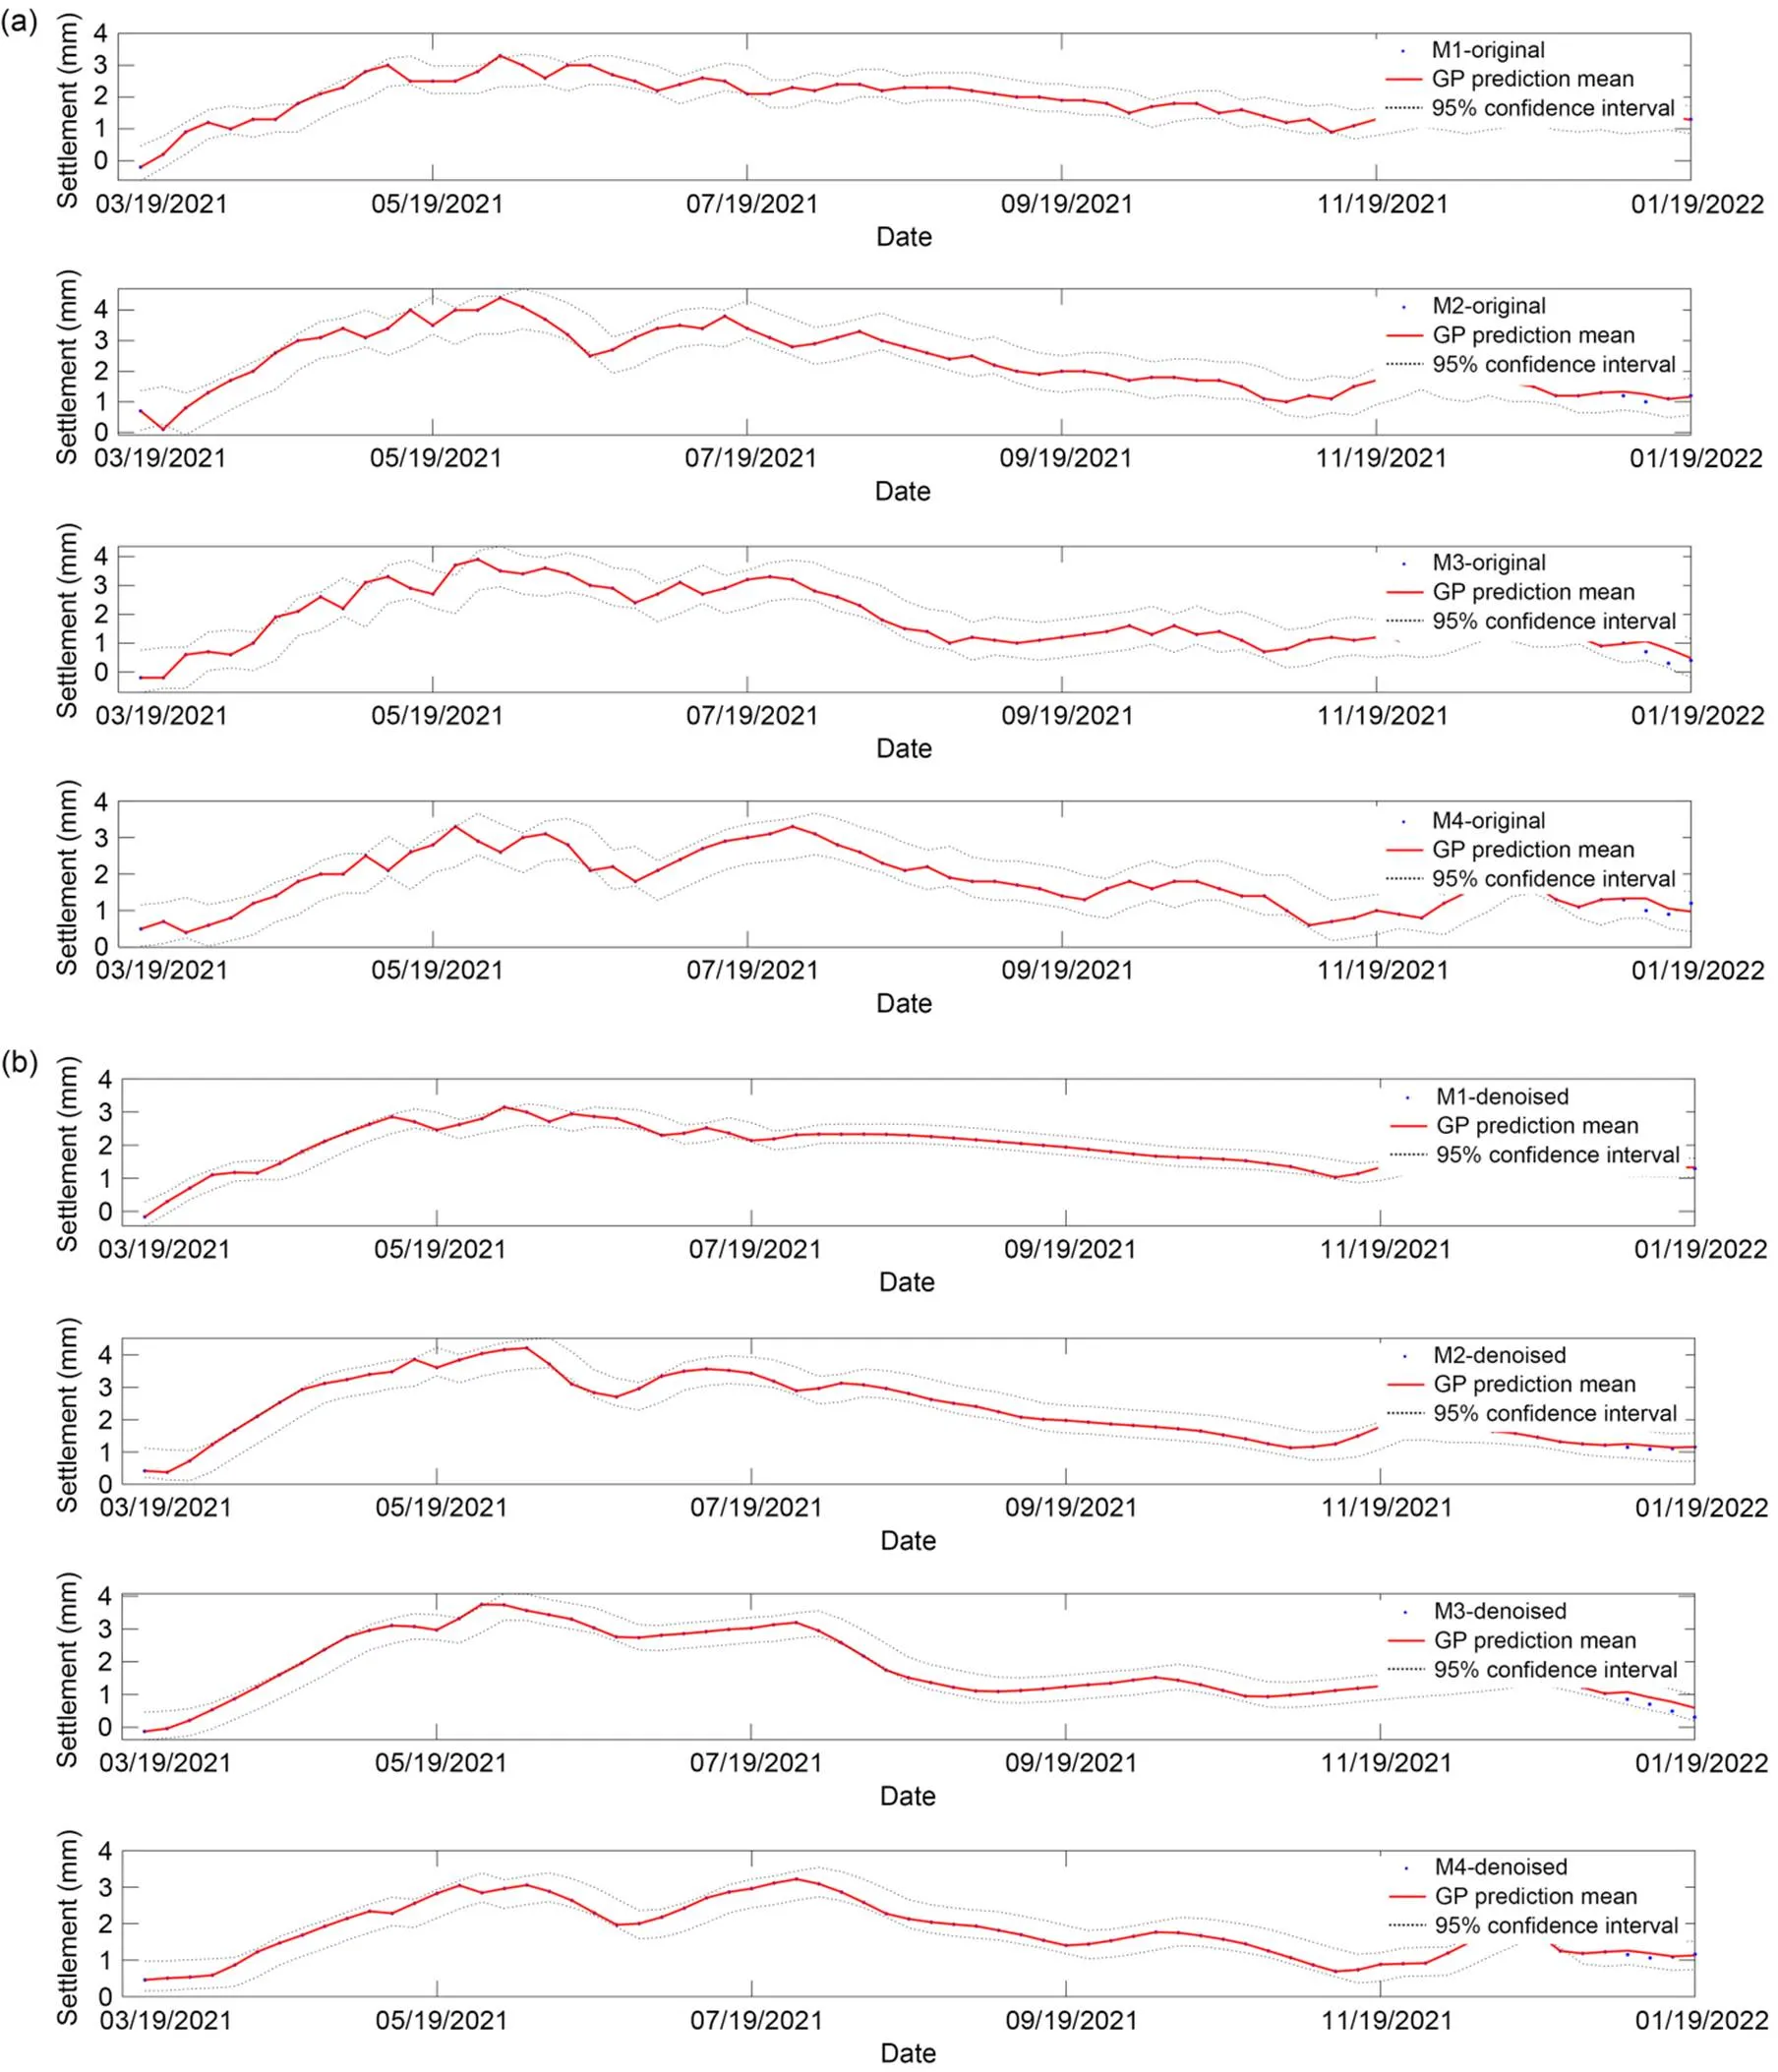
Fig. 4 Settlement probability prediction with a moving window of 1 and predicted ratio of 5%: (a) probability prediction based on original data; (b) probability prediction based on denoised data
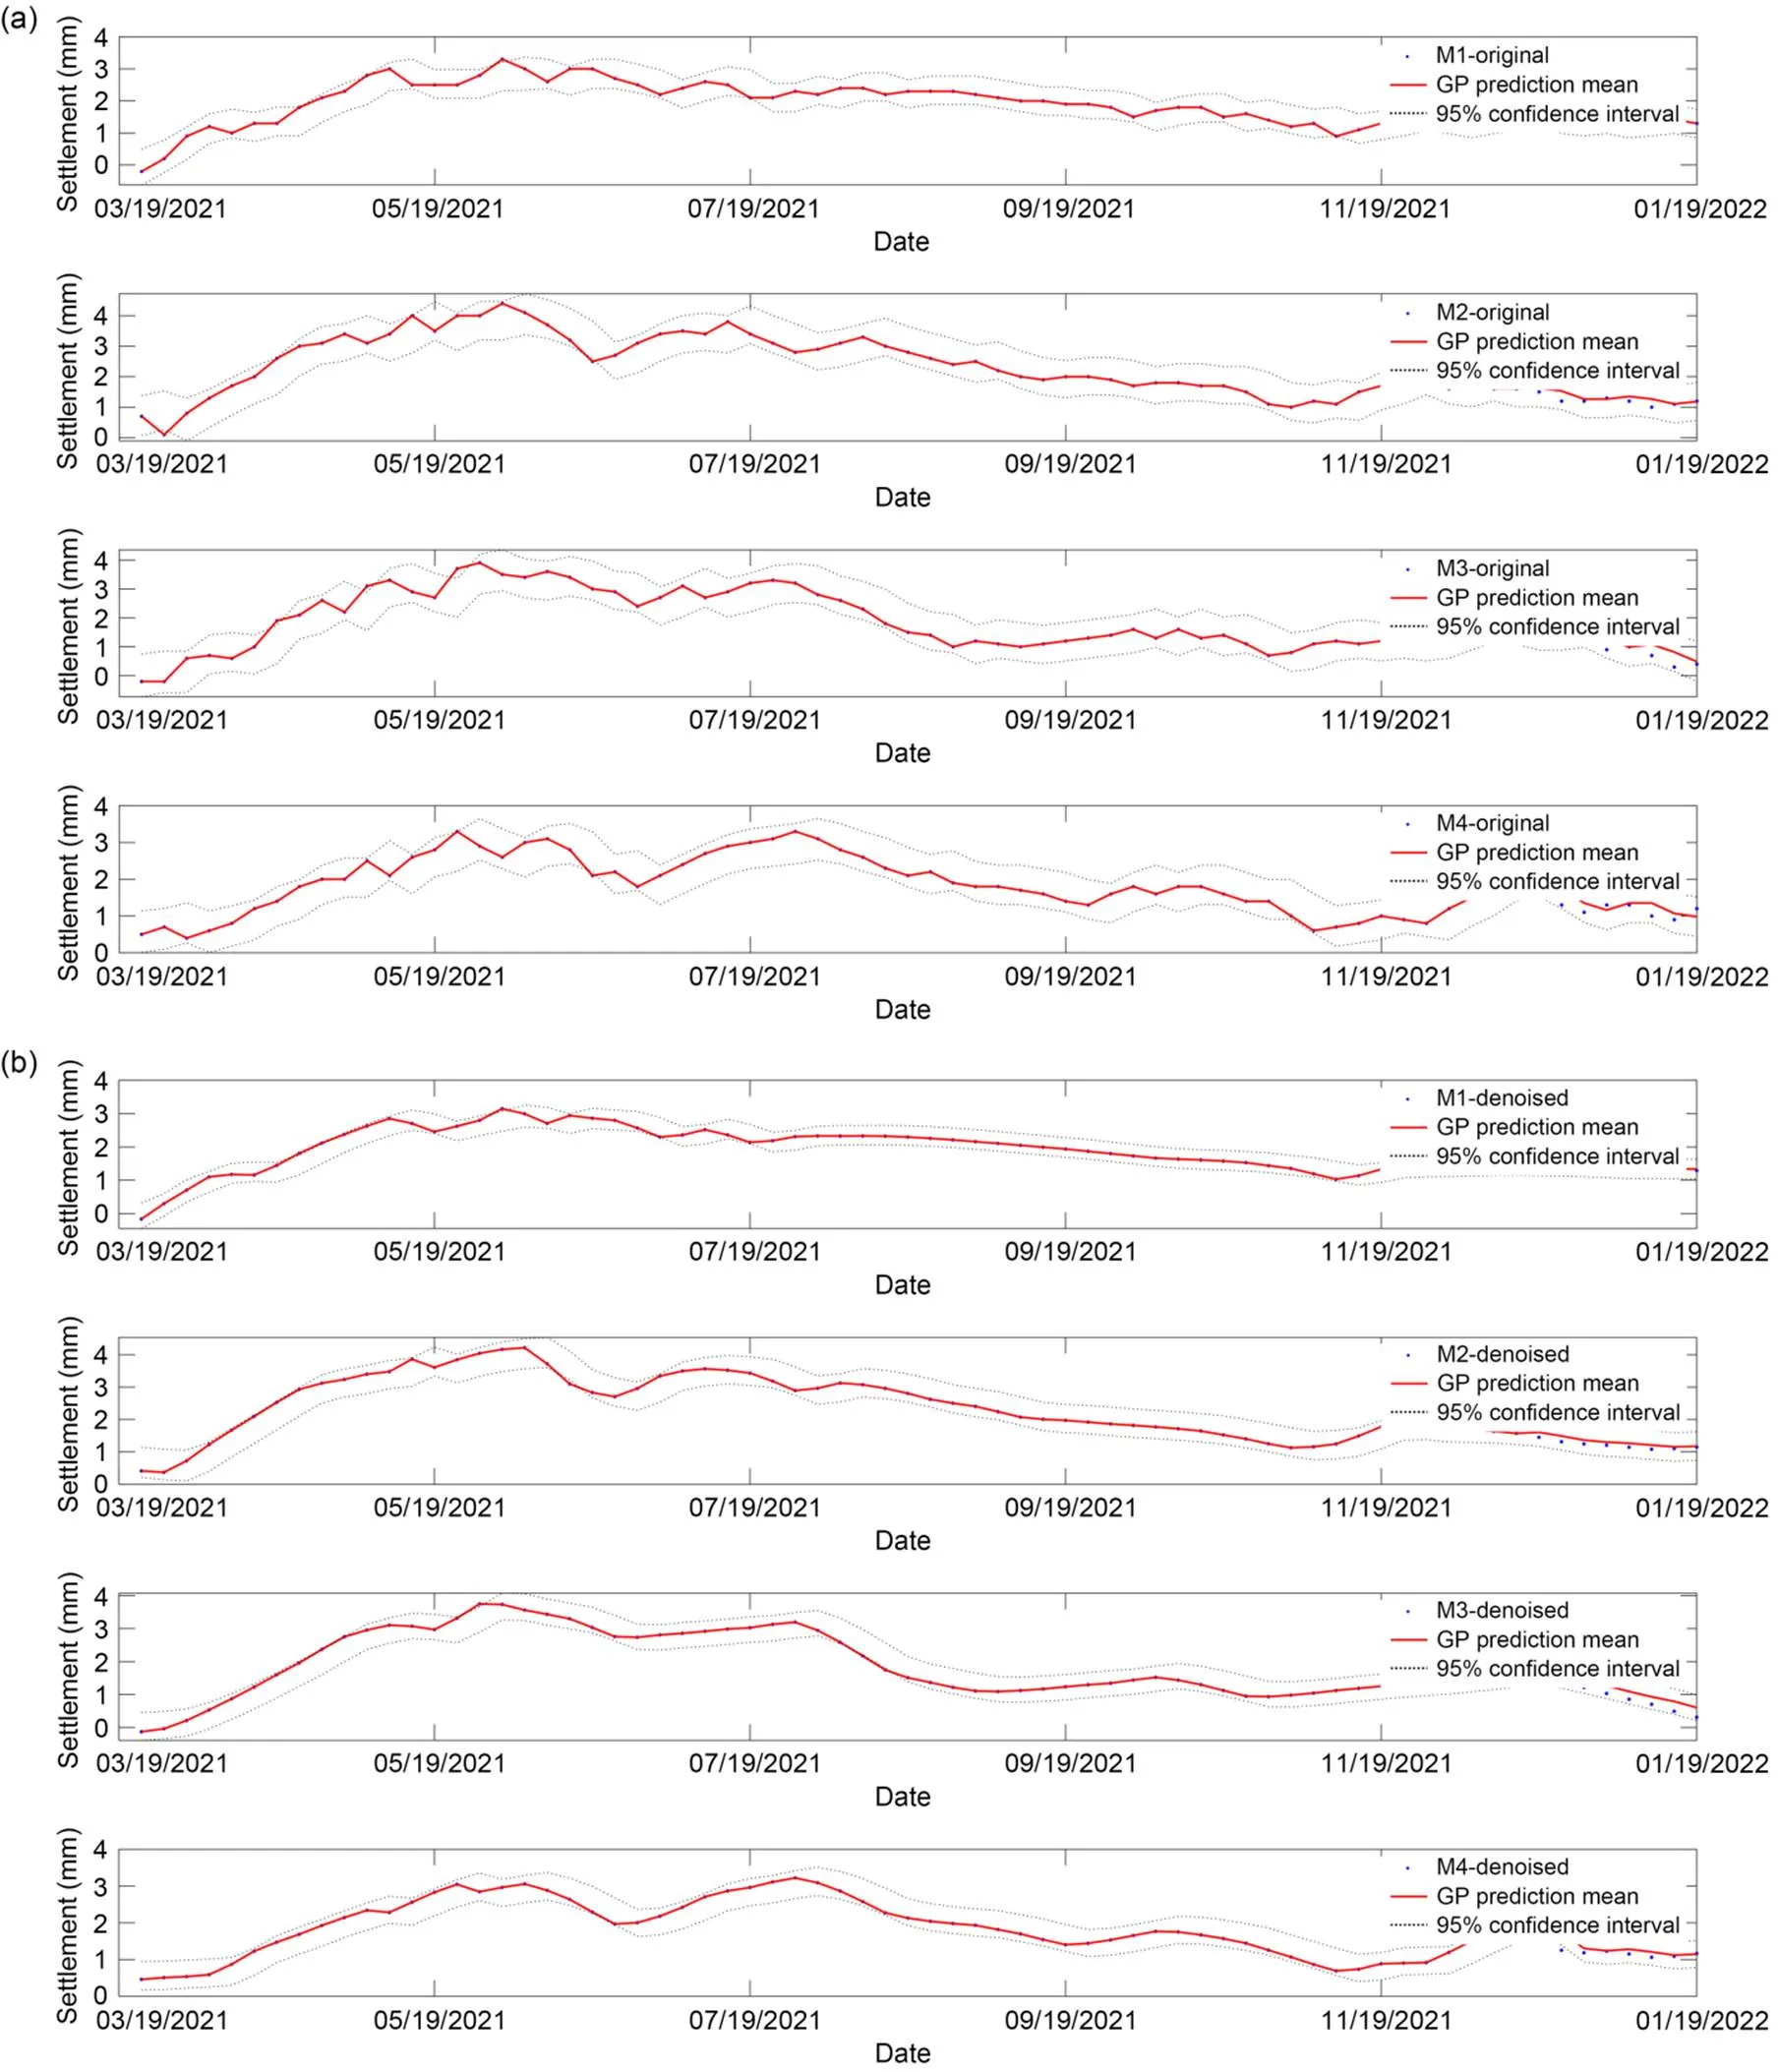
Fig. 5 Settlement probability prediction with a moving window of 1 and predicted ratio of 10%: (a) probability prediction based on original data; (b) probability prediction based on denoised data
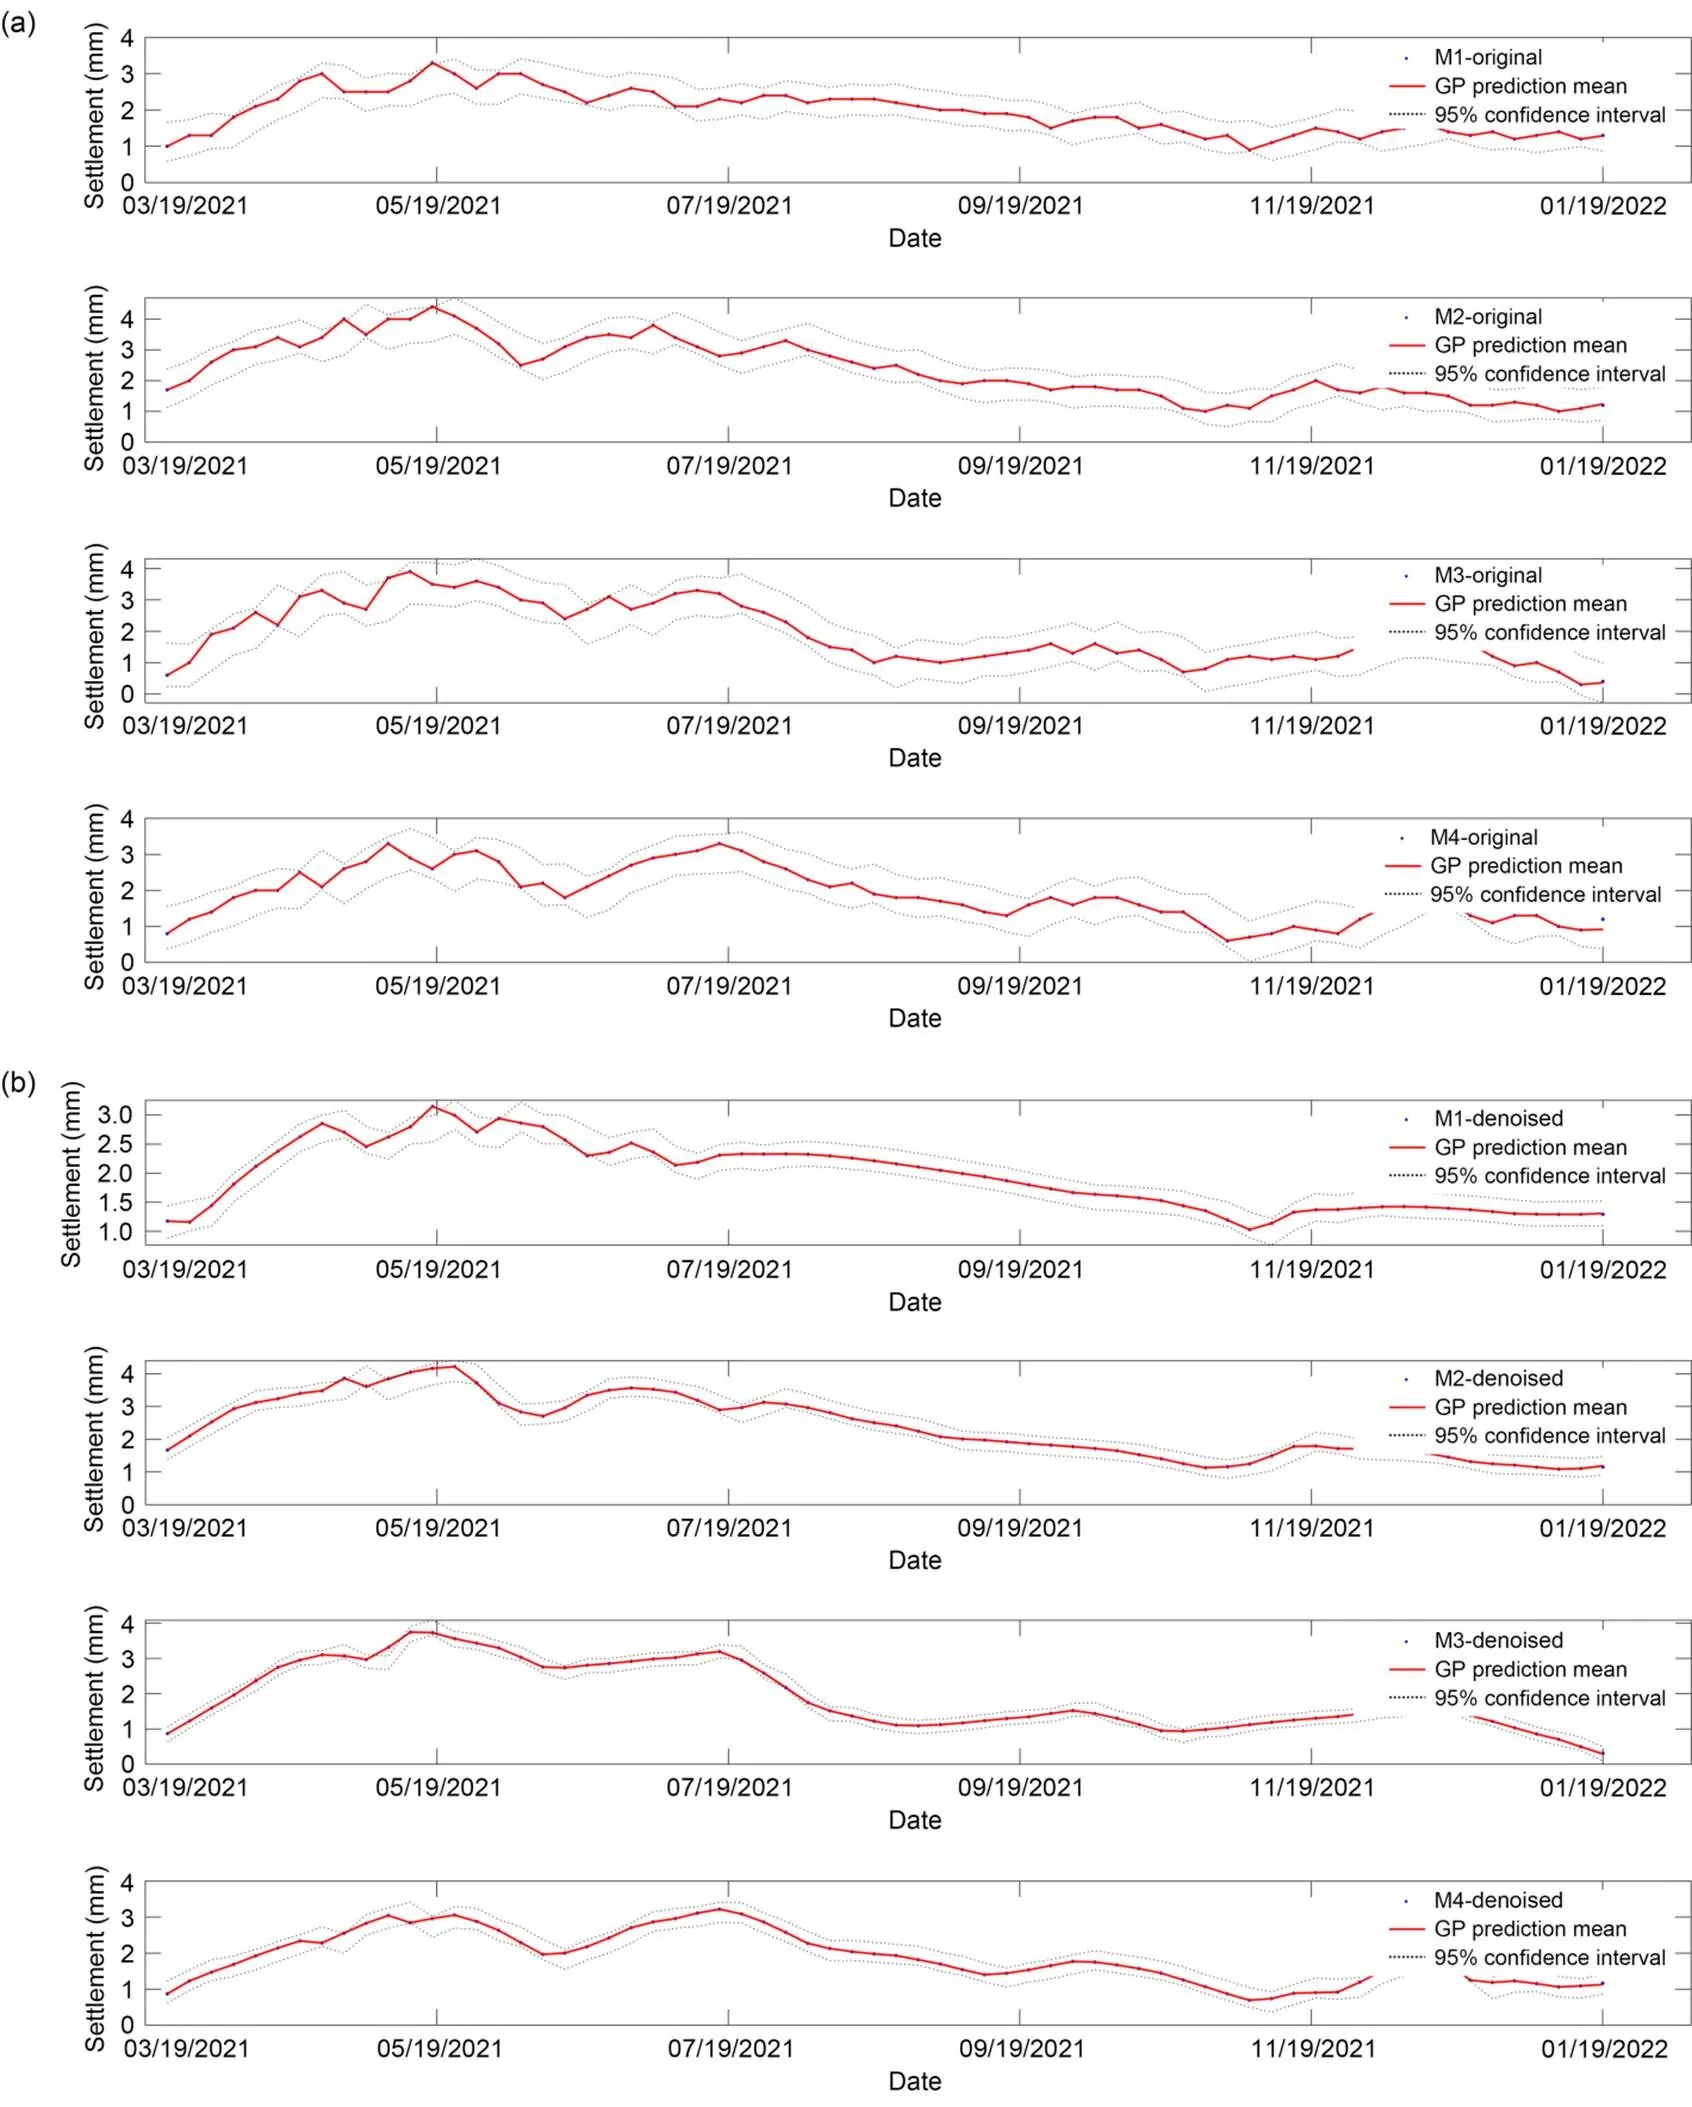
Fig. 6 Settlement probability prediction with a moving window of 5 and predicted ratio of 1%: (a) probability prediction based on original data; (b) probability prediction based on denoised data
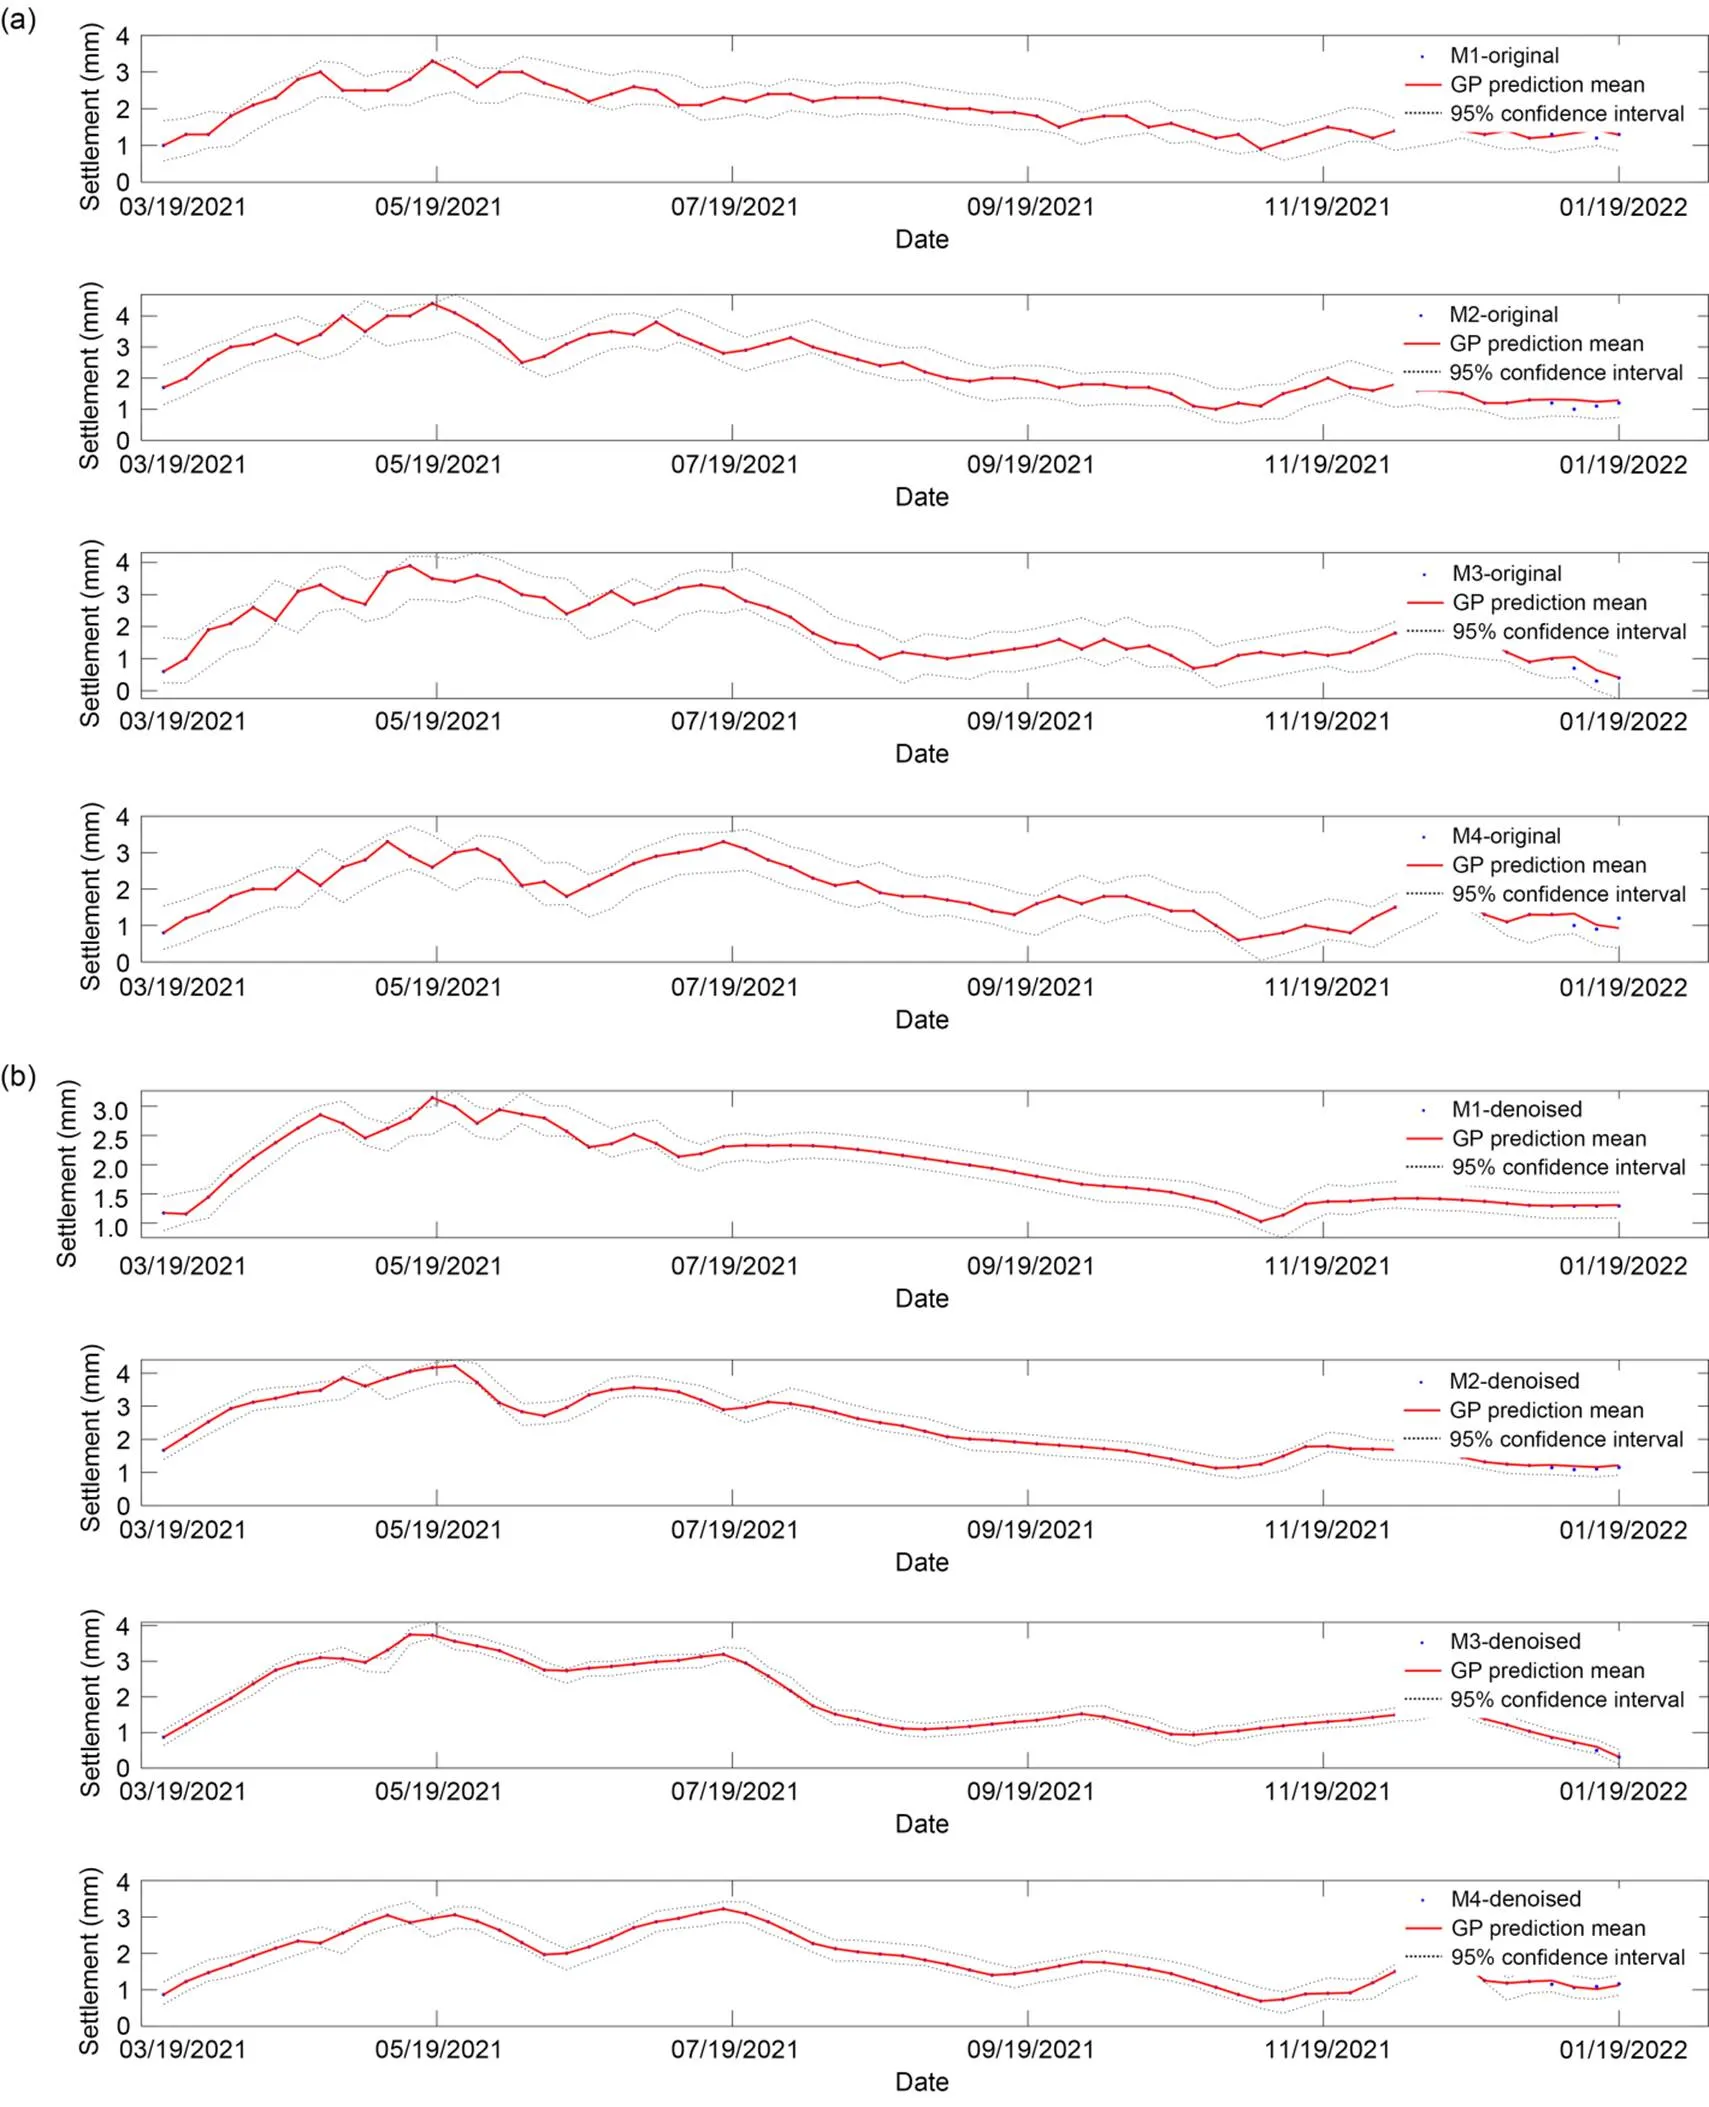
Fig. 7 Settlement probability prediction with a moving window of 5 and predicted ratio of 5%: (a) probability prediction based on original data; (b) probability prediction based on denoised data

Fig. 8 Settlement probability prediction with a moving window of 5 and predicted ratio of 10%: (a) probability prediction based on original data; (b) probability prediction based on denoised data
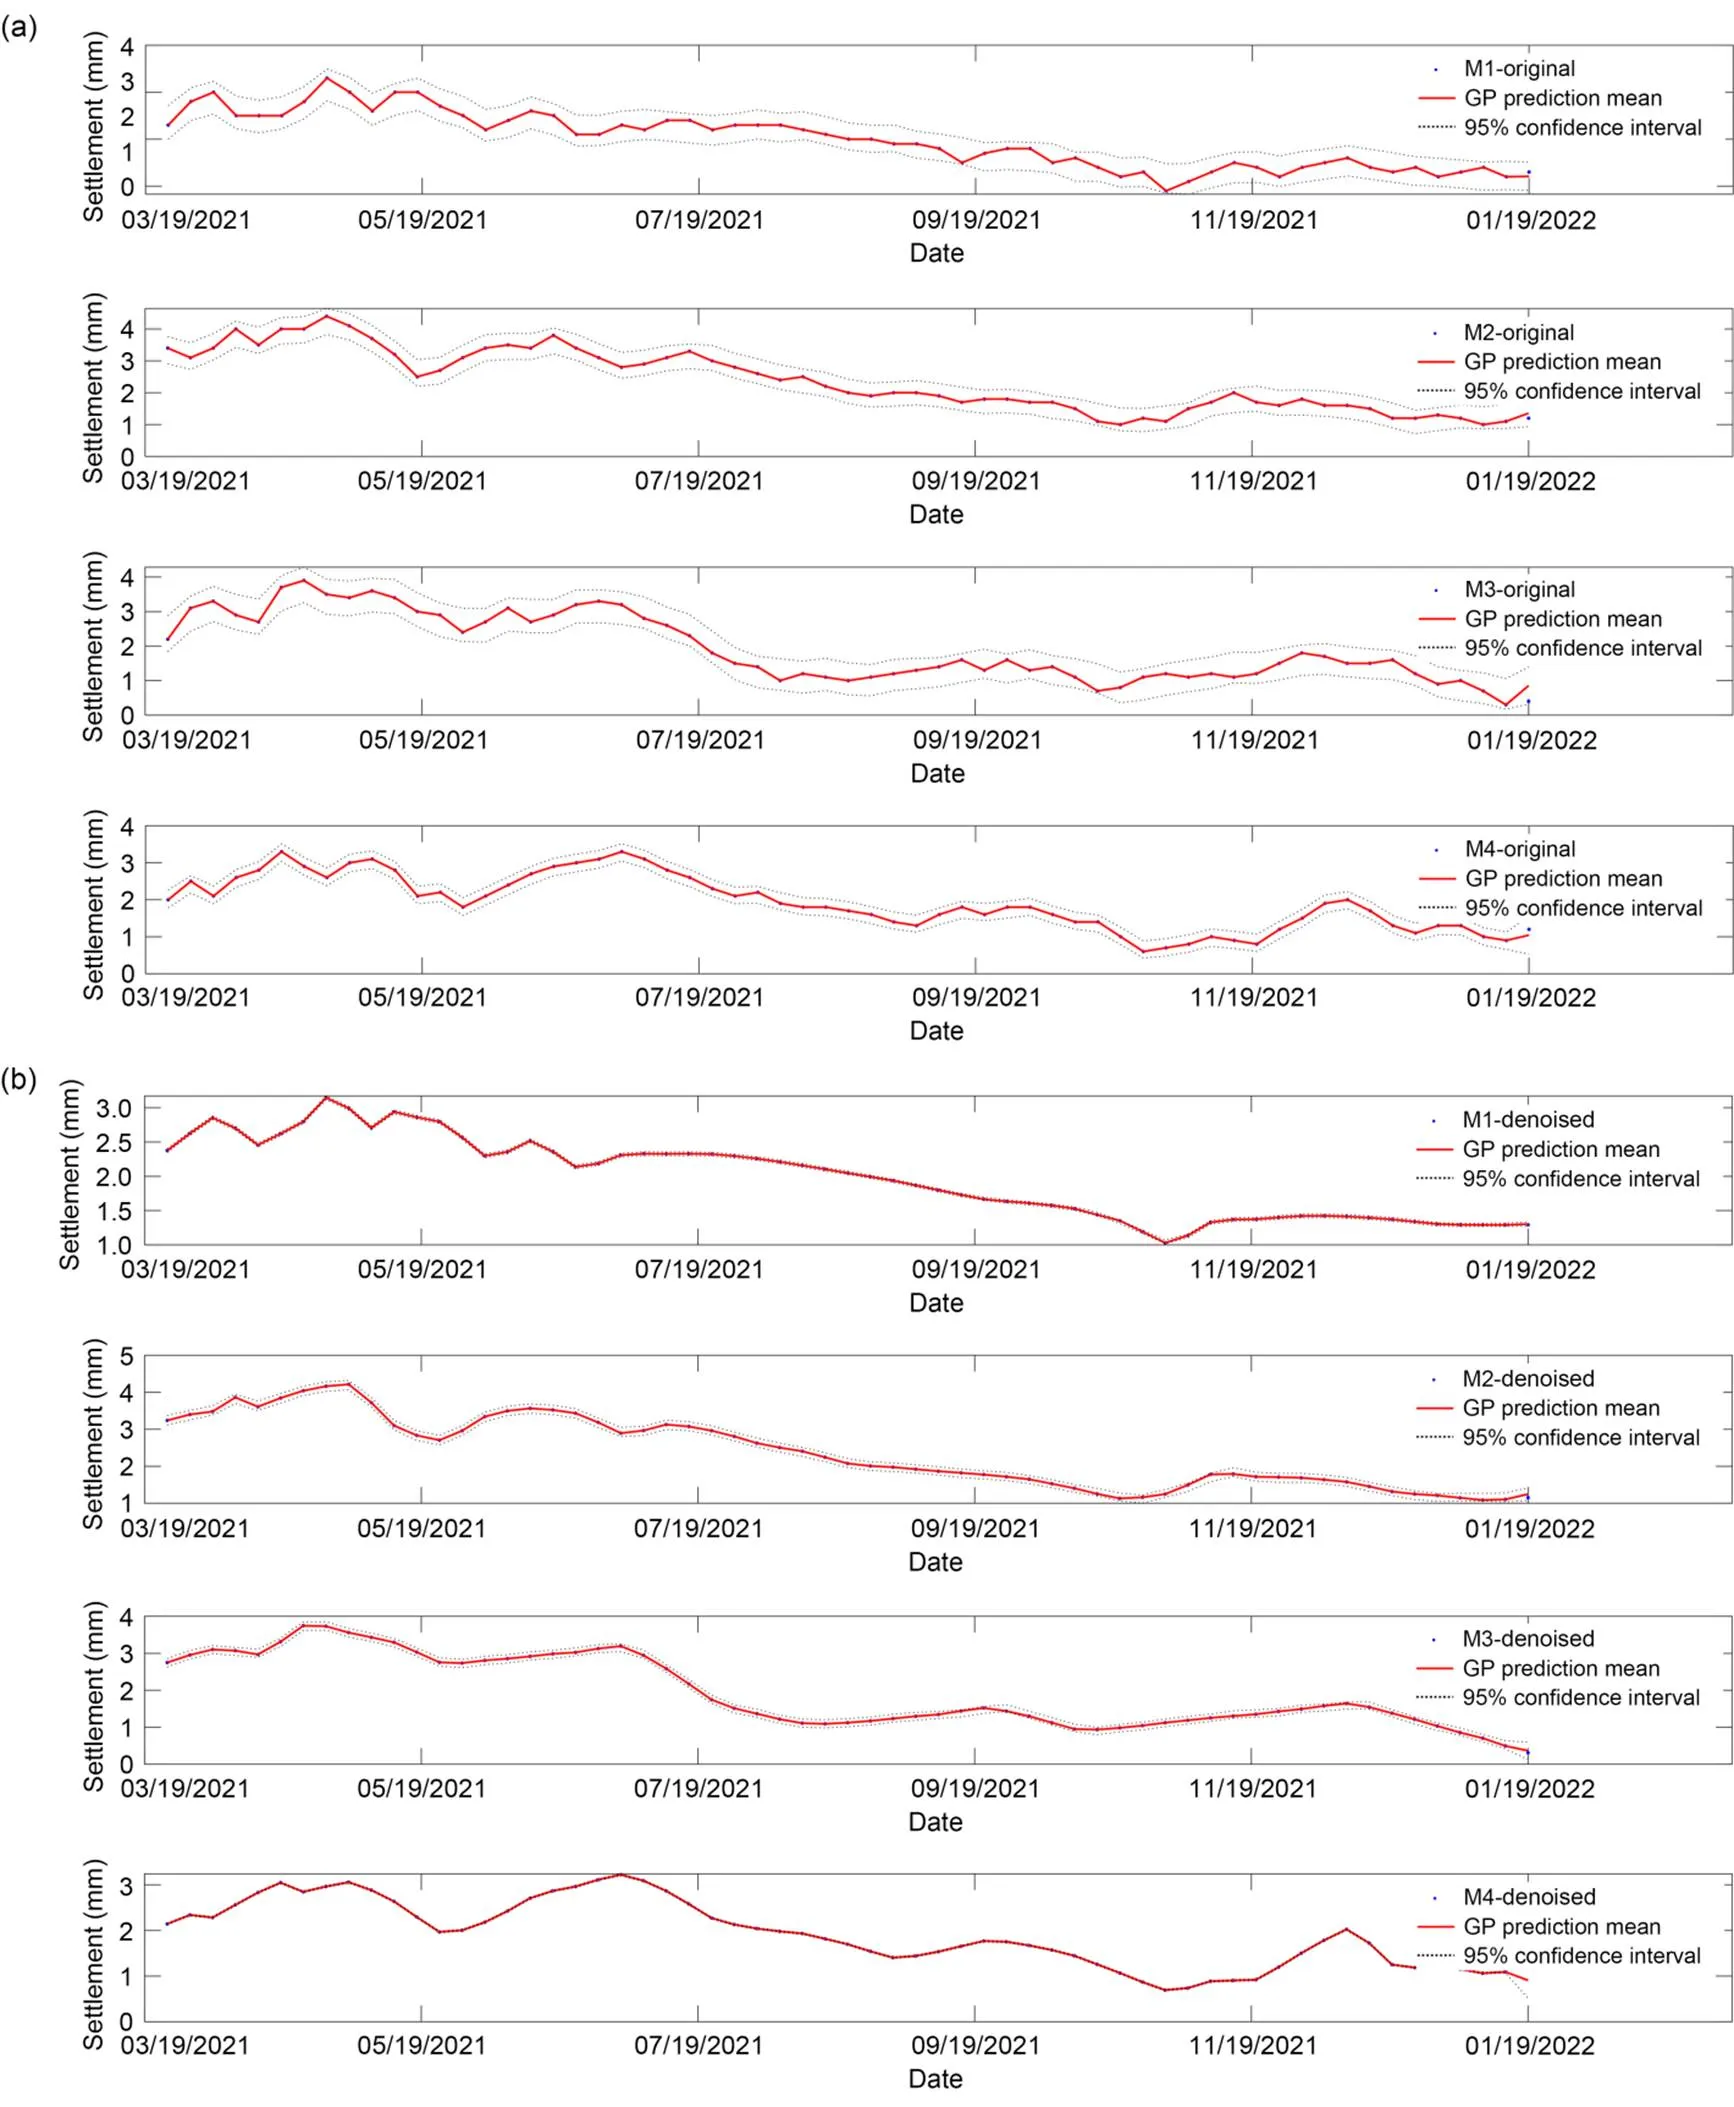
Fig. 9 Settlement probability prediction with a moving window of 10 and predicted ratio of 1%: (a) probability prediction based on original data; (b) probability prediction based on denoised data
It is clear from these figures that the proposed GPBE probability prediction method satisfactorily describes the variation law of settlement and gives a 95% confidence interval to the settlement value. In other words, the predicted settlement values are in the 95% confidence interval, which fully consider the uncertainty of settlement data.
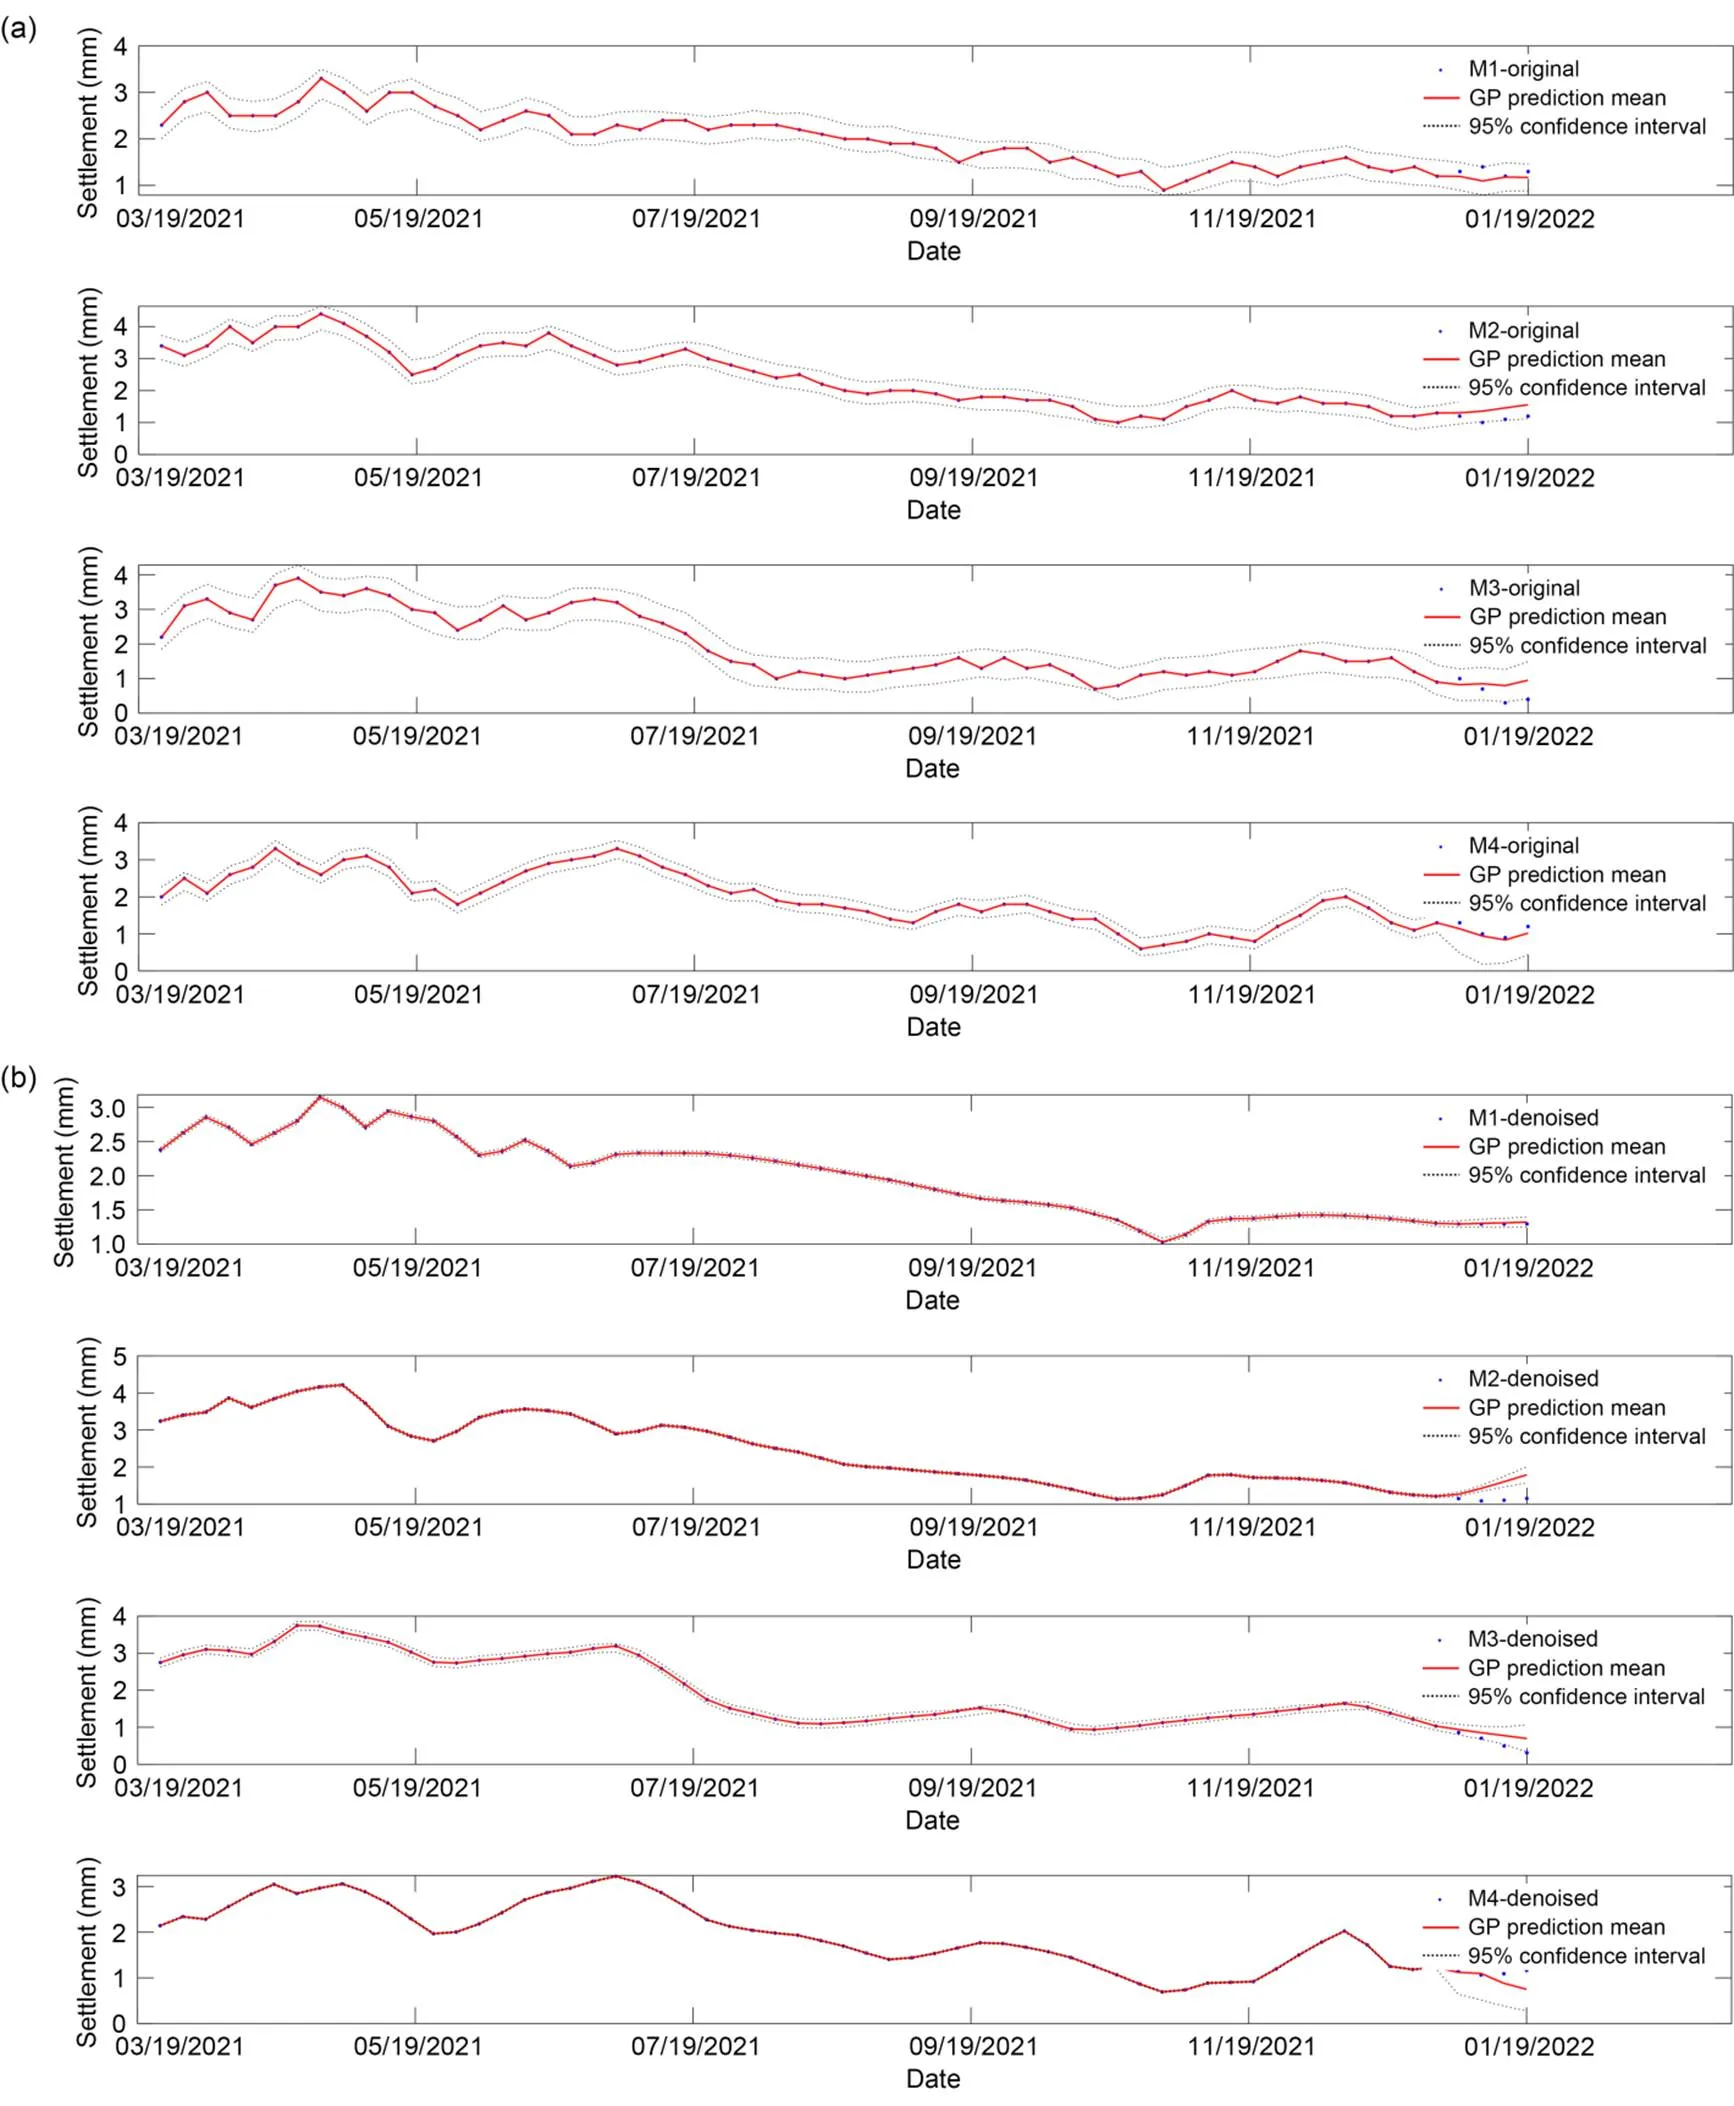
Fig. 10 Settlement probability prediction with a moving window of 10 and predicted ratio of 5%: (a) probability prediction based on original data; (b) probability prediction based on denoised data
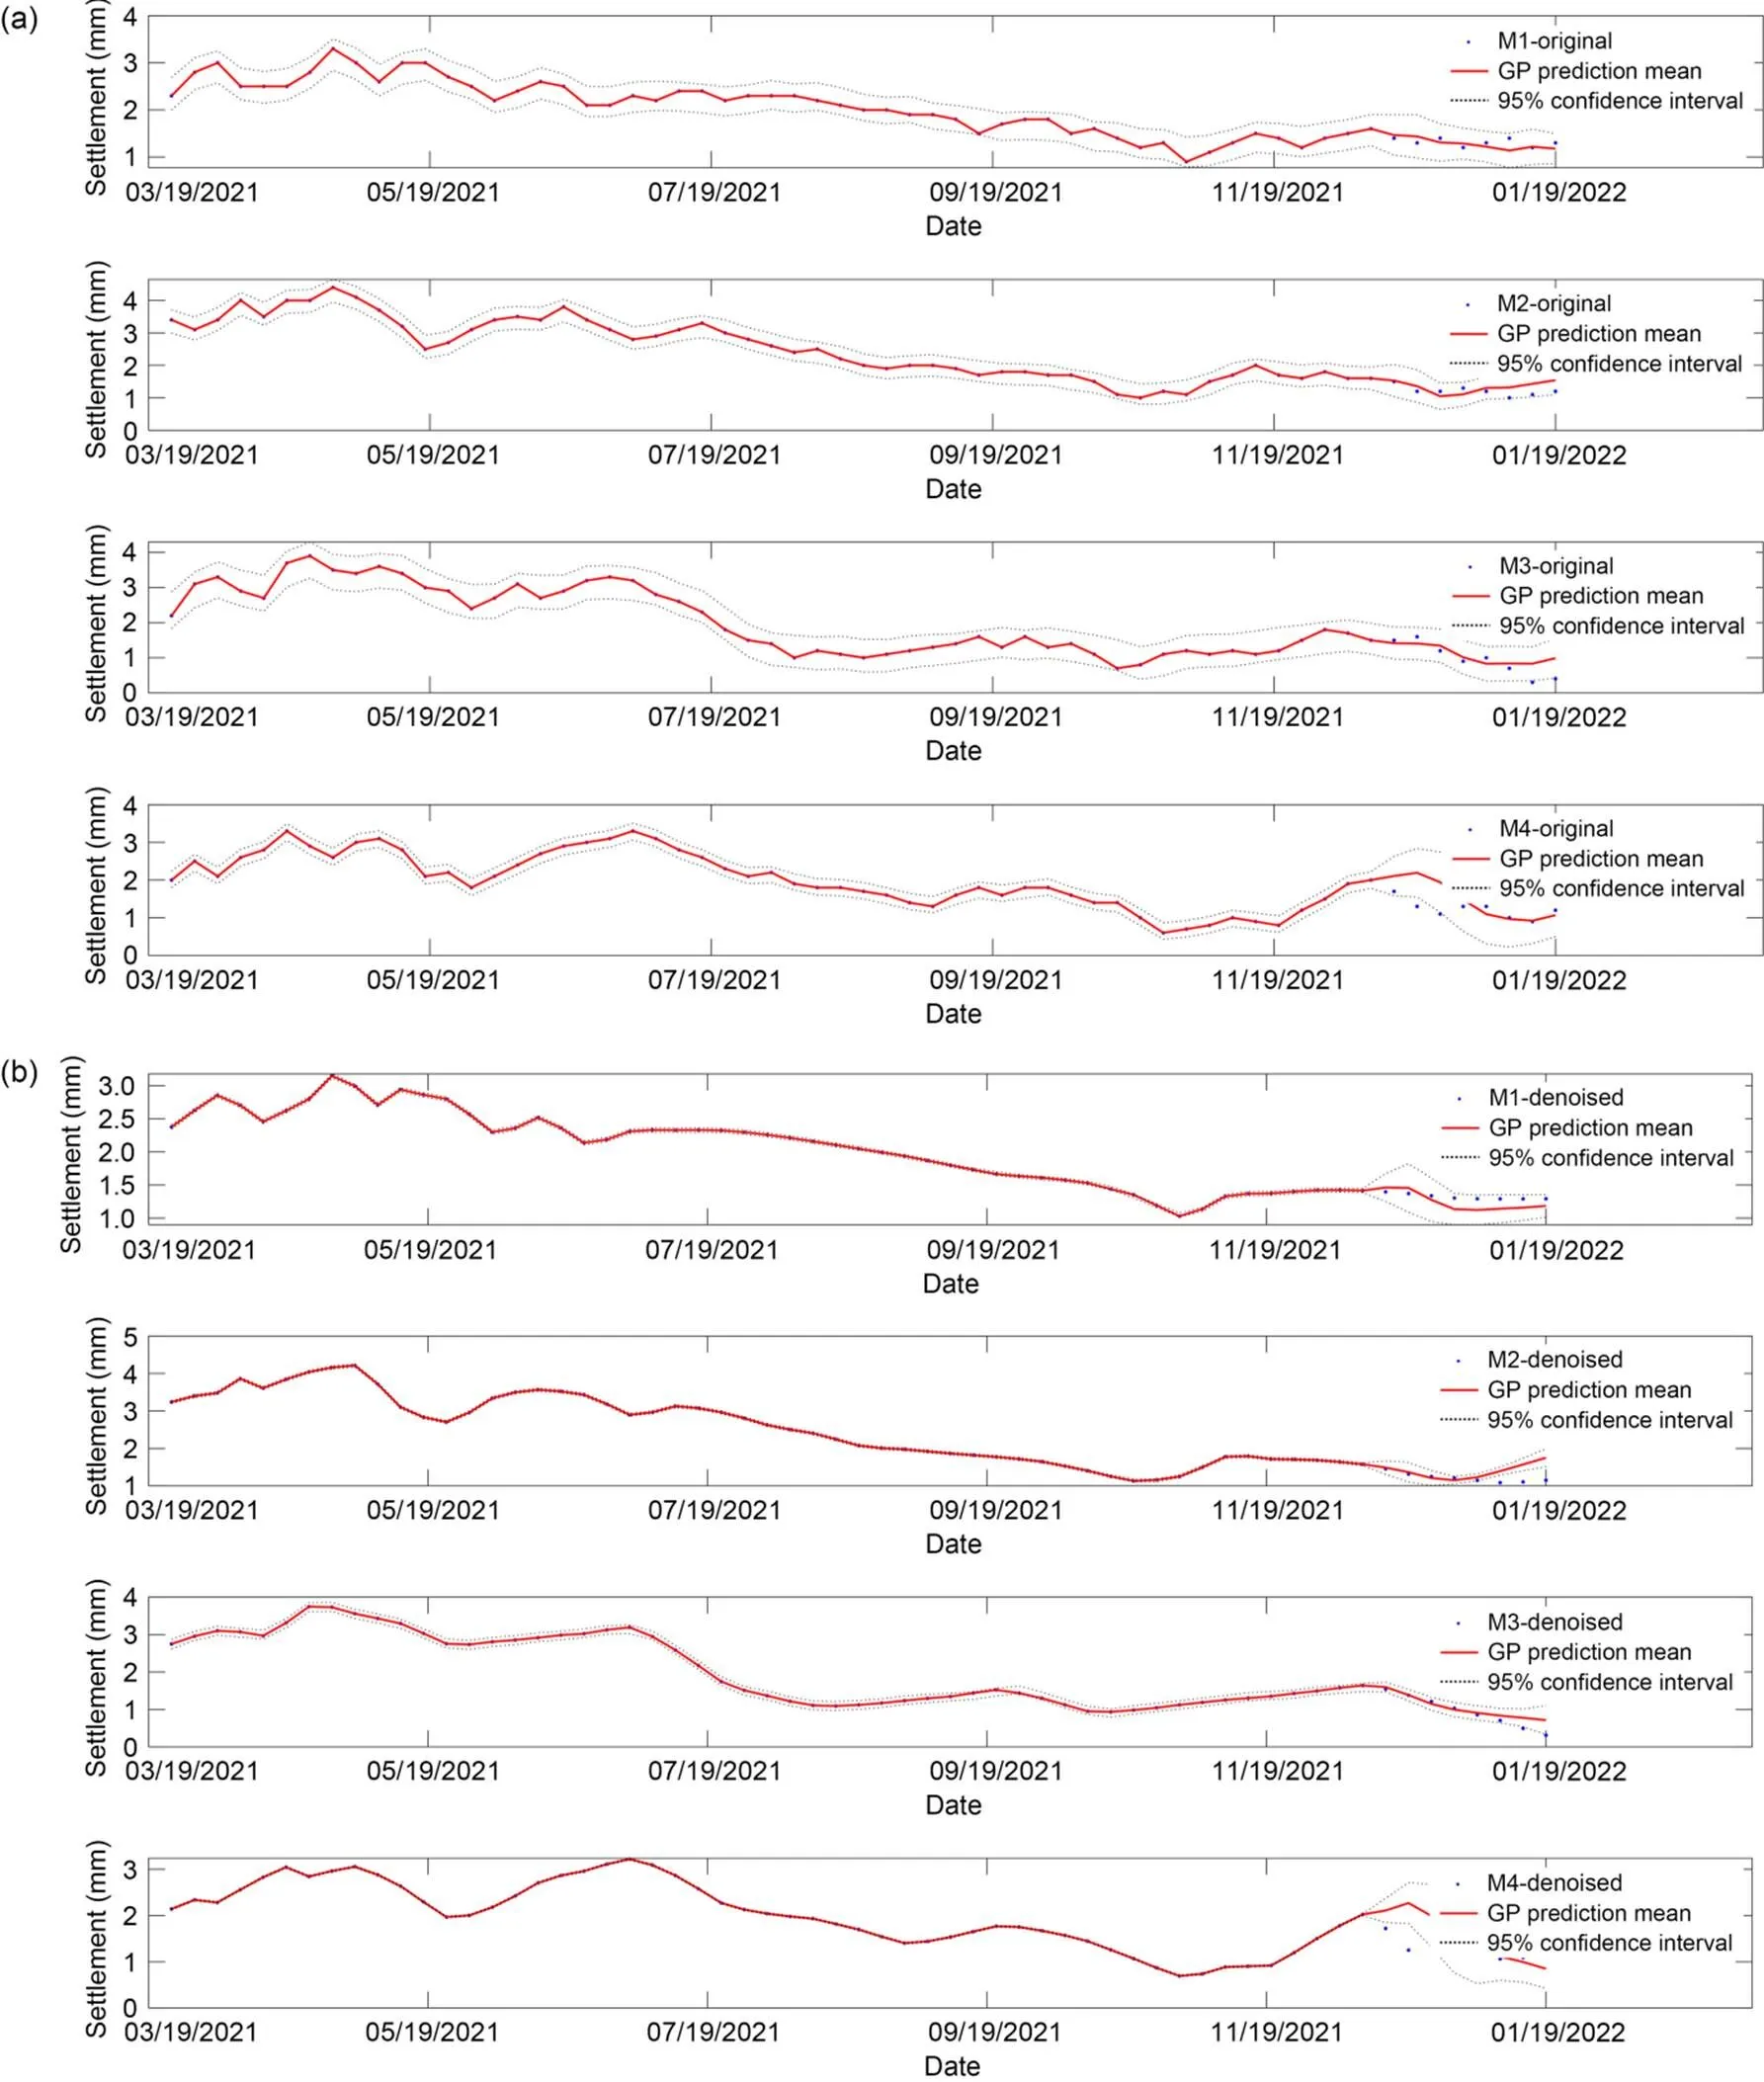
Fig. 11 Settlement probability prediction with a moving window of 10 and predicted ratio of 10%: (a) probability prediction based on original data; (b) probability prediction based on denoised data
In addition, the root mean square error (RMSE) is used to assess the performance of the prediction model in quantitative settlement prediction (Ye et al., 2020).

whereyis the predicted settlement, andMis the measured settlement.
Figs. 12–15 compare the prediction performances for the original data and denoised data using the GPBE model, with different moving windows. The figures demonstrate that as the prediction proportion increases, the prediction performance of the proposed GPBE model gradually deteriorates. This is because higher prediction ratios lead to a decrease in the ratios of the training set, which prevent full mining of the information in the measured data. In addition, different moving windows have different effects on prediction performance because the robustness of moving windows is unstable. The comprehensive calculation results show that a moving window of 5 provides the best prediction performance in the proposed model. Meanwhile, the prediction performance of the proposed model is worse for the original data than for the denoised data produced by WD; the settlement-prediction performance based on WD-GPBE is the best.
4 Conclusions
In this paper, we propose a probability settlement-prediction model with a BE based on the GP with WD, that is, WD-GPBE. A BE probability-prediction model based on GP is derived based on the Bayesian theorem. We discuss the effects of prediction proportion and moving windows on the model's prediction performance. Furthermore, we compare the prediction performances of GPBE and WD-GPBE models, and verify them based on SHM data from the Nanjing Metro. Some conclusions are as follows:

Fig. 12 Influence of moving window and prediction ratios on prediction performance with M1 data: (a) RMSE of M1-original data with GPBE; (b) RMSE of M1-denoised data with GPBE
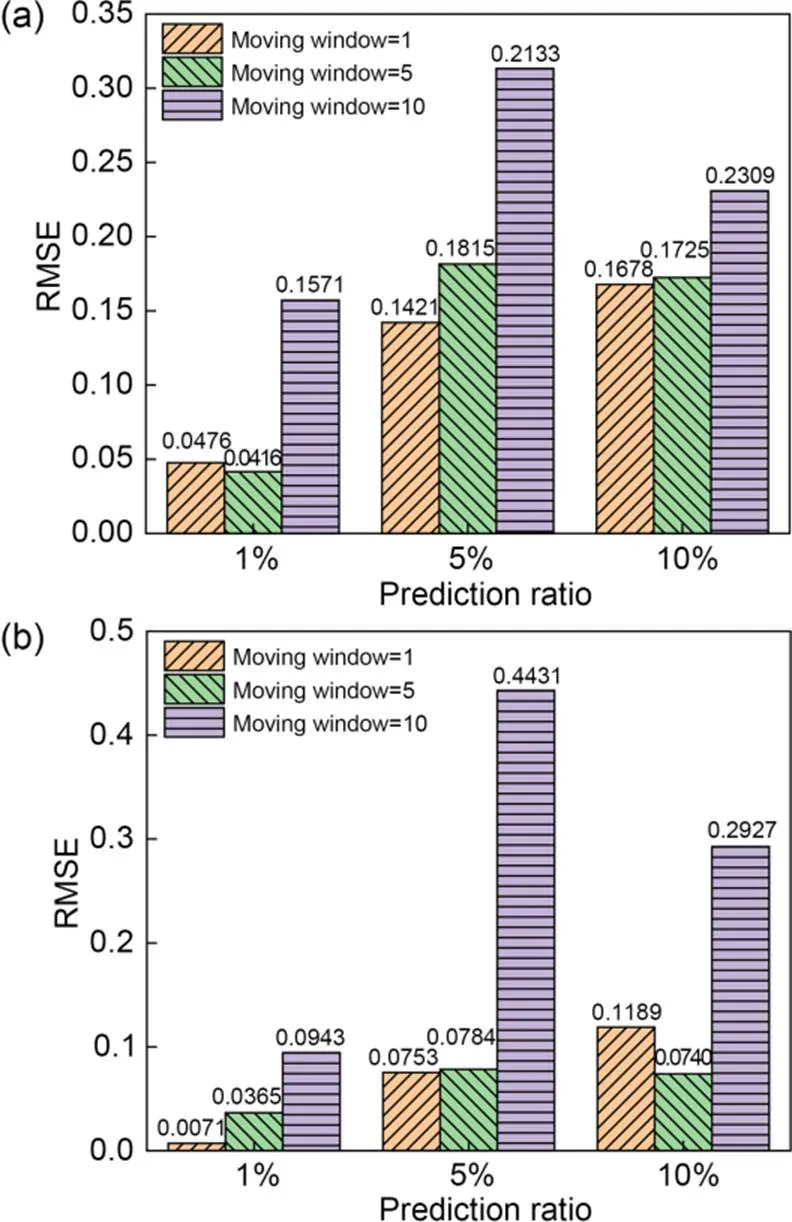
Fig. 13 Influence of moving window and prediction ratios on prediction performance with M2 data: (a) RMSE of M2-original data with GPBE; (b) RMSE of M2-denoised data with GPBE

Fig. 14 Influence of moving window and prediction ratios on prediction performance with M3 data: (a) RMSE of M3-original data with GPBE; (b) RMSE of M3-denoised data with GPBE

Fig. 15 Influence of moving window and prediction ratios on prediction performance with M4 data: (a) RMSE of M4-original data with GPBE; (b) RMSE of M4-denoised data with GPBE
(1) The proposed GPBE probability-prediction model can obtain the development law of settlement and predict settlement change well. The settlement change is within the 95% confidence interval, and thus fully describes the uncertainty of settlement.
(2) The larger the prediction ratios of settlement, the worse the prediction performance of the GPBE model. A moving window of 5 offers the best prediction performance within the model.
(3) The prediction performance of the WD-GPBE model is better than that of the GPBE model, demonstrating that it is necessary to denoise the original settlement-monitoring data before using it in the model.
In future research, we will analyze how to use the proposed model to evaluate the safety status (the useful life) of tunnel structures and improve the settlement warning function.
Acknowledgments
This work is supported by the Humanities and Social Sciences Research Project of Ministry of Education of China (No. 23YJCZH037), the Educational Science Planning Project of Zhejiang Province (No. 2023SCG222), the Foundation of the State Key Laboratory of Mountain Bridge and Tunnel Engineering of China (No. SKLBT-2210), the National Key R&D Program of China (No. 2022YFC3802301), the National Natural Science Foundation of China (No. 52178306), and the Scientific Research Project of Zhejiang Provincial Department of Education (No. Y202248682), China.
Author contributions
Yang DING designed the research. Yang DING and Zhen HAN processed the corresponding data. Yang DING wrote the first draft of the manuscript. Zhi DING, Gang WEI, and Yunliang CUI helped to organize the manuscript. Yang DING, Xiaowei YE, and Tao JIN revised and edited the final version.
Conflict of interest
Yang DING, Xiaowei YE, Zhi DING, Gang WEI, Yunliang CUI, Zhen HAN, and Tao JIN declare that they have no conflict of interest.
Chen RP, Zhang P, Wu HN, et al., 2019. Prediction of shield tunneling-induced ground settlement using machine learning techniques., 13(6):1363-1378. https://doi.org/10.1007/s11709-019-0561-3
Cheng Y, Ye XF, Fujiyama T, 2020. Identifying crowding impact on departure time choice of commuters in urban rail transit., 2020:8850565. https://doi.org/10.1155/2020/8850565
Chitsazan N, Nadiri AA, Tsai FTC, 2015. Prediction and structural uncertainty analyses of artificial neural networks using hierarchical Bayesian model averaging., 528:52-62. https://doi.org/10.1016/j.jhydrol.2015.06.007
Ding LY, Ma L, Luo HB, et al., 2011. Wavelet analysis for tunneling-induced ground settlement based on a stochastic model., 26(5):619-628. https://doi.org/10.1016/j.tust.2011.03.005
Ding Y, Ye XW, Guo Y, 2023a. Data set from wind, temperature, humidity and cable acceleration monitoring of the Jiashao bridge., 13(2-3):579-589. https://doi.org/10.1007/s13349-022-00662-5
Ding Y, Hang D, Wei YJ, et al., 2023b. Settlement prediction of existing metro induced by new metro construction with machine learning based on SHM data: a comparative study., in press. https://doi.org/10.1007/s13349-023-00714-4
Ding Y, Ye XW, Guo Y, 2023c. A multistep direct and indirect strategy for predicting wind direction based on the EMD-LSTM model., 2023:4950487. https://doi.org/10.1155/2023/4950487
Ding Y, Ye XW, Guo Y, et al., 2023d. Probabilistic method for wind speed prediction and statistics distribution inference based on SHM data-driven., 73:103475. https://doi.org/10.1016/j.probengmech.2023.103475
Ding Y, Ye XW, Guo Y, 2023e. Copula-based JPDF of wind speed, wind direction, wind angle, and temperature with SHM data., 73:103483. https://doi.org/10.1016/j.probengmech.2023.103483
Ding Y, Ye XW, Guo Y, 2023f. Wind load assessment with the JPDF of wind speed and direction based on SHM data., 47:2074-2080. https://doi.org/10.1016/j.istruc.2022.12.028
Ding Y, Ye XW, Su YH, et al., 2023g. A framework of cable wire failure mode deduction based on Bayesian network., 57:104996. https://doi.org/10.1016/j.istruc.2023.104996
Farrar CR, Park G, Allen DW, et al., 2006. Sensor network paradigms for structural health monitoring., 13(1):210-225. https://doi.org/10.1002/stc.125
Gómez J, Casas JR, Villalba S, 2020. Structural health monitoring with distributed optical fiber sensors of tunnel lining affected by nearby construction activity., 117:103261. https://doi.org/10.1016/j.autcon.2020.103261
Gong WP, Luo Z, Juang CH, et al., 2014. Optimization of site exploration program for improved prediction of tunneling-induced ground settlement in clays., 56:69-79. https://doi.org/10.1016/j.compgeo.2013.10.008
Hashemi M, Beheshti S, 2010. Adaptive noise variance estimation in BayesShrink., 17(1):12-15. https://doi.org/10.1109/LSP.2009.2030856
Hashemi M, Beheshti S, 2014. Adaptive Bayesian denoising for general Gaussian distributed signals., 62(5):1147-1156. https://doi.org/10.1109/TSP.2013.2296272
He XH, Fang J, Scanlon A, et al., 2010. Wavelet-based nonstationary wind speed model in Dongting lake cable-stayed bridge., 2(11):895-903. https://doi.org/10.4236/eng.2010.211113
Huang SX, Wang XP, Li CF, et al., 2019. Data decomposition method combining permutation entropy and spectral substitution with ensemble empirical mode decomposition., 139:438-453. https://doi.org/10.1016/j.measurement.2019.01.026
Ji ZW, Wang B, Deng SP, et al., 2014. Predicting dynamic deformation of retaining structure by LSSVR-based time series method., 137:165-172. https://doi.org/10.1016/j.neucom.2013.03.073
Jiang XM, Mahadevan S, Adeli H, 2007. Bayesian wavelet packet denoising for structural system identification., 14(2):333-356. https://doi.org/10.1002/stc.161
Jiangsu Provincial Department of Housing and Urban Rural Development, 2015. Technical Specification for Monitoring Measurement of Urban Rail Transit Engineering in Jiangsu Province, DGJ32/J 195‒2015. Jiangsu Provincial Department of Housing and Urban Rural Development, China (in Chinese).
Kong LH, Wu ZC, Chen GH, et al., 2020. Crowdsensing-based cross-operator switch in rail transit systems., 68(12):7938-7947. https://doi.org/10.1109/TCOMM.2020.3019527
Law YZ, Santo H, Lim KY, et al., 2020. Deterministic wave prediction for unidirectional sea-states in real-time using artificial neural network., 195:106722. https://doi.org/10.1016/j.oceaneng.2019.106722
Li SH, Zhang MJ, Li PF, 2021. Analytical solutions to ground settlement induced by ground loss and construction loadings during curved shield tunneling., 22(4):296-313. https://doi.org/10.1631/jzus.A2000120
Li X, Liu X, Li CZ, et al., 2019. Foundation pit displacement monitoring and prediction using least squares support vector machines based on multi-point measurement., 18(3):715-724. https://doi.org/10.1177/1475921718767935
Liang JX, Tang XW, Wang TQ, et al., 2022. Numerical analysis of the influence of a river on tunnelling-induced ground deformation in soft soil., 23(7):564-578. https://doi.org/10.1631/jzus.A2100683
Liu WF, Wu ZZ, Li CY, et al., 2022. Prediction of ground-borne vibration induced by a moving underground train based on excitation experiments., 523:116728. https://doi.org/10.1016/j.jsv.2021.116728
MOHURD (Ministry of Housing and Urban-Rural Development of the People’s Republic of China), 2013. Technical Code for Protection Structures of Urban Rail Transit, CJJ/T 202‒2013. MOHURD, China (in Chinese).
Mu BG, Xie XK, Li X, et al., 2021. Monitoring, modelling and prediction of segmental lining deformation and ground settlement of an EPB tunnel in different soils., 113:103870. https://doi.org/10.1016/j.tust.2021.103870
Ng CWW, Liu GB, Li Q, 2013. Investigation of the long-term tunnel settlement mechanisms of the first metro line in Shanghai., 50(6):674-684. https://doi.org/10.1139/cgj-2012-0298
Ni YQ, Wang YW, Zhang C, 2020. A Bayesian approach for condition assessment and damage alarm of bridge expansion joints using long-term structural health monitoring data., 212:110520. https://doi.org/10.1016/j.engstruct.2020.110520
Qu HF, Wang LH, Feng CL, et al., 2021. Study on deformation and stability of rock-like materials retaining structure during collaborative construction of super-adjacent underground project., 2021:5558544. https://doi.org/10.1155/2021/5558544
Qu K, Xu YY, Huang JX, et al., 2023. Numerical simulation of hydrodynamic characteristics of submerged floating tunnels under the action of focused waves., (04):127-141 (in Chinese). https://doi.org/10.19951/j.cnki.1672-9331.20220425001
Samui P, 2008. Support vector machine applied to settlement of shallow foundations on cohesionless soils., 35(3):419-427. https://doi.org/10.1016/j.compgeo.2007.06.014
Sandham W, Hamilton D, Fisher A, et al., 1998. Multiresolution wavelet decomposition of the seismocardiogram., 46(9):2541-2543. https://doi.org/10.1109/78.709542
Sendur L, Selesnick IW, 2002. Bivariate shrinkage functions for wavelet-based denoising exploiting interscale dependency., 50(11):2744-2756. https://doi.org/10.1109/TSP.2002.804091
Shahin MA, Jaksa MB, Maier HR, 2005. Neural network based stochastic design charts for settlement prediction., 42(1):110-120. https://doi.org/10.1139/T04-096
Sysyn M, Nabochenko O, Kovalchuk V, 2020a. Experimental investigation of the dynamic behavior of railway track with sleeper voids., 28(3):290-304. https://doi.org/10.1007/s40534-020-00217-8
Sysyn M, Gerber U, Kluge F, et al., 2020b. Turnout remaining useful life prognosis by means of on-board inertial measurements on operational trains., 8(4):347-369. https://doi.org/10.1080/23248378.2019.1685918
Sysyn M, Przybylowicz M, Nabochenko O, et al., 2021a. Identification of sleeper support conditions using mechanical model supported data-driven approach., 21(11):3609. https://doi.org/10.3390/s21113609
Sysyn M, Przybylowicz M, Nabochenko O, et al., 2021b. Mechanism of sleeper–ballast dynamic impact and residual settlements accumulation in zones with unsupported sleepers., 13(14):7740. https://doi.org/10.3390/su13147740
Tay DB, 2021. Sensor network data denoising via recursive graph median filters., 189:108302. https://doi.org/10.1016/j.sigpro.2021.108302
Wang CH, Wang K, Tang DF, et al., 2022. Spatial random fields-based Bayesian method for calibrating geotechnical parameters with ground surface settlements induced by shield tunneling., 17:1503-1519. https://doi.org/10.1007/s11440-021-01407-2
Wang F, Gou BC, Qin YW, 2013. Modeling tunneling-induced ground surface settlement development using a wavelet smooth relevance vector machine., 54:125-132. https://doi.org/10.1016/j.compgeo.2013.07.004
Wang MS, van der Schaar M, 2006. Operational rate-distortion modeling for wavelet video coders., 54(9):3505-3517. https://doi.org/10.1109/TSP.2006.879273
Wu YQ, Wang K, Zhang LZ, et al., 2018. Sand-layer collapse treatment: an engineering example from Qingdao Metro subway tunnel., 197:19-24. https://doi.org/10.1016/j.jclepro.2018.05.260
Xiang YY, Jiang ZP, He HJ, 2008. Assessment and control of metro-construction induced settlement of a pile-supported urban overpass., 23(3):300-307. https://doi.org/10.1016/j.tust.2007.06.008
Yao YP, Qi SJ, Che LW, et al., 2018. Postconstruction settlement prediction of high embankment of silty clay at Chengde airport based on one-dimensional creep analytical method: case study., 18(7):05018004. https://doi.org/10.1061/(ASCE)GM.1943-5622.0001191
Ye XW, Ding Y, Wan HP, 2019. Machine learning approaches for wind speed forecasting using long-term monitoring data: a comparative study., 24(6):733-744. https://doi.org/10.12989/sss.2019.24.6.733
Ye XW, Ding Y, Wan HP, 2020. Statistical evaluation of wind properties based on long-term monitoring data., 10(5):987-1000. https://doi.org/10.1007/s13349-020-00430-3
Ye XW, Ding Y, Wan HP, 2021. Probabilistic forecast of wind speed based on Bayesian emulator using monitoring data., 28(1):e2650. https://doi.org/10.1002/stc.2650
Zhang LM, Wu XG, Ji WY, et al., 2017. Intelligent approach to estimation of tunnel-induced ground settlement using wavelet packet and support vector machines., 31(2):04016053. https://doi.org/10.1061/(ASCE)CP.1943-5487.0000621
题目:基于小波-贝叶斯的隧道短期沉降预测:一种概率分析方法
作者:丁杨1,2,3,叶肖伟4,丁智1,魏纲1,崔允亮1,韩震5,金涛1
机构:1浙大城市学院,土木工程学系,中国杭州,310015;2浙大城市学院,城市基础设施智能化浙江省工程研究中心,中国杭州,310015;3浙大城市学院,浙江省城市盾构隧道安全建造与智能养护重点实验室,中国杭州,310015;4浙江大学,建筑工程学院,中国杭州,310058;5南京地铁运营有限责任公司,中国南京,210012
目的:隧道沉降是会严重影响隧道结构及其临近建筑的安全隐患。本文旨在建立一种沉降预测模型用于实时预测南京地铁隧道的沉降情况,并通过探讨沉降数据的预处理方法和所提模型中的网络结构(移动窗口和预测比例)对预测性能的影响,确定模型的最优结构组成。
创新点:1. 考虑未知沉降值的不确定性,并结合高斯先验和协方差函数推导出沉降预测值的均值和方差表达式;2. 基于现场实测数据,验证所提出模型的有效性。
方法:1. 通过理论推导,构建考虑沉降不确定性的贝叶斯预测模型,并结合高斯先验过程计算得到沉降预测值的均值和方差表达式;2. 通过南京地铁现场实测数据验证所提模型的有效性,并通过参数敏感性分析,确定最优移动窗口及预测比例;3. 通过数值计算,探讨数据预处理方法对模型预测精度的影响。
结论:1. 本文提出的概率预测模型能够预测沉降的发展规律,且沉降变化值均在95%的置信区间内。2. 移动窗口过大会导致概率预测模型过拟合,而移动窗口过小则会导致概率预测模型欠拟合;针对本文的沉降数据,最佳移动窗口为5。3. 对原始沉降数据进行小波降噪处理,能够提高概率预测模型的预测精度。
关键词:地铁建设;沉降概率预测;结构健康监测;小波去噪;高斯先验;贝叶斯仿真
https://doi.org/10.1631/jzus.A2200599
https://doi.org/10.1631/jzus.A2200599
© Zhejiang University Press 2023
Dec. 20, 2022;
May 27, 2023;
Oct. 23, 2023
猜你喜欢
成都信息工程大学学报(2019年3期)2019-09-25
文化交流(2019年1期)2019-01-11
农经(2018年10期)2018-10-10
自动化学报(2017年5期)2017-05-14
数理化解题研究(2017年4期)2017-05-04
铁道通信信号(2016年6期)2016-06-01
电子器件(2015年5期)2015-12-29
探测与控制学报(2015年4期)2015-12-15
东南法学(2015年2期)2015-06-05
郑州大学学报(理学版)(2014年2期)2014-03-01
 Journal of Zhejiang University-Science A(Applied Physics & Engineering)2023年11期
- Journal of Zhejiang University-Science A(Applied Physics & Engineering)的其它文章
- Core-drilling kinematic modeling and analysis of Jiaolong submersible manipulator
- Effect of carbon dioxide concentration on the combustion characteristics of boron agglomerates in oxygen-containing atmospheres
- Experimental investigation on cenosphere-aluminum syntactic foam-filled tubes under axial impact loading
- Correlation between travel experiences and post-COVID outbound tourism intention: a case study from China
- Advances in micro-nano biosensing platforms for intracellular electrophysiology
- Biomaterial types, properties, medical applications, and other factors: a recent review