Choroidal thickness measurements in young Saudi adult population: a cross-sectional study
Mohammed M Althomali, Ahmed A Alharbi, Nouf M Albnayan, Abdulaziz M Alkhudhair,Muteb K Alanazi
Optometry Department, College of Applied Medical Sciences,King Saud University, Riyadh 11362, Saudi Arabia
Abstract
● KEYWORDS: choroidal thickness; optical coherence tomography; young adults; Saudi population
INTRODUCTION
The choroid is the posterior part of the uvea that lies between the retina and sclera.It primarily consists of blood vessels that supply the outer retina.The choroid has several other essential functions, including light absorption,thermoregulation, and the modulation of intraocular pressure[1].Several ocular conditions have been reported to be associated with changes in choroidal thickness (CT), which indicates the significant role of CT in the pathophysiology of ocular diseases that affects the retina.Choroidal thinning was reported to be associated in patients with pathological myopia[2-3], agerelated macular degeneration[4], diabetic retinopathy[5-7], and glaucoma[8].On the other hand, choroidal thickening was observed in ocular conditions such as chronic central serous choroioretinopathy[9-10], and Vogt-Koyanagi-Harada disease[11].More current evidence suggests that the choroid act as a regulator for axial ocular growth through communicating information from the retina to the sclera[12-13].
The recent technological advances in ocular imaging,specifically in optical coherence tomography (OCT), allowed anin vivonon-invasive CT measurement to be applicable.A large number of studies explored the morphology and distribution of CT in different population-based and in a variety of ocular diseases[3-20].The CT varies significantly based on the fundus quadrant and eccentric location (fovea versus periphery)[14-15].Typically, the choroid is thickest in the subfoveal regions and progressively thins in the peripheral regions.Quadrant wise, the superior choroid normally is the thickest, whereas the nasal choroid is the thinnest[14-15].

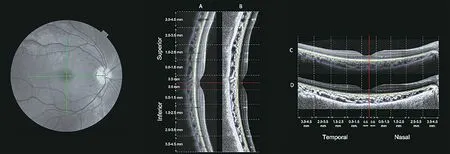
Figure 1 A representative fundus photo showing the location of the cross-section optical coherence tomography single line scans that are centered on fovea (green lines) The corresponding scans single line vertical [original vertical (A) and enhanced contrast vertical (B)], and the horizontal scans [original horizontal (C) and enhanced contrast horizontal (D)].The red lines indicate the location of the foveal pit.The green and blue lines indicate the anterior and posterior boundaries of the choroid, respectively.
Retinal thickness measurements have become essential in the diagnosis, follow-up, and monitoring response to treatment of a variety of ocular conditions.In recent years, CT measurements have also become a subject of interest.CT is significantly influenced by several factors, such as ethnicity, refractive error,and age[16].Many population-based studies investigated the normal range of CT.According to these studies, the range of subfoveal CT in healthy adults was reported to be from 242 to 370 μm[17-26].
There are no published reports on normal CT across a wide fundus area in the young adult Saudi population.Therefore, the aim of this study is to determine the CT regional variations in healthy young adult Saudi individuals.
SUBJECTS AND METHODS
Ethical ApprovalEthics clearance was obtained from the research Ethics Board at King Saud University.All the procedures conducted in this study were in compliance with the tenets of the Declaration of Helsinki.Informed consent was obtained from each participant before data acquisition.
ParticipantsIn this cross-sectional study, 77 individuals participated.Our sample consisted of healthy younger adults who did not suffer any visual impairment.Nineteen participants were excluded due to low image quality that hindered accurate evaluation of their CT.The participants were screened before they were enrolled in the study.All the participants were residents of Riyadh City, Saudi Arabia.
Preliminary data were collected, and this includes general and ocular health history, medication, smoking habits, and caffeine intake.Individuals who suffered from any ocular disease,smokers, and pregnant women were excluded.
ProcedureCT was evaluated using the Topcon Maestro 3-D spectral-domain OCT (Topcon.com).The scanning speed of the OCT was 50 000 A-scans per second.The transverse and axial resolutions were 20 and 6 µm, respectively.Three horizontal and three vertical consecutive 9-mm high-resolution single line scans were collected from each eye in the same location.All OCT scans were centred on the fovea.All OCT scans were taken under nonmydriatic conditions.Due to the reported regional variations in CT[14-15,27], CT was evaluated in five eccentric locations (i.e., fovea, parafovea, perifovea,near-periphery, and peripheral region) and in all four quadrants(superior, temporal, inferior and nasal) 4.5 mm from the foveal pit (Figure 1).
Only OCT scans with a minimum of 30 averaged b-scans were analyzed.The CT was determined as the linear measurement of depth between the hyper-reflective line of the retinal pigment epithelium (RPE) to the inner scleral border.Α quantification software developed by Alonso-Caneiroet al[28]and Readet al[29]was used to determine the CT.An incorporated image contrast enhancement feature was used to improve the visualization of the choroidoscleral junction line (Figure 1B, 1D)[30].All OCT scans were analyzed by three experienced clinicians.The measurements by the three independent raters were significantly identical; the intraclass correlation coefficients(ICC) were obtained using a two-way mixed-effects model for measurements of the absolute agreement.The ICC and 95%confidence intervals (CI) were 0.98 (0.97–0.99) between the three raters.
The automated software provides 185 thickness data points per 1-mm in lateral width (i.e., a total of 1760 data points from each OCT scan).Following the OCT scans segmentation, we used each participant’s axial length to correct the transverse scaling to account for ocular magnification using a method previously described by Readet al[31].According to the predefined eccentricities, the thickness data points were averaged to obtain the thickness value of each region.

Table 1 Demographic and ocular characteristics of participants’ right eyes mean±SD (min, max)
The measurements of axial length were obtained by the noncontact partial coherence laser interferometry (IOL-Master)(Zeiss.com).The axial length was defined as the distance from the anterior corneal surface to the RPE.Ten repeated measurements of the axial length were gathered, and five readings with a signal-to-noise ratio greater than seven were selected and averaged for data analysis.The auto-refractometer KR-8800 (Topcon.com) was used to obtain the non-cycloplegic refraction data.
Statistical AnalysisThe data normality was checked using Kolmogorov-Smirnov normality test.Analysis of variance and pairedt-tests were used to compare the regional variation in the CT, including the within-subject factors of laterality (2 levels),choroidal eccentricity (5 levels) and quadrant (4 levels).Bonferroni correction for multiple comparisons was applied when appropriate.Pearson correlation was used to study the relationship between refractive error and the CT.AP-value of<0.05 was considered statistically significant.All Statistical analysis was performed using SPSS version 28 (SPSS Institute Inc, Chicago, Illinois, USA).All data are expressed as mean and standard deviations.
RESULTS
Data from 116 eyes (58 participants; 39 males and 19 females)were used in the analysis.The mean age was 22.65±3.9y, and the mean refractive error was -1.6±2.06 D.Demographics and ocular characteristics of participants are listed in Table 1.
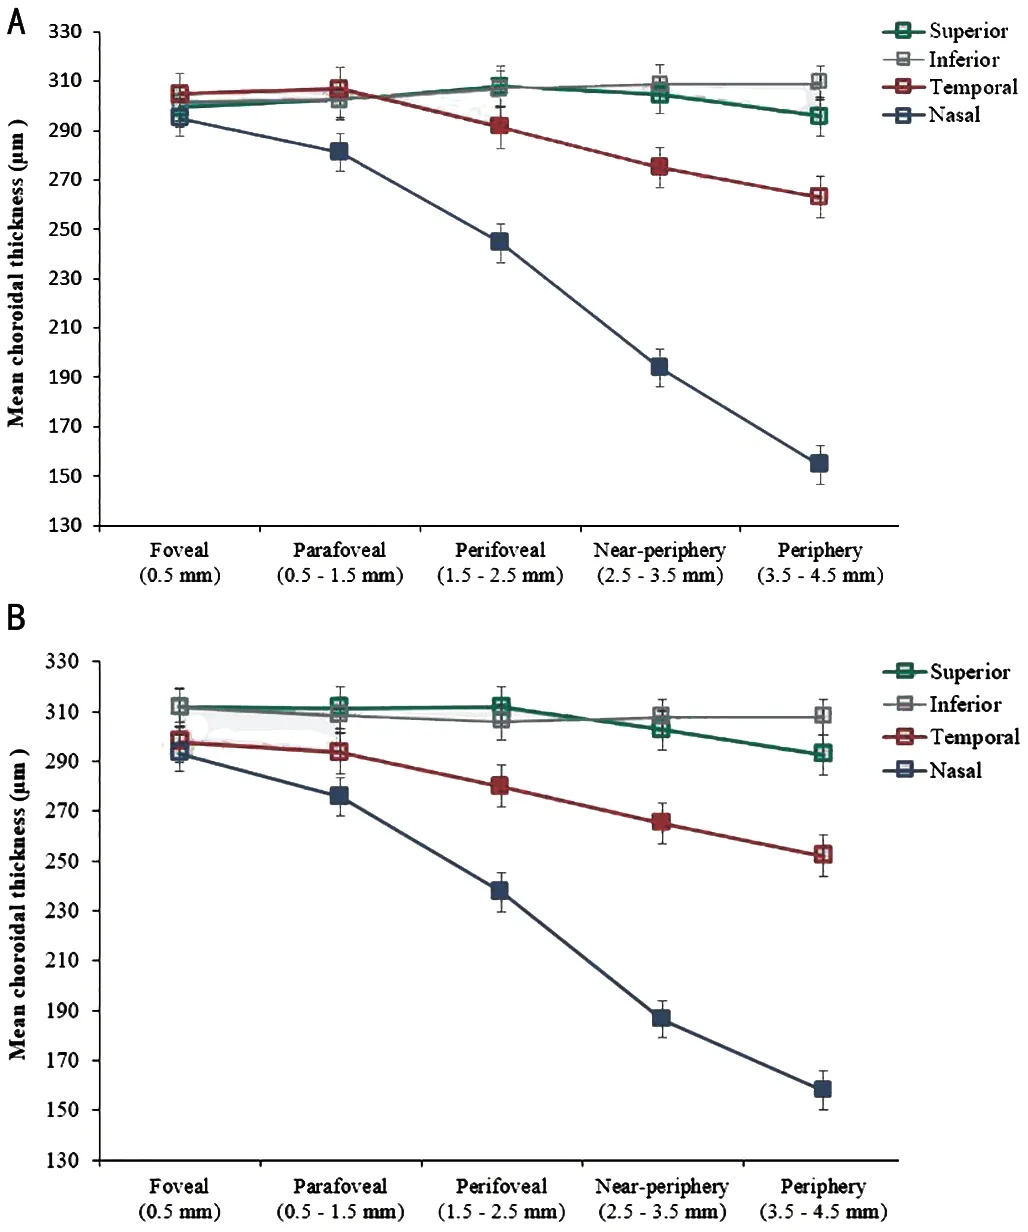
The overall CT in the entire sample was 280±72 µm.The results showed no significant difference between the right and left eyes in CT (right eyes; 279±73 µm and left eyes; 277±72 µm,P=0.16) and between male and female participants (male; 271±71 µm and female; 277±77 µm,P=0.37).The distribution of CT varied significantly with fundus quadrant and eccentricity (bothP<0.001).The mean of subfoveal CT of the right eyes (central 1 mm region) was 298±63 µm, parafoveal (0.5–1.5 mm, 295±65 µm), perifoveal(1.5–2.5 mm, 284±70 µm), near-periphery (2.5–3.5 mm,267±77 µm), and periphery (3.5–4.5 mm, 254±86 µm).The progressive thinning towards the periphery was observed only beyond the perifovea.The CT was significantly different in all quadrants (allP<0.01 for all pairwise comparisons).The superior (303±62 µm) and nasal choroid (233±79 µm)exhibited the thickest and thinnest choroid profile, respectively.The overall inferior and temporal choroid were 306±59 and 288±67 µm, respectively.

Table 2 Association between choroidal thickness in right eyes and myopia using a univariate linear mixed model
The rate of progressive thinning in the CT differed based on quadrant (quadrant x eccentricity interaction,P<0.001).Significant thinning toward peripheral regions was observed in the nasal and temporal choroid in the right and left eyes.The nasal choroid of the right eyes exhibited the most thinning from the foveal (295±61 µm) to the nasal peripheral region(154±62 µm).The CT in the superior quadrant of the right eyes did not vary significantly across the measured eccentric regions(301±65 µm in the central to 296±66 µm in the periphery).Similar results were observed in the left eyes (Figures 2).
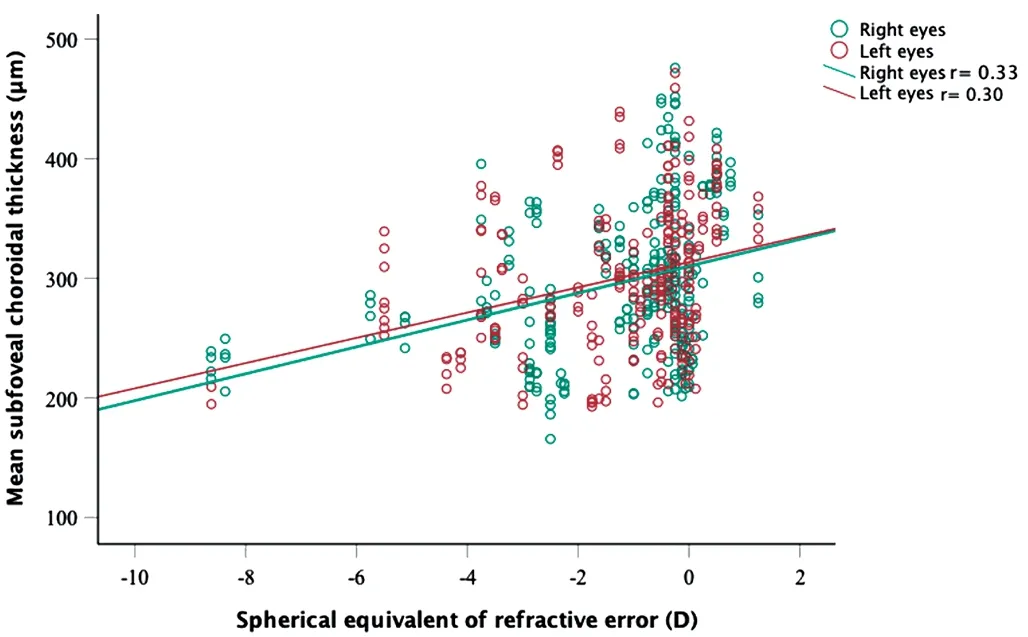
In the univariate linear mixed model, the overall CT decreased by approximately 10.3 µm for every one diopter of myopia(Table 2).No significant change in the CT was observed based on age in this study (P=0.1).
DISCUSSION
The choroid is a highly vascular structure that plays the role of nutrient provider to posterior ocular structures.In recent years, CT has been suggested to be a valuable biomarker in diagnosing and monitoring several retinal conditions.The main purpose of the present study was to determine the CT profile among healthy young Saudi adults.In this study, we examined the CT in 110 eyes of 58 young adult Saudi individuals.
There are three studies that explored CT in the Saudi population[32-34].Farhanet al[32]included 110 young adult participants and measured the CT at three locations (subfoveal and 750 µm nasally and temporally) using OCT with confocal scanning laser ophthalmoscopy.The subfoveal CT reported by their group was comparable with what was found in our study(306±47 µm and 300±60 µm, respectively).The second study only explored the CT in healthy Saudi women, which reported the subfoveal CT to be 285±31 µm, whereas the subfoveal CT in the female participants of the current study was 308±60 µm[33].The most recent study was conducted by Al Marshoodet al[34].The mean of subfoveal CT in 144 participants was 329±57 µm.All studies have relied on the average of three single data points that were obtained from three OCT scans to measure the CT in several locations.All measured CT within the central 4-mm region, and none of the studies has explored the CT in the peripheral regions and the CT profile in the superior and inferior quadrants.In the current study, a total area of the central 9.5 mm horizontally and vertically of the choroid was investigated.Additionally, the current study relied on hundreds of datapoint that was obtained from each OCT image using a semiautomated method in detecting choroidal boundaries.
The topographical variations in the CT are dependent on the quadrant and eccentricity.Several reports showed that the superior choroid is the thickest[14-15,35].The topographical variations in CT that were observed in quadrants and eccentric locations can be explained by several factors.First, the variations in choroidal vessel size in different regions.It has been found that the CT was significantly correlated with the diameter of choroidal vasculature and the ratio of horizontal to vertical choroidal veins diameter[36-37].Second, the asymmetry in choroidal veins distribution and location, with the superiortemporal choroid being the preferred choroidal venous drainage pathway[38].Third, the density of choroidal microvascular and large vascular components differs depending on eccentric locations, with higher choroidal vascular density in the central fovea and lower density in the periphery[39-41].
A large number of studies reported a significant negative association between CT and the degree of myopia.The association is explained by the axial elongation and ocular stretching that myopic and highly myopic eyes experience[14].In this study, a significant correlation between CT and refraction was found (Figure 3).The univariate regression showed there was a decrease of 10.8 µm for each diopter increase of myopia.Similar findings were reported by studies conducted on Saudis[32]and other populations[22].In our study,the correlation between the refractive error and the CT varied based on eccentricity.Subfoveal CT showed to be the region to be the most significantly associated with refraction.The correlation weakened with increasing eccentricity.

Figure 2 Mean choroidal thickness (μm) of right eyes (A) and left eyes (B) was measured in four quadrants as a function of choroidal eccentricity Error bars represent the standard error of the mean.Filled symbols represent a statistically significant difference (P<0.05,Bonferroni) in a given choroidal eccentricity compared to the adjacent eccentricity to the left.

Figure 3 Scatterplot showing the correlation between subfoveal choroidal thickness and refraction.
In this study, no correlation was found between CT and age.Previous reports showed inconsistent associations between CT and age.Some reports found a decreased CT with increasing age[18,42-43].A decrease of 11.9 µm in subfoveal CT for each decade increase in age was reported[44].Those studies included participants older than 40 and up to 90 years of age.The microvascular loss occurring with age among the elderly could explain the choroidal thinning associated with age.In a younger population, a positive correlation with age was found,which indicates continuous choroidal thickening with age,and this plateaus in adolescence[31,43].The observed lack of correlation between the CT and age in our study is likely due to the limited age range (mean±SD; 22.6±3.9, range: 19–38y) of participants in this study to detect any significant correlation.Similar findings were reported by Xieet al[18]where only a group of individuals over the age of 50y showed a significant negative correlation between subfoveal CT and age, where the group younger than 50y, no significant correlation was noted.
To our knowledge, this was the first study to investigate the CT morphology in the young Saudi population that explored all quadrants and up to 4.5 from the foveal region.Although,several limitations to this study need to be acknowledged.First, only horizontal and vertical single-line OCT scans were used to collect the CT data.However, volumetric imaging would offer additional information about the thickness profile and its regional variation across the choroid.Second, the study only included young adults.It is established that CT is negatively correlated with age.The generalization of the results may be limited due to the narrow age range in this study.Future studies investigating the CT in a wide range of age in the Saudi population, including older adults, are warranted.Lastly, the majority of subjects in this study were males (67%),although no significant difference between age and the baseline ocular characteristics was found.Αlso, the CT profile was not different between male and female participants.
In conclusion, the findings demonstrated the CT profile in healthy young Saudi adults, which showed a quadrant- and eccentricity-dependent pattern.The superior choroid exhibited to be the thickest, whereas the nasal quadrant was shown to be the thinnest.The CT progressively thinned towards the peripheral regions, and the rate of thinning was predominated in the nasal choroid.The CT was negatively correlated with refractive error.
ACKNOWLEDGEMENTS
The authors extend their appreciation to the Deanship of Scientific Research, College of Applied Medical Sciences Research Center at King Saud University for funding this work.Special thanks to the Contact Lens and Visual Optics Laboratory, Queensland University of Technology, Australia,for sharing the technological support for measuring CT.
Conflicts of Interest:Althomali M, None;Alharbi A,None;Albnayan N, None;Alkhudhair A,None;Alanazi M,None.
 International Journal of Ophthalmology2023年11期
- International Journal of Ophthalmology的其它文章
- Quantitative analysis of optic disc changes in school-age children with ametropia based on artificial intelligence
- Association analysis of Bcll with benign lymphoepithelial lesions of the lacrimal gland and glucocorticoids resistance
- In vitro protective effect of recombinant prominin-1 combined with microRNA-29b on N-methyl-D-aspartateinduced excitotoxicity in retinal ganglion cells
- Bioinformatics and in vitro study reveal the roles of microRNA-346 in high glucose-induced human retinal pigment epithelial cell damage
- Therapeutic effect of folic acid combined with decitabine on diabetic mice
- Comparison of visual performance with iTrace analyzer following femtosecond laser-assisted cataract surgery with bilateral implantation of two different trifocal intraocular lenses
