Quantitative analysis of optic disc changes in school-age children with ametropia based on artificial intelligence
Fang Liu, Xing-Hui Yu, Yu-Chuan Wang, Miao Cao, Lian-Feng Xie, Jing Liu, Lin-Lin Liu
1The First Clinical Medical College of Gannan Medical University, Ganzhou 341000, Jiangxi Province, China
2Department of Ophthalmology, the First Affiliated Hospital of Gannan Medical University, Ganzhou 341000, Jiangxi Province, China
Abstract
● KEYWORDS: optic disc; artificial intelligence; ametropia;peripapillary atrophy; spherical equivalent
INTRODUCTION
Myopia is one of the most common eye diseases throughout the world.It has been predicted that by 2050 there will be 4.758 billion people with myopia (49.8%of the world’s total population) and 938 million people with high myopia (9.8% of the world’s total population).The rapid increase in the myopia population has become a global public health problem[1].High myopia is usually defined as spherical refractive errors less than -6.00 diopters (D) or ocular axial length (AL) more than 26 mm[2].Elongation of the AL and thinning of the retina, which often cause a series of degenerative changes in the fundus of pathological myopia,such as fundus tessellation (FT), temporal peripapillary chorioretinal atrophy, posterior scleral staphyloma, lacquer crack, myopic retinoschisis, and macular degeneration, is one of the common causes of blindness in China[3-4].The high prevalence of high myopia will lead to an increase in the prevalence of pathological myopia in the future, and the vision loss caused by pathological myopia is irreversible[5].In recent years, the application of artificial intelligence (AI)has shown great potential in the discovery and diagnosis of early fundus lesions.It can not only extract accurate data from color fundus photography but also predict the progression of lesions[6], which brings “low investment and high yield” and great convenience to clinical screening[7].In this study, color fundus photography combined with AI technology was used to quantitatively analyze the relationship between spherical equivalent (SE), defined as the spherical degree plus one half of the cylindrical degree, and optic disc morphological changes in school-age children with ametropia.
SUBJECTS AND METHODS
Ethical ApprovalThe study protocol was approved by the First Affiliated Hospital of Gannan Medical University Institutional Review Board (No.LLSL-2022091303) for retrospective analysis.
DataA total of 226 eyes of 113 school-going children aged 6–12y were enrolled in the study from October 2021 to May 2022 in the First Affiliated Hospital of Gannan Medical University.According to SE data, the patients were divided into four groups: 66 eyes in the low myopia group SE refraction -0.50 to -2.75 D, 60 eyes in the moderate myopia group (SE refraction of -3.00 to -6.00 D), 50 eyes in the high myopia group (SE refraction -6.25 to -10.00 D) and 50 eyes in control group (SE refraction of +0.25 to -0.25 D).All experimental groups in the study included children who were diagnosed with refractive error and normal corrected vision after dilation of the pupils.Additionally, children with emmetropia were included in the control group for this study.Exclusion criteria included: 1) amblyopia; according to the consensus of amblyopia diagnosis experts in 2011[8], best corrected visual acuity (BCVA) of both eyes lower than the corresponding age for amblyopia: <0.6 for 4–5 years old, <0.7 for 6–7 years old, and <0.8 for more than 7 years old; 2) The anisometropia is more than 1.0 D between the two eyes; 3)refractive stromal opacity, which affected the imaging effect;4) a history of systemic diseases and ophthalmic diseases; 5) a history of eye surgery and trauma; 6) difficulty with analyzing the quality of the collected image; 7) inability to cooperate with the examination.
Methods
Routine examinationThis study was a retrospective casecontrol study, detailed and comprehensive ophthalmic examination was performed on all subjects, including un-aided eye visual acuity, BCVA, dilated pupil optometry, intraocular pressure (IOP), slit lamp examination, fundus examination,ocular axis measurement, and color fundus photography.An ophthalmic optical biometrics instrument (IOL Master 500;Carl Zeiss Meditec, Jena, Germany) was used to measure the ocular axis.The ocular axis was measured continuously five times using the lens mode, and the average value was taken.A retinal camera (Canon CX-1; Canon Corp, Tokyo, Japan) was used for fundus color photography, and an AI system was used to quantitatively analyze fundus nerves and blood vessels.
AI data collectionThe color fundus photograph intelligent analysis software [EVisionAI, EVision technology (Beijing)Co.Ltd.][9-10]was used to analyze color fundus photographs.Based on the human visual bionic mechanism, the software deeply integrated AI image processing technologies such as computer vision and deep learning.For the color fundus photograph to be processed, it first carries out region of interest(ROI) extraction, de-noising, normalization, enhancement and other pre-processing operations[11-13]to remove the nonfundus structural areas of the images, reduce the differences between the images, and improve the sharpness of the fundus feature edges.Then it combines the depth target detection network with the computer vision edge extraction algorithm.In this way, optic disc and optic cup are finely segmented[12-13].In terms of peripapillary atrophy (PPA) and blood vessel recognition, the software adopts deep learning segmentation network model ResNet101-UNet for segmentation, and divides arterial vessels and venous vessels based on the color, brightness, texture, and mutual links and topological relationships of fundus blood vessel features[14].Then, based on the segmentation results, the diameter and area of optic cup and optic disc, cup-to-disc ratio (C/D), vascular diameter, curvature,arteriovenous ratio and other indicators were measured, so as to achieve a comprehensive digital description of color fundus photographs and structures.The feature recognition results in the quantitative analysis were tested using the data of the test set, and the segmentation and extraction accuracy of optic disc,optic cup, PPA and blood vessel were respectively measured.The accuracy of feature recognition for each result was ≥0.96,sensitivity ≥0.85, and specificity ≥0.96 (Figure 1).We aim to better understand fundus abnormalities based on AI image processing, and conduct intelligent assessment and detection of related fundus diseases.At the same time, the fundus structure or abnormal progression of fundus were objectively and carefully monitored according to the data (Figure 2).
Statistical AnalysisSPSS20.0 software (Statistics 20 software;SPSS Inc, Chicago, IL, USA) was used for statistical analysis,and statistical data were compared between the two groups withχ2test.A one-way ANOVA was used to compare data among multiple groups, and least squared difference was used for multiple comparisons after the event.P<0.05 indicated that the difference was statistically significant.
RESULTS
Comparison of Basic DataTable 1 shows the comparison of age, gender, IOP, SE, and AL of the four groups of school-age children.There were no significant differences in age and sex among the four groups (P>0.05).Pairwise comparisons of SE and ΑL between the four groups showed significant differences(P<0.05).
Quantitative Analysis and Comparison of Optic Disc Morphology in Children with Different Refractive StatesThere were no significant differences in the superior and inferior neuroretinal rim width, and vertical C/D among the four groups(P>0.05).Compared with the other three groups, the nasal and temporal neuroretinal rim width in the high myopia group was statistically significant different (P<0.05).The roundness of the optic disc among the four groups was different statistically significant different (P<0.05).There was a statistically significant difference between the high myopia group and normal control group (P<0.05; Table 2 and Figure 3).
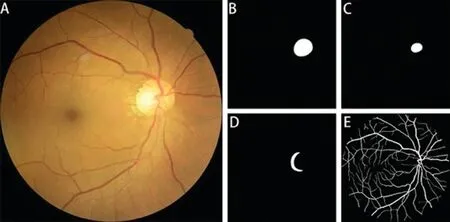
Figure 1 The results of feature recognition A: The original colour fundus photograph; B: Optic disc recognition; C: Optic cup recognition; D: PPA recognition; E: Blood vessel recognition.PPA: Peripapillary atrophy.
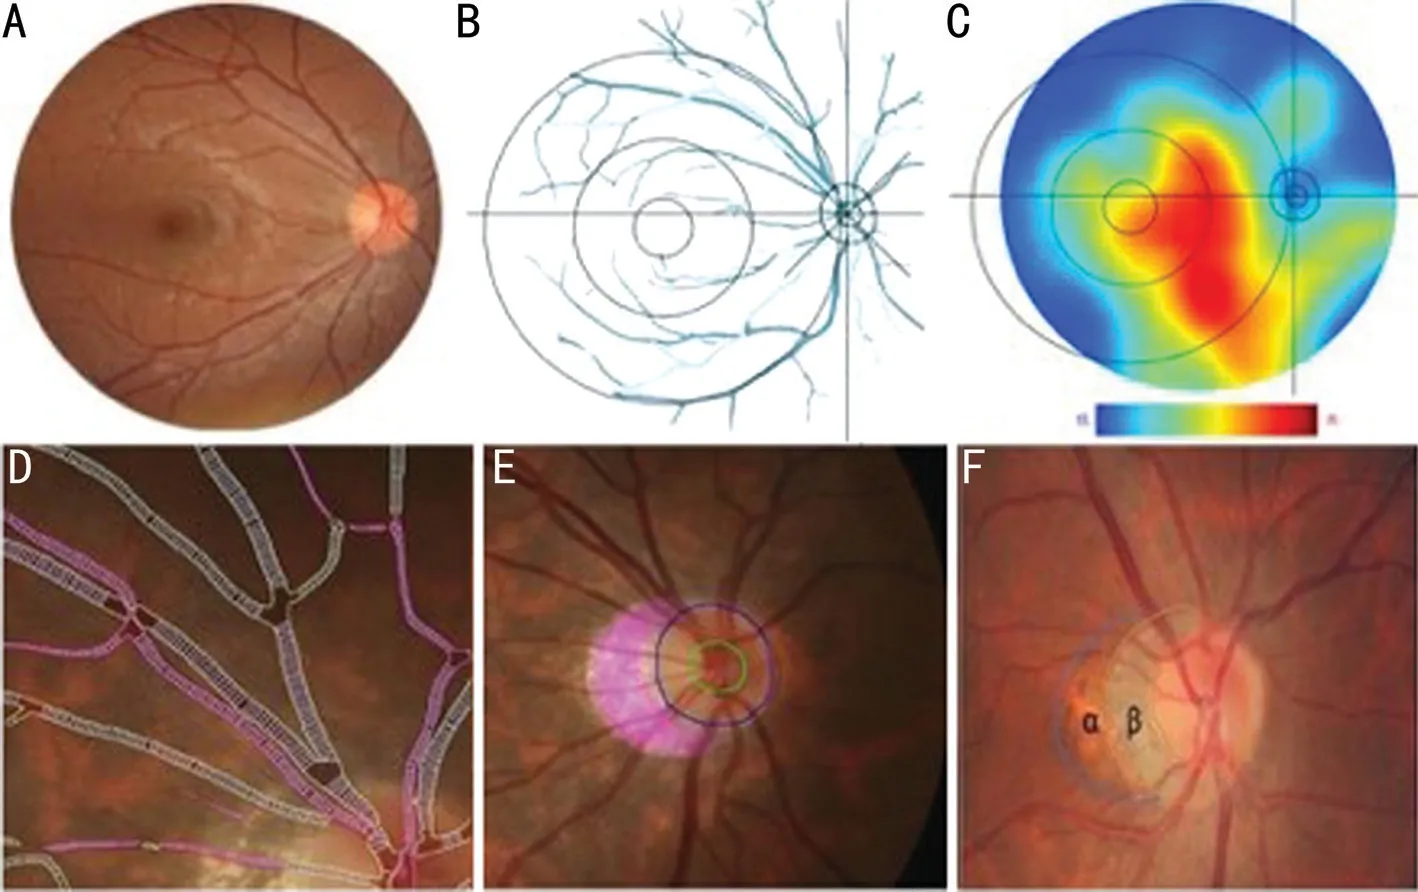
Figure 2 The results of fundus structure identification A: The original color fundus photograph.B: AI technology automatically extracted the key structures in the fundus, including blood vessels, optic disc, optic cup, macular center, and key lesions of the fundus.It removed the background color and drew it in the coordinate centered on the optic disc.C: AI was used to analyze the thermal diagram of the density distribution of FT in the color fundus photograph.Red indicates a high density of FT and blue indicates low density of FT.D: Local enlarged images of retinal blood vessels analyzed by AI in which red areas are arterial vessels and yellowish areas are venous vessels.E: The local enlarged view of the optic disc analyzed by AI, in which the green line indicates optic cup, the blue line indicates optic disc, and the purple area indicates PPA.F: PPA.α-PPA: Abnormal pigment area of the outer ring, abnormal distribution of RPE; β-PPA: Low pigment area in the inner ring,no RPE area.In this study, β-PPA of the fundus was measured and extracted for analysis.AI: Artificial intelligence; FT: Fundus tessellation; RPE:Retinal pigment epithelium; PPA: Peripapillary atrophy.

Table 1 Comparison of baseline data
Quantitative Analysis and Comparison of PPA in Children with Different Refractive StatesThe width of PPA,horizontal diameter ratio of PPA to the optic disc and area ratioof PPA to the optic disc were significantly different among the four groups (P<0.05).The height of PPA, the vertical diameter ratio of PPA to the optic disc, and the average density of PPΑ among the four groups showed statistically significant differences between the high myopia group and other groups(P<0.05; Table 3).

Table 2 Quantitative analysis of the optic disc morphology in different refractive states

Table 3 Quantitative analysis of peripapillary chorioretinal atrophy under different refractive states
Correlation Analysis of SE, AL, and Optic Disc Parameters in Children with Different Refractive StatesLinear correlation analysis showed that there were strong negative correlations between SE and AL (r=-0.874,P<0.001), the area ratio of PPA to the optic disc (r=-0.812,P<0.001), and the width of PPA (r=-0.770,P<0.001).There was a strong positive correlation between the AL and area ratio of PPA to the optic disc (r=0.736,P<0.001), the width of PPA (r=0.714,P<0.001;Table 4, Figures 4 and 5).
DISCUSSION
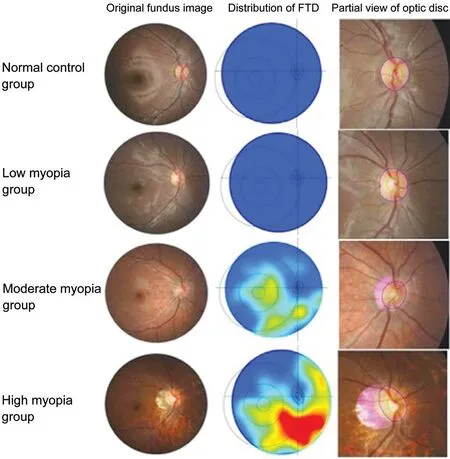
Figure 3 Typical color fundus photographs, distribution of the fundus tessellated density, and partial view of optic disc images under different refractive states FTD: Fundus tessellated density.
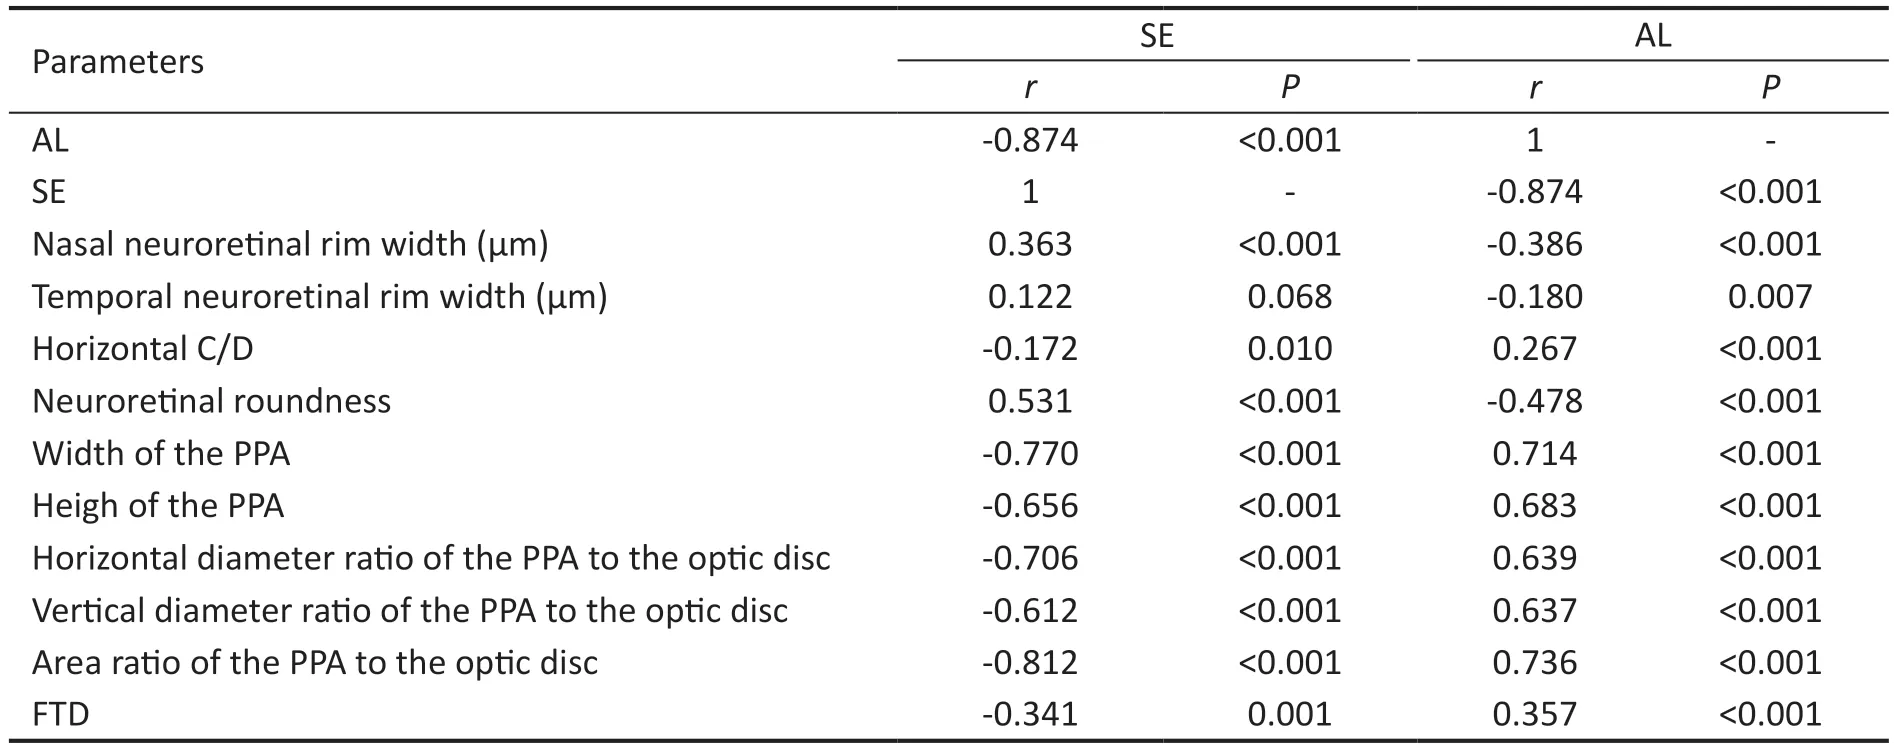
Table 4 Correlation analysis of optic disc parameters with SE and AL
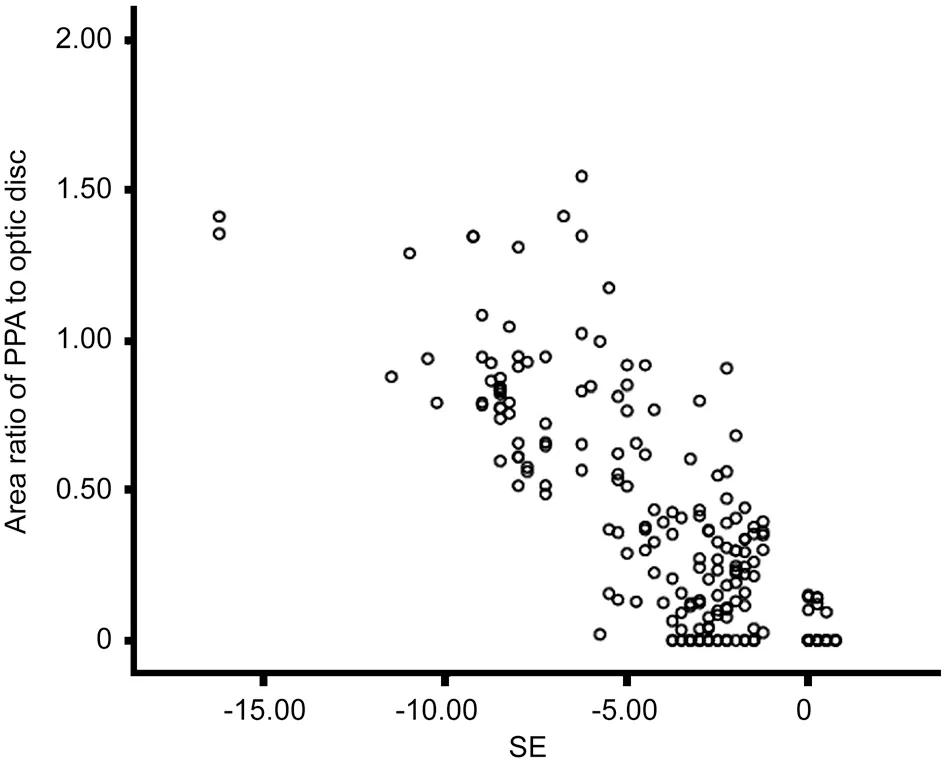
Figure 4 Scatter diagram of the SE and area ratio of PPA to the optic disc SE: Spherical equivalent; PPA: Peripapillary atrophy.
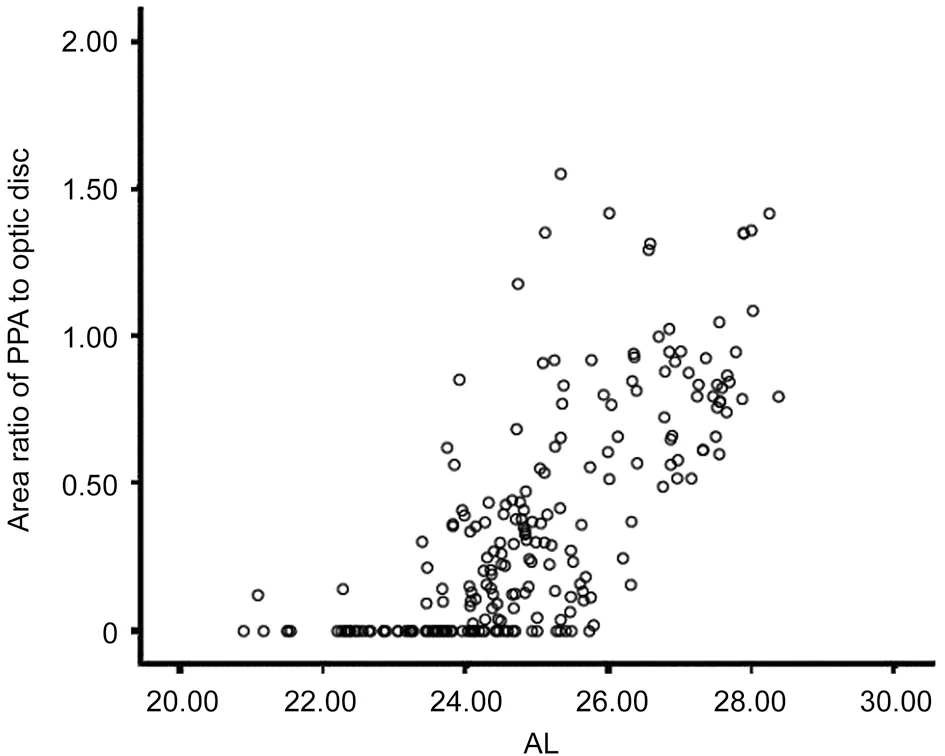
Figure 5 Scatter diagram of the AL and area ratio of PPA to the optic disc AL: Axial length; PPA: Peripapillary atrophy.
In this study, children aged 6–12y with refractive errors were grouped according to different refractive states.Some fundus anatomical landmarks extracted from color fundus photography images were automatically and quantitatively measured by AI software, and the values of the related indexes of the fundus optic disc and β-PPΑ of school-age children with different diopters were accurately measured.In addition, the correlation between these values and diopters and AL was analyzed.We found a significant correlation between the higher degree of myopia and longer AL in school-aged children.In our analysis of optic disc morphology, we found that with increasing diopters, nasal and temporal neuroretinal rims were narrowed and lost, the horizontal C/D of the optic disc increased, while the optic disc ovality index decreased.However, there was no significant change in the superior and inferior neuroretinal rim width, and vertical C/D.In the quantitative analysis of PPA in refractive error school-aged children, it was found that with the increase of the myopia degree, the width and height of the PPA, diameter ratio of the PPA to the optic disc, area ratio of the PPA to the optic disc, and average density of the PPA increased.The sensitivity of area ratio of PPA to the optic disc was the highest, which is more sensitive than the width of PPA.Further analysis revealed that in the correlation analysis of many fundus marker indicators, the area ratio of PPA to the optic disc index was not only strongly correlated with the SE but also strongly correlated with the AL.We therefore believe that the width of the nasal and temporal neuroretinal rims and the area ratio of the PPA to the optic disc can be used as early predictive indexes of myopia progression, which can accurately and quantitatively detect the progression of myopia,providing new methods and ideas for the prevention and control of myopia.
At present, there is no accurate quantitative detection method for changes in the optic disc and PPA in the fundus.Previously,some scholars used Image J to analyze the correlation between optic disc structure and fundus morphological markers in patients with high myopia[15].They obtained fundus structure data for optic disc structure analysis.However, Image J is a manual labeling software for a target area and it completely depends on the operators’ subjective manual labeling.Each image needs manual labeling, which causes low efficiency and poor accuracy.In recent years, the application of AI in the medical field continues to expand, leading medicine to enter an era of precision medicine, and realizing the transformation from qualitative to quantitative imaging[16-17].The early screening and measurement of some morphologic indexes of the fundus by AI can accurately determine the progression of fundus changes in myopia, predict the development of myopia,and implement timely intervention measures to prevent the development of myopia and its complications, which may reduce the occurrence of irreversible visual impairment[18].At present, there are few reports on quantitative analysis of the fundus structure by AI.We therefore carried out this preliminary study cautiously.The data collection is one of the highlights of this study.Different from the previous simple deep learning network model, this study not only uses the deep learning network model, but also deeply integrates the visual attention mechanism and computer vision algorithms such as edge detection, so as to make the edge of fundus retinal structural feature extraction more refined.The data can be accurate to 0.001 μm, which is precise, efficient and reproducible.Moreover, this study used the density distribution heat maps of color fundus photographs for the extraction of tessellation in the fundus, which is not possible with conventional image processing software.
It has been suggested that the occurrence of visual impairment is associated with an increase in the AL and the SE[19].However, Previous research showed that adults with high myopia continue to have an increase in AL and the increased risk factors seem unchangeable[20].Increased age, increased diopters, and AL elongation are important risk factors in fundus disease progression in patients with high myopia[21-22].With lengthening of the AL and expansion of the eyeball,the sclera is continuously extended and thinned, leading to a series of changes in the choroid and retina and resulting in high myopia[23].Degeneration of choroidal vessels, gradual thinning and atrophy of RPE, and initial FT occurs[24-26].Similarly, mechanical stretching of the eyeball due to an elongated AL leads to thinning of the choroid and RPE,resulting in degeneration of the retina, RPE and choroid,which results in PPA[27].Recent studies have suggested that some morphological features of the fundus may indicate the progression of fundus lesions.For example, changes in the optic disc shape are related to the progression of myopia[28-29].With the deepening of myopia, the tilt, rotation, expansion, and displacement of the optic disc appear[30-31].Liet al[30]found that patients with high myopia had an increased incidence of optic disc tilt, rotation, and β-PPΑ.Αfter 1-year follow-up, Zhanget al[32]found that β-PPΑ and the optic-disc ovality index were positively correlated with the myopia diopter and AL progression.Liuet al[33]found that high myopia patients had a larger PPA area and increased optic disc tilt, which may serve as an early predictor of myopia progression.Lyuet al[34]found that the SE of the eye diagnosed with FT was lower, while the choroid and scleral layer thickness decreased significantly and the AL and PPA increased during the development and enlargement of FT.Quantitative measurement of fundus tessellated density (FTD) by Shaoet al[35]found that FTD was significantly associated with a longer AL and greater PPA,which is considered to be an important indicator of the early development of myopia.Studies by Zhaoet al[36]found that PPA region was significantly associated with a longer AL,higher myopic refractive errors, worse BCVA, and older age.However, how does the fundus optic disc and choroid change in myopic school-age children during their growth spurt? This kind of research is rare.Through quantitative analysis of optic disc in children aged 6–12y with refractive errors, this study has a better understanding of the changes of various indicators of optic disc and choroid in myopic children.
The above studies suggested that the increase in diopters and AL in myopia patients cause changes in the fundus morphology, and there is a certain relationship between the changes in different anatomical markers in the fundus.Therefore, many scholars are constantly looking for fundus morphological marker-related indicators.This study suggests that inschool-age children with high myopia, the nasal and temporal neuroretinal rims narrowed and even lost, which had high sensitivity.The area ratio of the PPA to the optic disc could be used as an early predictor of myopia progression.There are some shortcomings in this study.The sample size of this study was small.This was a cross-sectional, noninterventional study in which the samples were not followed for a long time to obtain data on fundus changes as myopia progressed.In the future, we will apply “big data” methods and AI technology to conduct a more in-depth study on the changes of ametropia retinas.
ACKNOWLEDGEMENTS
We would like to express our gratitude to Professor Jianghong Luo from the Department of Statistics of Gannan Medical University for her statistical analysis of this study.
Conflicts of Interest: Liu F,None;Yu XH,None;Wang YC,None;Cao M,None;Xie LF,None;Liu J,None;Liu LL,None.
 International Journal of Ophthalmology2023年11期
- International Journal of Ophthalmology的其它文章
- Association analysis of Bcll with benign lymphoepithelial lesions of the lacrimal gland and glucocorticoids resistance
- In vitro protective effect of recombinant prominin-1 combined with microRNA-29b on N-methyl-D-aspartateinduced excitotoxicity in retinal ganglion cells
- Bioinformatics and in vitro study reveal the roles of microRNA-346 in high glucose-induced human retinal pigment epithelial cell damage
- Therapeutic effect of folic acid combined with decitabine on diabetic mice
- Comparison of visual performance with iTrace analyzer following femtosecond laser-assisted cataract surgery with bilateral implantation of two different trifocal intraocular lenses
- Comparison of three fundus inspection methods during phacoemulsification in diabetic white cataract
