
Effect of CO2-mixing dose and prolonged mixing time on fresh and hardened properties of cement pastes
2023-10-24 01:52MinluWANGShuangLUOBaTungPHAMTungChaiLING
Minlu WANG, Shuang LUO, Ba Tung PHAM, Tung-Chai LING
Research Article
Effect of CO2-mixing dose and prolonged mixing time on fresh and hardened properties of cement pastes
Minlu WANG, Shuang LUO, Ba Tung PHAM, Tung-Chai LING
College of Civil Engineering, Hunan University, Changsha 410082, China
This study aims to investigate the influence of CO2-mixing dose (mass fractions of 0.3%, 0.6%, and 0.9%) and prolonged mixing time on the fresh and hardened properties of cement pastes. The CO2-mixing can act as coagulant in fresh cement mixtures, resulting in a significant reduction in workability associated with the formation of a rich calcium carbonate network on the surface of cement particles. The CO2-mixing cement pastes were found to be much stiffer and more difficult to handle, place, and compact than the control mixture, which had a negative effect on the mechanical strength performance of the hardened pastes. However, prolonging the mixing time for 1 min (immediately after CO2-mixing) can effectively improve the workability (by ~53%–85%) by breaking up the flocculation network of deposited calcium carbonates. As a result, the presence of detached calcium carbonate accelerated early cement hydration and densified the microstructure; this improved early-age compressive strength by ~6%–32%, depending on the CO2-mixing dose used. Therefore, it seems that the CO2-mixing dose should be controlled at ≤0.6% with the mixing time prolonged in order to attain satisfactory workability and mechanical strength.
CO2-mixing; Calcium carbonate; Early cement hydration; Flowability; Microstructure
1 Introduction
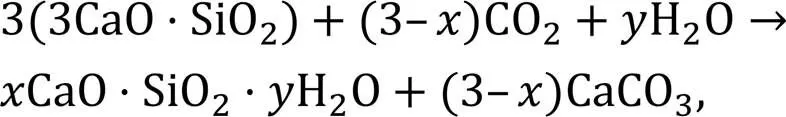
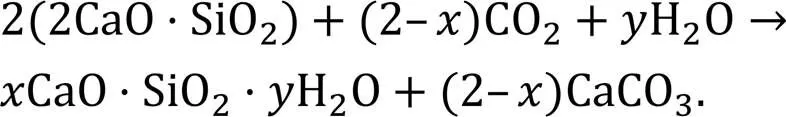
Accelerated carbonation (or CO2curing) has been extensively studied for its potential to improve the mechanical strength of cement concrete and reduce its environmental impact (Ashraf, 2016). However, special conditions including temperature, pressure, CO2concentration, and sophisticated equipment are required for an accelerated carbonation process, and in general the approach can only be applied in precast production (Zhang et al., 2017). In addition, CO2can be sequestrated into cement-based materials and solid waste under aqueous conditions (Li et al., 2023; Mehdizadeh et al., 2023). Both dry and aqueous carbonation methods require a long process for the carbonation reaction (hours or days). Recently, the application of CO2-mixing by directly mixing CO2with fresh ready-mix concrete has attracted a lot of attention due to the short reaction time (a few minutes during mixing) and its feasibility for wider application in the concrete industry. According to (Monkman and MacDonald, 2016; Monkman et al., 2016), the amount of CO2incorporated (~0.05%–1.5%) during concrete mixing or batching has a significant influence on compressive strength. CO2can convert calcium minerals into very fine calcium carbonate (CaCO3) with a size of ~70 nm that acts as nucleation sites to accelerate cement hydration (Monkman et al., 2020). Monkman and MacDonald (2017) claimed that the cement consumption for a given designed concrete strength was reduced by ~5%–8%. The reaction between CO2and cement clinkers (including C3S and C2S for the precipitation of CaCO3in the presence of water) can be expressed by Eqs. (1) and (2) (Berger et al., 1972).
In terms of workability performance, Monkman and MacDonald (2016) and Liu et al. (2021) reported that CO2-mixing of a fresh concrete mixture dramatically reduces workability. To solve this technical problem, Monkman and MacDonald (2016) used extra water to maintain equal workability of the concrete mixture and were able to successfully enhance the compressive strength by ~10%–30% compared to the control mixture. Liu et al. (2021) used superplasticizers to refine the flowability of CO2-mixed cement paste and attained comparable strength to that of the control sample. Lippiatt et al. (2019) used a saturated aqueous CO2solution as mixing water for the preparation of cement pastes and found that the presence of an aqueous CO2solution (carbonic acid) in the paste greatly reduced flowability (Kwasny et al., 2014; Lippiatt et al., 2019; Lippiatt and Ling, 2020). In comparison to an enclosed mixing environment, the reduction of workability associated with the CO2-mixing approach was even more pronounced (Liu, 2019). Luo et al. (2022) used fly ash to replace 10%–20% of cement in order to improve the workability of CO2-mixed cement pastes due to the material's spherical morphology, and obtained an ~15% increase in strength. However, the mechanism of flocculation and breakup of the deposited calcium carbonate on the surface of the cement particles after subjection to prolonged mixing time was not clear.
Generally, increasing cement-mixing speed, intensity, and time enables great enhancement of the rheological behavior, hydration, and microstructure of cement concrete (Han and Ferron, 2015, 2016). According to Zhao et al. (2022), prolonging vibratory mixing helps to break down flocculation of cement particles and produce better fluidity in the concrete mixture. In fact, prolonging a short mixing period can improve the uniformity and consistency of fresh concrete, especially in the case of high-stiffness mixtures (Urban and Sicakova, 2018). In contrast to mixing at an ambient temperature (25 °C), prolonging mixing time at 40 ℃ for 60, 120, and 180 min can better improve the compressive strength of concrete (Hossain et al., 2018). It can be suggested that increased mixing time is anticipated to alter the fresh and hardened properties of cement pastes, in particular with additional admixture or filler, and this could also apply for the introduction of CO2in fresh cement paste.
This paper studies the influence of further mixing (applied immediately after CO2-mixing with mass fractions of 0.3%, 0.6%, and 0.9%) on the fresh and hardened properties of cement pastes. All the cement pastes were prepared with a fixed water-to-cement (w/c) ratio of 0.5 in an enclosed (airtight) mixer. Calcium carbonate precipitation was confirmed by thermogravimetric analysis (TGA) and scanning electron microscope (SEM) with an energy-dispersive spectrometer (EDS). The porosity was quantified using backscattered electron microscopy (BSE) techniques. The kinetics of cement hydration with and without CO2-mixing were investigated through isothermal calorimetry.
2 Experimental
2.1 Materials
Ordinary Portland cement (OPC) with a strength grade of P.I. 42.5 and deionized pure water were used to prepare cement pastes. The chemical and mineral compositions of OPC are given in Tables 1 and 2, respectively. CO2gas with an industrial-grade purity of 99% (volume fraction) was obtained from Rizhen Industrial-Gas Manufacturer in Changsha, China.
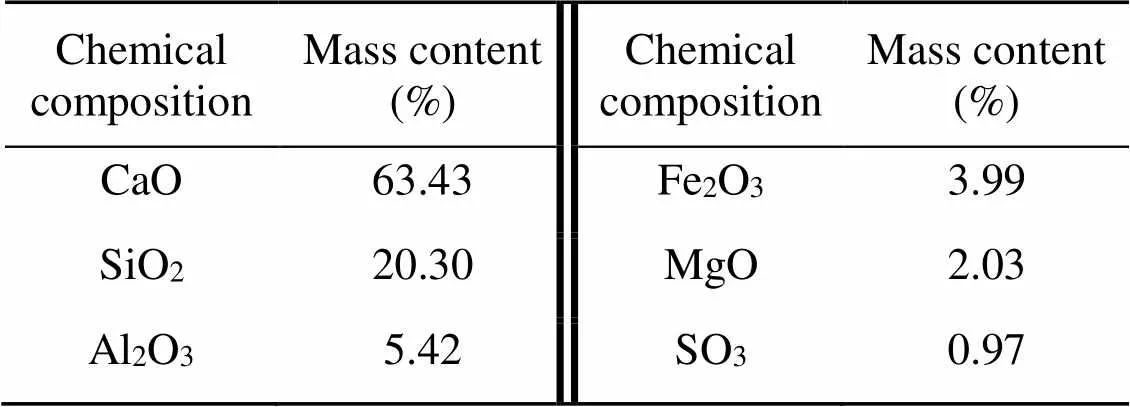
Table 1 Chemical composition of OPC
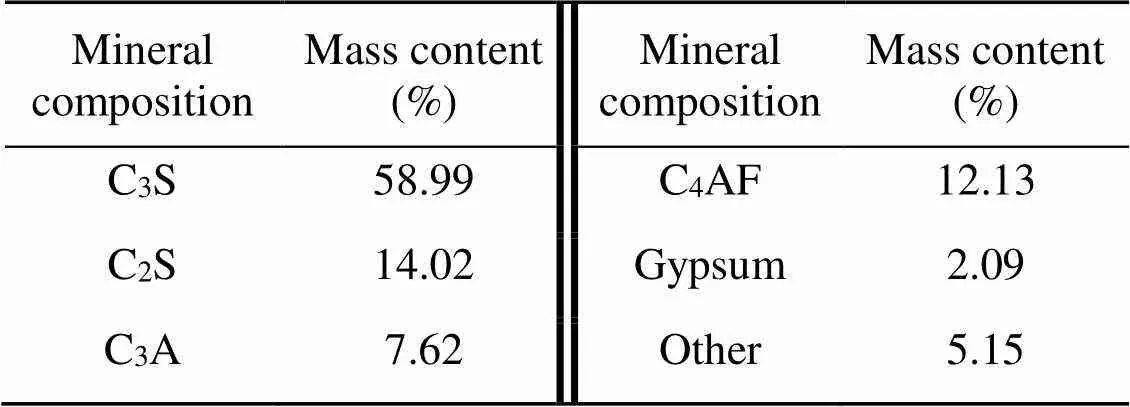
Table 2 Mineral composition of OPC
2.2 Mixing process and sample preparation
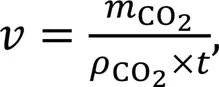
The CO2-mixing cement pastes were prepared with a fixed w/c ratio of 0.5; the mix design is shown in Table 3. Based on Eq. (3), volumetric flow rates were determined for each mix design of CO2-mixing cement pastes (mass fractions of 0.3%, 0.6%, and 0.9%).
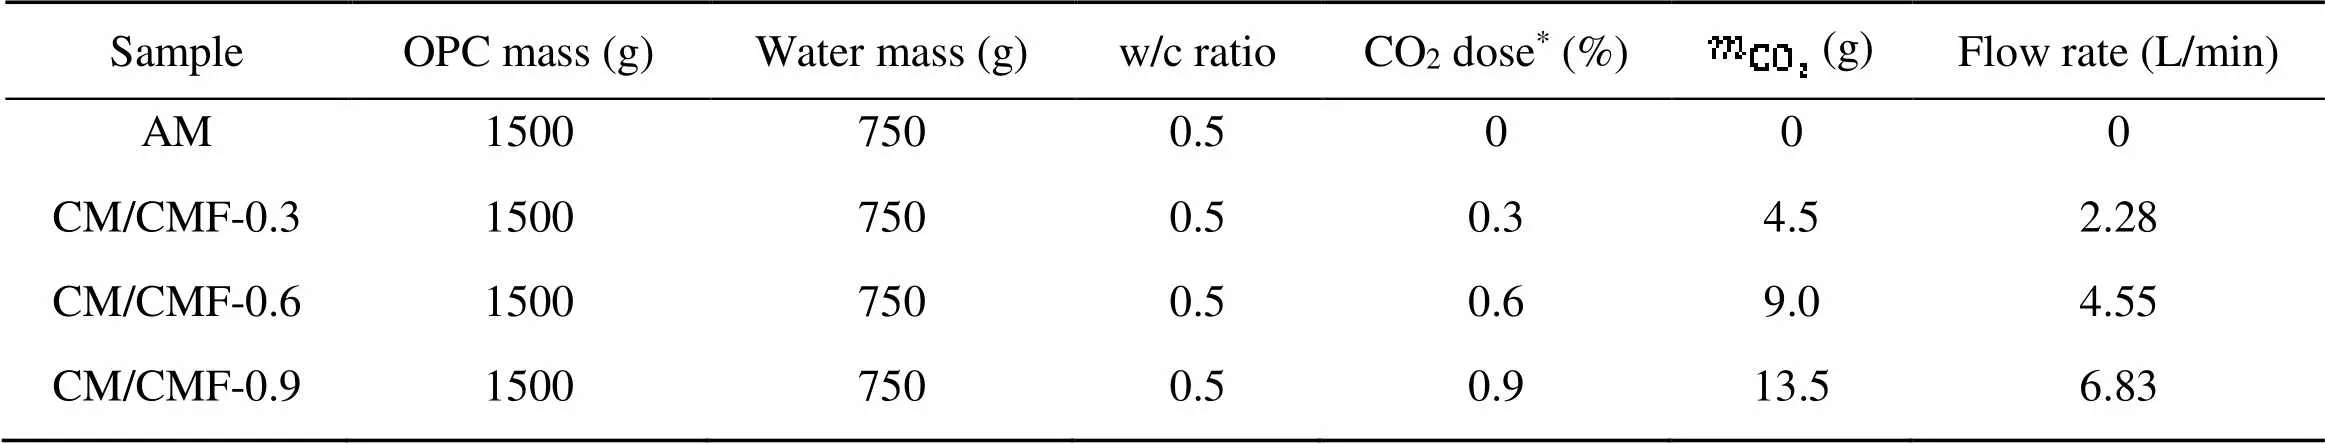
Table 3 Mix design of CO2-mixing cement pastes
*The CO2dose percentage is by weight of cement and was selected based on previous studies (Monkman and MacDonald, 2016; Monkman et al., 2016). AM: air-mixing sample; CM: CO2-mixing samples; CMF: CO2-mixing with further mixing samples
The mixing regime of the cement paste samples is illustrated in Fig. 1. A control sample (AM) was prepared by mixing OPC with water at 140 and 280 r/min for 1 and 2 min, respectively, to obtain a homogeneous state. As for CO2-mixing (CM) samples, an additional mixing stage of 1 min (280 r/min) was required to allow 0.3%, 0.6%, and 0.9% CO2doses to be injected and mixed with the freshly prepared wet cement paste in an enclosed mixer (Fig. 2). Once the mixer was opened, the pastes were highly stiffened and not workable. To investigate the effect of prolonged mixing time, immediately after CO2-mixing the mixture was further mixed for another 1 min at 280 r/min and labelled the samples CMF-0.3, 0.6, and 0.9. Note that before the second mixing stage, the cover of the enclosed mixer was opened in order to ensure that any unreacted CO2was released into the environmental air.
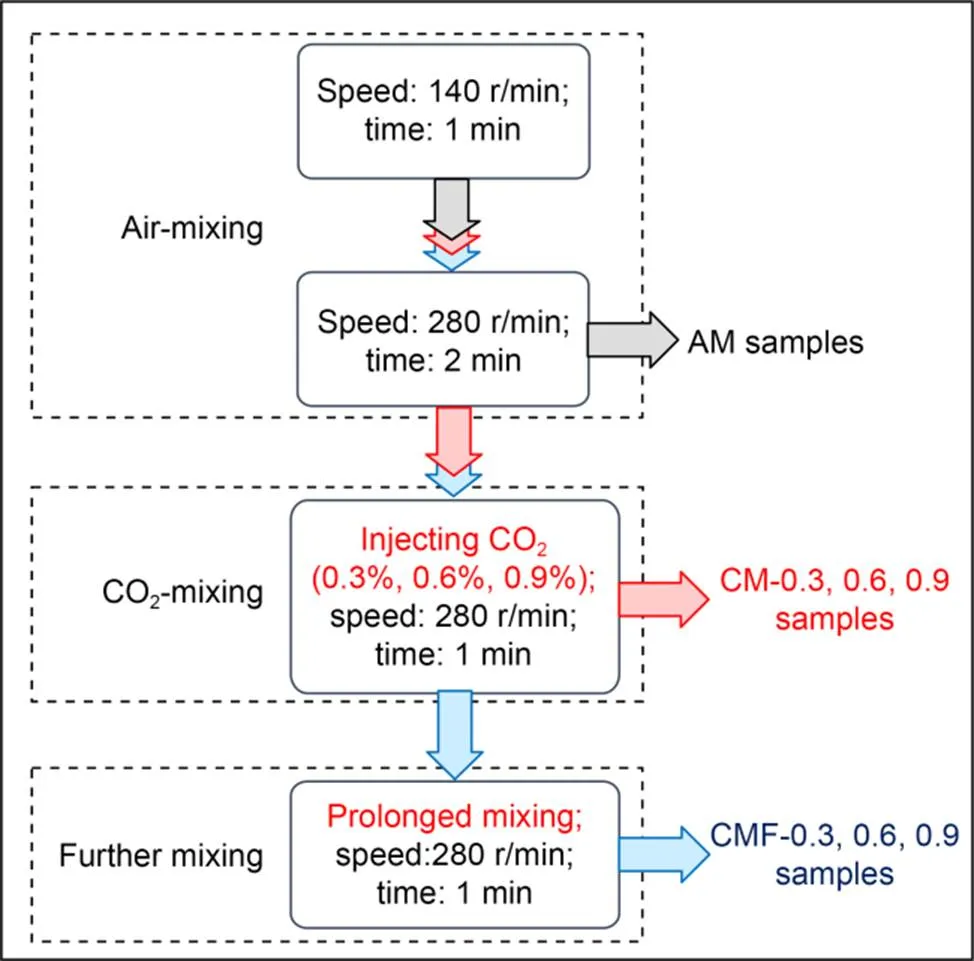
Fig. 1 Mixing regimes designed for CO2-mixing cement pastes
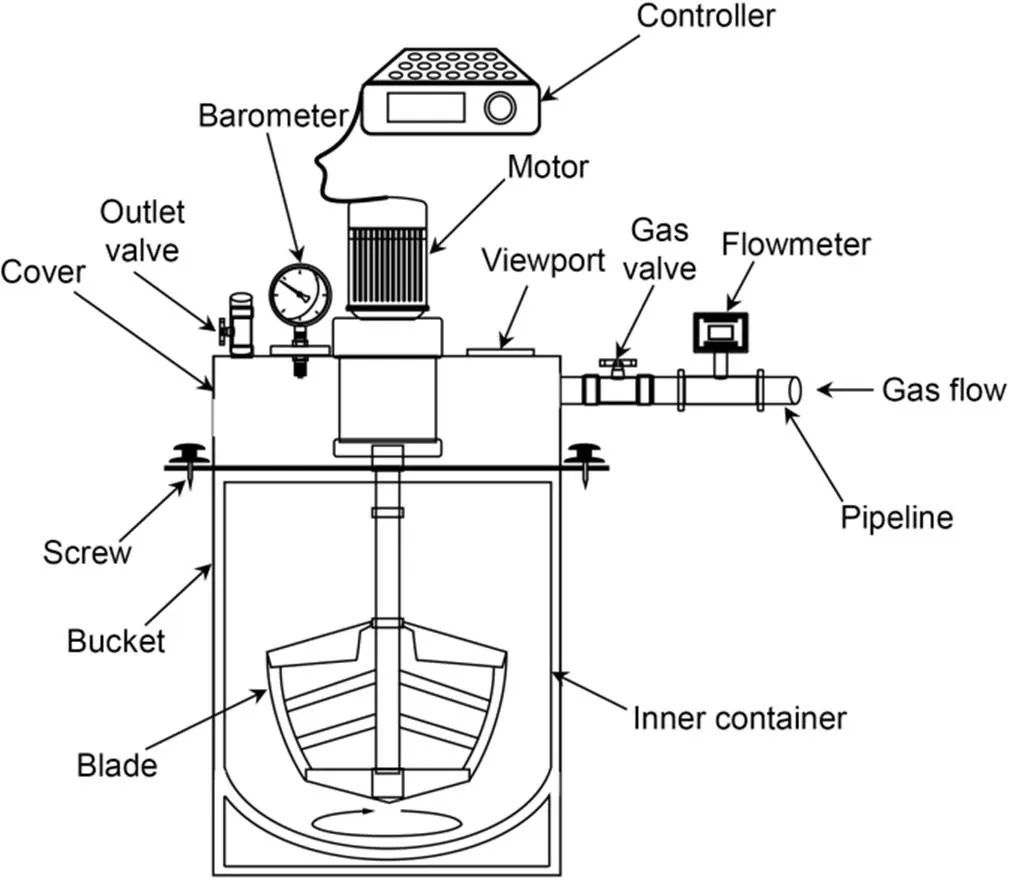
Fig. 2 Schematic diagram of the enclosed (airtight) mixer coupled with a CO2 injector. The bucket was sealed with a rubber ring on the top and enclosed with four screws at each side. The mixer volume was 10 L, and the mixing speed and CO2 flow rate could be controlled in the range of 0–400 r/min and 0–10 L/min, respectively
All freshly prepared mixtures were poured into 40 mm×40 mm×40 mm steel molds and vibrated for 20 s. The hardened pastes were demolded after 1 d and then further cured in a standard chamber (relative humidity of 95% and temperature () of 20 ℃) until the testing ages.
2.3 Testing methods for fresh properties
2.3.1Flowability
Mini-slump test was used to assess the flowability of the fresh cement paste mixture (Mehdizadeh et al., 2022). A truncated cone with a size of 36 mm×60 mm×60 mm was placed at the center of the flow table and then filled with the freshly prepared mixture. After the cone was lifted vertically, the mixture was dropped 15 times at a rate of one jolt per second. The diameter of the spread mixture in two perpendicular directions was recorded.
2.3.2Setting time
The initial and final setting times of the fresh cement paste mixture were measured with a Vicat Apparatus in accordance with GB/T 1346 (GAQSIQ, 2012). The needle used was (1.000±0.005) mm in diameter. This test was carried out in the laboratory with a relative humidity of 60% and a room temperature of (20±3) ℃.
2.3.3Heat of hydration
The exothermal curves of samples were measured according to GB/T 12959 (GAQSIQ, 2008). The paste mixture, with a mass of 10.5 g, was placed into glass ampoules and located into channels of a TAM Air (8-channel) machine (TA Instruments, USA) at 20 ℃ for measurement (up to 7 d). To maintain the heat balance, the reference water was placed in the corresponding channels.
2.3.4Thermogravimetric analysis (TGA)
The freshly prepared mixture was immersed in isopropyl alcohol to exchange the free water in order to completely stop hydration. For each sample, approximate 15 mg of the powder was used for heating from ambient temperature to 1000 ℃ at a rate of 10 ℃/min under a nitrogen flow of 30 mL/min.
The weight lossCat 550–950 ℃ indicates the decomposition of the precipitated CaCO3, as expressed in Eq. (4) (Jiang and Ling, 2020; Ma et al., 2021).
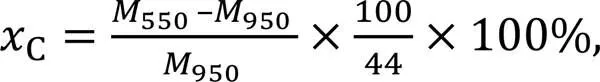
where550and950are the masses of the sample at given temperature of 550 °C and 950 °C, respectively.
2.3.5Scanning electron microscopy (SEM)
The SEM observation was performed on oven-dried fresh paste mixture using a JSM-7900F SEM (JEOL, Japan) with an energy dispersive spectrometer (EDS). Samples were coated with a thin conductive layer of gold (Au) to minimize charging.
2.4 Testing methods for hardened properties
2.4.1Compressive strength
Compressive strength testing was carried out at 1, 3, 7, and 28 d using a conventional compression machine with a loading rate of 2.4 kN/s, according to GB/T 17671 (SBQTS, 1999). The average values of three samples were reported.
2.4.2Sorptivity and water absorption
The sorptivity and water absorption of samples were measured at 28 d according to ASTM C1585-04 (ASTM, 2004) and ASTM C642-13 (ASTM, 2013), respectively. Samples were first oven dried at 80 ℃ until a constant weight (dry weight,1), and then the four sides surfaces of each sample were sealed with waterproof paint (sealed weight,2), ensuring that water movement would take place only through the bottom surface. Plastic pipes were used to support the samples so that the water level was kept 5 mm above the bottom surface. Samples were removed from the water and weighed at intervals of 10 min, 20 min, 30 min, 1 h, 2 h, 4 h, 6 h, 12 h, 24 h, and 48 h for measurement. The sorptivity coefficient (, mm/s1/2) was calculated by
whererefers to the cumulative volume of absorbed water per unit of water contact area (mm3/mm2),1is the time (s), andis the constant which reflects the effect of initial water filling at the sample surface.
After 48 h, all samples were at constant weight (saturated surface-dry weight,3) to attain final water absorption values, as expressed by
whereis the final water absorption.
2.4.3Backscattered electron microscopy (BSE)
Microstructure and porosity of samples at 3 and 28 d were analyzed using a BSE (JSM-IT500, JEOL, Japan). Samples were cut into size of 5 mm×10 mm×10 mm by a low-speed diamond blade. Then, moisture was removed by storing the samples in a vacuum oven at 20 ℃ for 5 d. After that, the samples were impregnated with a low-viscosity epoxy resin (EPO-TEK 301, BUEHLER, Germany) under vacuum conditions. After demolding, the surface of the samples was lapped using SiC papers of 400 and 1200 grit and further polished with oil-based diamond polishing fluid of 5, 2.5, and 1 μm in sequence. To calculate the microporosity, 12 BSE images at 500× magnification were taken and analyzed with Image J software. A specific threshold with an empirical coefficient of 0.9 was chosen to avoid overestimating porosity based on the cumulative grayscale curve (Lyu et al., 2019; Peng et al., 2020).
2.4.4Reaction products
The fractured samples derived from the compression tests at 1, 3, 7, and 28 d were immersed in isopropyl alcohol for at least 3 d to stop the hydration process and then vacuum-dried for 5 d before being ground into powder with a size of <75 μm for TGA measurement.

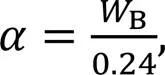
where Ldh is the dehydration (105–400 ℃), Ldx is the dehydroxylation (400–500 ℃), and Ldc is the decarbonation (550–950 ℃). The value of 0.24 represents the maximum amount of chemically bound water required to hydrate a cement particle entirely.
3 Results and discussion
3.1 Fresh properties
3.1.1Flowability
The appearance of the cement pastes before and after vibration on the flow table is shown in Fig. 3. As seen, CO2induced quick hardening of the paste mixture, which is found to be quite similar to false setting (Chung and Lee, 2011; Liu, 2019). The values of mini-slump flow of CM samples were about 31.3%, 43.1%, and 45.9% lower compared with the AM sample with increased CO2-mixing doses of 0.3%, 0.6%, and 0.9%, respectively. This was due to the CaCO3deposited on cement particles increasing the specific surface area and thus absorbing more free water (Liu et al., 2012; Cui et al., 2021).
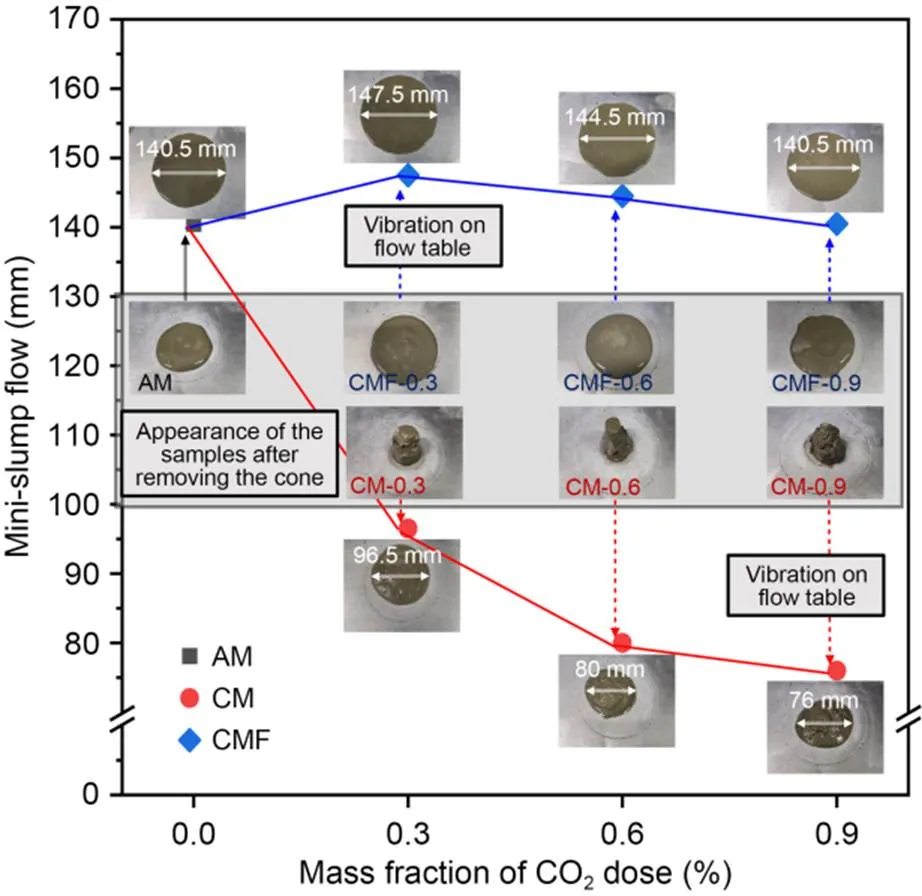
Fig. 3 Physical appearance and mini-slump flow values of the freshly prepared CO2-mixing pastes
It is important to note that with an additional 1 min of high-speed mixing, CMF samples showed improved workability. The specific recovery rates were 52.8%, 80.6%, and 84.9% for the 0.3%, 0.6%, and 0.9% CO2-mixing samples, respectively. The resulting flowability of CMF samples (140.5–147.5 mm) was even slightly higher (~5%) than that of the control AM sample. This is because the increased mixing time increases collisions between particles, inducing detachment of CaCO3which induces the balling effect and creating a lubricating layer between particles (Camiletti et al., 2013).
3.1.2Setting time
The initial and final setting times of the cement pastes are presented in Fig. 4. The initial setting times for CM samples were 10–40 min shorter than that of the AM sample, due to the quick hardening behavior of the cement matrix. In comparison, the initial setting times for CMF samples were prolonged for 20–66 min compared to the AM sample, because of the breakup of the flocculation and release of free water.
The final setting times of CM samples and CMF samples were generally shortened compared with the AM sample, at approximately 140 min and 65 min, respectively. This was attributed to the promotion of hydration by the presence of CaCO3, which led to a faster final setting time. In addition, it is worth noting that the interval between initial and final setting times of CO2-mixing pastes was significantly shortened compared with the AM sample (from 236 min to 80–150 min), which demonstrated the potential of CO2-mixing to provide strength for building construction in a faster and greener way (Guo et al., 2020).
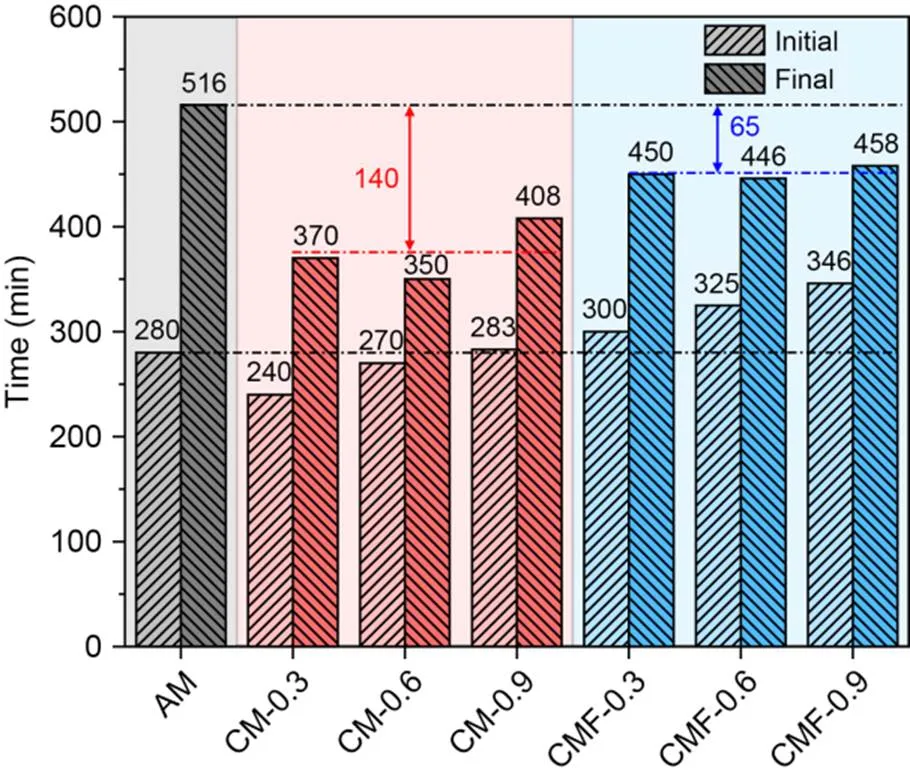
Fig. 4 Initial and final setting times of cement pastes
3.1.3Heat of hydration
The isothermal calorimetry results of AM and CMF samples (up to 7 d) are presented in Fig. 5. The calorimetry slope increased with CO2-mixing dose for the first 6 h, indicating an acceleration of the primary hydration peak of C3S due to the presence of CO2. However, the intensity of the first hydration peak was slightly lower (~6%–8%) than for the AM sample, because some of the C3S was consumed by CO2during the mixing process. These results are consistent with those reported by Monkman et al. (2020), who found that C3S was the main reactant of the CO2-mixing process due to the absence of hydration products at the most initial hydration stage.
The second peak intensity was higher and the cumulative heat at 72 h for the higher CO2-mixing dose samples was higher than those of the CMF-0.3 and AM samples (Fig. 5b). This was due to the formation of CaCO3, which promotes aluminate hydration. However, this promotion became insignificant at a later age of 7 d. In addition, the thermal indicator of setting time reflected in the hydration heat flow (according to ASTM C1679 (ASTM, 2014)) of the CMF-0.3, 0.6, and 0.9 samples was shortened by about 29, 46, and 52 min, respectively, compared to the AM sample (Haha et al., 2010; Monkman et al., 2018). This matched the setting time measurements given in Section 3.1.2.
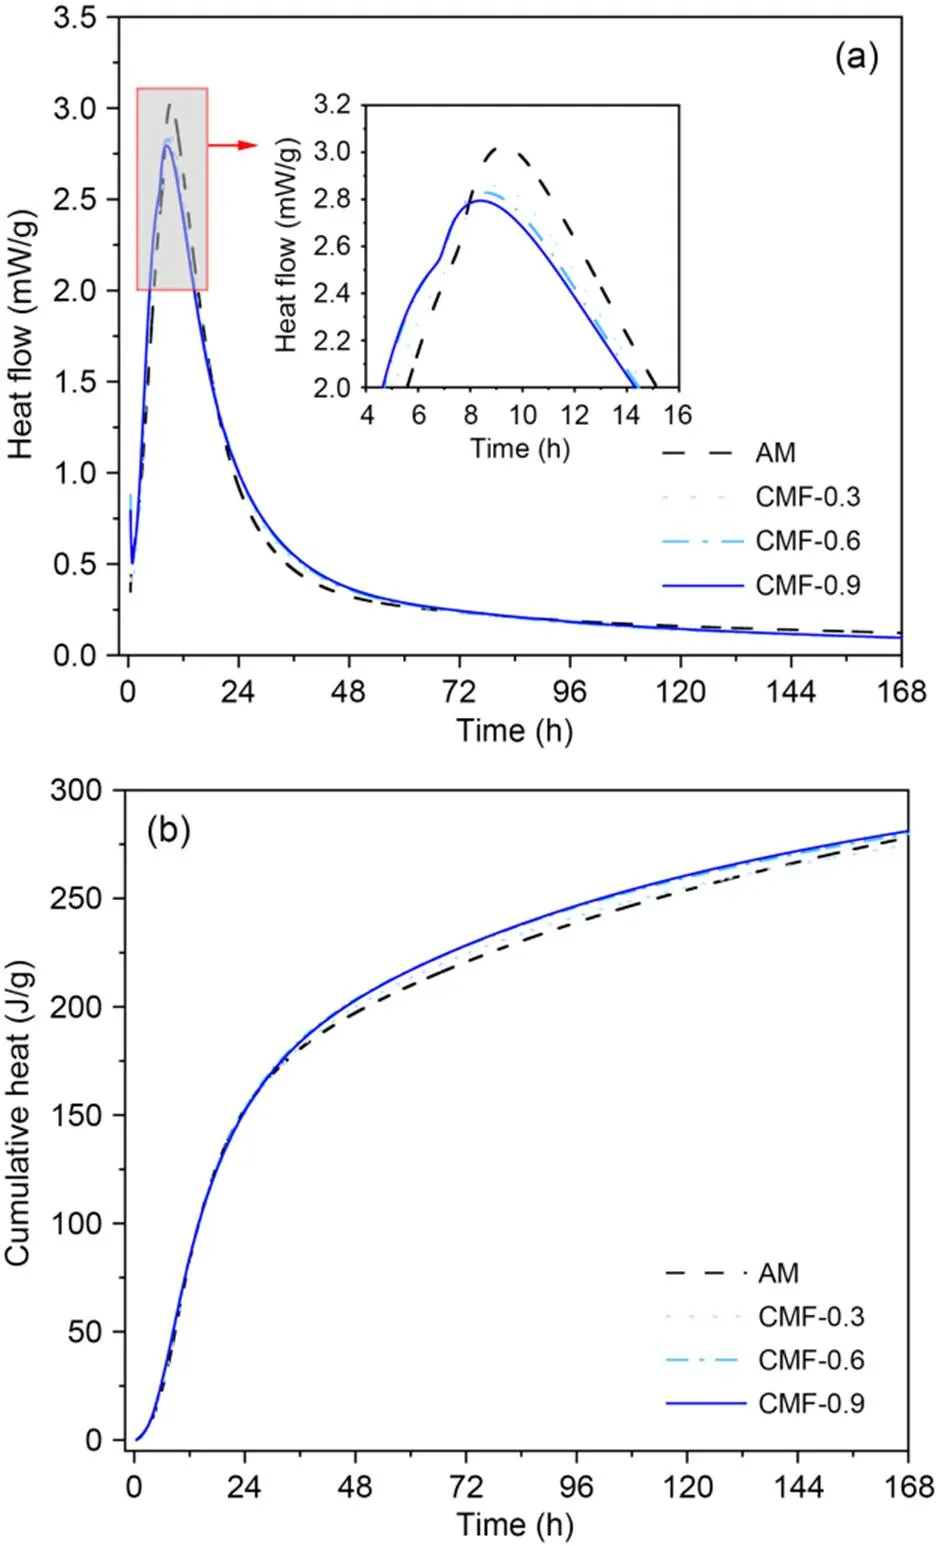
Fig. 5 Heat flow (a) and cumulative heat (b) over time for AM and CMF-0.3, 0.6, and 0.9 samples. The CM samples were excluded due to their quick hardening behavior. References to color refer to the online version of this figure
3.1.4Thermogravimetric analysis
The results of the TGA for fresh cement pastes are illustrated in Fig. 6. It is notable that the peaks for hydration products (i.e., C‒S‒H and ettringite) are generally increased for the case of CO2-mixing samples due to the hydration-promotion effects of CaCO3. As expected, the Ca(OH)2content in all the CO2-mixing cement pastes was lower than that in AM paste, because more CaCO3was precipitated. The calculation of the CaCO3content of each sample is shown in Fig. 6. It can be seen that the CM-0.3 sample had the highest CaCO3content, which may be related to the continuous dissolution of CO2in the water at a relative low flow rate. When the CO2dose was higher than 0.6%, the mixture became less workable due to the fact that most of the free water was entrapped by the flocculation networks. Moreover, CO2could no longer dissolve into water. Upon further mixing, the entrapped water was released and clinkers had better contact with CO2. In addition, it can be seen that the endothermal peaks of CaCO3in all the CM and CMF samples shifted toward a slightly higher temperature compared to the AM paste, indicating that more crystalline CaCO3was formed in the pastes matrix.
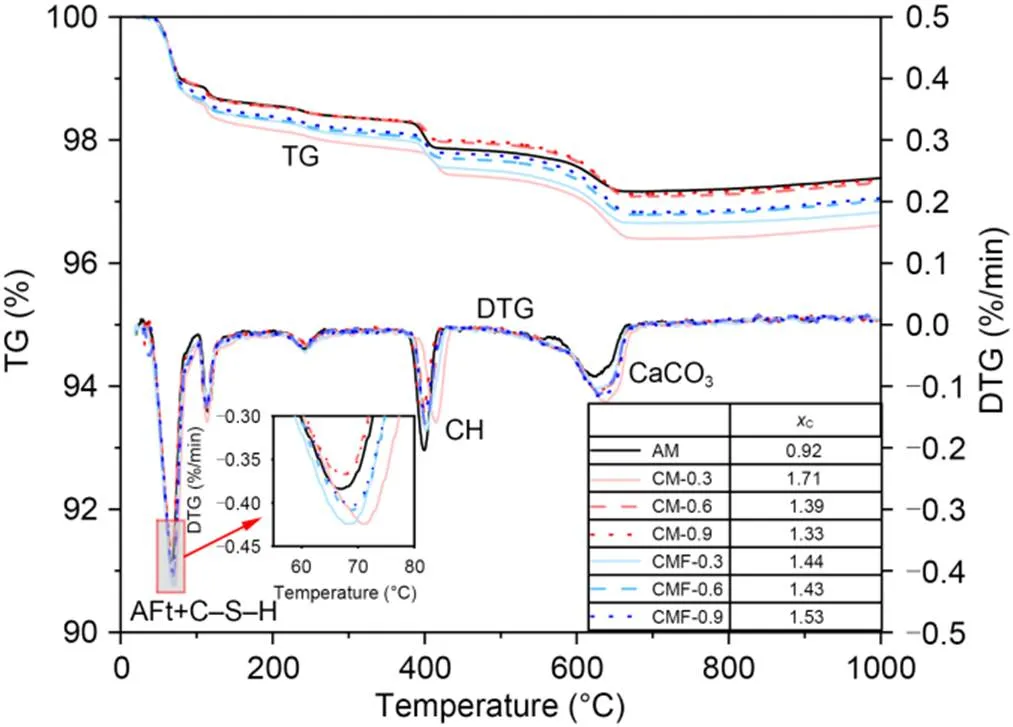
Fig. 6 Derivative thermogravimetric curve (DTG) and thermalgravimetric (TG) curves of freshly prepared cement pastes. References to color refer to the online version of this figure
3.1.5Morphology of the fresh cement pastes
Fig. 7 compares the morphologies of AM, CM-0.6, and CMF-0.6 samples. It is clear that the surface of the AM sample was plain and neat. However, an abundance of flocculated hydration and carbonation pro ducts was deposited on the cement particles of the fresh CM-0.6 sample (Fig. 7b). The EDS spectra of spots 1 and 2 showed that the flocculated phases mainly consisted of C‒S‒H gels, and probably of amorphous calcium carbonate (with a relatively high content of C element). The deposited CaCO3on the surface of cement particles could interact with flowing suspended particles, which led to the so-called interlocking effect; this decreased flowability (Cao et al., 2019). Furthermore, CaCO3also acted as a nucleation site to accelerate cement hydration, leading to the formation of more reaction products on the surface layer of clinker particles (Monkman et al., 2020). As a result, more water was needed to wet the larger specific surface area of the solid particles. Upon further mixing for 1 min, the surface of these particles became smoother, with only some amorphous calcium carbonate (spot 3) instead of flocculated phases. This demonstrated that further mixing helped to destroy the flocculation network and release the entrapped free water.
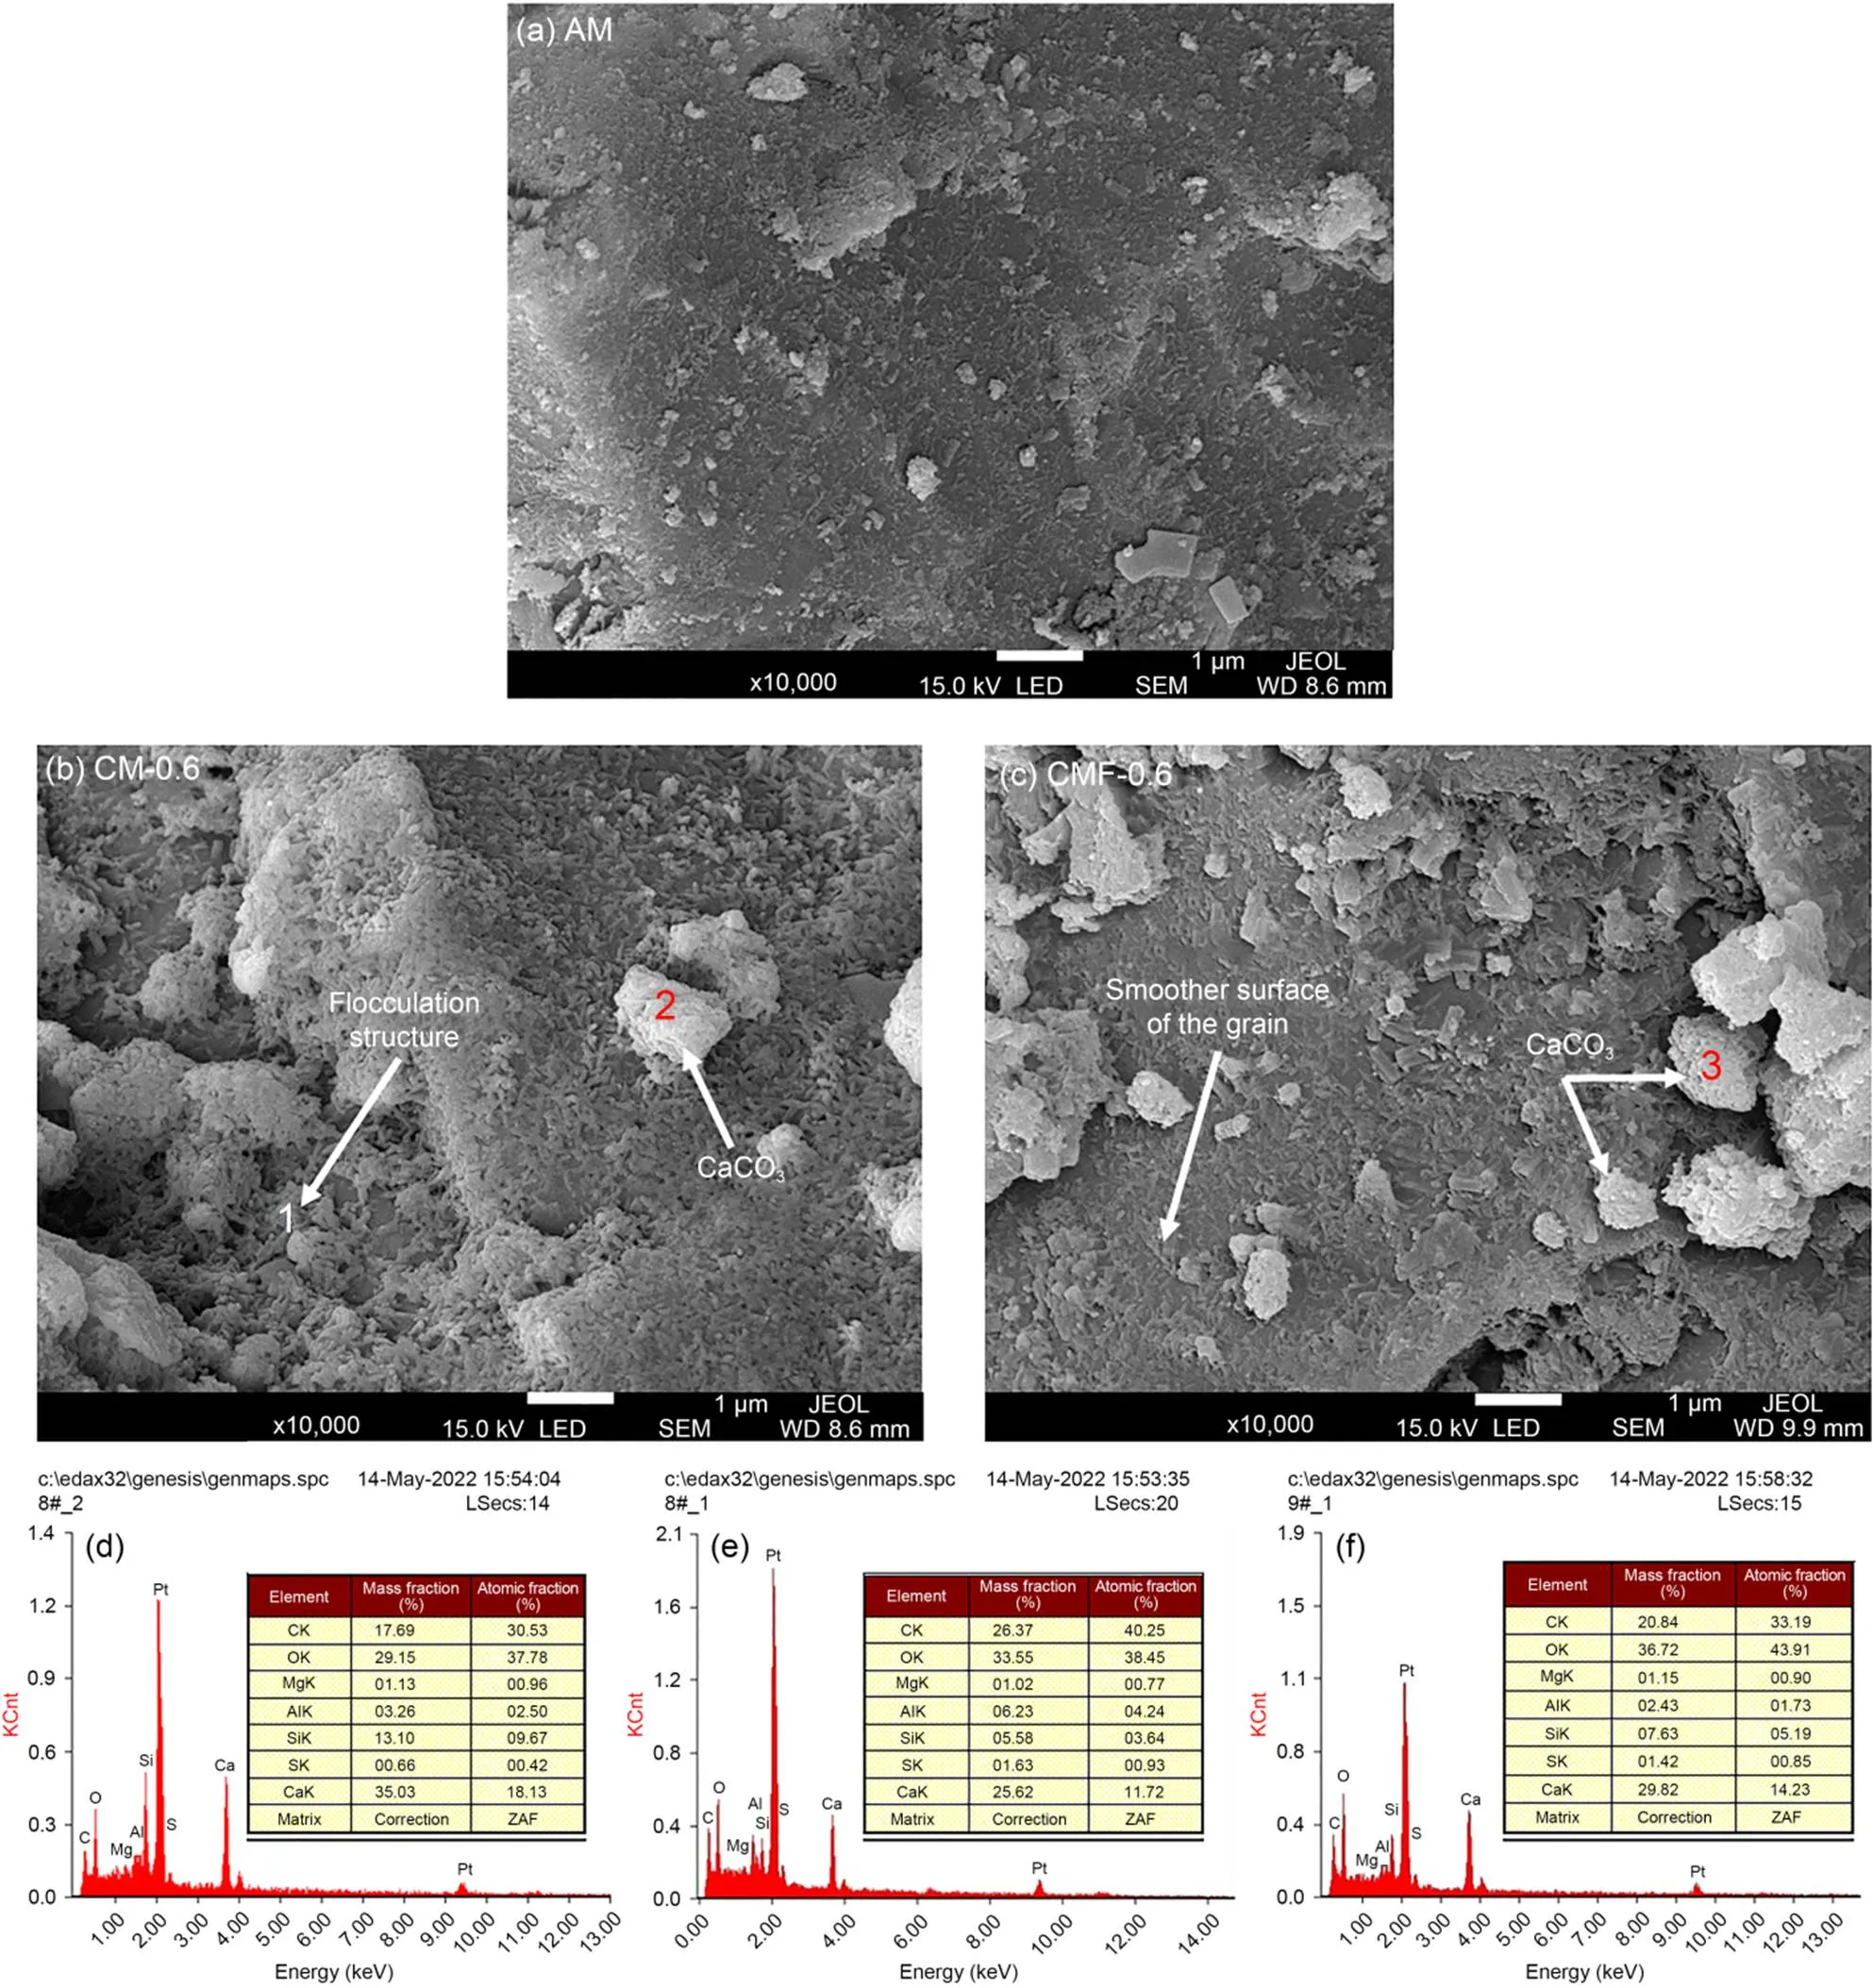
Fig. 7 Morphologies of the freshly prepared CO2-mixing cement pastes of AM (a), CM-0.6 (b), and CMF-0.6 (c), and EDS spectra of spot 1 (d), spot 2 (e), and spot 3 (f)
3.2 Hardened properties
3.2.1Compressive strength
The compressive strength results at 1, 3, 7, and 28 d are presented in Fig. 8. For all CM samples, the compressive strength was about 10%–20% lower than that of the control AM sample at the same curing age, which is consistent with the results found by Monkman and MacDonald (2016). This is probably due to the poor workability which caused the fresh pastes too stiffer to be fully compacted and left air pores in the matrix. Adding 1 min of mixing time immediately after CO2mixing resulted in distinct improvements in compressive strength compared to the corresponding CM samples. This could be primarily due to the improved workability and nucleation sites effect of the break-up deposited calcium carbonate in accelerating early hydration (He et al., 2017; Monkman et al., 2020; Dixit et al., 2021, 2022). In comparison, the rate at which strength improved (~18%–32%) was more pronounced for the cement-paste samples with low (CMF-0.3) and moderate (CMF-0.6) CO2-mixing. At a later age (28 d), the compressive strength of CMF samples was comparable to that of AM samples because the positive effect of CaCO3as a nucleation site became less important (Luo et al., 2022). The relatively low compressive strength of the CMF-0.9 sample was attributed to the larger pore structure induced by an excessive dose of CO2, as will be discussed in the following section.
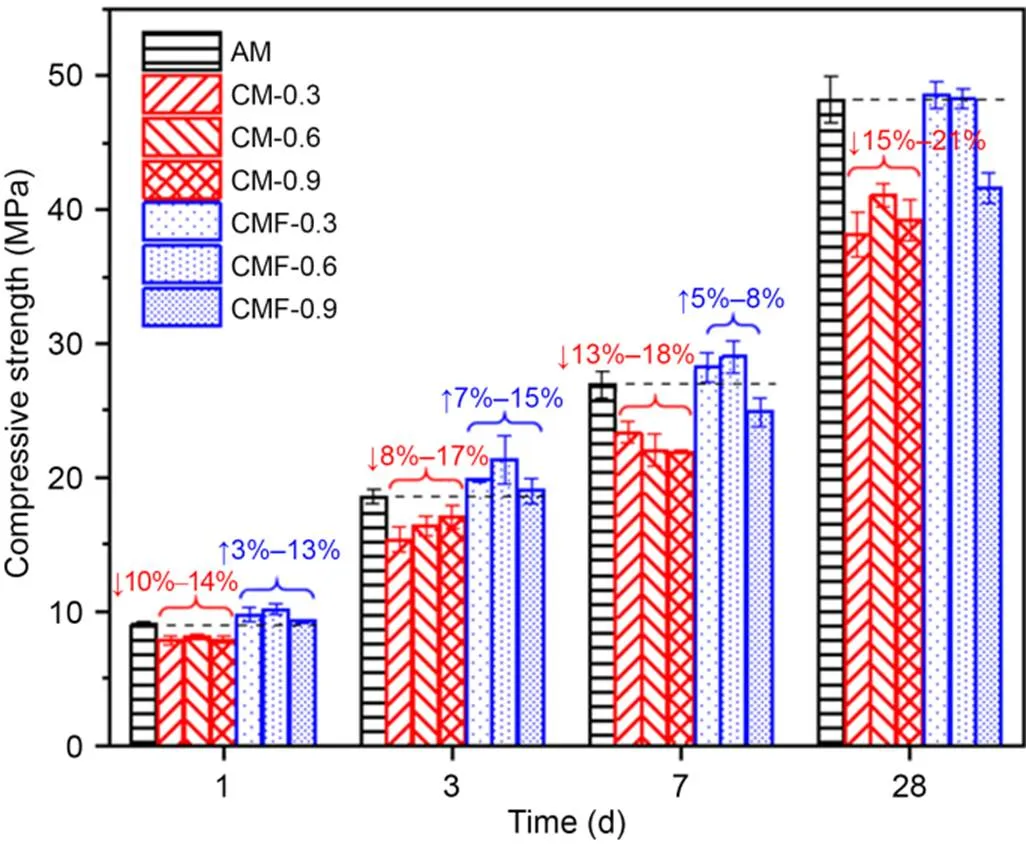
Fig. 8 Compressive strength of hardened cement pastes over time
3.2.2Sorptivity and water absorption
Fig. 9a shows the cumulative amount of water absorbed per unit area over the square root of time; the sorptivity coefficients (i.e., the slopes of the initial line fitting) are listed in Table 4, and are useful in terms of reflecting the capillary pores of the samples (Wang et al., 2022; Zhang et al., 2022). The CMF samples had a higher water sorptivity rate than the control AM and CM samples at the first 12 h, indicating that more connected pores had formed in the paste matrix. For instance, damp patches could be clearly seen on the top surface of the CMF-0.6 sample, unlike the corresponding CM-0.6 sample. It should be noted that the CM-0.9 sample had a relatively low sorptivity coefficient compared to other samples, probably because of a larger pore size in the matrix (Fig. 10a), composed mainly of closed air pores rather than connected ones.
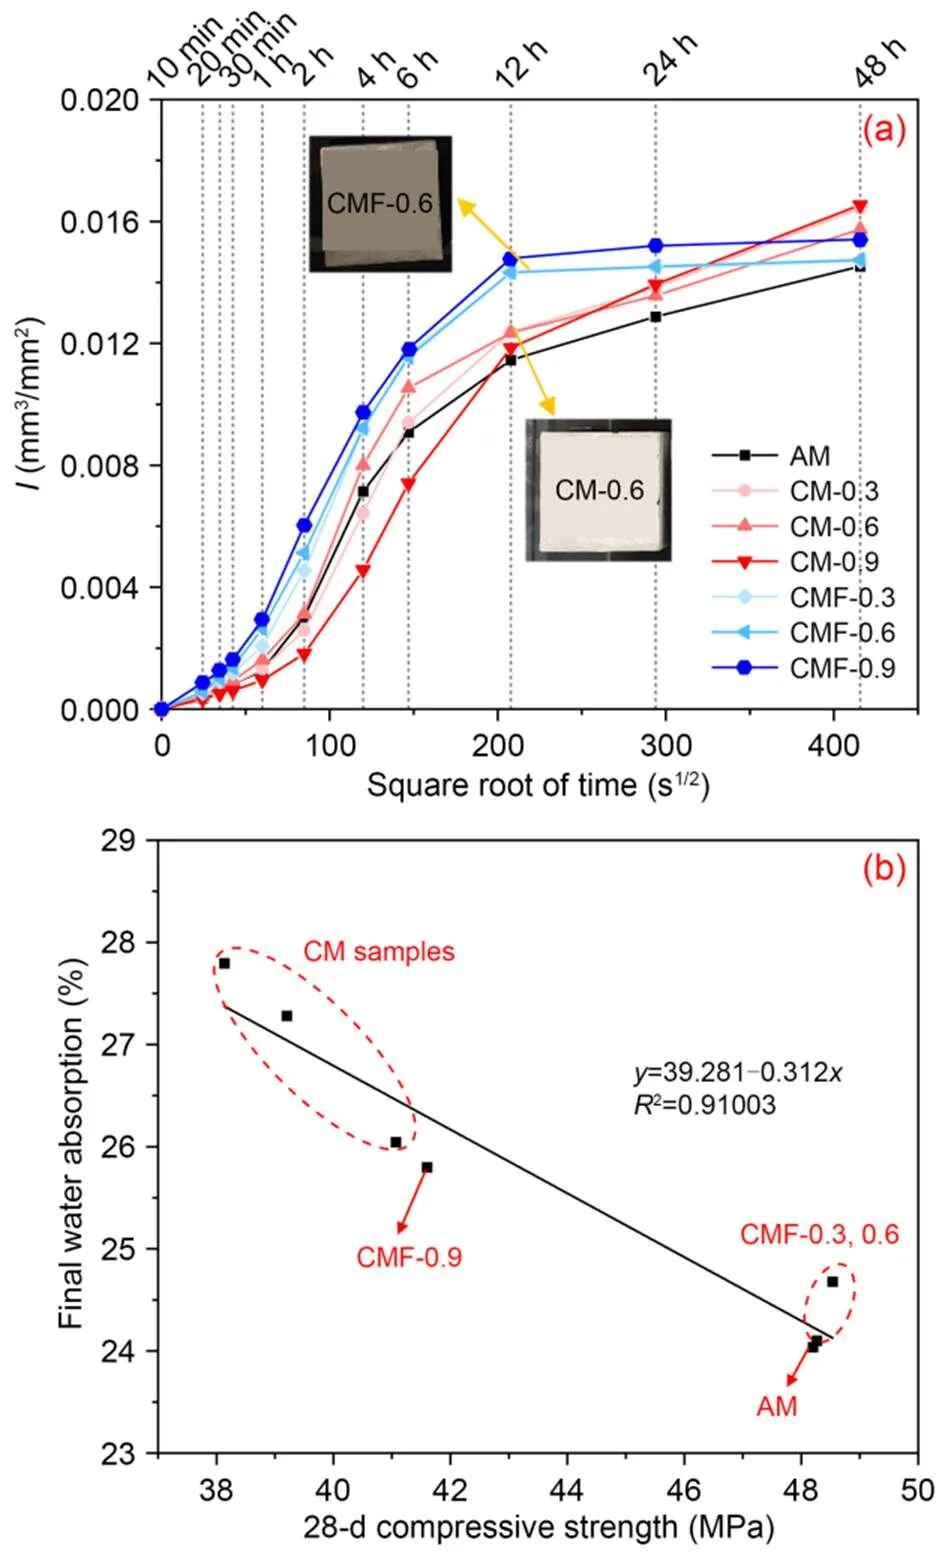
Fig. 9 Water sorptivity of CO2-mixing cement pastes over time (a) and relationship between 28-d compressive strength and final water absorption (b)
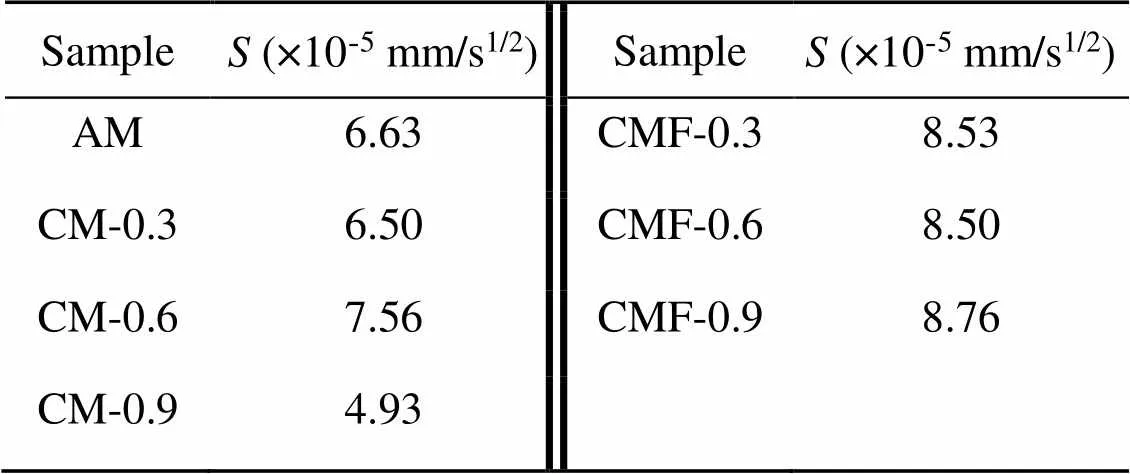
Table 4 Sorptivity coefficients (S) of the CO2-mixing cement pastes
The final water-absorption values of CMF samples (measured at 48 h of full water immersion) were about 6%–11% lower than those of CM samples, and CMF-0.9 had the highest value. As the porosity of a paste matrix determines its compressive strength, it is of interest to plot the final water absorption as a function of compressive strength. The final water-absorption values appeared to be well correlated with the compressive strength results at 28 d (Fig. 9b). This statistical relation suggested that the lower the final water absorption, the higher the compressive strength of the samples, regardless of the CO2-mixing dose or mixing approach.
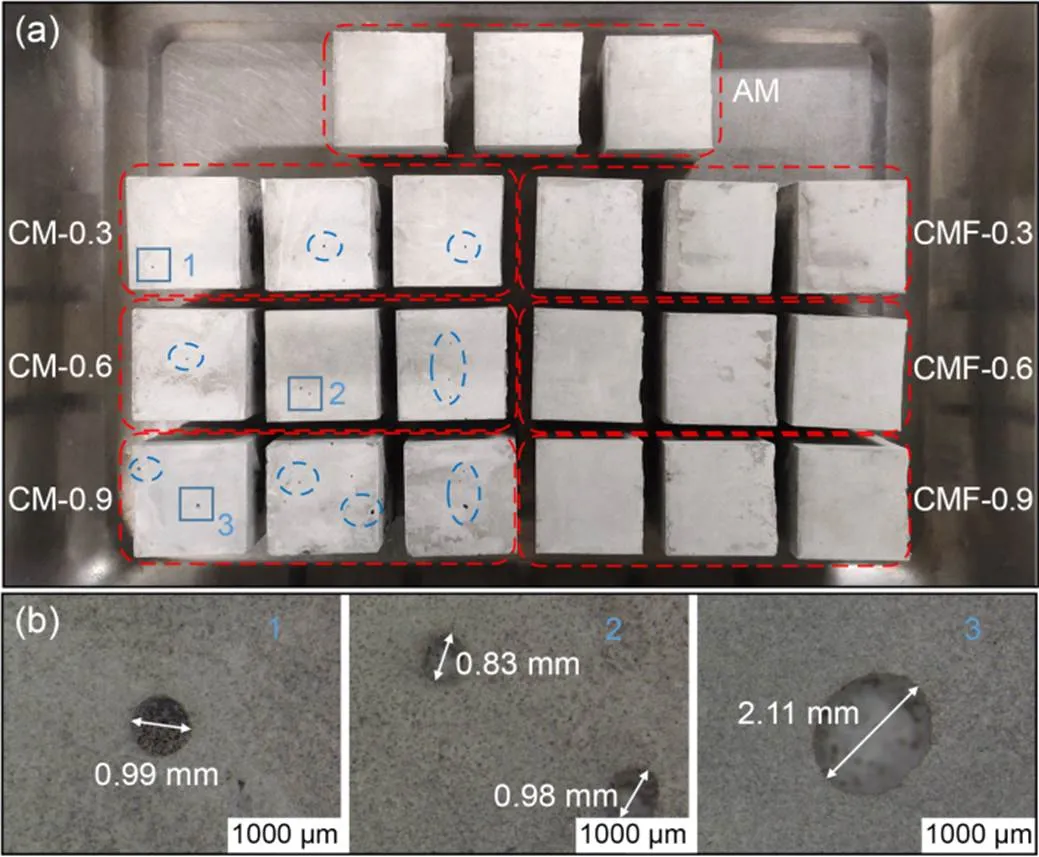
Fig. 10 Appearance of samples at 28 d (a) and pore sizes (b)
3.2.3Porosity analysis
An optical microscope and BSE were also used for close examination of the effects of CO2-mixing dose and further mixing time on the pore structures of the investigated samples. Fig. 10 shows that the pore size and the amount of pores appearing on the surface of the CM samples increased with higher CO2-mixing doses. This is understandable considering their low workability, which resulted in poor compacting and formation of cavities in the pastes. It is also congruent with the higher final water absorption and lower compressive strength of CM samples presented in Fig. 9b.
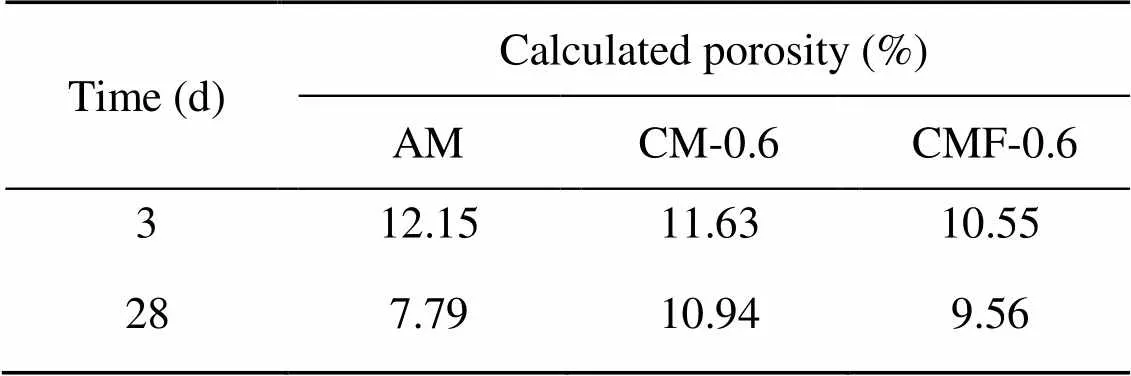
Table 5 shows the BSE porosity values of AM, CM-0.6, and CMF-0.6 samples, and the details of the porosity calculation and respective sample images are listed in Figs. S1 and S2 in the electronic supplementary materials (ESM). At 3 d, both the CM-0.6 and CMF-0.6 samples exhibited lower porosity than the control AM sample, in agreement with previous studies which reported that the presence of calcite in the cement matrix can promote early hydration and densify the microstructure (Monkman and MacDonald, 2016; Monkman et al., 2020). It is clear that the pore structure of all samples was refined over time (from 3 to 28 d) due to more complete hydration in the pastes. In comparison, the reduction of pore structure in the control sample (AM) was greater than those CO2-mixing samples. This implies that the presence of calcite may not be beneficial for porosity refinement during hydration.
3.2.4Reaction products of the hardened stage
Fig. 11a shows the evolution of CaCO3formation in CO2-mixing cement pastes over hydration time (up to 28 d). The CaCO3content increased with time at early ages (≤7 d), possibly due to the dissolved CO2in the pore solution leading to precipitation of CaCO3. However, CaCO3content decreased at 28 d because it reacted with tricalcium aluminate (C3A) and/or monosulfate (AFm) to form hemi-carbonaluminate (Hc) and mono-carbonaluminate (Mc) (Zajac et al., 2014; Ren et al., 2022) (Fig. S3). In general, the CM samples had a higher content of CaCO3than the control AM and CMF samples, because part of the injected CO2gas was released during the further mixing of 1 min.
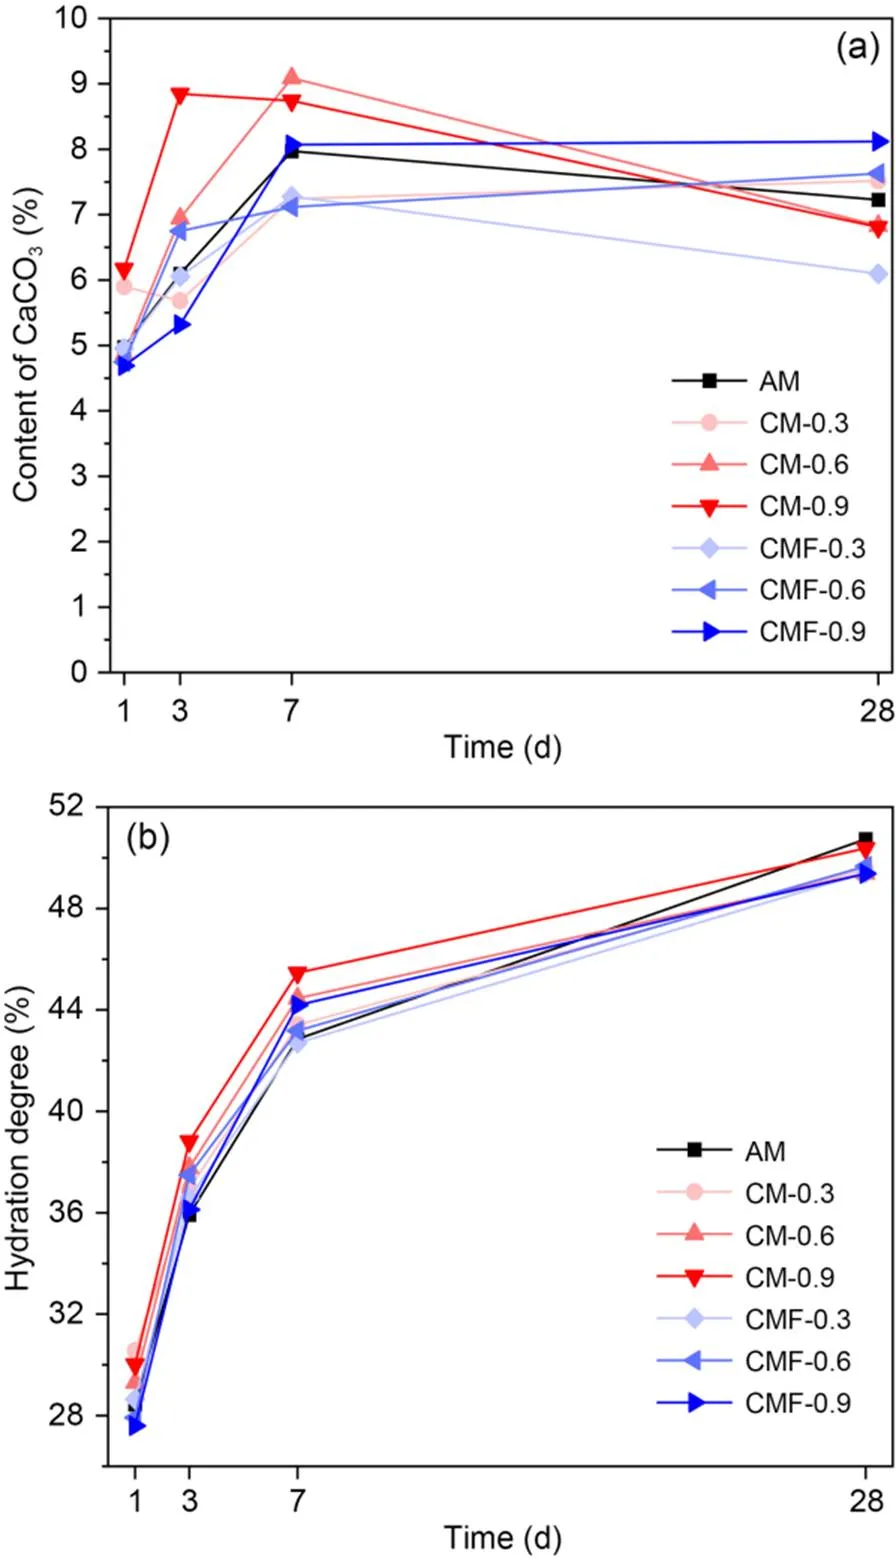
Fig. 11 The amount of CaCO3 detected in CO2-mixing cement pastes (a) and evolution of hydration degree over different hydration times (b)
The evolution of hydration degree over hydration time is plotted in Fig. 11b. At early ages (≤7 d), the hydration degree of both CM and CMF samples was generally higher than that of the control AM sample. In comparison, CM samples possessed a relatively higher hydration degree than CMF samples for a given CO2dose and curing age. This is due to a higher amount of actual reacted CO2promoting better cement hydration in CM samples. However, CM samples had a relatively low compressive strength, due to the poor compactness and larger pores associated with their lower workability. The AM sample displayed the highest hydration degree at 28 d, in line with the BSE porosity results (Table 5), proving that CO2mixing of the fresh cement paste only can promote early cement hydration.
4 Conclusions
In this study, the influence of CO2dose applied during mixing of cement pastes, as well as subsequent further mixing, on fresh and hardened properties of cement pastes was investigated. At the fresh stage, the introduction of CO2-mixing induces quick hardening, and flowability decreases dramatically with higher CO2doses. This is mainly associated with the flocculation network by the formation of hydrates and carbonates on the surface of the cement clinkers. However, with 1 min of further mixing, the workability of fresh cement pastes can be improved by 52.8%–84.9% because this breaks up the flocculation network and releases entrapped free water.
In terms of compressive strength, a direct CO2-mixing results in a ~10%–20% compressive strength loss at all curing ages, despite a higher degree of hydration. This is because of the poor compaction of the fresh cement mixture, which induces development of a more extensive pore structure in the hardened matrix. However, upon 1 min of further mixing, the overall compressive strength is enhanced by ~18%–32%, and demonstrated an early strength benefit of 3%–15% compared to the control sample. This is due to the hydration-promoting effect of the deposited CaCO3and a more densified microstructure. In addition, a strong linear correlation between 28-d compressive strength and water absorption was observed, indicating that pore distribution plays an important role in the alteration of strength for CO2-mixing cement pastes.
Acknowledgments
This work is supported by the Science and Technology Innovation Plan of Hunan Province (No. 2022WZ1010) and the Program Fund of Non-Metallic Excellence and Innovation Center for Building Materials (No. 2023Ph.D-6), China.
Author contributions
Minlu WANG designed the research, processed the corresponding data, and wrote the first draft of the manuscript. Shuang LUO and Ba Tung PHAM helped to organize the manuscript. Tung-Chai LING revised and edited the final version.
Conflict of interest
The authors declare that they have no known competing financial interests or personal relationships that could have influenced the work reported in this paper.
Akbar A, Liew KM, 2020. Influence of elevated temperature on the microstructure and mechanical performance of cement composites reinforced with recycled carbon fibers., 198:108245. https://doi.org/10.1016/j.compositesb.2020.108245
Ashraf W, 2016. Carbonation of cement-based materials: challenges and opportunities., 120:558-570. https://doi.org/10.1016/j.conbuildmat.2016.05.080
ASTM (American Society for Testing Materials), 2004. Standard Test Method for Measurement of Rate of Absorption of Water by Hydraulic-Cement Concretes, ASTM C1585-04. ASTM, USA.
ASTM (American Society for Testing Materials), 2013. Standard Test Method for Density, Absorption, and Voids in Hardened Concrete, ASTM C642-13. ASTM, USA.
ASTM (American Society for Testing Materials), 2014. Standard Practice for Measuring Hydration Kinetics of Hydraulic Cementitious Mixtures using Isothermal Calorimetry, ASTM C1679. ASTM, USA.
Berger RL, Young JF, Leung K, 1972. Acceleration of hydration of calcium silicates by carbon dioxide treatment., 240(97):16-18.
Camiletti J, Soliman AM, Nehdi ML, 2013. Effects of nano- and micro-limestone addition on early-age properties of ultra-high-performance concrete., 46(6):881-898. https://doi.org/10.1617/s11527-012-9940-0
Cao ML, Ming X, He KY, et al., 2019. Effect of macro-, micro-and nano-calcium carbonate on properties of cementitious composites‒a review., 12(5):781. https://doi.org/10.3390/ma12050781
Chung CW, Lee JY, 2011. Premature stiffening of cement paste caused by secondary gypsum and syngenite formation (false set)., 13(1):25-32. https://doi.org/10.5659/aikar.2011.13.1.25
Cui K, Lau D, Zhang YY, et al., 2021. Mechanical properties and mechanism of nano-CaCo3enhanced sulphoaluminate cement-based reactive powder concrete., 309:125099. https://doi.org/10.1016/j.conbuildmat.2021.125099
Dixit A, Du HJ, Pang SD, 2021. Carbon capture in ultra-high performance concrete using pressurized CO2curing., 288:123076. https://doi.org/10.1016/j.conbuildmat.2021.123076
Dixit A, Geng GQ, Du HJ, et al., 2022. The role of age on carbon sequestration and strength development in blended cement mixes., 133:104644. https://doi.org/10.1016/j.cemconcomp.2022.104644
GAQSIQ (General Administration of Quality Supervision, Inspection and Quarantine of the People’s Republic of China), 2008. Test Methods for Heat of Hydration of Cement, GB/T 12959-2008. National Standards of the People’s Republic of China (in Chinese).
GAQSIQ (General Administration of Quality Supervision, Inspection and Quarantine of the People’s Republic of China), 2012. Test Methods for Water Requirement of Normal Consistency, Setting Time and Soundness of the Portland Cement, GB/T 1346-2011. National Standards of the People’s Republic of China (in Chinese).
Guo JF, Wang L, Fan KP, et al., 2020. An efficient model for predicting setting time of cement based on broad learning system., 96:106698. https://doi.org/10.1016/j.asoc.2020.106698
Haha MB, de Weerdt K, Lothenbach B, 2010. Quantification of the degree of reaction of fly ash., 40(11):1620-1629. https://doi.org/10.1016/j.cemconres.2010.07.004
Han D, Ferron RD, 2015. Effect of mixing method on microstructure and rheology of cement paste., 93:278-288. https://doi.org/10.1016/j.conbuildmat.2015.05.124
Han D, Ferron RD, 2016. Influence of high mixing intensity on rheology, hydration, and microstructure of fresh state cement paste., 84:95-106. https://doi.org/10.1016/j.cemconres.2016.03.004
He Z, Li Z, Shao YX, 2017. Effect of carbonation mixing on CO2uptake and strength gain in concrete., 29(10):04017176. https://doi.org/10.1061/(ASCE)MT.1943-5533.0002031
Hossain M, Rashid H, Mahmud F, 2018. Effects of continuous mixing on mechanical problems of concrete. Proceedings of the 4th International Conference on Civil Engineering for Sustainable Development, article 4515.
Jiang Y, Ling TC, 2020. Production of artificial aggregates from steel-making slag: influences of accelerated carbonation during granulation and/or post-curing.Journal of CO Utilization, 36:135-144. https://doi.org/10.1016/j.jcou.2019.11.009
Kwasny J, Basheer PAM, Russell MI, 2014. CO2sequestration in cement-based materials during mixing process using carbonated water and gaseous CO2. Proceedings of the 4th International Conference on Durability of Concrete Structures, p.72-79. https://doi.org/10.5703/1288284315385
Li YS, Mehdizadeh H, Mo KH, et al., 2023. Co-utilization of aqueous carbonated basic oxygen furnace slag (BOFS) and carbonated filtrate in cement pastes considering reaction duration effect., 138:104988. https://doi.org/10.1016/j.cemconcomp.2023.104988
Lippiatt N, Ling TC, 2020. Rapid hydration mechanism of carbonic acid and cement., 31:101357. https://doi.org/10.1016/j.jobe.2020.101357
Lippiatt N, Ling TC, Eggermont S, 2019. Combining hydration and carbonation of cement using super-saturated aqueous CO2solution., 229:116825. https://doi.org/10.1016/j.conbuildmat.2019.116825
Liu LL, Ji YS, Gao FR, et al., 2021. Study on high-efficiency CO2absorption by fresh cement paste., 270:121364. https://doi.org/10.1016/j.conbuildmat.2020.121364
Liu XY, 2019. Research of the Hydration and Hardening Mechanism of Cement-Based Materials after Absorbing CO2in Mixing Stage. MS Thesis, China University of Mining and Technology, China (in Chinese).
Liu XY, Chen L, Liu AH, et al., 2012. Effect of nano-CaCO3on properties of cement paste., 16:991-996. https://doi.org/10.1016/j.egypro.2012.01.158
Luo S, Guo MZ, Ling TC, 2022. Mechanical and microstructural performances of fly ash blended cement pastes with mixing CO2during fresh stage., 358:129444. https://doi.org/10.1016/j.conbuildmat.2022.129444
Lyu K, She W, Miao CW, et al., 2019. Quantitative characterization of pore morphology in hardened cement paste via SEM-BSE image analysis., 202:589-602. https://doi.org/10.1016/j.conbuildmat.2019.01.055
Ma MT, Mehdizadeh H, Guo MZ, et al., 2021. Effect of direct carbonation routes of basic oxygen furnace slag (BOFS) on strength and hydration of blended cement paste., 304:124628. https://doi.org/10.1016/j.conbuildmat.2021.124628
Mehdizadeh H, Cheng XF, Mo KH, et al., 2022. Upcycling of waste hydrated cement paste containing high-volume supplementary cementitious materials via CO2pre-treatment., 52:104396. https://doi.org/10.1016/j.jobe.2022.104396
Mehdizadeh H, Mo KH, Ling TC, 2023. CO2-fixing and recovery of high-purity vaterite CaCO3from recycled concrete fines., 188:106695. https://doi.org/10.1016/j.resconrec.2022.106695
Monkman S, MacDonald M, 2016. Carbon dioxide upcycling into industrially produced concrete blocks., 124:127-132. https://doi.org/10.1016/j.conbuildmat.2016.07.046
Monkman S, MacDonald M, 2017. On carbon dioxide utilization as a means to improve the sustainability of ready-mixed concrete., 167:365-375. https://doi.org/10.1016/j.jclepro.2017.08.194
Monkman S, MacDonald M, Hooton RD, et al., 2016. Properties and durability of concrete produced using CO2as an accelerating admixture., 74:218-224. https://doi.org/10.1016/j.cemconcomp.2016.10.007
Monkman S, Kenward PA, Dipple G, et al., 2018. Activation of cement hydration with carbon dioxide., 7(3):160-181. https://doi.org/10.1080/21650373.2018.1443854
Monkman S, Lee BEJ, Grandfield K, et al., 2020. The impacts of in-situ carbonate seeding on the early hydration of tricalcium silicate., 136:106179. https://doi.org/10.1016/j.cemconres.2020.106179
Monteagudo SM, Moragues A, Gálvez JC, et al., 2014. The degree of hydration assessment of blended cement pastes by differential thermal and thermogravimetric analysis. Morphological evolution of the solid phases, 592:37-51. https://doi.org/10.1016/j.tca.2014.08.008
Peng Y, Zeng Q, Xu SL, et al., 2020. BSE‐IA reveals retardation mechanisms of polymer powders on cement hydration., 103(5):3373-3389. https://doi.org/10.1111/jace.16982
Ren PF, Ling TC, Mo KH, 2022. CO2pretreatment of municipal solid waste incineration fly ash and its feasible use as supplementary cementitious material., 424:127457. https://doi.org/10.1016/j.jhazmat.2021.127457
SBQTS (The State Bureau of Quality and Technical Supervision), 1999. Method of Testing Cements‒Determination of Strength, GB/T 17671-1999. National Standards of the People’s Republic of China (in Chinese).
Urban K, Sicakova A, 2018. The effect of mixing technique and prolonged mixing time on strength characteristics of concrete., 2(20):1290. https://doi.org/10.3390/proceedings2201290
Wang Y, Li LS, An MZ, et al., 2022. Factors influencing the capillary water absorption characteristics of concrete and their relationship to pore structure., 12(4):2211. https://doi.org/10.3390/app12042211
Zajac M, Rossberg A, le Saout G, et al., 2014. Influence of limestone and anhydrite on the hydration of Portland cements., 46:99-108. https://doi.org/10.1016/j.cemconcomp.2013.11.007
Zhang CY, Zhang SF, Yu JW, et al., 2022. Water absorption behavior of hydrophobized concrete using silane emulsion as admixture., 154:106738. https://doi.org/10.1016/j.cemconres.2022.106738
Zhang D, Ghouleh Z, Shao YX, 2017. Review on carbonation curing of cement-based materials.Journal of CO Utilization, 21:119-131. https://doi.org/10.1016/j.jcou.2017.07.003
Zhao KY, Zhao LJ, Zhang XB, et al., 2022. An experimental study on the mixing process and properties of concrete based on an improved three-stage mixing approach., 55(5):134. https://doi.org/10.1617/s11527-022-01976-y
Figs. S1–S3
不同CO2搅拌剂量及后续搅拌对水泥浆体新拌和硬化性能的影响
汪珉璐,罗双,Ba Tung Pham,林忠财
湖南大学,土木工程学院,中国长沙,410082
本文旨在探究不同CO2搅拌剂量对于水泥浆体新拌及硬化性能的影响,通过延长搅拌时间来提升其性能,并通过热重分析、扫描电镜观察等微观分析探究CO2与新拌水泥浆体之间的反应机理。1. 采用定制的具有气密性的搅拌仪器;2. 通过延长搅拌时间改善CO2搅拌水泥浆体的流动性和微观结构。1. 通过流动性、凝结时间、水化热测试对水泥浆体的新拌性能进行表征;2. 通过抗压强度、吸水性及吸水率测试对水泥浆体的硬化性能进行表征;3. 通过热重分析、扫描电镜观察、背散射电子图像分析对样品的微观结构进行表征。1. 随着CO2剂量的增加,水泥浆体的流动性急剧下降,甚至失去塑性,这主要与水泥熟料表面生成的水合物和碳酸盐所形成絮凝网络有关。2 在施加1 min的后续搅拌后,新拌水泥浆体的流动性可以提高53%~85%,这是因为絮凝结构被破坏,被束缚的自由水释放。3. CO2搅拌会造成抗压强度降低约10%~20%,这是由于新拌水泥浆体的流动性差,导致硬化基质中形成了更多的孔隙结构。4. 在施加1 min的后续搅拌后,其抗压强度提高18%~32%;与对照样品相比,早期强度提高3%~15%,这是由于沉积的CaCO3的水化促进作用和其更致密的微观结构。5. 样品的28 d抗压强度与吸水率之间存在较强的线性相关性,说明孔隙分布对CO2搅拌水泥浆体强度变化起着重要作用。
微流体;燃料电池;无膜;斜槽微混合器;传质;耗尽边界层
https://doi.org/10.1631/jzus.A2200571
https://doi.org/10.1631/jzus.A2200571
Revision accepted Mar. 28, 2023;
Crosschecked Sept. 20, 2023
© Zhejiang University Press 2023
28, 2022;
猜你喜欢
建材发展导向(2021年8期)2021-06-07
建材发展导向(2021年24期)2021-02-12
钻井液与完井液(2019年4期)2019-10-10
智富时代(2018年7期)2018-09-03
智富时代(2018年7期)2018-09-03
电线电缆(2017年4期)2017-07-25
海峡科技与产业(2016年3期)2016-05-17
石油知识(2016年2期)2016-02-28
铁道科学与工程学报(2015年5期)2015-12-24
中国石油大学学报(自然科学版)(2015年2期)2015-11-10
 Journal of Zhejiang University-Science A(Applied Physics & Engineering)2023年10期
- Journal of Zhejiang University-Science A(Applied Physics & Engineering)的其它文章
- Micro-Newton scale variable thrust control technique and its noise problem for drag-free satellite platforms: a review
- Geo-environmental properties and microstructural characteristics of sustainable limestone calcined clay cement (LC3) binder treated Zn-contaminated soils
- Design and comparative analysis of self-propelling drill bit applied to deep-sea stratum drilling robot
- Experimental investigation of the thermal insulation performance of Ce/Si/Ti oxide heat-reflective coating
- Microfluidic fuel cells integrating slanted groove micro-mixers to terminate growth of depletion boundary layer thickness
- Using pipette tips to readily generate spheroids comprising single or multiple cell types