A Mg alloy with no hydrogen evolution during dissolution
Fuyong Co ,Bo Xio ,Ziming Wng ,To Ying ,Djing Zheng ,Anrej Atrens ,Gung-Ling Song,b,,∗
a Center for Marine Materials Corrosion and Protection,College of Materials,Xiamen University,422 S. Siming Rd.,Xiamen 361005,China
b State Key Laboratory of Physical Chemistry of Solid Surfaces,College of Chemistry and Chemical Engineering,Xiamen University,422 S. Siming Rd,Xiamen 361005,China
cNational Engineering Research Center of Light Alloy Net Forming,School of Materials Science and Engineering,Shanghai Jiao Tong University,Shanghai 200240,China
d School of Mechanical and Mining Engineering,The University of Queensland,St Lucia,Brisbane,QLD 4072,Australia
Abstract Hydrogen evolution is normally associated with the corrosion or dissolution of Mg alloys in aqueous solutions.This work studied the corrosion behavior of sputtered pure Mg,Mg82Zn18 (at.%),Mg64Zn36 (at.%),and pure Zn in 3.5% NaCl solution.Mg64Zn36 had (i) an amorphous microstructure with some nano-scale grains,(ii) a corrosion rate substantially lower than that of pure Mg,and (iii) no hydrogen evolution during corrosion or anodic dissolution,because the positive corrosion potential retarded the cathodic hydrogen evolution.This is a new route to prevent hydrogen evolution during Mg corrosion,which has never previously been realized.
Keywords: Magnesium;hydrogen evolution;metal glass;anodic dissolution.
1.Introduction
Mg alloys have increasing utilization in automobiles,aerospace and electronics because of their high strength to weight ratio [1,2].They have also attracted increasing attention as biomedical components due to their good biocompatibility and attractive physical properties [3,4].Furthermore,Mg alloys are used as Mg-air battery anodes since Mg possesses a large negative electrode potential in aqueous environments and a high theoretical energy density [5,6].However,their poor corrosion resistance remains a main issue that limits the more widespread applications of Mg alloys [7–10].
Hydrogen evolution is an integral part of Mg corrosion,which has the following overall corrosion reaction [11–13] in aqueous solutions:
It is composed of the following two overall partial electrochemical reactions as:
Hydrogen evolution produced by the cathodic partial reaction (Eq.(3)) decreases for anodic polarization.In contrast,the rate of anodic hydrogen evolution for Mg typically increases with increasing anodic polarization,which has been termed as the negative difference effect (NDE) [11,13].The evolved hydrogen may be harmful for Mg components such as biodegradable implants,structure materials and anode materials for Mg battery anodes.
In contrast,Zn corrosion mainly involves oxygen reduction as the cathodic partial reaction in neutral or alkaline solutions,because Zn is less active [14].
Alloying is a widely studied method to improve the corrosion resistance of Mg alloys [15–18].However,there are few Mg alloys that have been produced with a corrosion rate lower than the intrinsic Mg corrosion rate of 0.3 mm/y in a concentrated chloride solution [7,15,19].
The influence of Zn on the corrosion of Mg alloys has been widely studied because Zn is an important alloying element in such Mg alloys as the AZ and ZE series [20,21].Increasing Zn content causes the corrosion rate to decrease initially and then increase [4,22–26].A minor addition of Zn refines the grains,provides more electrochemically stable regions and inhibits corrosion propagation,decreasing the corrosion rate[4].In contrast,a Zn concentration in excess of the limited solid solubility leads to the precipitation of Zn-containing intermetallic particles which are nobler than theα-Mg matrix,and increase the corrosion rate by promoting micro-galvanic corrosion between the second phases and theα-Mg matrix[22,25,26].
Mg-Zn alloys produced through non-equilibrium techniques may possess good corrosion properties.A large extension of the Zn solid solubility in the Mg matrix is possible through non-equilibrium techniques,such magnetron sputtering or rapid cooling during melt spinning[3,27,28].There was no hydrogen evolution on the melt spun MgZnCa glasses in the study by Zberg et al.[3] above the Zn threshold of ∼28 at.% attributed to the formation of passivating layers.In addition,it is quite likely that a passive film inhibited hydrogen evolution in 0.01 M NaCl (pH=12) of the amorphous binary Mg-Y alloys,Mg65Cu25Y10and Mg65Ni20Nd15obtained from melt spinning [29,30].However,related research has been rare so far.
The present research aims to evaluate the influence of Zn on the corrosion behavior of single-phase Mg-Zn alloys in order to explore the possibility of a MgZn alloy with superior corrosion properties.The corrosion behavior were studied for magnetron sputtered pure Mg,Mg82Zn18(at.%),Mg64Zn36(at.%) and pure Zn.Furthermore,the corrosion mechanism of the sputtered MgZn alloys was also analyzed.The current study aims to explore a totally new route,besides passivation,to inhibit the hydrogen evolution from Mg during corrosion,providing a foundation for the application of new Mg alloys in biodegradable batteries to provide on-board power for transient implantable medical devices.
2.Experimental methods
2.1. Materials and specimens
Targets of pure Mg(99.95 wt.%)and pure Zn(99.95 wt.%)from Trillion Metals Co.Ltd.were individually sputtered or co-sputtered using a MSP-300B magnetron sputtering system from Beijing Chuangshi Weina Technique Co.Ltd.to
produce the specimens on glass substrates,which had been rinsed with ethanol,deionized water,and dried in warm following air before being placed in the magnetron sputtering chamber.The sputtering was carried out in a base pressure less than 8 × 10⁻⁴Pa and a working pressure of 0.35 Pa.Direct current guns were employed in the current study because they have a higher deposition rate for metals than radio frequency guns.The sputtering time was 7200 s and the thickness of the specimens was about 8 μm.The chemical composition of pure Mg,Mg82Zn18(at.%),Mg64Zn36(at.%)and pure Zn specimens was determined by an iCAP 7000 Series optical emission spectroscopy (ICP-OES) from Thermo Scientific Company as shown in Table 1.At least three specimens were prepared for each test.

Table 1Compositions of the MgZn alloy with the corresponding power of the sputter deposition process.
The microstructure of the specimens was analyzed using a SU70 scanning electron microscope (SEM) with an accelerating voltage 15 kV.The crystalline phases of the specimens were determined by X-ray diffraction (XRD) on a Rigaku D/max 2550 X-ray Diffractometer with a Cu-Kαradiation source.
2.2. Immersion tests
Each sputtered specimen,with an exposed area of 2.25 cm2,was immersed in a 3.5% NaCl solution for 48 h as shown in Fig.1(without reference electrode and counter electrode) and observedin-situusing a 3D Digital Microscope,Leica DVM6.Reagent grade chemicals and distilled water were used.The evolved hydrogen during the immersion test was collected into a burette by a funnel above the specimen.However,there was no observable hydrogen evolved during the immersion test for Mg64Zn36and pure Zn.Because there was no measurable evolved hydrogen,and because of the high inherent error of the weight loss method for specimens of low weight,atomic emission spectroelectrochemistry measurement was employed to determine the corrosion rate of the specimens instead of the traditional hydrogen evolution and weight loss methods [31],taking care to ensure that there was no deposition of Mg(OH)2during the experiment,which can make this technique highly inaccurate [9].1 mL of the electrolyte was taken out from the total 40 mL electrolyte using a pipette at the same position near the exposed surface during the immersion period.Each time 1 mL fresh 3.5% NaCl was added to the electrolyte taken out to ensure the total volume of the electrolyte was constant at 40 mL.The removed electrolyte was diluted into 10 mL using nitric acid,the content of Mg2+and Zn2+was determined using ICP-OES and the measured values converted to the weight loss,W,(mg cm-2d-1) using the same method as the weight loss method [32].The corrosion rate,PW(mm/y),of each specimen was calculated according to the following equation:
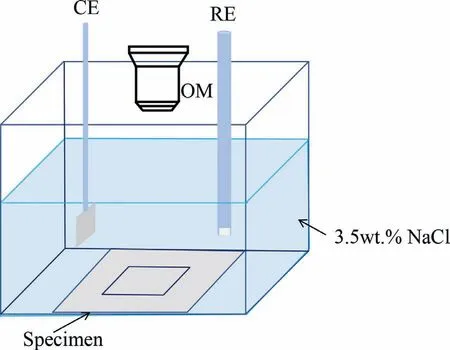
Fig.1.Schematic of the set-up for the in-situ immersion test and electrochemical test.
The densities (ρ,g/cm3) of Mg,Mg82Zn18,Mg64Zn36and Zn are1.74,2.68,3.65 and 7.14 g/cm3,respectively.While the corrosion rate (PH,mm/y) was calculated from hydrogen evolution volume according to the following equation:
TheVH(mL cm-2d-1) is the hydrogen evolution rate andM(g moL-1) is the molar mass,which is 24 for Mg and 31 for Mg82Zn18.During the test the pH value of the solution for each specimen was measured using a Mettler Toledo pH Meter.The solubility-product constant,Ksp,of Mg(OH)2is 1.8 × 10⁻¹¹[33],which corresponds to 0.113 mg/cm2of Mg2+in the current study before precipitation.It is noted the precipitation of Zn2+was seriously influenced by the variation of solution pH caused by the dissolution Mg and CO2from ambient air.Therefore,the initial 12 h dissolution content of the ions was used to calculate the corrosion rate of the specimens to ensure accuracy.
After the immersion test,the corrosion product was characterized using SU70 SEM and XRD in the same manner as the microstructure analysis before the immersion test.
Thein-situelectrochemical measurements were carried out using a Gamry Interface 1010E electrochemical workstation and a typical three-electrode electrolytic cell in 3.5% NaCl solution as shown in Fig.1.The reference electrode was Ag/AgCl/Sat.KCl and the counter electrode was a Pt mesh 1.5 × 1.5 cm.The electrochemical behavior was documentedin-situusing a 3D Digital Microscope Leica DVM6 during the experiment.Each specimen was immersed in the solution for 1200 s initially and the open circuit potential (OCP)was recorded.Then the electrochemical impedance spectra(EIS) were measured in the frequency range from 100kHz to 10 mHz with an AC amplitude of 5 mV.The EIS were fitted using the Zview package.The polarization resistance (Rp)is the resistance at zero frequency,which is the sum of the electrochemical reaction resistanceRaand the film resistanceRfin this research [15,34].
Finally,the polarization curve was measured fromEcorr–300 mV toEcorr+300 mV at a scan rate of 1 mV/s.The Tafel extrapolation method was used to evaluate the corrosion current densityicorr(mA/cm2) in the range fromEcorr–240 mV toEcorr+150 mV as the anodic branch for some specimens was not regular using the CorrView-3.0 package(by Scribe Associates,Inc.,USA).
The potentiostatic experiment with hydrogen collection was carried out for each specimen in 3.5% NaCl solution at OCP+0.1 V and OCP+0.3 V for 1 h.
3.Results
3.1. Microstructure
Figure 2 presents typical SEM micrographs of the sputterdeposited specimens.Figure 2(a) shows that the microstructure of sputtered pure Mg consisted of worm-like grains with some grain clusters distributed in the matrix.Figure 2(b) and(c) shows a rather different microstructure for Mg82Zn18in which the grains have a polygon shape.The gray spots in Fig.2(b) were identified as the junctions of several grains as shown in Fig.2(c).Figure 2(d) and (e) show that the microstructure of Mg64Zn36had a smooth dense surface.The hemi-spherical microstructures in Fig.2(d) were grain clusters as in Fig.2(e).Figure 2(f) shows that pure Zn had a rough surface with frequent grain clusters.The morphology of Zn was different to that of Mg,Mg82Zn18and Mg64Zn36.
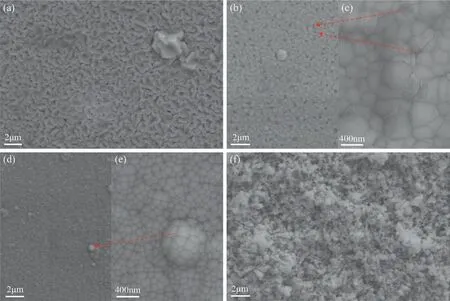
Fig.2.Typical SEM micrographs of the sputter deposited specimens: (a) Mg,(b,c) Mg82Zn18,(d,e) Mg64Zn36,(f) Zn.
Figure 3 shows the XRD patterns.Figure 3(a) and (b)indicate that,for Mg and Mg82Zn18,there was (i) onlyα-Mg,(ii) complete crystallinity,and (iii) significant texture for Mg82Zn18.In contrast,Fig.3(c) indicates that,for Mg64Zn36,there were (i) broad peaks indicating an amorphous structure,and (ii) some small peaks indicating the presence of some nano-scale grains.Figure 3(d) shows that the Zn was fully crystalline containing only the Zn phase.
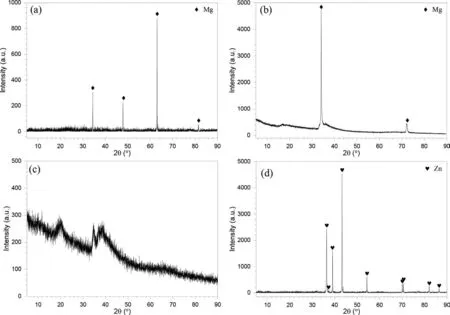
Fig.3.X-ray diffraction (XRD) patterns of the sputter-deposited specimens: (a) Mg,(b) Mg82Zn18,(c) Mg64Zn36,(d) Zn.
3.2. Immersion test
Figure 4(a) shows the evolved hydrogen volume during the immersion test in 3.5% NaCl for 48 h at OCP.The hydrogen volume of Mg and Mg82Zn18increased approximately linearly in the initial 12 h and the hydrogen evolution rate slowed down in the rest time.The average hydrogen evolution rate of Mg and Mg82Zn18was 0.10 ± 0.02 mL cm-2d-1and 0.16 ± 0.01 mL cm-2d-1,corresponding to 0.21 ± 0.04 mm/y and 0.28 ± 0.02 mm/y,respectively.However,there was no evolved hydrogen during the immersion test for Mg64Zn36and Zn.
Figure 4(b) and (c) presents the normalized weight dissolved from the specimens immersed in 3.5% NaCl solution at OCP for 48 h.The Mg2+data indicated that the dissolution rate decreased as: Mg82Zn18>Mg >Mg64Zn36.The corrosion rate for Mg in the initial 12 h was 0.23 ± 0.03 mm/y and was comparable to the intrinsic corrosion rate of Mg in this solution as expected [7].The content of Mg2+from Mg82Zn18increased in the initial 24 h and then tended to a stable value which represented the solubility in the solution.The corrosion rate for Mg64Zn36was 0.05 ± 0.01 mm/y and was substantially less than the corrosion rate of pure Mg in this solution.The final pH of the Mg82Zn18solution was 8.97,while the pH was 8.89,8.76 and 6.80 for the solutions of Mg,Mg64Zn36and Zn.For Zn2+,only some Zn dissolved during the immersion test.The content from Mg82Zn18and Mg64Zn16was low,almost at the detection limit of ICP-OES.The low content of Zn2+might be due to the solution pH influenced by the dissolution Mg and CO2from ambient air.
Thein-situoptical microscope observation showed that there was more hydrogen evolution on the Mg82Zn18specimen than that on Mg,which was consistent with the higher dissolution amount of Mg2+in Fig.4(b).There were no visible hydrogen bubbles on Mg64Zn36and Zn.The corrosion process of all the specimens processed uniformly with increasing immersion time.

Fig.4.Hydrogen evolution and dissolution weight of the sputter deposited specimens immersed in 3.5 wt.% NaCl solution at the open circuit potential (OCP)for 48 h at 25 ± 2 oC: (a) hydrogen evolution curves,(b) dissolution weight of all the specimens,(c) dissolution weight of Zn2+ for Mg82Zn18 and Mg64Zn36.
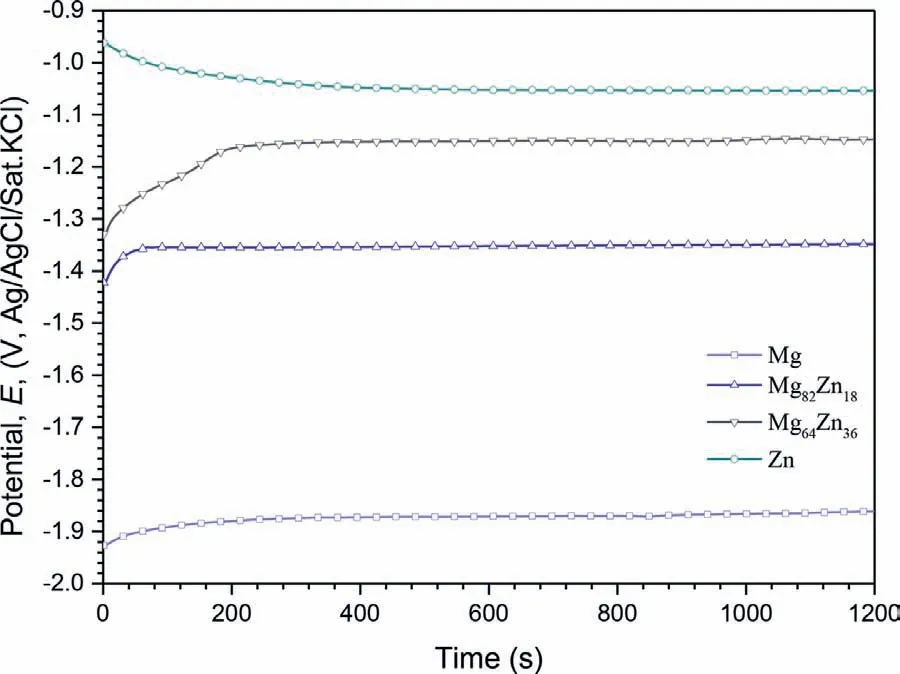
Fig.5.The variation of OCP values of the sputter deposited specimens in 3.5 wt.% NaCl for 1200 s at 25 ± 2 oC.
3.3. Electrochemical measurements
Figure 5 shows the values of the OCP for the specimens in 3.5%NaCl for 1200 s.The initial OCP for Mg,Mg82Zn18and Mg64Zn36was-1.95 V,-1.42 V and-1.33 V,respectively,and increased to a stable value of-1.87 V,-1.36 V and-1.16 V in a short time.However,the initial OCP for Zn was-0.96 V,and decreased to-1.05 V.
Figure 6 shows the EIS data measured at the OCP for the specimens in 3.5% NaCl.The Nyquist plots for all the specimens were interpreted to all have the same shape with two capacitive loops.However,the diameters of the loops were significantly different.The EIS plots were well fitted by the previous used equivalent circuit for Mg corrosion [5] as shown in Fig.6,in which,Rsis the solution resistance.The pseudo capacitance,Ca,and pseudo resistance,Ra,are for the electrochemical reactions at the film/Mg interface,respectively.The surface film capacitance,Cf,is proportional to film defects and reciprocal to film thickness.The film resistance,Rf,is determined by the film defects.Table 2 presents the EIS fitting data of the plots which indicate that the Mg64Zn36has a significant larger value ofRpcompared with Mg and Mg82Zn18,which is consistent with that the Mg64Zn36has the best corrosion resistance among the three materials.However,the value ofRpfor Zn is small,which is inconsistent with the corrosion resistance sequence indicated from the ICP-OES.In addition,the format of Zn Nyquist plots indicates that the dissolution of Zn was controlled by the diffusion of oxygen on some degree.

Table 2EIS parameters obtained from curve-fitting for MgZn alloy immersed in 3.5% NaCl solution at OCP.
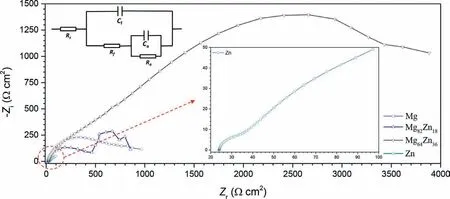
Fig.6..The EIS data measured at OCP of the sputter deposited specimens in 3.5 wt.% NaCl at 25 ± 2 oC.
Figure 7 shows the polarization curves of the specimens in the 3.5% NaCl.The values ofEcorrshifted to more positive values with increasing Zn content.The cathodic curve for Mg82Zn18indicated much more hydrogen production at any value of cathodic potential which was consistent with the higher measured corrosion rate in Fig.4(b) and (c),but this was not reflected in the value oficorrwhich was similar to that of Mg.The cathodic curve for Mg64Zn36indicated a similar rate of the cathodic partial reaction at any value of cathodic potential compared with Mg82Zn18which was not consistent with the measured corrosion rate in Fig.4(b) and (c),the value oficorrwas considerably lower.There was a small flat region on the anodic branch for Mg64Zn36,while such a region was absent for the other specimens.Table 3 shows that the Mg64Zn36had a small value oficorras 18 ± 8 μA/cm2evaluated from Tafel extrapolation,followed by that of Zn of 36 ± 29 μA/cm2.

Table 3Electrochemical parameters evaluated by Tafel extrapolation for MgZn alloy immersed in 3.5% NaCl solution.
The surface of the specimens during the electrochemical measurement was observed simultaneously using the optical microscope.Images were recorded at the typical polarized potentials as indicated in Fig.7 and are present in Fig.8.Figure 8(a1)–(d1) shows that there was some hydrogen bubbles adsorbed on the specimen surface of Mg,Mg82Zn18and Mg64Zn36at a cathodic polarized potential,but as expected,there was no bubbles on the Zn surface at a cathodic polarization.When the potential shifted to the OCP,the hydrogen evolution rate from Mg and Mg82Zn18decreased,and became zero for Mg64Zn36as indicated in Fig.8(c2).For Mg and Mg82Zn18,as the anodic polarized potential increased above the OCP,the hydrogen evolution became increasingly serious,and changed from discrete bubbles to continuous hydrogen flow.However,hydrogen evolution was totally different for Mg64Zn36and Zn in that there was no hydrogen evolved during the anodic polarization,even at the significant polarized potentialEcorr+280 mV.The specimens of Mg64Zn36and Zn turned white after the polarization test due to the formation of the corrosion products.
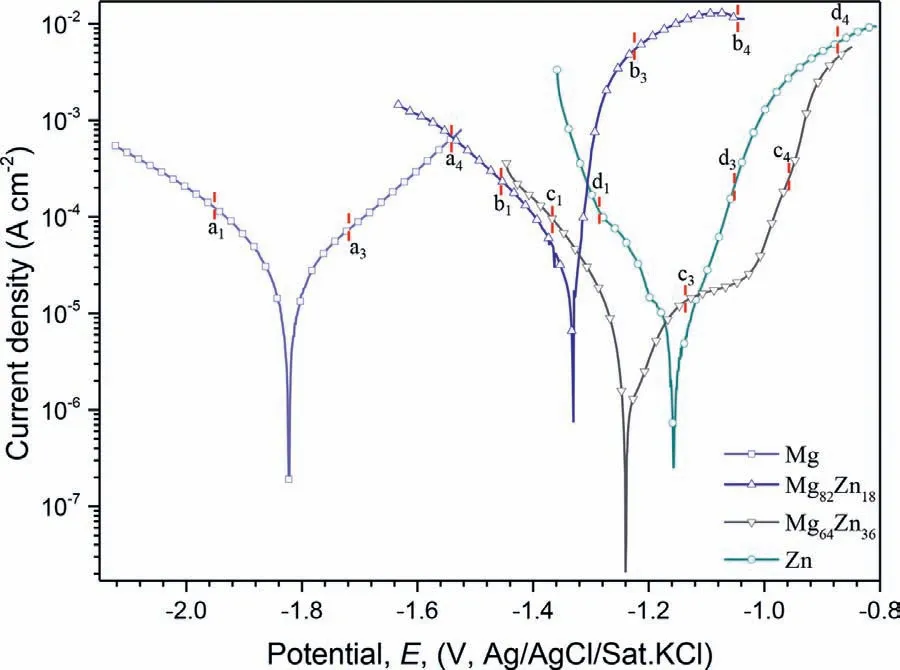
Fig.7.Polarization curves of the specimens measured after 1 h immersion in the 3.5 wt.% NaCl solution at OCP at 25 ± 2 oC.
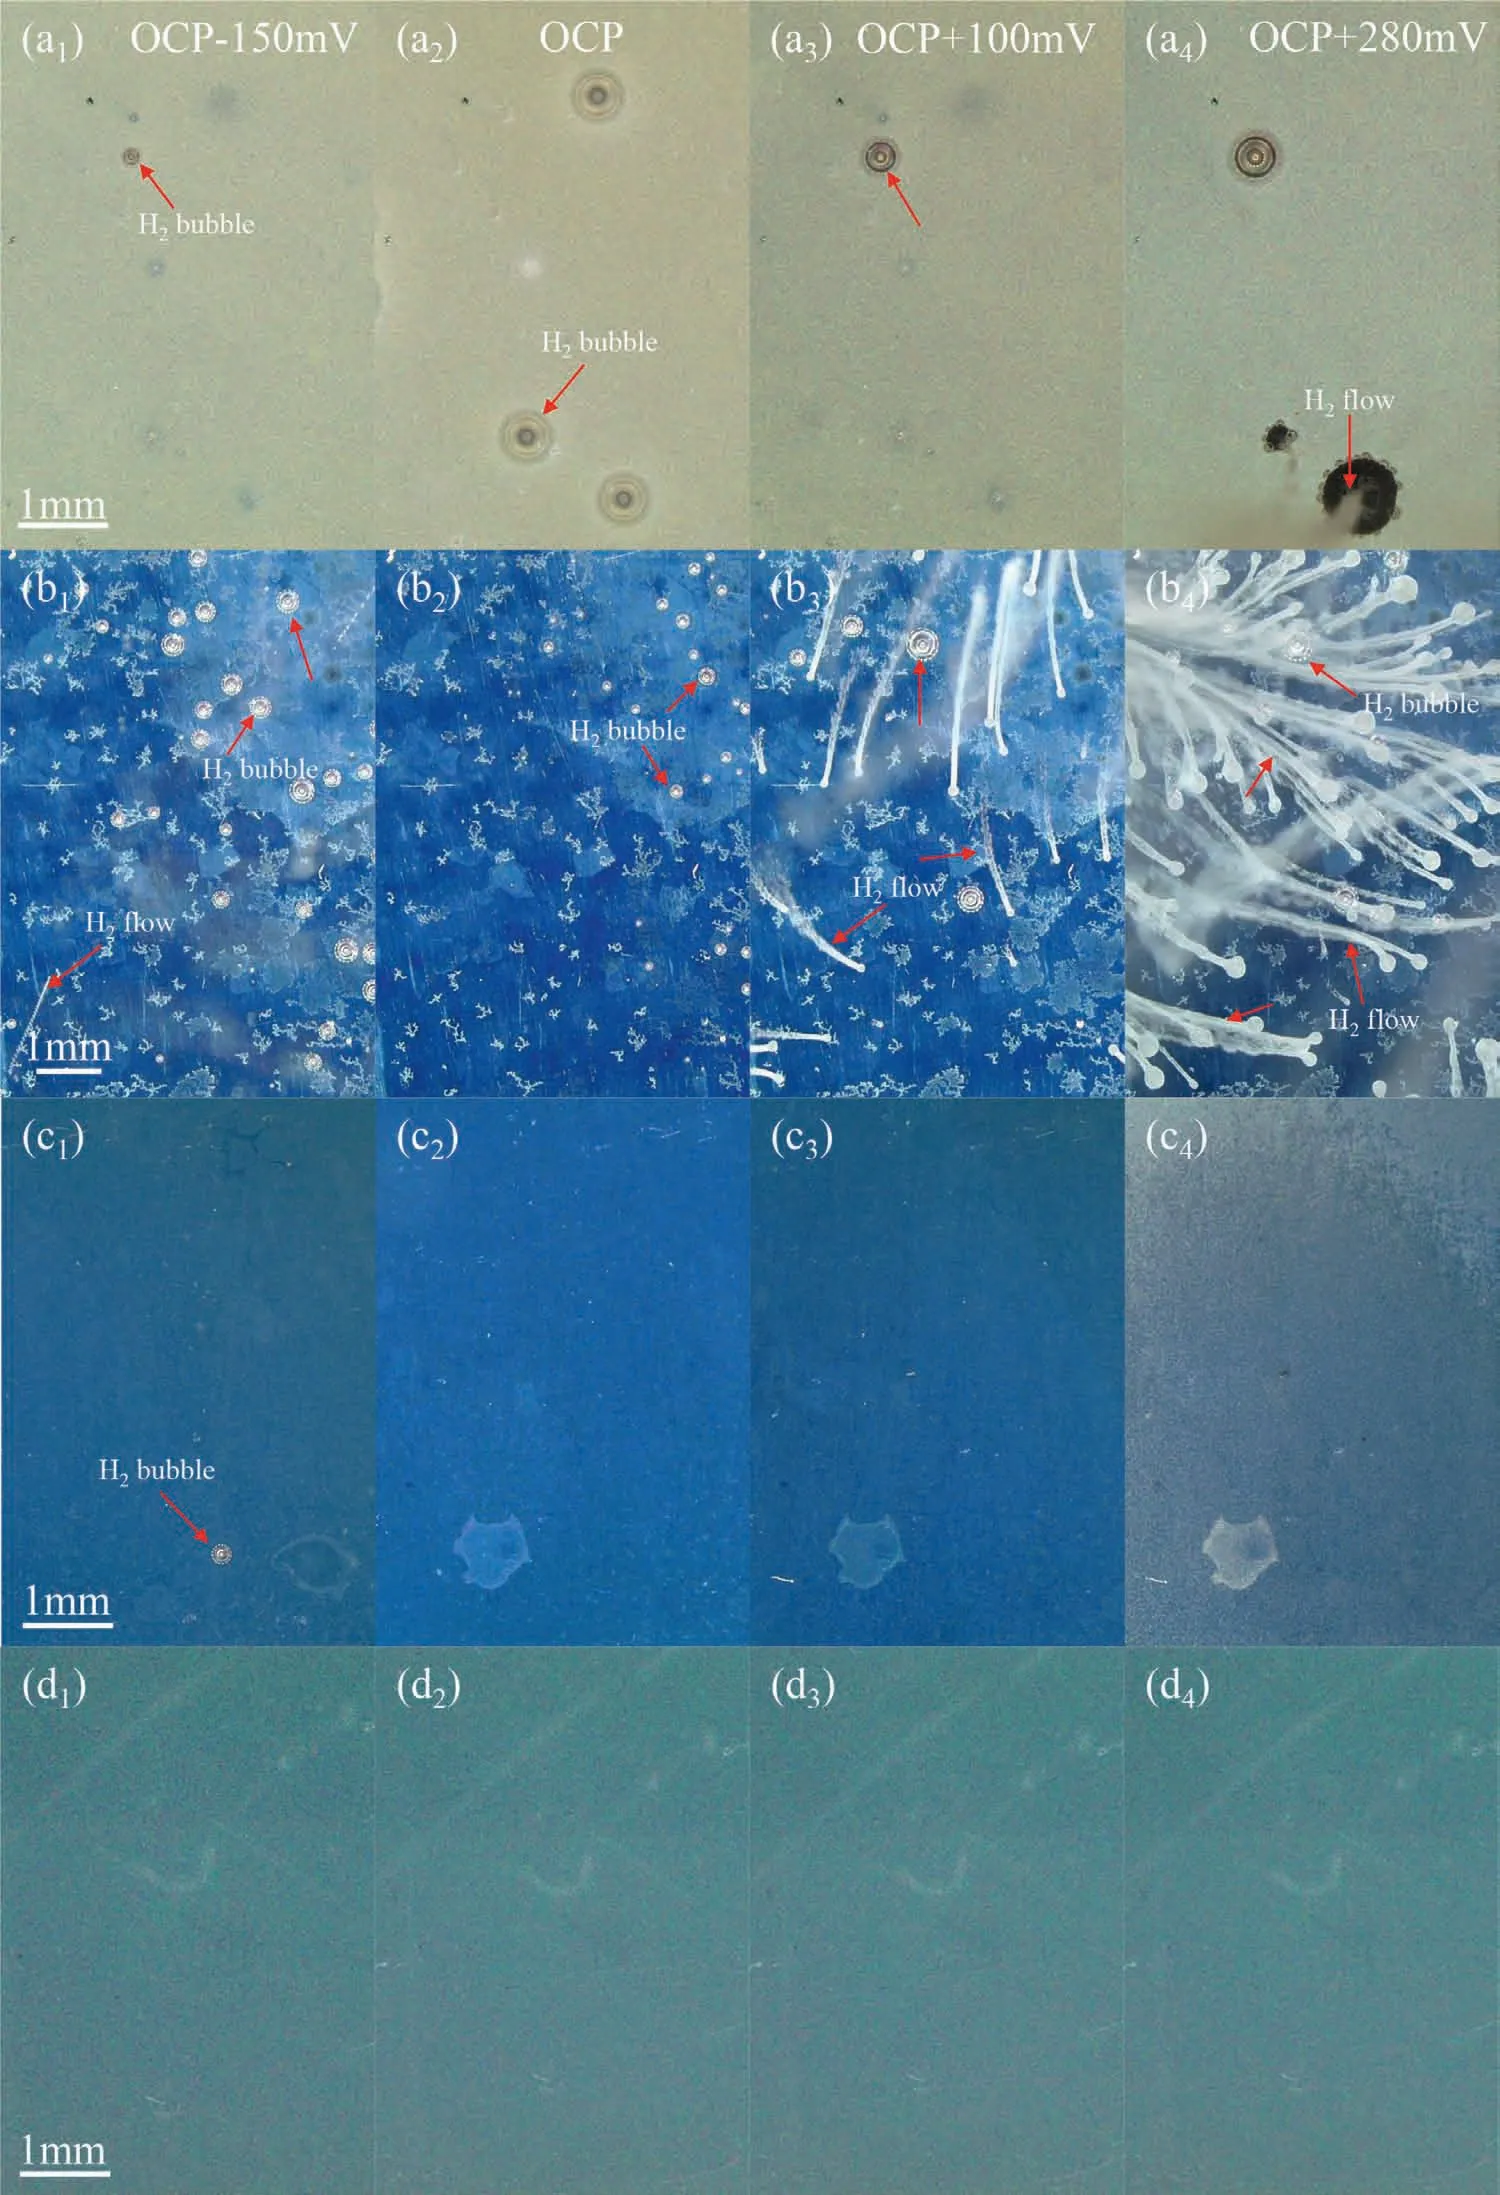
Fig.8.Surface appearance taken from the in-situ polarization test at typical polarized potential as indicated in Fig.7 in the 3.5 wt.% NaCl solution at 25 ± 2 oC: (a1)-(a4) Mg,(b1)-(b4) Mg82Zn18,(c1)-(c4) Mg64Zn36,(d1)-(d4) Zn.
Figure 9 shows the potentiostatic experiment with hydrogen collection of all the specimens in 3.5 wt.% NaCl solution at OCP+0.1 V and OCP+0.3 V for 1 h.Figure 9(a) shows the polarized potential for each specimen,which is consisted with that in Fig.7.It shows that the potential for each specimen was stabilized at the initial setting value.Figure 9(b) and(c) shows the corresponding current densities of each specimen polarized at OCP+0.1 V and OCP+0.3 V.The current densities were consistent with those in Fig.7 and the higher polarization potential resulted in higher current density for the specimen.It is noted that the current densities of Mg82Zn18in Fig.9(b)and(c)both dropped down after initial period of polarization.This is attributed to that some area of the specimen was consumed or peeled off due to the high anodic polarization and brittleness of the Mg82Zn18.As a result,the actual area of the specimen was significantly reduced.Figure 9(d)and (e) shows the evolved hydrogen volume collected during the anodic polarization test.For Mg and Mg82Zn18,the hydrogen volume increased with the anodic polarization potential,which is consistent with the negative difference effect.However,there was still no hydrogen evolution for Mg64Zn36and Zn at OCP or polarized potential,which was consistent with the observation in Fig.8.

Fig.9.Potentiostatic experiments of the specimens in 3.5 wt.% NaCl solution for 1 h: (a) polarized potential curve,(b) current density of the specimens polarized at OCP+0.1 V,(c) current density of the specimens polarized at OCP+0.3 V,(d) hydrogen evolution volume collected of the specimens polarized at OCP+0.1 V,(e) hydrogen evolution volume collected of the specimens polarized at OCP+0.3 V.
3.4. Corrosion morphology and corrosion products
Figure 10 presents the typical surface morphology with corrosion products on the specimens after the immersion test.The whole Mg specimen was covered by a uniform flaky corrosion product layer as shown in Fig.10(a).There were two kinds of typical corrosion morphology on the Mg82Zn18specimens as shown in Fig.10(b) and (c).Some areas had suffered serious corrosion during the immersion test which resulted in dense cavities as indicated in Fig.10(b).Some other areas suffered slight corrosion with a covering of flaky corrosion products as indicated in Fig.10(c).The Mg64Zn36specimen corroded uniformly during the immersion test and a homogeneous flaky corrosion product film formed on the surface as shown in Fig.10(d) and (e).This corrosion product film was more dense and compact than that on Mg and Mg82Zn18.The corrosion morphology of Zn was totally different to those on Mg,Mg82Zn18and Mg64Zn36as shown in Fig.10(f).The specimen was covered by the conglobate corrosion product particle clusters and had a rough surface appearance.
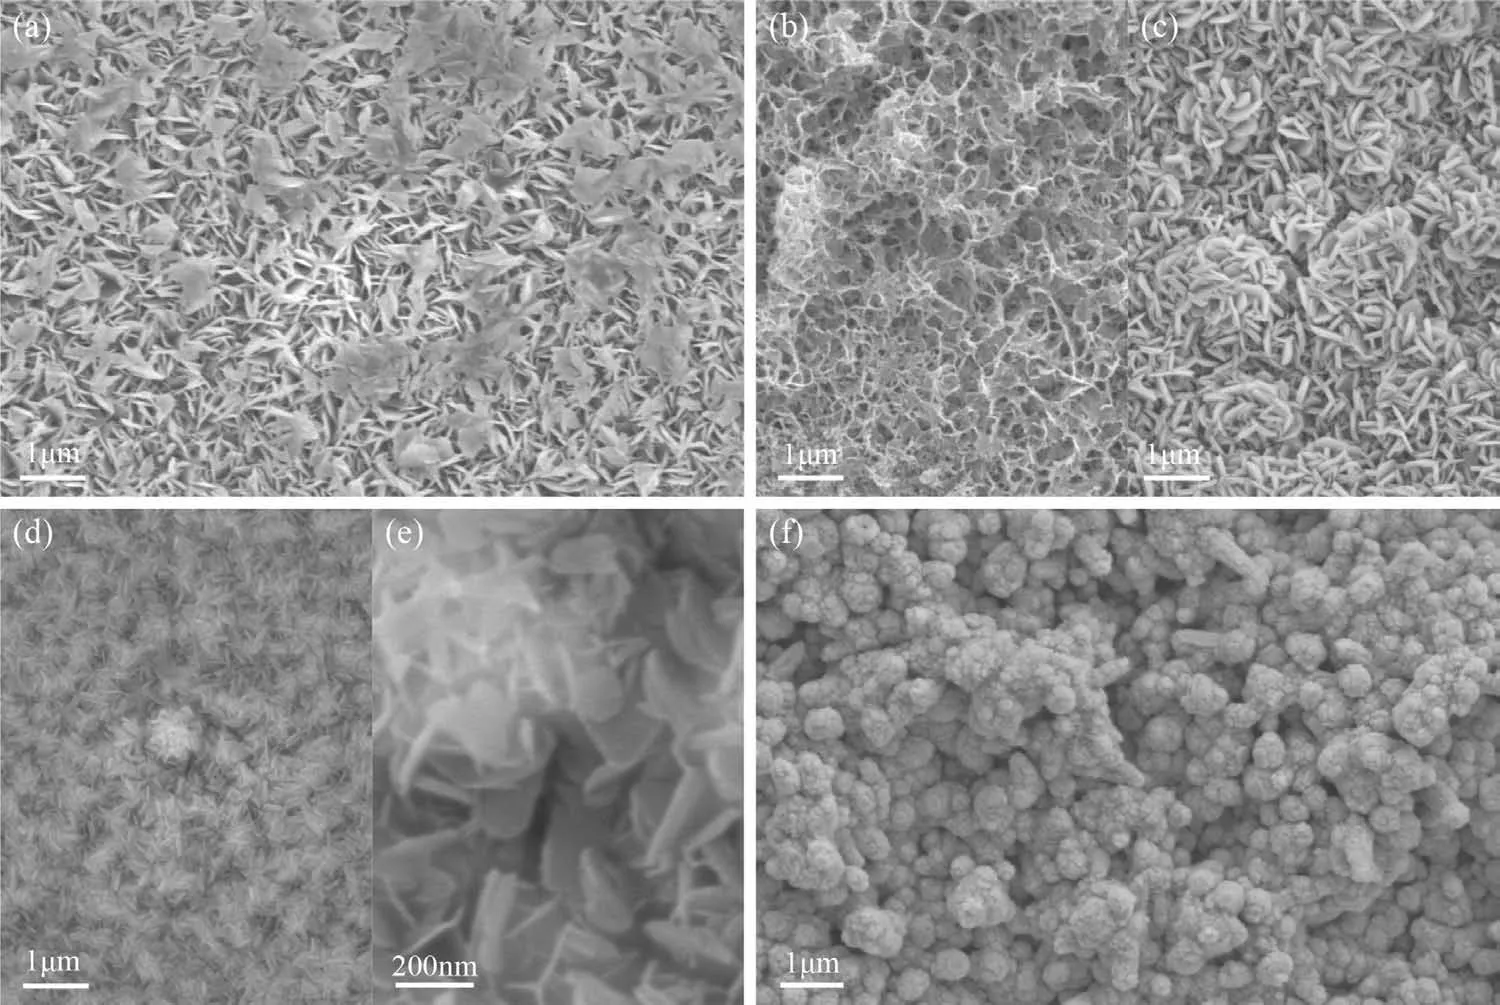
Fig.10.Typical surface morphology with the corrosion product for the sputter-deposited specimens after immersion in the 3.5 wt.% NaCl solution at OCP for 48 h: (a) Mg,(b)(c) Mg82Zn18,(d,e) Mg64Zn36,(f) Zn.
The components of the corrosion products were identified using XRD as shown in Fig.11.Fig.11(a) shows that the main constituent of the Mg corrosion product was Mg(OH)2,with a small amount of MgCO3·5H2O.For Mg82Zn18and Mg64Zn36,the corrosion products were more complicated and consisted of Mg(OH)2and Zn(OH)2,with some Mg2CO3(OH)2·2H2O and some redeposited Zn as shown in Fig.11(b) and (c).Fig.10(d) shows that the main components of the corrosion products on Zn were ZnO and Zn(OH)2.
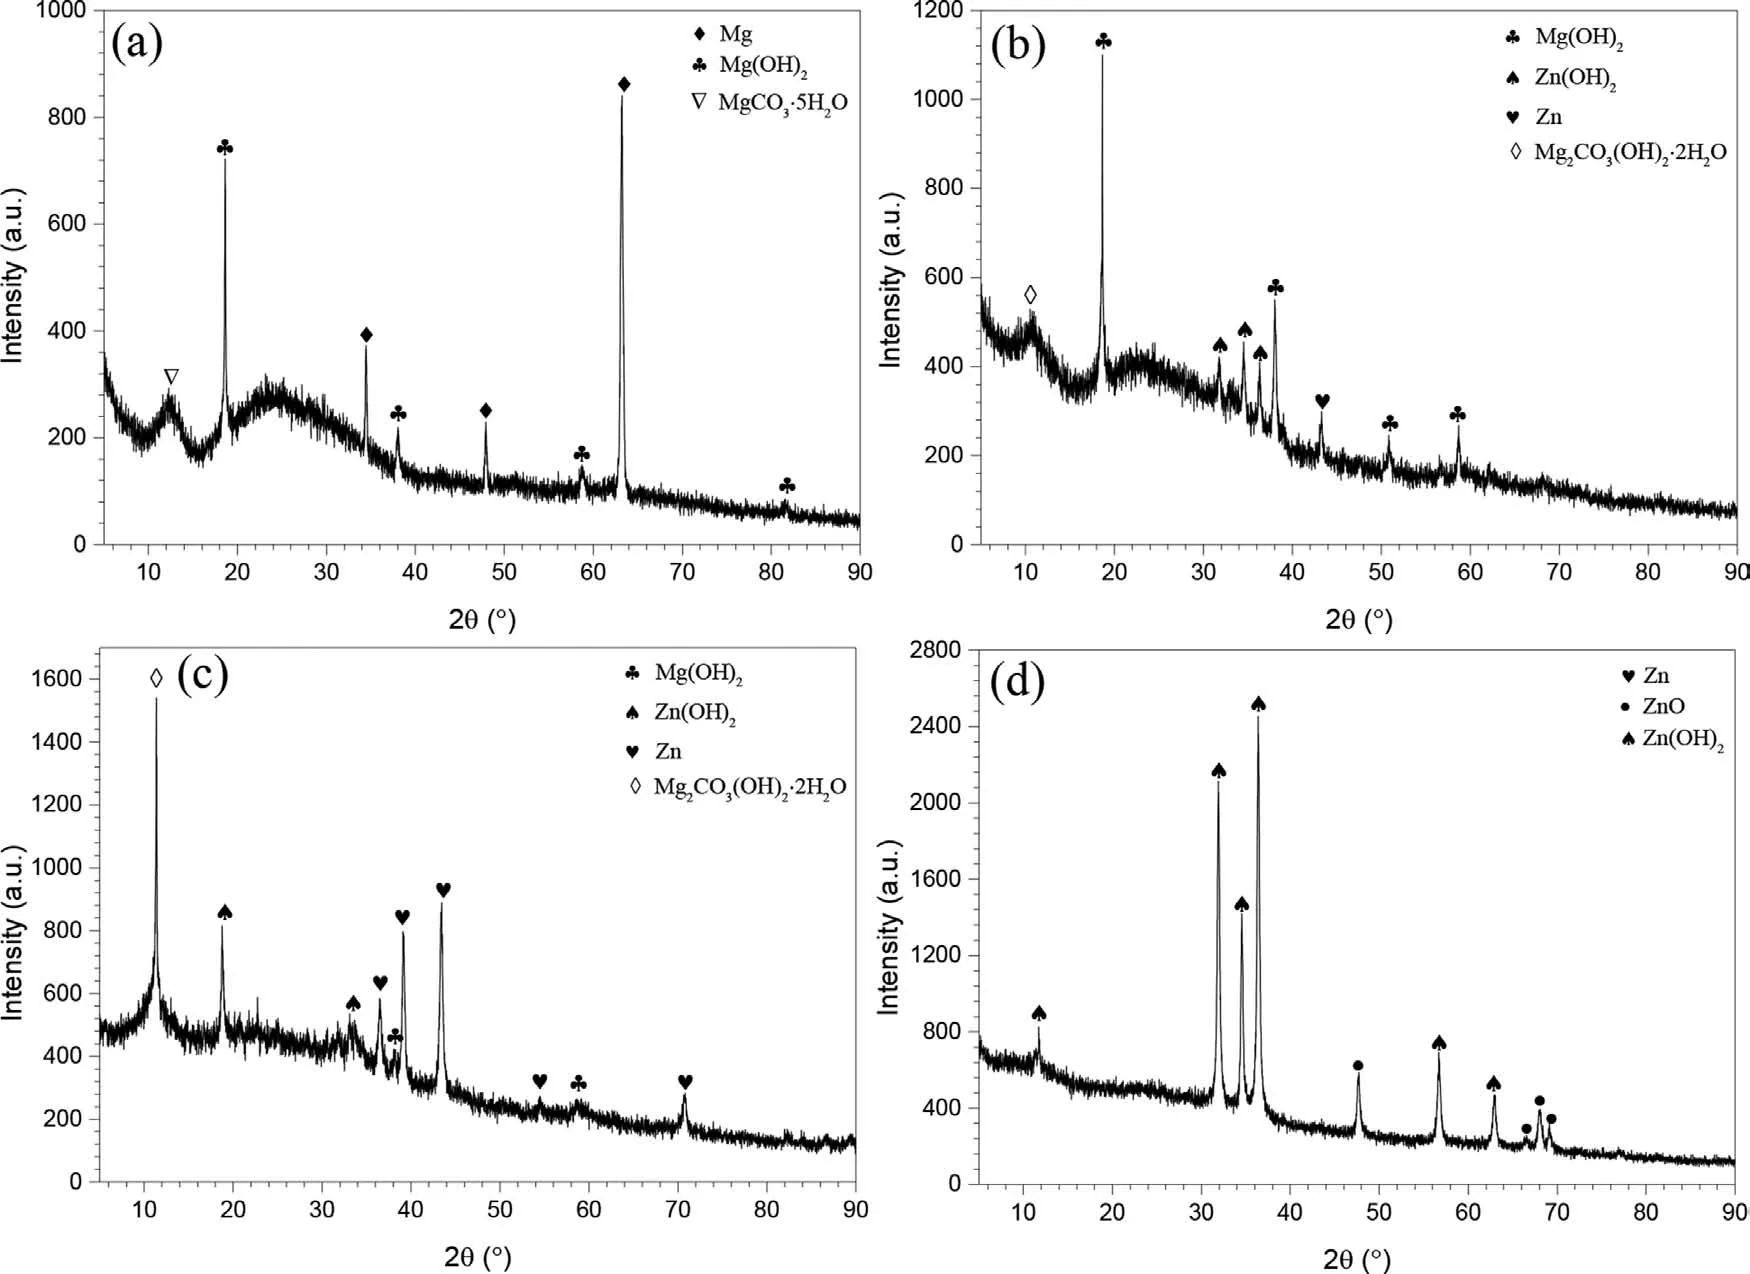
Fig.11.XRD patterns of the corrosion product for Mg5Ysputter-deposited specimens after immersion in the 3.5 wt.% NaCl solution at OCP for 48 h: (a)Mg,(b) Mg82Zn18,(c) Mg64Zn36,(d) Zn.
4.Discussion
4.1. Microstructure
Sputter deposition is a non-equilibrium process in which vapor transforms to solid that is rapidly quenched [35].The microstructure of sputtered specimens strongly depends on the deposition parameters and the material properties [36].Fig.2 shows that the addition of Zn into Mg led to the shape transformation of the particles in the matrix and that the Zn was totally dissolved in the Mg matrix as demonstrated in Fig.3(b).With increasing Zn sputtering,the Zn content increased from 18 at.% to 34 at.% and the matrix became more dense and smooth.Furthermore,the microstructure of the MgZn alloy was transformed from fully crystallinity towards amorphization with some nano-scale grains.Despite the high-quench-rate of magnetron sputtering,pure Mg and pure Zn were crystalline [27].In contrast,a solid solution formed during simultaneous sputtering of Zn and Mg,as Zn substituted for Mg atoms forming a solid solution.Increasing the sputtering rate of Zn led to a higher adatom arrival rate of Zn on the grounds and led to an amorphous structure for Mg64Zn36[27].The Zn specimen had a different microstructure with a rough surface consisting of spherical crystalline particle clusters.
4.2. Corrosion behavior and hydrogen evolution
Fig.4(a) shows the hydrogen evolution curve for the specimens in 3.5% NaCl for 48 h.The corrosion rate calculated from the evolved hydrogen was 0.21 ± 0.04 mm/y and 0.28 ± 0.02 mm/y for Mg and Mg82Zn18,respectively.However,there was no hydrogen collected from Mg64Zn36and Zn.Fig.4(b) shows the dissolution weight of the specimens immersed in 3.5% NaCl for 48 h.The corrosion rate of Mg,Mg82Zn18,Mg64Zn36and Zn calculated from the initial 12 h Mg2+data was: 0.23 ± 0.03,0.37 ± 0.02,0.05 ± 0.01 and 0.01 ± 0.005 mm/y,respectively.The corrosion rate from hydrogen volume and dissolution weight was consistent for Mg,but inconsistent for the rest specimens as the abnormal hydrogen evolution behavior.The corrosion rate of Mg64Zn36was substantially lower than the most corrosion resistant ultra-high purity Mg or Mg alloy reported so far [18,37].The corrosion rate of the specimens obtained from ICP-OES was inconsistent on some degree with the trend indicated by theicorrevaluated from Fig.7 and theRpvalue in Table 2,especially for the Zn,which was attributed that the electrochemical tests were carried in the initial period after the immersion test and was more active than the stable state.Due to the large pH difference measured during the immersion test between the solutions for Zn and Mg alloys which affects the solubility of Zn2+significantly,it is difficult to ensure the accuracy of the corrosion rate for Zn from ICP-OES test.However,it is still obvious that the Mg64Zn36has the best corrosion resistance among the Mg,Mg82Zn18and the Mg64Zn36due to the large gap between the corrosion rates of these specimens.It is noted that the immersion test is carried out for only 48 h and it might not be to predict the corrosion behavior for longer times.
The corrosion rate of Mg82Zn18was a little higher than that of pure Mg.The reason for this higher corrosion rate is unclear,but could be due to the segregation of the Zn along the particle edges even though the segregation might not be very significant under the non-equilibrium sputtering condition.Although the Zn did not precipitate out in a second phase,its segregation could cause micro-galvanic corrosion between the parts along the particle boundaries and the interior parts of the particles with low Zn content.As a result,the interior area of the grains corroded seriously as shown in Fig.10(b).
In contrast,micro-galvanic corrosion clearly did not occur for Mg64Zn36.Evidently,the Zn distributed homogeneously because the microstructure was amorphous,and there was no micro-galvanic corrosion.Furthermore,the high content of Zn and the surface corrosion products shifted the OCP of the alloy more positively.In addition,Fig.2(d) and (e) shows that the Mg64Zn36specimen has a smooth surface with less porosity than Mg and Mg82Zn18.The particles of Mg64Zn36were finer and bonded more tightly than those of Mg and Mg82Zn18.Moreover,the possibility of selective dissolution of Mg from the Mg-Zn surface could not be excluded.Only a couple of Mg atom layers dissolved could lead to a Znenriched surface on this amorphous alloy which would have an anodic polarization behavior similar to Zn and would not have anodic hydrogen evolution.A couple layers of Mg atoms are too little to generate any visible anodic hydrogen evolution on the sample surface.All these factors contributed to the corrosion rate of Mg64Zn36lower than that of pure Mg.The corrosion behavior of Zn was totally different to that of Mg and the crystal Mg alloy due to its own electrochemical properties.
It is well known that the corrosion of Mg and Mg alloys usually involves the hydrogen evolution reaction which also occurred in this current study for Mg and Mg82Zn18.In contrast,no hydrogen bubbles evolved for Mg64Zn36during the immersion test which was also reported by Zberg et al.[3].Importantly,there was no wide flat potential region on the polarization curves indicating formation of a stable passivating film as shown in Fig.7,revealing that the mechanism might be different to that proposed by Zberg et al.[3] that a Zn-and oxygen-rich passivating layer suppressed the hydrogen evolution during the immersion test of MgZnCa glass in simulated body fluid.They measured an apparent flat region present on the polarization curve of the MgZnCa alloy[3].Although cathodic hydrogen evolution could be significantly reduced at a more positive potential,hydrogen evolution could occur if the anodic potential was greater than the flat region and the passivation film was broken.However,in the current study,there was no hydrogen evolution for the Mg64Zn36,even at the potential far more positive than the OCP.
These observations indicate a new mechanism might have been involved in the corrosion and anodic dissolution of the amorphous Mg64Zn36.This new mechanism is different from the normal anodic dissolution of Mg alloy that is always accompanied by anodic hydrogen evolution [11].It is not a passivating behavior of crystal Zn with a stable passive film on the surface,either.The increasing anodic dissolution without anodic hydrogen evolution could be a response of amorphous Zn-enriched surface to anodic polarization.The more detailed mechanism needs to be further investigated in future.Nevertheless,the new mechanism can be understood by reference to the Pourbaix diagrams of Mg and Zn as shown in Fig.12 [38].The equilibrium potential of Mg64Zn36was as in Fig.12(a).The reducibility was decreased significantly by the high content of Zn which has a more positive equilibrium potential and a high over-potential for the hydrogen evolution reaction.The hydrogen over-potential,η,is related to Tafel slope,b,and the exchange current density,i0through the Tafel equation:η=blogi/i0[14].Zhang [14] indicated that the high over-potential for hydrogen reduction on Zn,compared to that on other metals,is mainly due to the low exchange current density.The Mg64Zn36had a value ofi0comparable to Zn,thus has a high hydrogen over-potential as well.This also supports that the Mg64Zn36surface may be rich in Zn.Therefore,the cathodic reaction for Mg64Zn36in 3.5% NaCl at the OCP changed from the hydrogen evolution reaction 2H++2e-=H2to the oxygen reduction reaction O2+2H2O+4e-=4OH-as illustrated in Fig.12(b).

Fig.12.(a) Potential-pH equilibrium diagram for zinc-water system and magnesium-watersystem at 25 oC from Pourbaix [36][38],(b) schematic illustration of the corrosion behavior of Mg64Zn36 in 3.5 wt.% NaCl at OCP.
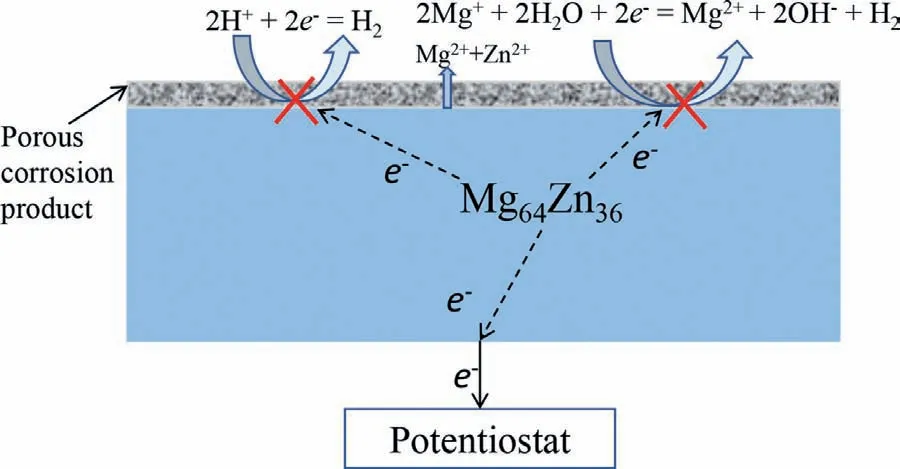
Fig.13.Schematic illustration for the behavior of the Mg64Zn36 during anodic polarization.
The main corrosion products of Mg64Zn36were Mg(OH)2and Zn(OH)2,indicating that the corrosion of both Mg and Zn occurred during the immersion test.The presence of Mg2CO3(OH)2·2H2O was attributed to the dissolution of CO2in the solution from the air during the immersion test.A small amount of Zn was in the corrosion products indicating the occurrence of the following action: Zn2++Mg=Zn+Mg2+.
Furthermore,no hydrogen occurred on the surface of Mg64Zn36during anodic polarization.The anodic current density increased gradually with increasing anodic potential at the initial stage of the measurement of the anodic polarization curve.Then the potential increased rapidly when the potential was more positive than the film breakdown potential of-1.04 V,accompanied with the instant formation of white corrosion products.
Figure 13 shows a schematic of the electrochemical behavior of Mg64Zn36during anodic polarization.The anodic reaction was Mg →Mg2++2e-and Zn →Zn2++2e-.There was no hydrogen evolution reaction as shown in Eq.(3) on the anodic polarized Mg surface for Mg64Zn36[39,40].All the electrons flowed to the potentiostat.
4.3. Application of Mg64Zn36
This is the first time that a special Mg alloy Mg64Zn36produced by magnetron sputtering was shown to exhibit no hydrogen evolution during an immersion test and on anodic polarization,attributed to the extended solubility of Zn in the amorphous structure with some nano-scale grains.A totally new route has been established,besides passivation,to inhibit the hydrogen evolution of Mg alloys,which has never previously been reported.
This amorphous Mg64Zn36alloy would be a good anode material for a biodegradable battery to deliver on-board power for transient implantable medical devicesin-vivo[41].Mg has been considered as one of the most potential candidates in biodegradable implants and biodegradable battery [41,42],because of its good biocompatibility and attractive electrochemical properties.However,the NDE causes the production of a large amount of hydrogen evolution if a traditional Mg alloys is used as the anode for a biodegradable battery,which would be harmful for the patients.Passivation is a mechanism to inhibit the hydrogen evolution.However,passivation would also suppress the discharge of Mg.In addition,hydrogen evolution could still occur if the passivation film is broken down,which is a potential hazard for the patients.The amorphous Mg64Zn36in the current study could avoid the above concerns.
4.4. Insights into Mg alloying
Alloying elements have been incorporated into Mg alloy to improve the mechanical properties and corrosion resistance [1].The influence of alloying on Mg corrosion behavior has been widely studied for nearly a century since 1942[15,16,43].The addition of some alloying elements can modify the microstructure and corrosion products and decrease the corrosion rate of the Mg alloy.However,the limited solubility of most alloying elements in Mg causes the added alloying elements usually to precipitate in second phase particles which cause serous micro-galvanic corrosion,overwhelming the benefits of the alloying element.This problem has tormented researchers for a long time.The current study indicates this dilemma can be solved using non-equilibrium techniques to extend the solubility of alloying elements which retain the advantages of the alloying elements without causing the serious micro-galvanic corrosion.This approach intrinsically changed the corrosion behavior of Mg.Therefore,it is quite possible to produce a ‘stainless Mg alloy’ through this method by the appropriate selection of alloying elements and concentration.
5.Conclusions
1.The microstructure of Mg-Zn alloys was transformed from crystalline into amorphous with nano-grains when the Zn content increased from 18 at.% to 34 at.%.
2.The Mg64Zn36had a corrosion rate substantially lower than the ultra-high purity Mg or the most corrosion resistant Mg alloy.
3.During the immersion test or anodic polarization of the Mg64Zn36,hydrogen evolution was totally suppressed,which has never been reported so far,because the amorphous alloy surface with a more positive potential could retard the cathodic hydrogen evolution and the Mg dissolution that generates anodic hydrogen evolution.
4.The corrosion behavior of the amorphous Mg64Zn36can be mainly attributed to the extended solubility of Zn in Mg,which may lead to a higher equilibrium potential,a high over-potential for the hydrogen evolution reaction,and an amorphous surface rich in Zn.This new finding will be greatly beneficial for the application of Mg in the future.
Acknowledgments
This research was supported by National Natural Science Foundation of China No.51801168 and No.51731008,and Natural Science Foundation of Fujian Province No.2018J05093.
 Journal of Magnesium and Alloys2023年6期
- Journal of Magnesium and Alloys的其它文章
- Ameliorating the re/dehydrogenation behaviour of MgH2 by zinc titanate addition
- Inhibiting effect of I-phase formation on the plastic instability of the duplex structured Mg-8Li-6Zn-1.2Y (in wt.%) alloy
- PEO coating on Mg-Ag alloy: The incorporation and release of Ag species
- Underlying mechanisms of variation in yield asymmetry and strain hardening behavior of extruded pure Mg with Gd addition
- Edge crack damage analysis of AZ31 magnesium alloy hot-rolled plate improved by vertical roll pre-rolling
- High sintering and dielectric performance: The improved (Mg,Zn)3B2O6 ceramics with the help of the DFT calculation
