Effect of heat treatment on the microstructure and mechanical properties of a multidirectionally forged Mg-Gd-Y-Zn-Zr-Ag alloy
Junki Wng ,Chuming Liu,b,c ,Shunong Jing,∗ ,Yingchun Wn ,Zhiyong Chen
a School of Materials Science and Engineering,Central South University,Changsha 410083,China
b State Key Laboratory for Powder Metallurgy,Central South University,Changsha 410083,China
c School of Materials Science and Engineering,Hunan University of Science and Technology,Xiangtan 411201,China
Abstract Multidirectional forging (MDF) was successfully applied to fabricate large-size Mg-Gd-Y-Zn-Zr-Ag alloy in this work and effects of T4,T5 and T6 treatments on the microstructure and mechanical properties of the as-forged alloy were analyzed.Results show that dynamic recrystallization (DRX) occurs and second phase particles precipitate along the grain boundary during the MDF process.After annealing treatment (T4),the volume fraction and size of dynamic precipitates slightly increase at a lower temperature (430 °C) compared with those of MDFed sample,while they are dissolved into the α-Mg matrix at a higher temperature (450 °C).At the meantime,short plate-shaped long-period stacking ordered (LPSO) phases are observed in the DRX grains of the MDFed sample and then dissolved into the α-Mg matrix during annealing at both temperatures.Typical basal texture is identified in the MDFed sample,but the basal pole tilts away from final forging direction and rare-earth texture component with <111>orientation parallel to penultimate forging direction becomes visible after annealing.The T6 sample annealing at 430 °C for 4 h and ageing at 200 °C for 34 h exhibits the superior strength and ductility in this study.The ultimate tensile strength,tensile yield strength and elongation to failure,which is 455 MPa,308 MPa and 7.7%,respectively,are overall improved compared with the directly-aged (T5) sample.This paper provides a superior heat treatment schedule to manufacture high-performance large-scale Mg-Gd-Y-Zn-Zr-Ag components for industrial production.
Keywords: Mg-Gd-Y-Zn-Zr-Ag alloy;Multidirectional forging;Dynamic precipitation;Heat treatment;Mechanical properties.
1.Introduction
In recent years,magnesium alloys have drawn increasingly attention due to their high specific strength,low density and ease of recycling [1–4].However,the low absolute strength makes commercial magnesium alloys,such as Mg-Al and Mg-Zn series,been limited in vehicles and especially the aerospace industry where mechanical properties are of stringent requirement [5].To satisfy the demands,researchers designed various high-strength magnesium alloys.The maximum solid solubility of Gd element in magnesium matrix is 23.5 wt.%,and its solid solubility decreases significantly as temperature decreases,which means Mg-Gd alloys have a remarkable ageing-hardening response [6,7].Anyanwu et al.[8,9] reported that the addition of Y element increased the number of precipitates in Mg-Gd alloy and enhanced the ageing strengthening.Peng [10] found that the Zr element could refine the grains to a large extent due to generating nucleants in the Mg-Gd-Y alloys.In recent years,the Mg-Gd-Y-Zn series are attracting great concern ascribed to the long-period stacking ordered (LPSO) phases,which strengthen the alloy owing to the higher Young’s modulus (∼67 GPa) compared with that of Mg matrix (∼44 GPa) and refining the grain via particle stimulated nucleation (PSN) mechanism during dynamic recrystallization [11–20].Xu et al.[12] fabricated a high-strength Mg-8.2Gd-3.8Y-1.0Zn-0.4Zr (wt.%) alloy sheet by large-strain hot rolling and ageing treatment,exhibiting an ultimate tensile strength (UTS) of 517 MPa,tensile yield strength (TYS) of 426 MPa and elongation to failure (Ef) of 4.5%.In our previous work [21],the Ag addition enhances the age-hardening response by coprecipitation of the nanosized basalγ’’ precipitates and theβ’ phases.
Plastic deformation,such as rolling,extrusion,forging and equal-channel angular pressing (ECAP),is widely used to refine the grain by dynamic recrystallization (DRX) and improve the mechanical properties of magnesium and its alloys.Among the preceding plastic deformation,multidirectional forging can effectively produce large-scale components which has great application prospect in aerospace and automotive industries.However,MDF was generally conducted in air with little heat preservation in industrial production,which means the temperature of the multidirectional forging will continuously decrease as the deformation proceeds.Meanwhile,dynamic precipitation (DP) might occur during deformation processes,especially MDF,in magnesium alloys[12,15,22–24].Xiao et al.[22] found that dynamic precipitation took place in Mg-8.3Gd-2.6Y-0.4Zr (wt.%) alloy during compression at temperature from 300 to 400 °C.The irregular equilibriumβphase did not possess any specific crystallographic orientation relationship with the matrix and suppressed the growth of DRXed grains due to the pinning effect.Chen et al.[24] found that Mg5(Gd,Y) phase appeared during the rolling process of Mg-8Gd-3Y-0.4Zr (wt.%) alloy.The Mg5(Gd,Y) phase weakened the ageing precipitation strengthening due to its dramatically larger size (0.5–1 μm)compared with ageing precipitates (20 nm).It was also reported that plate-like LPSO phases precipitated during the hot working processes in the Mg-RE-Zn alloys [15,25].The plate-like LPSO phases changed to a rod-like shape and hindered the movement of grain boundaries during the annealing treatment [25].In spite of the fact that profuse studies have been conducted on the topic of dynamic precipitation,most of them were focused on ageing immediately after hot deformation without solution treatment or annealing (T5) while little information can be obtained about the effect of annealing treatment (T4) and ageing after annealing treatment (T6)on the microstructure and mechanical properties of Mg-Gd-YZn-Zr series alloys that contain Ag element and dynamic precipitation.Actually,T4 and T6 treatments provide an efficient and economical way to tailor the microstructure and optimize the mechanical properties of wrought magnesium alloys.
In this work,dynamic precipitation was indeed observed after MDF.Effect of heat treatment on the microstructure of the MDFed Mg-6Gd-4Y-0.7Zn-0.4Zr-0.3Ag alloy has been investigated.In addition,the relationship between the DP,LPSO phase,α-Mg grain size and orientation and mechanical properties will also be discussed,which hopes to provide guidance for formulating heat treatment schedules of large-scale Mg-RE series forgings.
2.Material and experimental methods
A multidirectionally forged magnesium alloy with the nominal chemical composition of Mg-6Gd-4Y-0.7Zn-0.4Zr-0.3Ag (wt.%) was used in this study.The alloy was provided as a direct-chill cast ingot with a diameter of 220 mm.Before MDF,a two-step homogenization treatment (450 °C for 6 h and 515 °C for 32 h) was carried out.The homogenized billet with size ofΦ220 × 500 mm was multidirectionally forged at 480 °C by a hydraulic press of 3000 tons after heated at 480 °C for 6 h,at an initial press speed of 10 mm/s.The true strain of each pass was about 0.15.After 9 passes of forging,as shown in Fig.1(a–f) for 6 passes followed with Fig.1(d–f) for 3 passes,the alloy was annealed at 460 °C for 6 h to stabilize the forging temperature and eliminate the work hardening.Then the MDFed specimen with a final size of 480 × 250 × 160 mm was forged at 460 °C for 27 passes according to Fig.1(d–f).The surface temperature of MDFed specimen was measured ∼410 °C before quenching in warm water (∼70 °C).The T4 treatment after forging was performed at 430 and 450 °C for 0–4 h,the annealing temperatures were selected in accordance with the Mg-Gd-Y-Zr phase diagram[26].The MDFed and T4 treated samples were then subjected to ageing treatment at 200 °C for 0–100 h.
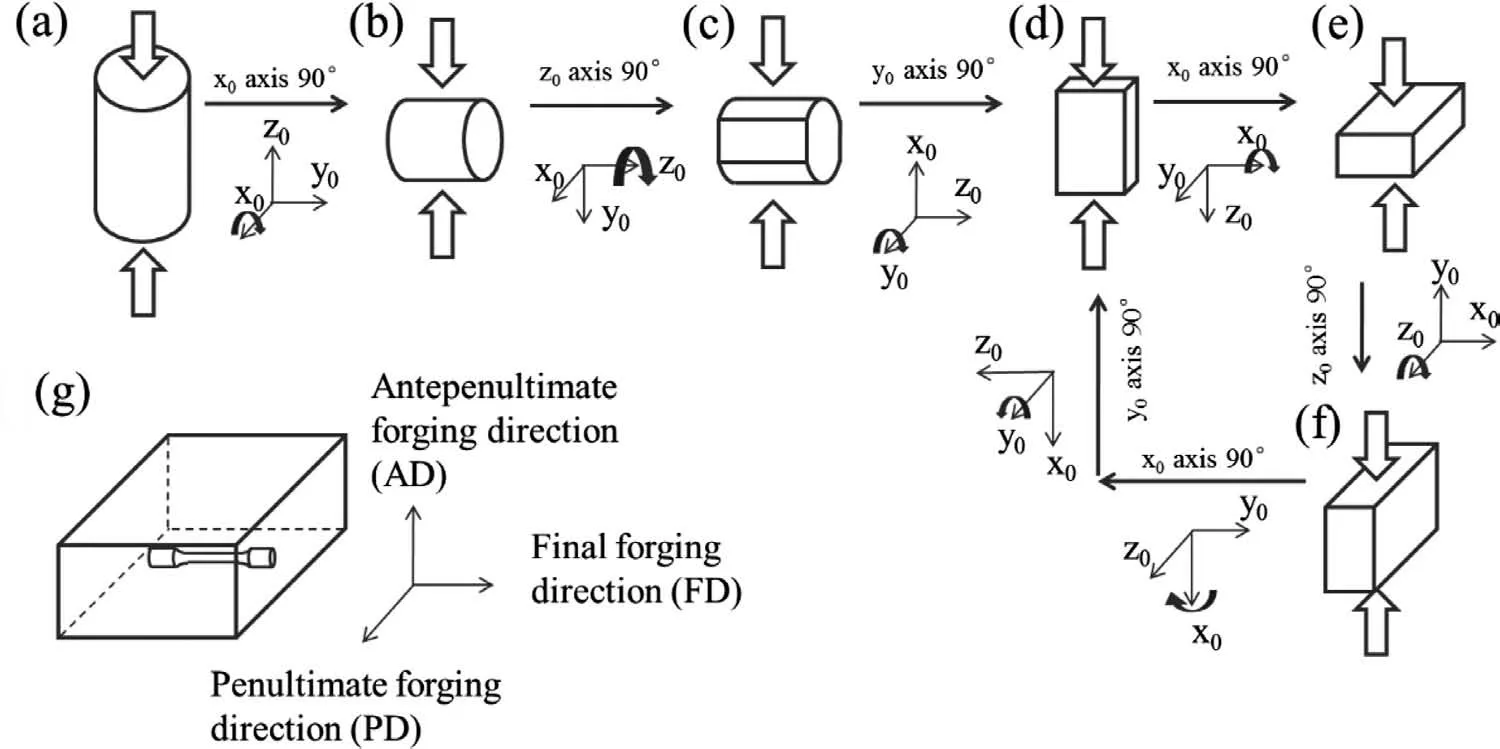
Fig.1.Schematic diagram of the multidirectional forging (MDF).
The samples for microstructure observation were machined in the centre of the MDFed specimen.The microstructures were observed using Leica optical microscope (OM),Sirion 200 field emission scanning electron microscope (SEM) and FEI TecnaiF20 transmission electron microscope (TEM).The texture of the MDFed and heat treated samples were analyzed using an HKL electron back-scatter diffraction pattern (EBSD) system on a HELIOS Nano lab 600i SEM.The grain size and volume fraction of second phases in the alloys was measured using Image-Pro-Plus 6.0 software in accordance with ASTM standard E112–10 and E562–11 [27,28],respectively.The constituent phases were identified by Rigaku D/Max2500 X-ray diffraction (XRD) with a CuKαradiation,in the 2θdiffraction angle range of 10 to 80 deg,at a scanning speed of 8 deg/min.Samples for EBSD examination were electron-polished at 233 K and 25 V,using a solution of 15 mL perchloric acid and 285 mL ethyl alcohol.
Age-hardening response was determined using Vickers hardness tests which were conducted with a load of 4.9 N and dwelling time of 15 s.To ensure the reliability of the tests,10 indentations were measured for each test.Tensile samples with gauge dimensions ofΦ4 × 25 mm were derived from the center of MDFed specimen along final forging direction(FD).Tensile tests were conducted on an Instron 3369 testing machine under a crosshead head speed of 1 mm/min at ambient temperature.
3.Results
3.1. Microstructures of the MDFed and T4 samples
Microstructures of the MDFed alloy characterized by OM,SEM and TEM are depicted in Fig.2.The average grain size was evaluated as ∼2.2 μm.The OM image,shown in Fig.2(a),reveals the occurrence of dynamic recrystallization with several deformed grains retained.Interdendritic LPSO phases exist and their volume fraction is about 4.5%,as shown in Fig.2(b).Abundant irregular dynamic precipitates are observed along theα-Mg grain boundaries which are illustrated by the white dotted lines in Fig.2(b and c).SEM image and EDS analysis,shown in Fig.2(b),indicate that the bright block A phase is composed of Mg-15.6Gd-70.1Y (at.%).It should be RE-rich phase,which occupies a face-center cubic(fcc)structure witha=0.56 nm[29,30].It is noteworthy that intragranular plate-like LPSO phases(which are much smaller than interdendritic ones)are observed in the DRXed grains,as indicated by the white arrows in Fig.2(c).Fig.2(d)shows the bright field image of the MDFed sample and the selected area electron diffraction (SAED) pattern of the irregular dynamic precipitates,indicating that the dynamic precipitates have an fcc structure.The inter-planar spacing of (111) plane and the lattice parameterais approximately 1.29 nm and 2.23 nm,respectively.Thus the irregular dynamic precipitates are confirmed to be equilibriumβphase (F3 m,a=2.23 nm)[22,24].
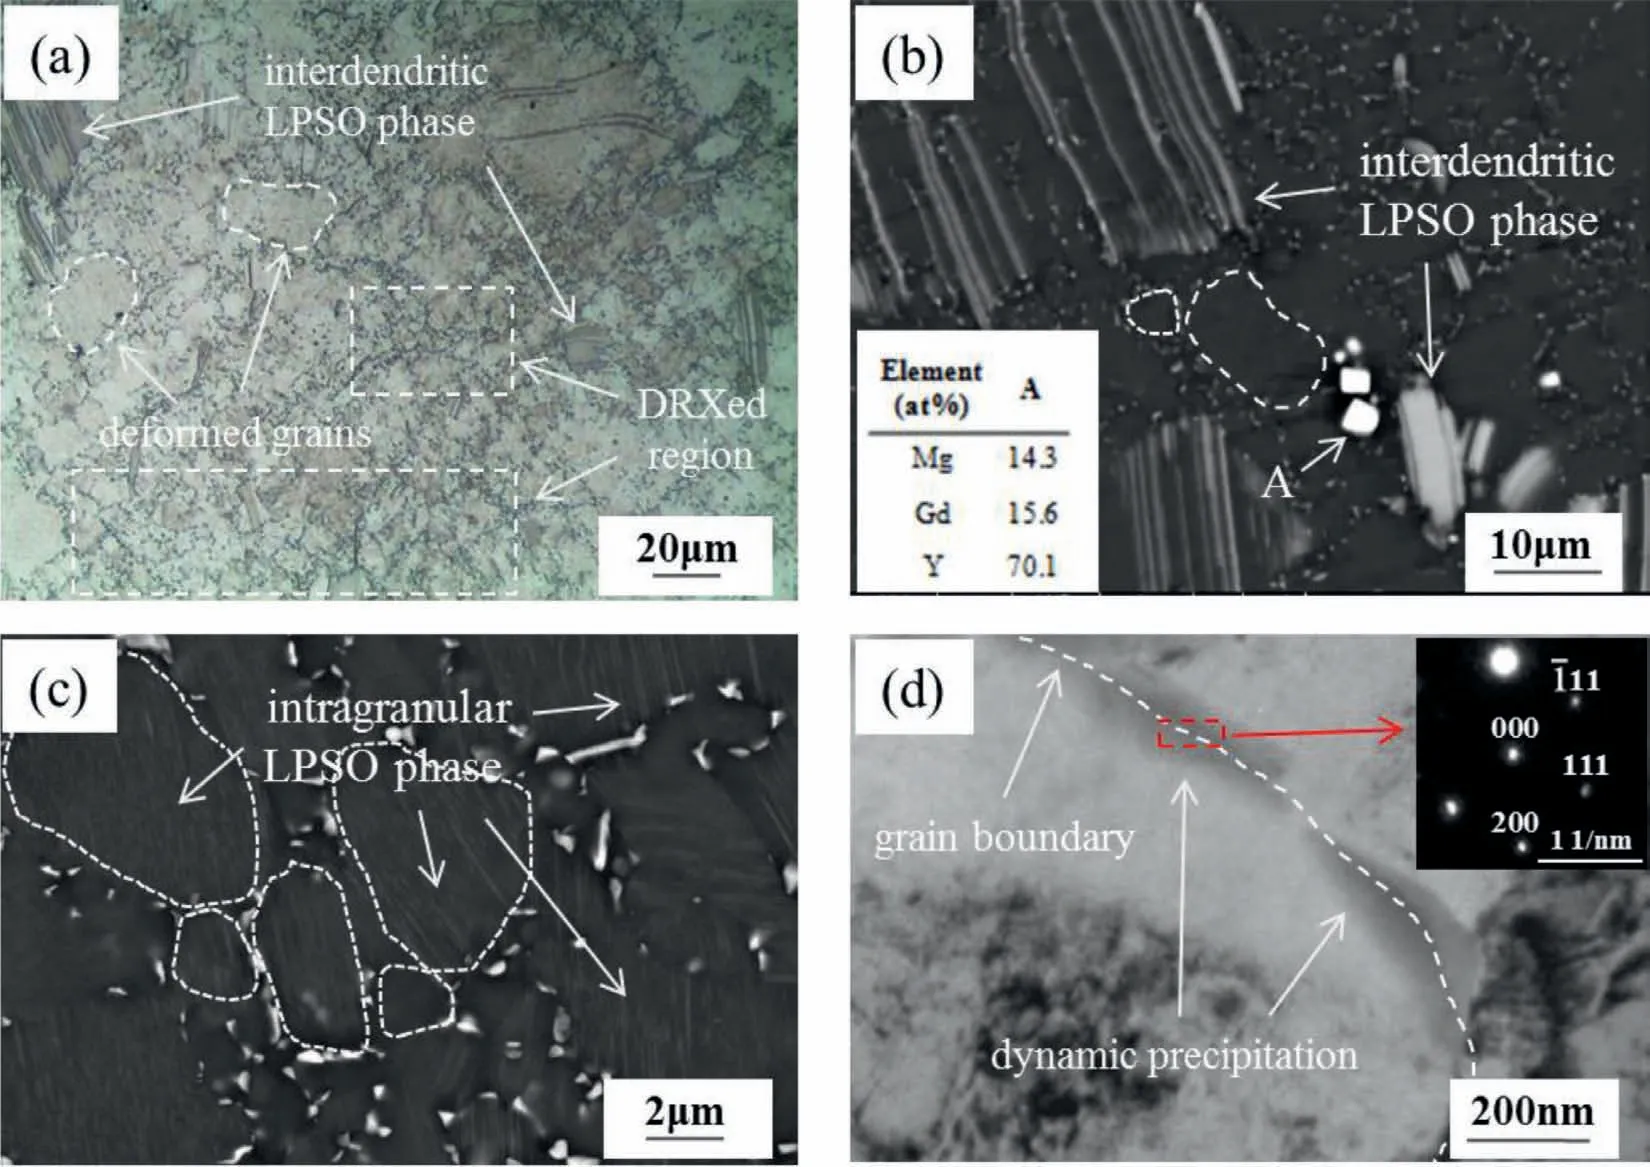
Fig.2.(a) Optical micrograph,(b,c) SEM images and (d) TEM images of the MDFed sample.
Fig.3 shows the optical micrographs of the MDFed samples which were solution treated at 430 and 450 °C.The results indicate that the plate-like LPSO phases (shadow areas in Fig.3) are transformed into rod-like ones via the annealing,while the dynamic precipitates remain along the grain boundaries and the average size (measured by at least three SEM images) increases from 0.54 to 0.76 μm with the prolonging of annealing time at 430 °C.However,the number density of dynamic precipitates decreases as time increases at 450 °C.Eventually,the dynamic precipitates are almost dissolved intoα-Mg after 1 h.Although LPSO phase acts as a barrier and suppresses the grain growth during the annealing,fine and dispersive dynamic precipitates which are distributed at grain boundaries exhibit better effect on pinning the grain boundary.As a consequence,the grain size of the DP-free sample (annealing at 450 °C for 1 h) rises to be 10.5 μm,while the grain size of the sample annealed at 430 °C for 4 h is only 5.5 μm.During further annealing,the grains become coarser (the OM does not show here for brevity),which has an adverse effect on mechanical properties.
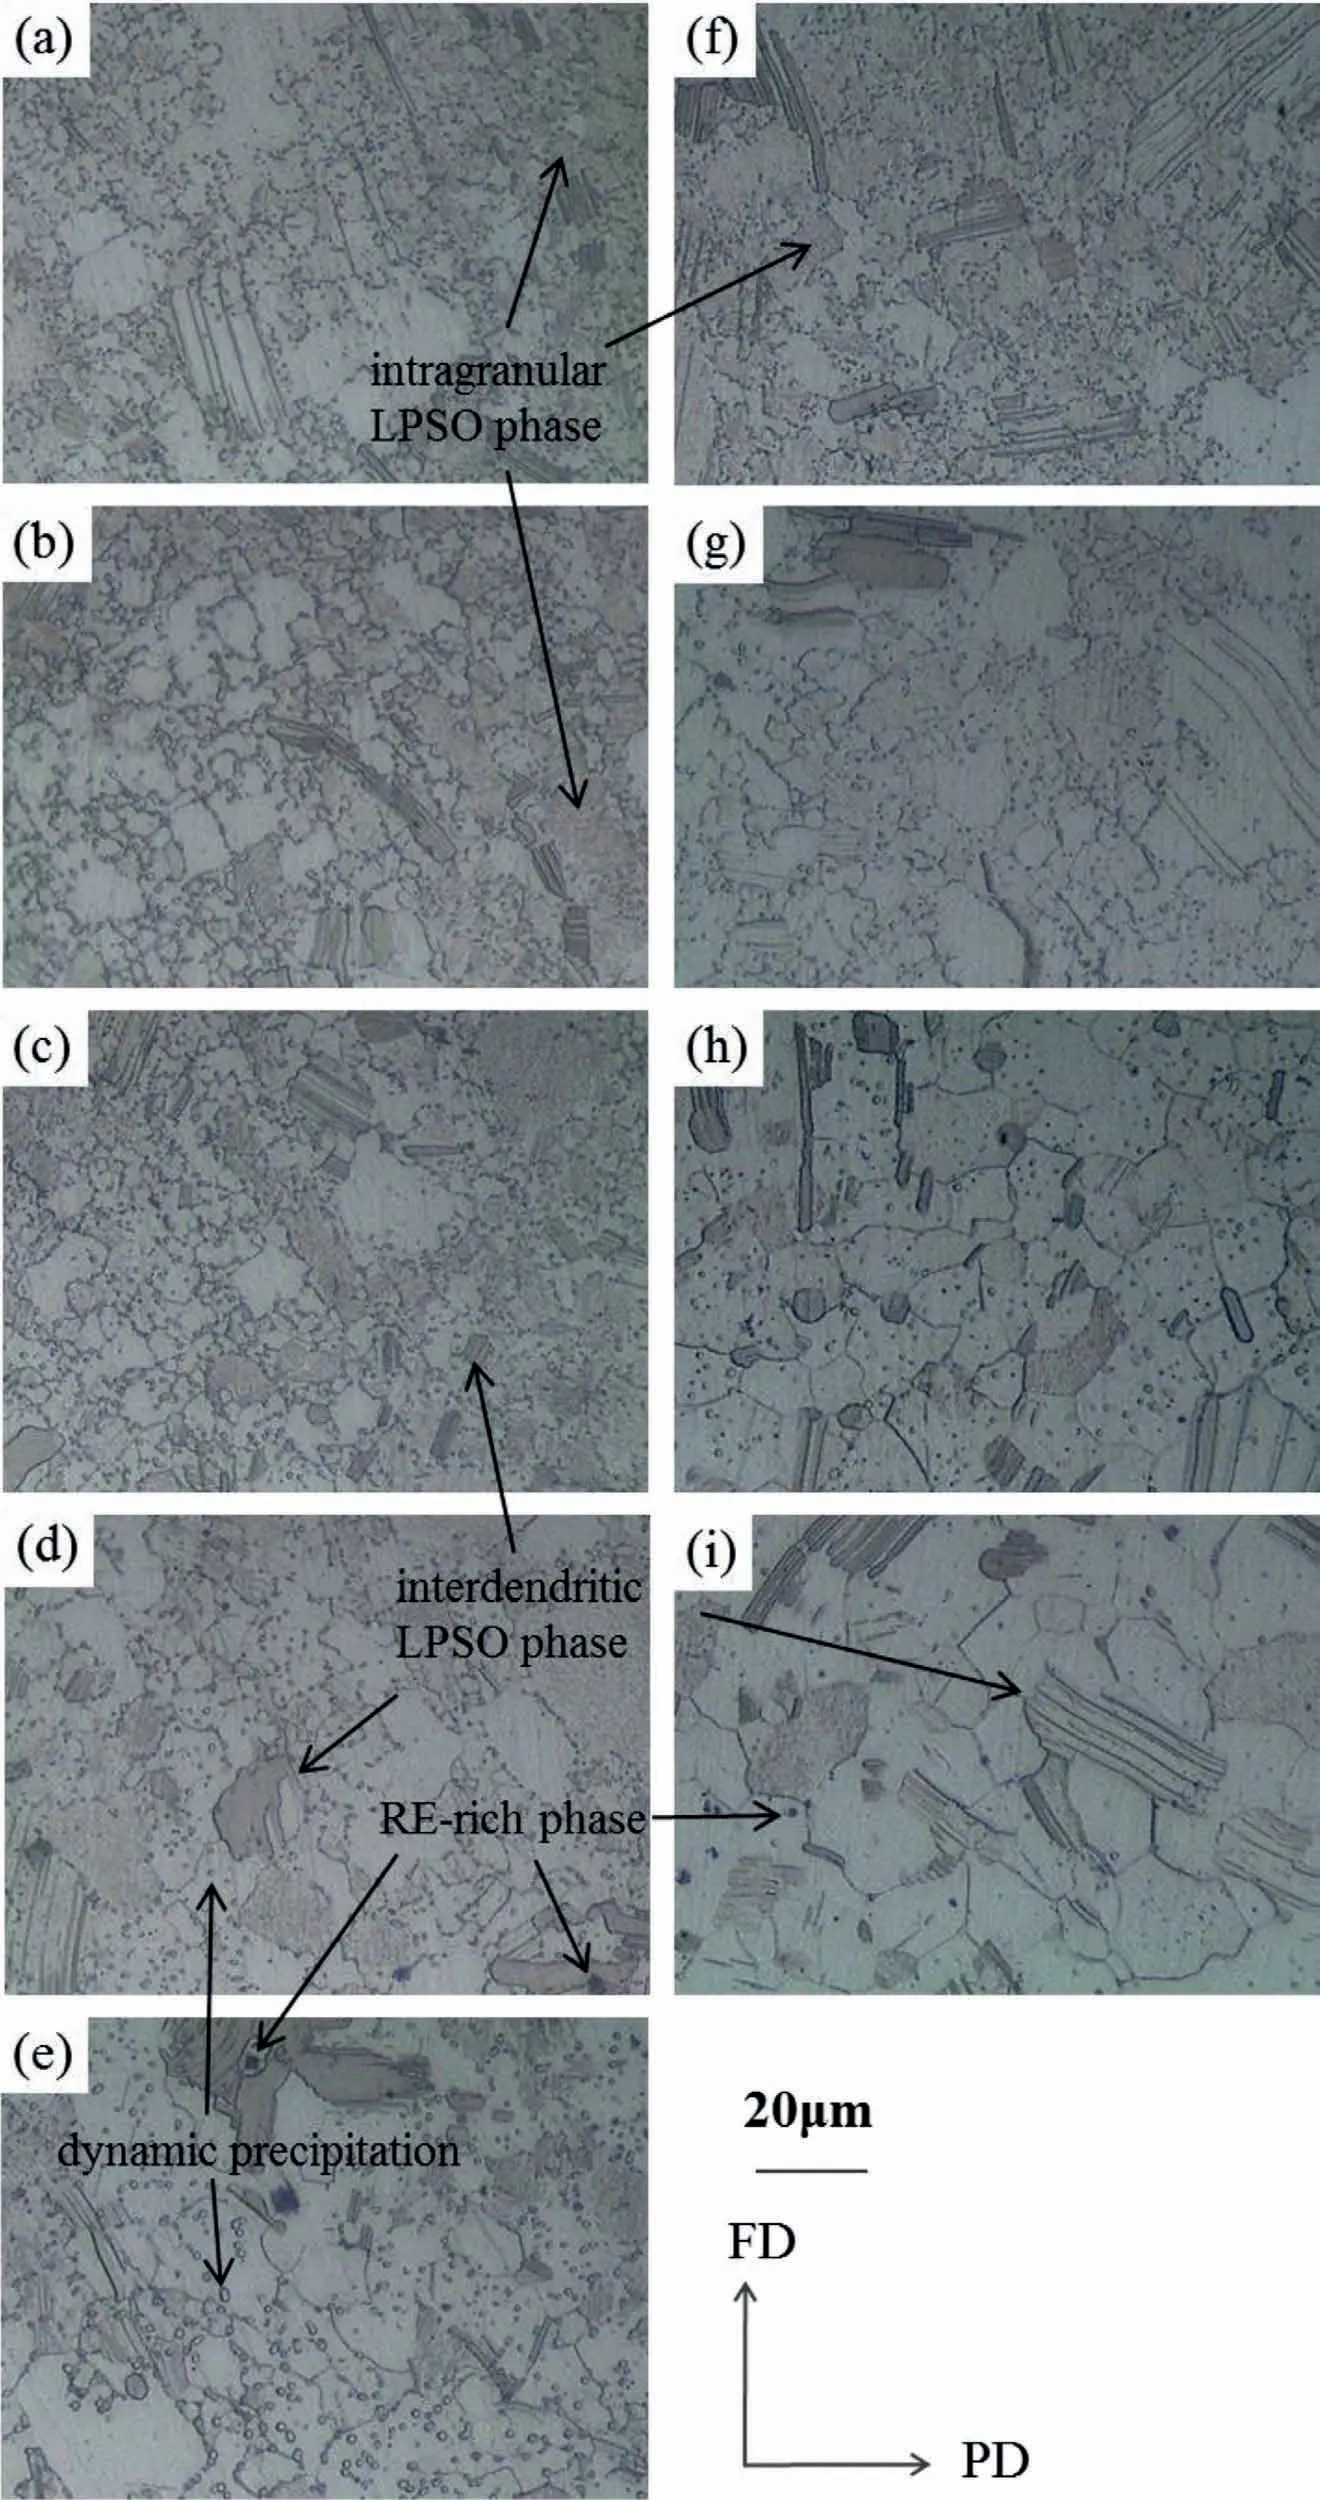
Fig.3.Variations in microstructures of MDFed alloy after being annealed at (a–e) 430 °C and (f–i) 450 °C for (a,f) 5 min,(b,g) 10 min,(c,h) 30 min,(d,i)1 h and (e) 4 h.
Fig.4 displays the SEM micrographs of the T4 samples.It confirms the existence of a large number of precipitates in the 430 °C-4 h solution treated sample (marked as sample 430–4 hereinafter).These precipitates are of spherical or nearly spherical shape,unlike those in Fig.2(c).There is no precipitate observed after treatment at 450 °C for 1 h (marked as sample 450–1 hereinafter),as depicted in Fig.4(b),keeping accordant with the microstructural evolution shown in Fig.3.It is worthy noted that the bright block phases (i.e.RE-rich phases) remain with the increase of heating temperature and time,since they are stable at high temperatures [30].

Fig.4.SEM images of T4 samples which were annealed at (a) 430 °C for 4 h,(b) 450 °C for 1 h.
Fig.5 shows the XRD patterns of the MDFed and T4 treated samples.Onlyα-Mg and LPSO phases can be detected in the 450–1 sample,whereas Mg5(Gd,Y) phases,(i.e.dynamic precipitates) can be recognized in the MDFed and 430–4 ones.The RE-rich phase cannot be detected due to its low volume fraction.It is notable that the XRD intensity ratio of (0002) peak to (1010) peak for the MDFed sample is larger than that of the T4 ones,indicating that the basal planes were tilted after annealing.To precisely understand the texture characteristics,EBSD examinations were carried out.
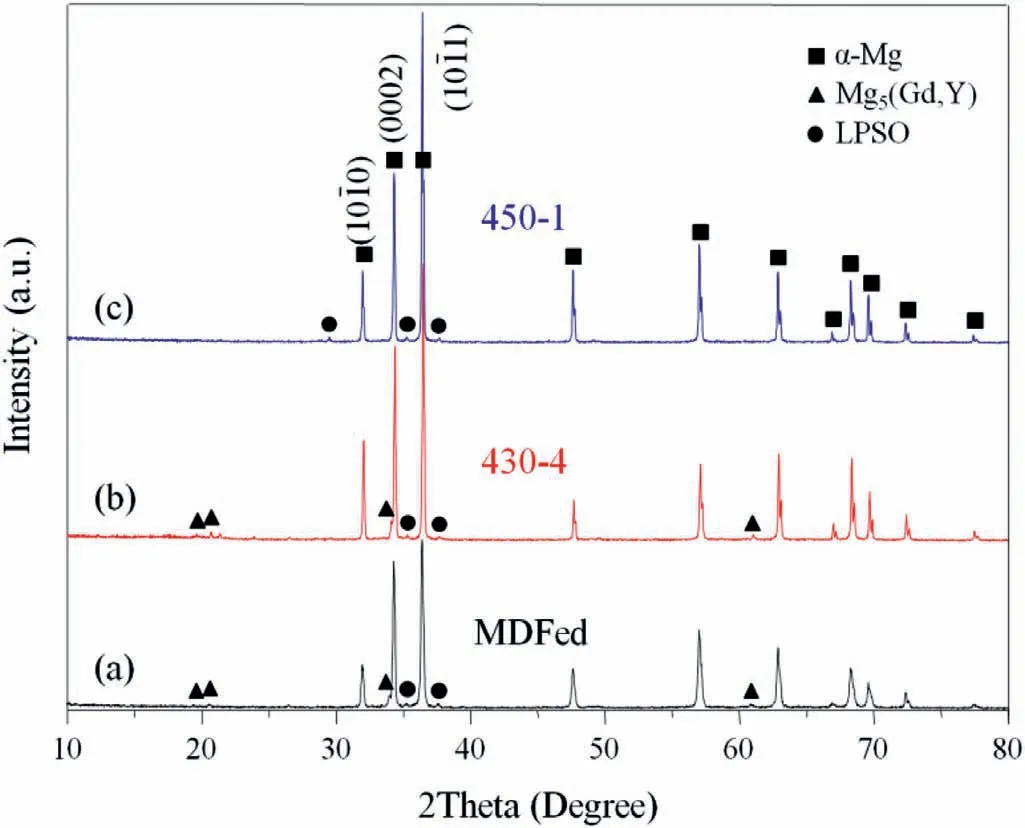
Fig.5.XRD patterns of different samples: (a) MDFed,(b) 430–4,(c) 450–1.
Fig.6(a–c) presents the IPF coloring maps observed on the transverse section along FD and AD of the MDFed and T4 samples.The black regions mainly represent the LPSO phases,due to the lack of phase parameters in the EBSD system.Green and blue colors dominate in Fig.6a,which indicates that the <0110>and <1210>orientation of most grains are parallel to PD.As shown in Fig.6d,the(0001)pole figure has a maximum of 11.7 multiples of random density(MRD) near FD,indicating the strong basal texture,which is generally reported in uniaxially compressed and multidirectional forged magnesium alloys [31–33].However,red color takes a considerable area fraction in the 430–4 and 450–1 sample (Fig.6b and c,respectively),which means the heat treatment broaden the orientation spread of grains.As shown in Fig.6(e and f),the (0001) poles tilt away from FD in T4 samples.The 430–4 sample has a maximum of 7.4 MRD whereas 450–1 sample has a maximum of 7.2 MRD.The inverse pole figures for PD(Fig.6d–f)indicate that the<1010>component is weakened while the <111>component is developed during annealing.

Fig.6.Inverse pole figure maps,EBSD-derived pole figures and inverse pole figures of the (a,d) MDFed,(b,e) 430–4,and (c,f) 450–1 samples,respectively(For interpretation of the references to color in this figure,the reader is referred to the web version of this article).
The weakening of (0001) basal texture during T4 is primarily arising from the preferential growth of grains with non-basal orientations.The texture with <111>orientation parallel to PD is considered to be “rare earth texture”,which is also observed in extruded Mg-Gd and Mg-Y alloys during annealing [34,35].Preferential growth of grains with the<111>direction parallel to PD gives rise to the basal texture rotation,since Gd and Y atoms which segregate at grain boundaries may alter the mobility of grain boundaries[36,37].
3.2. Mechanical properties of the MDFed alloy
Fig.7 shows the typical engineering stress-strain curves of the MDFed and T4 samples,and Table 1 lists the corresponding mechanical properties.The loading axis is parallel to FD.The tensile yield strength of the MDFed sample shows a high value of ∼290 MPa.It gradually decreases with increasing annealing temperatures,while the elongation to failure shows the opposite tendency.

Table 1Tensile properties of the MDFed and T4 samples (standard deviation is given in parentheses).
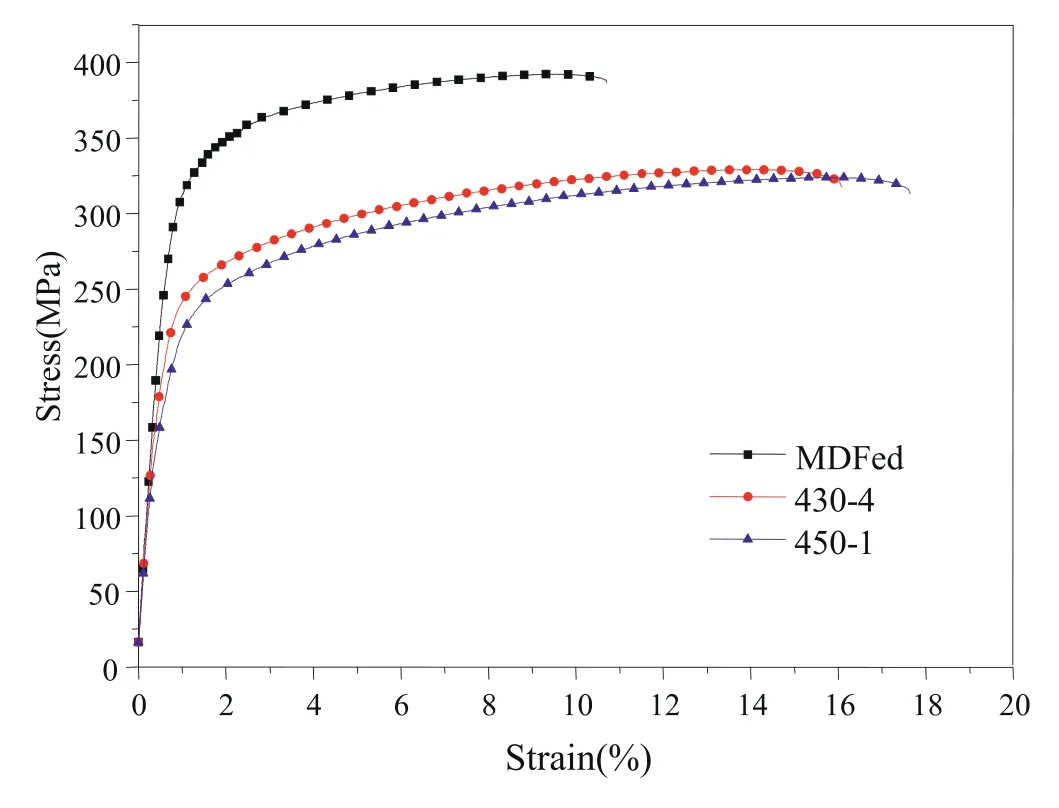
Fig.7.Typical engineering stress-strain curves of the MDFed and T4 samples.
3.3. Microstructure of the T5 and T6 samples
To further improve the mechanical properties,the MDFed and T4 samples were aged at 200 °C.Fig.8a shows the hardening response of the samples during ageing treatment.The MDFed,430–4 and 450–1 samples reach the peak hardness after being aged for 34,32 and 40 h,respectively.Hereinafter,the peak-aged state will be called as MDFed-a,430–4-a and 450-1-a samples,respectively.The hardness of the 430-4 and 450-1 samples shows a rapid increase at the very beginning,ascribed to the addition of Ag element which leads to theγ’’phase in underaged conditions [38–40].However,the hardness of the MDFed sample decreases during 0–2 h,exhibiting an “age-softening” phenomenon,which should be attributed to the combined influence of the annihilation of dislocations and static recovery in the MDFed sample during ageing at 200 °C.
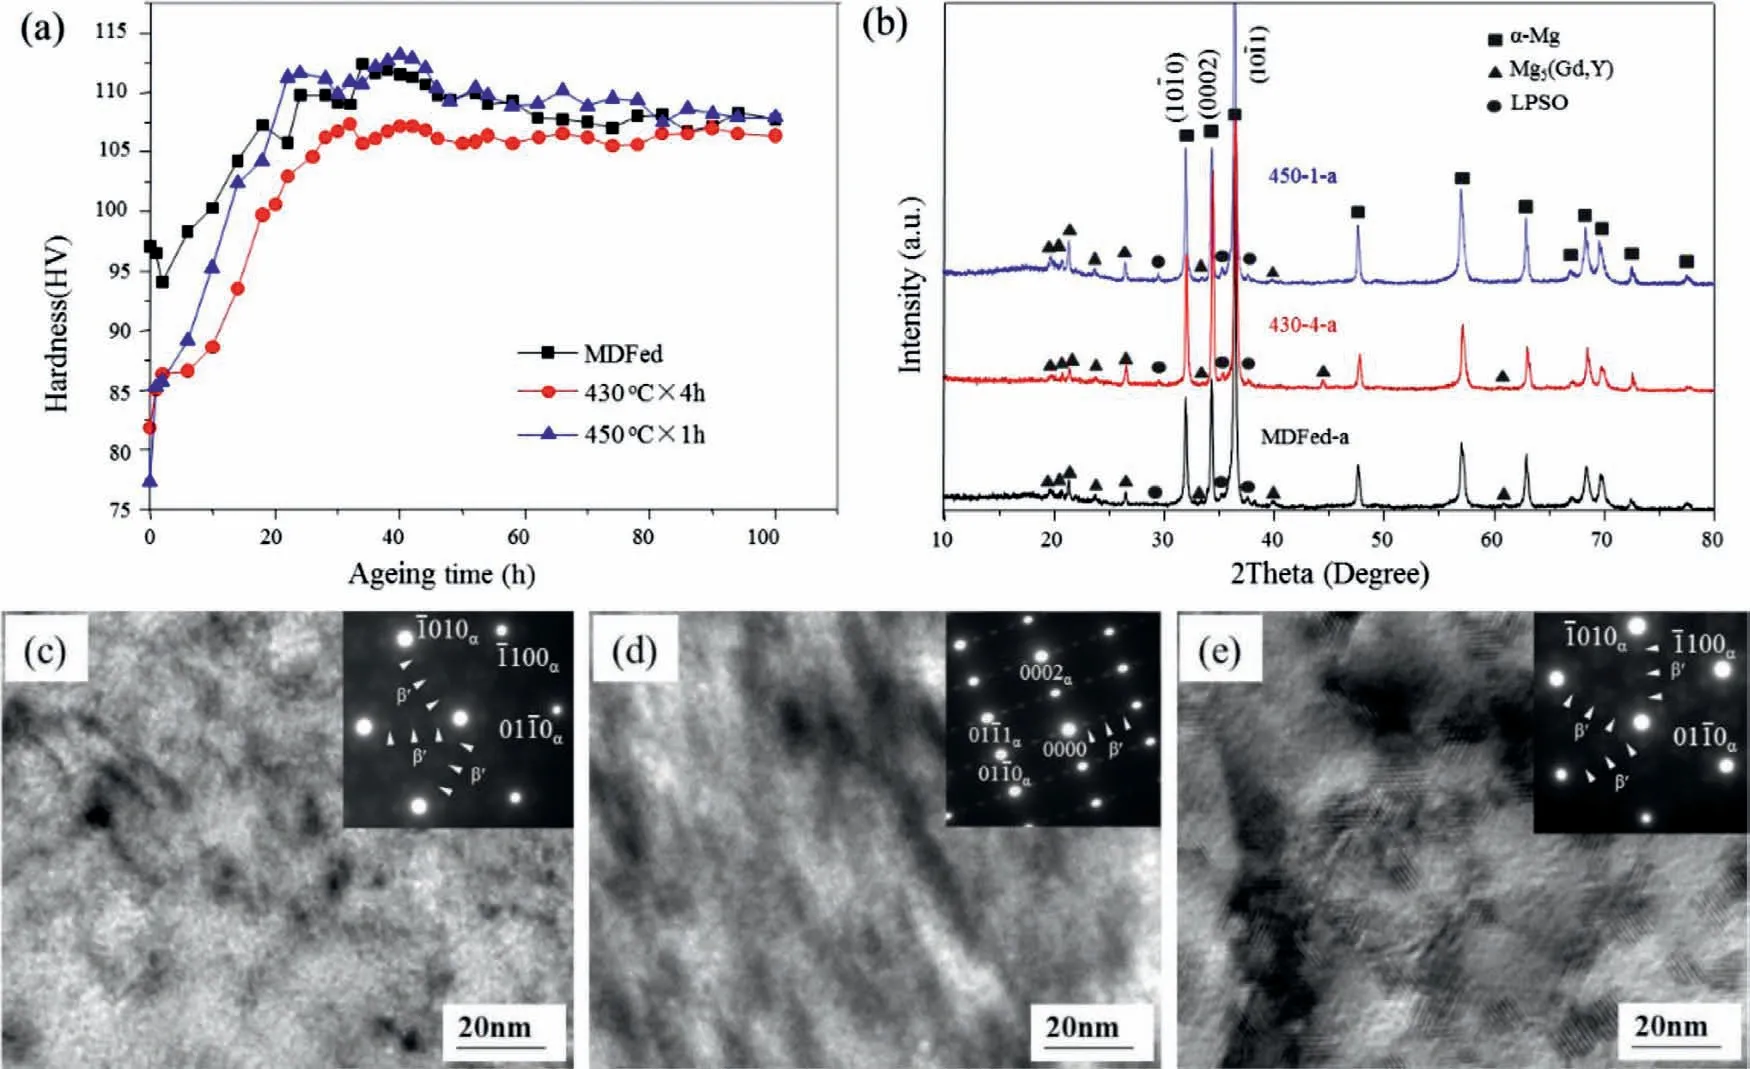
Fig.8.(a) Hardness change,(b) XRD patterns and bright field images of (c) the MDFed-a,(d) 430–4-a and (e) 450–1-a samples,respectively.
XRD patterns and TEM images of peak-aged state are shown here since the superior mechanical properties are generally obtained at this state.The Mg5(Gd,Y) phases can be detected in the 450–1 sample after peak-ageing,meanwhile the XRD intensities of the Mg5(Gd,Y) phases increase in MDFed-a and 430–4-a samples compare with those in MDFed and 430–4 samples.These newly formed Mg5(Gd,Y) phases are identified to beβ’ phases (Fig.8c–e),meanwhile obvious difference in the hardness increase can be observed.The hardness increment of 450–1 sample is the largest among the three samples.It is a logical result from the dissolving of dynamic precipitates,which provides more RE atoms for ageing precipitation.
3.4. Mechanical properties of the T5 and T6 alloys
Fig.9 presents the typical engineering stress-strain curves of the T5 and T6 alloys,the stress-strain curves in the dotted box are enlarged to show more details,and Table 2 lists the corresponding mechanical properties.After being aged for 32 h,the MDFed sample exhibits a slightly higher strength but lower elongation than that of the as-forged state,which should mainly result from the static precipitation during ageing.Although the strength of the 450–1-a sample is improved after ageing treatment,it still lags behind that of the MDFed sample due to the coarse grain size.Meanwhile,the 430–4-a sample exhibits the optimal comprehensive mechanical properties with the TYS of 308 MPa,UTS of 455 MPa,and Efof 7.7%.

Table 2Tensile properties of the T5 and T6 samples (standard deviation is given in parentheses).
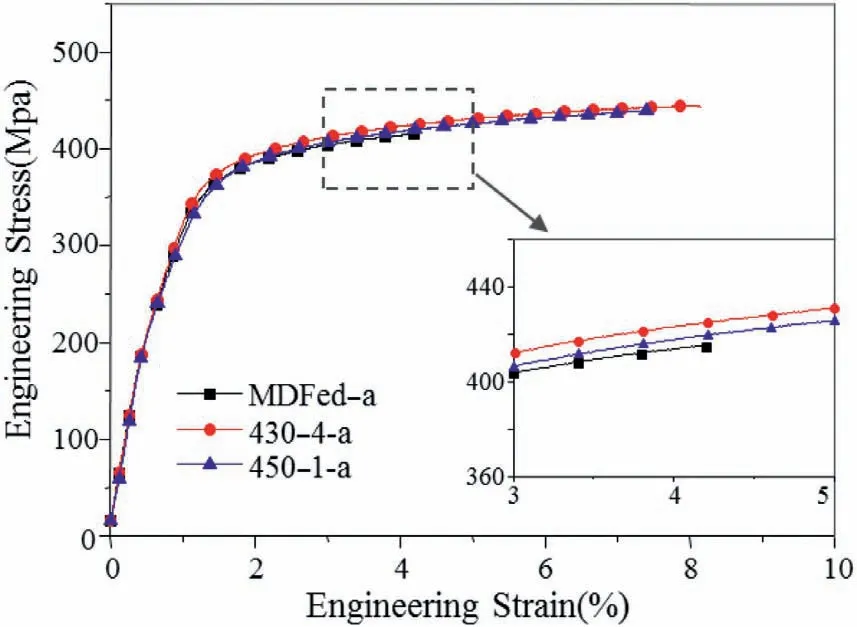
Fig.9.Typical engineering stress and engineering strain curves of peak-aged samples.
4.Discussion
4.1. Strengthening mechanism
Strengthening mechanisms of the MDFed and heat treated Mg-Gd-Y-Zn-Zr-Ag alloys can be divided into grain boundary strengtheningσGB,solid solution strengtheningσss,dislocation strengtheningσdis,particle strengtheningσptand precipitation strengtheningσpp.
4.1.1.Grainboundarystrengthening
Grain boundary strengthening values can be calculated by the Hall-Petch equation:
wherekis a constant (164taken from the extruded Mg–10Gd–2Y–0.5Zr alloy [29]),anddis the average grain size(μm).Putting the average grain size of the MDFed,430–4 and 450–1 samples(2.2,5.5 and 10.5 μm,respectively)into Eq.(1),the corresponding values ofσGBare calculated to be 111,70 and 51 MPa,respectively.
4.1.2.Solidsolutionstrengthening
The contribution of solid solution can be calculated by the following equation [41]:
whereσuis the yield strength of pure Mg (21 MPa [42]),εis an experimental constant (0.74 for Mg-Gd series alloy [43]),Gis the shear modulus of the matrix (1.66 × 10⁴MPa for Mg [44]),andCis the concentration of RE atoms.
Table 3 lists the concentration of the Gd and Y atoms of the MDFed and T4 samples measured by EDS.Since the concentration of Zn and Ag atoms in the matrix is too low to be measured,the solid solution strengthening contribution from Zn and Ag is negligible.The solid solution strengthening value for the MDFed,430–4,and 450–1 samples is 92,91 and 93 MPa,respectively.However,the concentration of the Gd and Y atoms of the peak-aged samples is difficult to be accurately measured by EDS as the precipitates are too dense.In this case,the concentration of Gd+Y atoms is roughly estimated to be 0.6 at.% for Mg-Gd-Y series alloy at 200 °C after peak ageing.Therefore,the solid solution strengthening value for the peak-aged samples is 63 MPa.

Table 3Variations of RE contents in the matrix of MDFed and T4 samples.
4.1.3.Dislocationstrengthening
Fig.10 shows the local misorientation maps of the MDFed and T4 samples.The grain misorientation spread (GOS,i.e.the internal misorientations spread within a grain) is used to distinguish the recrystallized grains from the unrecrystallized ones.The grains with misorientation spread less than 1° are considered as “recrystallized grains” and the grains with misorientation spread greater than 1° are regarded as“unrecrystallized grains” [45,46].It should be noted that the recrystallized grains of the MDFed sample derive from dynamic recrystallization,while static recrystallization for the T4 samples.Most unrecrystallized grains are presented in green (Fig.10b,e and h),while blue color dominates in the recrystallized grains (Fig.10c,f and i),indicating that the dislocation density of recrystallized ones is much lower than that of unrecrystallized grains.Just taking the unrecrystallized grains into consideration,the dislocation strengthening can be calculated by Eq.(3) [47]:
Panguite is an especially exciting discovery since it is not only a new mineral, but also a material previously unknown to science, says Chi Ma, a senior scientist and director of the Geological and Planetary Sciences division s Analytical Facility at Caltech and corresponding author on the paper.
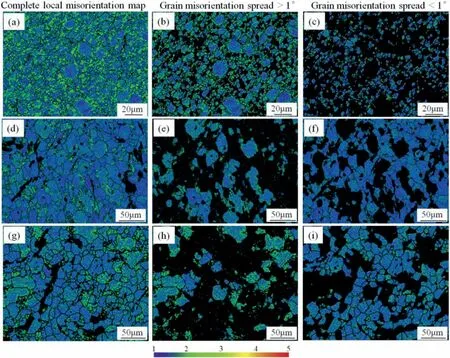
Fig.10.The local misorientation maps of the (a–c) MDFed,(d–f) 430–4,and (g–i) 450–1 samples.Blue and red represents the low and high local residual plastic strain concentration,respectively (For interpretation of the references to color in this figure legend,the reader is referred to the web version of this article).
whereMunRXis the Taylor factors for the unrecrystallized grains (3.5 for Mg with a strong texture [48]),αis a constant(0.2 for Mg [48]),bis the Burger’s vector (3.2 × 10⁻¹⁰m for Mg [49]),ρunRXis the dislocation density (a typical value of 1×10-14m-2for deformed Mg alloys[50]),funRXmeans the volume fraction of unrecrystallized grains (66.5%,27.7% and 26.5% for MDFed,430-4 and 450-1 samples,respectively).Thenσdisare calculated as ∼24,10 and 10 MPa,respectively.
4.1.4.Particlestrengthening
The contribution of dynamic precipitatedβphases and interdendritic LPSO phases can be estimated by the loadbearing strengthening effect,which can be expressed as[51,52]:
whereσyis the tensile yield strength,σmis the tensile yield strength of the matrix,sβandsLPSOare the aspect ratio ofβphases and interdendritic LPSO phases,respectively,VβandVLPSOare the volume fraction ofβphases and interdendritic LPSO phases,respectively.The aspect ratio and volume fraction ofβphases and interdendritic LPSO phases are listed in the Table 4.Thenis calculated as 19,7 and 0 MPa for the MDFed,430–4 and 450–1 samples,respectively.Theis 22,28 and 22 MPa,respectively.

Table 4Aspect ratio and volume fraction of β phases and interdendritic LPSO phases of MDFed and T4 samples.
4.1.5.Precipitationstrengthening
The contribution to precipitation strengthening from the intragranular plate-like LPSO phases can be calculated by the equation below [53]:
whereνis the Poisson’s ratio(v=0.32),fpindicates the fraction of intragranular plate-like LPSO phases,dtrepresents the average diameter of intragranular plate-like LPSO phases,Nis the number density of intragranular plate-like LPSO phases,andtis the thickness of intragranular plate-like LPSO phases.The average diameter,number density and thickness of intragranular plate-like LPSO phases are estimated to be about 172 nm,1.12 × 1021m-3and 4.6 nm,respectively.Therefore,theis calculated to be 21 MPa.
Since grain size,morphology and volume fraction of dynamic precipitates and LPSO phases do not change significantly during ageing,the grain boundary strengthening,particle strengtheningσptand precipitation strengthening from the plate-like LPSO phases in as-aged condition are the same as that in MDFed and T4 condition.The precipitation strengthening contribution fromβ′phases () can be calculated by the increment of TYSΔσy,loss of solid solution strengthening effectΔσssdue to the depletion of solute,and loss of dislocation strengthening effectΔσdisdue to annihilation of dislocations,as followed Eq.(9):
Since the ageing temperature is much lower than the annealing temperature,the dislocation strengthening of the T4 samples may not decrease during ageing.However,it should be noted that the “age-softening” phenomenon was observed at the early ageing stage of MDFed sample,which is considered to be the influence of the annihilation of dislocations.This indicates that dislocation strengthening of the MDFed sample decreases during ageing,which makes the value ofΔσdisto be positive.Thenis 129 and 132 MPa for 430–4-a and 450–1-a samples,respectively.Andof the MDFed-a sample is more than 44 MPa.
There is still a small gap (1∼2 MPa) between the experimental tensile yield strength with the above calculated result,which can be attributed to other strengthening mechanisms,such as texture strengthening.Different strengthening contri butions are summarized in Table 5.It is suggested that grain boundary strengthening and solid solution strengthening are the main contributors to the TYS in MDFed,MDFed-a,430–4 and 450–1 samples,while precipitation strengthening fromβ′phases is the largest contributor in 430–4-a and 450–1-a samples.It is easy to understand that the decrease of grain boundary strengthening in T4 samples is attributable to grain growth during annealing.Theβ′phases show higher precipitation strengthening effect than the intragranular plate-like LPSO phases,since theβ′phases on prismatic planes ofα-Mg matrix hinder basal dislocation slip more effectively than the intragranular plate-like LPSO phases on basal planes.

Table 5Strengthening contributions for different states of Mg-6Gd-4Y-0.7Zn-0.4Zr-0.3Ag alloys.
4.2. Factors influencing the ductility
Fractured morphologies of the MDFed and T4 tensile samples are shown in Fig.11.Dimples are only observed in the T4 samples,as shown in Fig.11(b and c),which correspond to the superior elongation to failure.However,cleavage planes,which probably cause a decrease of elongation,are observed in all samples.Since the cleavage plane is caused by the crack propagation within the grain,finer grains can improve the fracture elongation by inhibiting the crack propagation,which means that the grain growth during the annealing leads to the decline of elongation to some extent.More importantly,although dynamic precipitates can do harm to the ductility via providing nucleation sites for microcracks as shown in Fig.11(a,b,d and e),their effect of pinning grain boundaries and delaying grain growth during annealing can counteract the decrease of elongation to some extent.On the other hand,the irregular dynamic precipitates,which exist in the MDFed sample,probably possess the greater harm than the spherical dynamic precipitates in the 430–4 sample(Fig.11d and e),since their top ends may cause stress concentration and resultant crack initiation,propagation and coalescence [54,55].Furthermore,the T4 samples exhibit higher average Schmid factor(SF)value of the{0001}<110>basal slip along FD (0.30 and 0.29 versus 0.23),as shown in Fig.12.It also accounts for the better elongation of T4 samples.Consequently,the T6 sample annealed at 430°C exhibits the highest strength and ductility among all the ageing samples.
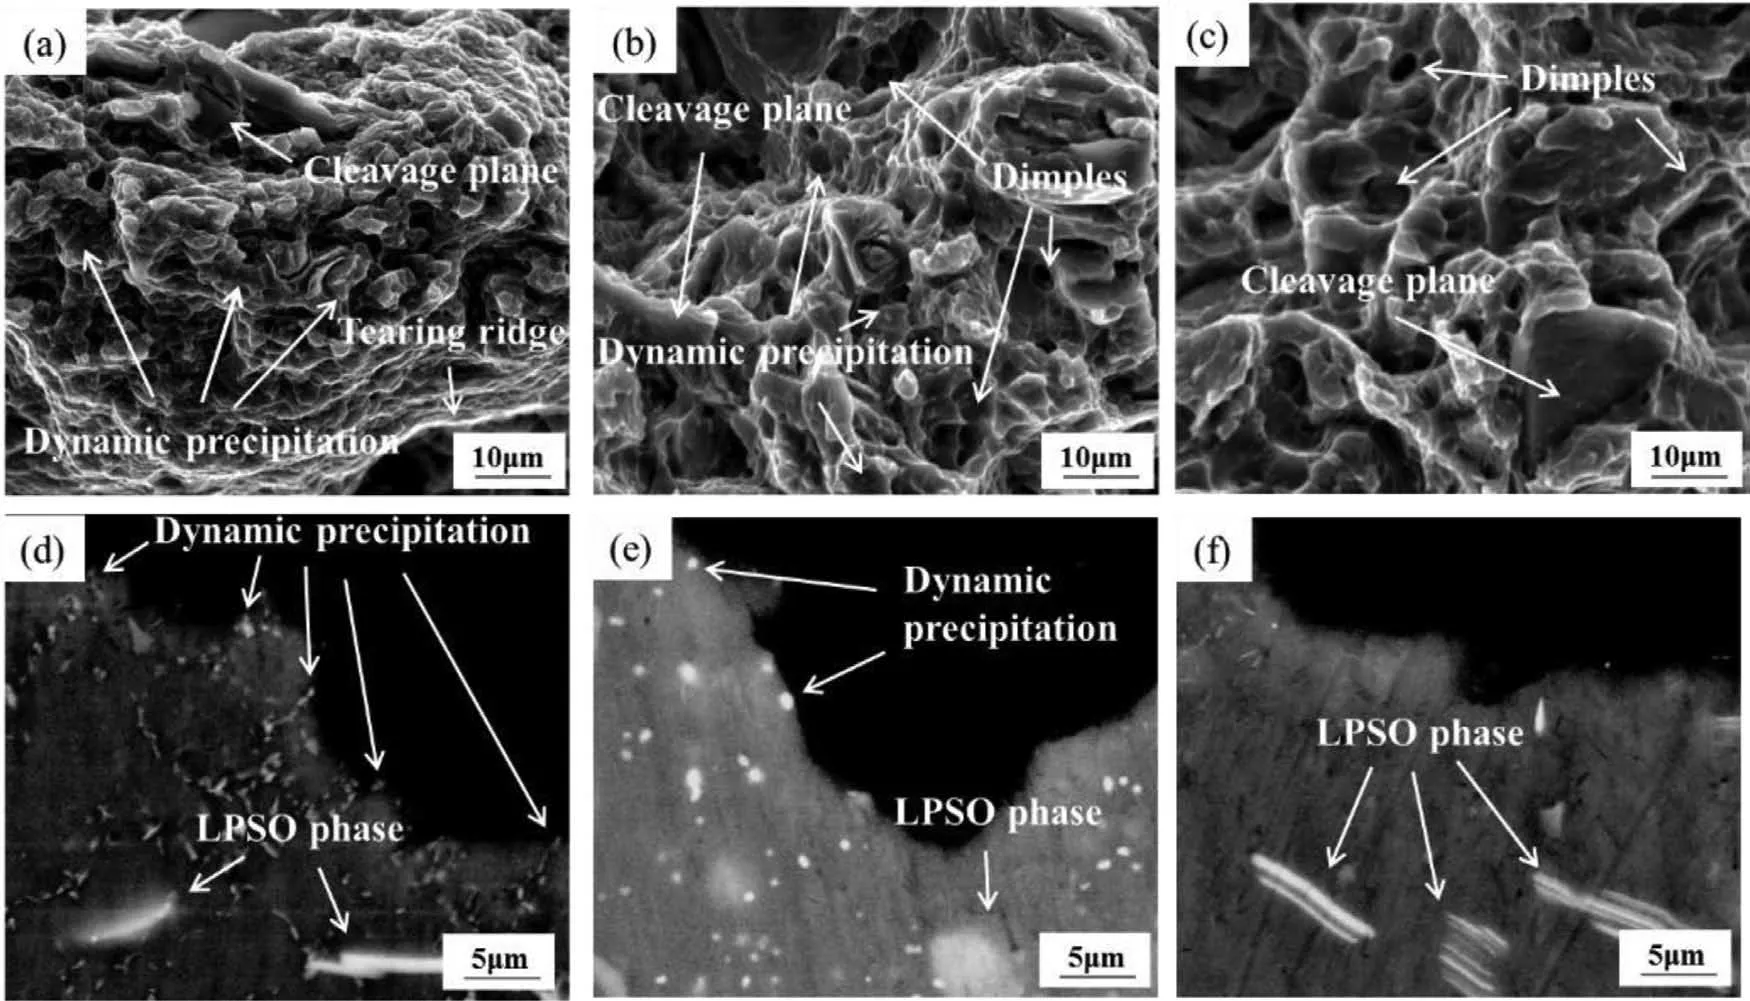
Fig.11.SEM images of the (a)–(c) fracture surfaces and (d)–(f) cross sections of the fractured samples: (a),(d) MDFed,(b),(e) 430–4,and (c),(f) 450–1 samples.
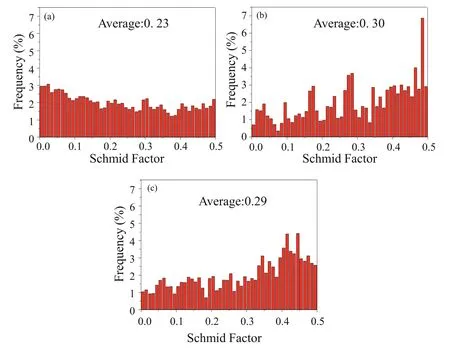
Fig.12.Distribution of the {0001}<110>Schmid factor of the (a) MDFed,(b) 430–4,and (c) 450–1 samples,with the loading axis parallel to the final forging direction (FD).
5.Conclusion
In the present study,Mg-6Gd-4Y-0.7Zn-0.4Zr-0.3Ag(wt.%) alloy was subjected to MDF process and subsequent heat treatment (T4,T5 and T6).The microstructure evolution and variation of mechanical properties were investigated.The conclusions can be summarized as follows:
(1) During the MDF process,irregular equilibriumβphases precipitate along the grain boundaries.The volume faction and size of dynamic precipitates slowly increase with the increase of annealing time at 430 °C.Dynamic precipitates are of spherical or nearly spherical shape after annealed at 430 °C for 4 h,while they are almost dissolved into theα-Mg matrix after annealed at 450°C for 1 h.
(2) The MDFed alloy exhibits strong basal texture and the maximum intensity of the texture decreases gradually with the increasing of annealing temperature.
(3) Dynamic precipitation makes a small contribution to the strength and deteriorates the ductility of the alloy.Compared with the spherical dynamic precipitates,the irregular dynamic precipitates may cause more damage to the ductility due to their top ends which are more likely to cause stress concentration and crack initiation.
(4) The sample annealed at 430 °C followed by ageing at 200 °C for 34 h exhibits the optimal strength and ductility in this study,with the TYS of 308 MPa,UTS of 455 MPa,and elongation of 7.7%,which can be ascribed to the relatively fine grains,nearly spherical dynamic precipitates and sufficient fineβ’ ageing precipitates.
Acknowledgment
This work was supported by National Natural Science Foundation of China (Grant No.51874367 and 51574291).The authors wish to express the sincere appreciation to the anonymous reviewers for supplying helpful comments.
 Journal of Magnesium and Alloys2023年6期
- Journal of Magnesium and Alloys的其它文章
- Ameliorating the re/dehydrogenation behaviour of MgH2 by zinc titanate addition
- Inhibiting effect of I-phase formation on the plastic instability of the duplex structured Mg-8Li-6Zn-1.2Y (in wt.%) alloy
- PEO coating on Mg-Ag alloy: The incorporation and release of Ag species
- Underlying mechanisms of variation in yield asymmetry and strain hardening behavior of extruded pure Mg with Gd addition
- Edge crack damage analysis of AZ31 magnesium alloy hot-rolled plate improved by vertical roll pre-rolling
- High sintering and dielectric performance: The improved (Mg,Zn)3B2O6 ceramics with the help of the DFT calculation
