Effects of temperature on critical resolved shear stresses of slip and twining in Mg single crystal via experimental and crystal plasticity modeling
Kwng Seon Shin ,Liei Wng ,Mingzhe Bin ,Shihoon Choi ,Alexner Komissrov ,Vicheslv Bzhenov
aMagnesium Technology Innovation Center,Department of Materials Science and Engineering,Seoul National University,1 Gwanak-ro,Gwanak-gu,Seoul 08826,Republic of Korea
b Laboratory of Medical Bioresorption and Bioresistance,Moscow State University of Medicine and Dentistry,Delegatskaya 20/1,Moscow,127473 Russia
c Shanxi Key Laboratory of Advanced Magnesium-Based Materials,College of Materials Science and Engineering,Taiyuan University of Technology,Taiyuan 030024,China
d Departments of Advanced Components and Materials Engineering,Sunchon National University,Suncheon,Jeonnam,57922,Republic of Korea
eLaboratory of Hybrid Nanostructured Materials,National University of Science and Technology "MISiS",Leninskiy pr. 4,Moscow,119049 Russia
fCasting Department,National University of Science and Technology "MISiS",Leninskiy pr. 4,Moscow,119049 Russia
Abstract Magnesium (Mg) single crystal specimens with three different orientations were prepared and tested from room temperature to 733 K in order to systematically evaluate effects of temperature on the critical resolved shear stress (CRSS) of slips and twinning in Mg single crystals.The duplex non-basal slip took place in the temperature range from 613 to 733 K when the single crystal samples were stretched along the <0110>direction.In contrast,the single basal slip and prismatic slip were mainly activated in the temperature range from RT to 733 K when the tensile directions were inclined at an angle of 45° with the basal and the prismatic plane,respectively.Viscoplastic self-consistent (VPSC) crystal modeling simulations with genetic algorithm code (GA-code) were carried out to obtain the best fitted CRSSs of major deformation modes,such as basal slip,prismatic slip,pyramidal II
Keywords: Magnesium;Single crystal;Critical resolve shear stress;Slip;Twinning.
1.Introduction
Recently,the demands for reducing environmental pollution and improving energy utilization ratio are rising,thus the magnesium and its alloys are attracting more and more attentions because they are the lightest structural metals[1–4].The magnesium has a hexagonal close packed(HCP)structure[5],so in theory,it has basal,prismatic,pyramidal ,pyramidal
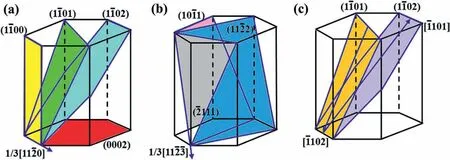
Fig.1.Schematic diagrams showing the major deformation modes in Mg and its alloys: (a) basal,prismatic,and pyramidal slip systems with Burgers vector,(b) pyramidal slip systems with
To investigate the CRSSs of magnesium experimentally,utilizing magnesium single crystal is the most popular method.For example,single crystal tensile specimens with different orientations were tested at various temperatures and the temperature dependency of CRSSs of basal ,prismatic and pyramidal II
With the advance of the visco-plastic self-consistent(VPSC) model developed by Lebensohn and Tomé,it is now possible to compute CRSSs of major deformation modes in HCP metals,particularly in Zr [30,31].Agnew et al.[32] utilized this code to compute the CRSS of major deformation modes in polycrystalline Mg alloys.Since then,a large number of papers relating VPSC simulation on Mg alloys have emerged [33–36].However,one challenge that this code facing is to determine a large number of material parameters,for instance,assuming four deformation modes are employed in the simulation,at least 16 parameters have to be determined,i.e.,the initial hardening rate,the asymptotic hardening rate,the back-extrapolated stress of each deformation mode,CRSS,and so on.Thus,the calculated amount is massive and need huge labors to obtain the best result.In recent,a genetic algorithm (GA) has been shown to be an effective way to obtain the best optimized solution after a certain time of “evolution”[37,38].At each step,the genetic algorithm randomly selects individual values from a specific range of values and uses them as parents to produce the children for the next generation.Over successive generations,the population "evolves"towards an optimal solution.Therefore,applying the GA into VPSC should be an effective way to save labors and obtain the optimal result.
In the present study,we have applied the GA to the VPSC code and used this code (VPSC-GA) to compute the CRSSs of basal ,prismatic and
2.Experimental procedure
2.1. Sample preparation and experimental procedure
A 60 mm in diameter and 150 mm long pure Mg single crystal was grown by a modified vertical Bridgman method.A graphite mold filled with pure Mg chunks (>99.95 wt.%purity) was placed into a vertical electric resistance furnace.The graphite crucible was special designed so that the large single crystal was promoted.Then the mold was lowered at a speed ∼5 mm/hr under an argon protective environment at temperature of 1023 K.The cooling water line was set at the bottom of the furnace so that the temperature gradient was generated.The crystallographic orientation of the asgrown single crystal was confirmed by the Laue back reflection method.Tensile specimens (a width of 3 mm,a thickness of 2 mm and a gauge length of 12 mm) and compressive specimens (a width of 4 mm,a thickness of 4 mm and a gauge height of 6 mm) were prepared from the as-grown single crystal using a wire spark erosion machine.The oxidized side surfaces of these specimens were carefully removed by mechanical grinding using silicon carbide papers and fine polishing using alumina powders.These specimens were annealed subsequently in an evacuated Pyrex tube to eliminate dislocations that might be introduced during mechanical grinding and fine polishing.Finally,the oxides on the specimen surface were removed carefully by a chemical polishing using a solution of CH3OH and HNO3(volume ratio of 2:1).Tensile and compressive tests are performed in the furnace installed on an Instron 5582 electronic universal testing machine at temperatures ranging from room temperature (RT) to 733 K (298,413,453,493,533,573,613,653,693,733K) at an initial strain rate of 1 × 10⁻⁴/s.To make an accurate strain measurement at high temperatures,the linear variable displacement transducer (LVDT) was utilized to record the displacement during tensile and compressive deformation.
Initial orientations of single crystal specimens were measured by the Laue back reflection method and electron backscatter diffraction (EBSD) using FE-SEM S-4300SE fitted with a TSL EBSD camera operating at 20 kV at a 70°tilting angle.Besides,the (0002) and (10-10) pole figures were also conducted by macro-texture analysis on X’Pert PRO MRD/XL XRD.After plastic deformation,microstructures of the deformed specimens were observed by optical microscopy(OM).Slip trace analyses were performed to clarify the responsible deformation mechanisms.Further observation of the microstructures was performed using Tecnai F20 transmission electron microscopy(TEM)operated at 200 kV.The deformed specimens were cut into 800 μm slices using a MTI precision wire saw,and then grounded to 130 μm in thickness using a series of sandpapers down to 2000 grit number.3 mm disks were punched from those slices,and twin-jet electro-polished using Tenupol-5 in a solution of 20 ml perchloric acid,and 980 ml ethanol.Afterwards,the specimens were cleaned using Gatan 691 PIPS Precision Ion Polishing System under a gentle milling condition.
2.2. VPSC-GA computational methodology
VPSC-GA modeling was carried out in the present study.The GA is used to optimize the Voce hardening parameters for different temperature conditions.There is a total of 20 parameters to be optimized as 5 deformation modes are considered and 4 Voce hardening parameters are associated with each deformation mode.The GA starts with creating an initial population consisting of solution vectors which are also called genes or chromosomes in GA terminology.A particular solution vector consists of values of 20 parameters which are randomly initialized between the upper bound(UB)and lower bound (LB) value of individual parameters.The VPSC simulations are performed for each solution vector and resulting stress-strain response as well as texture data are recorded.The fitness function takes the mean-square-error value between the experimental data and each instance of simulation data as fitness value.Next,the best individual solutions are selected to generate new solutions using crossover and mutation functions that replace the worst performing solutions.The fraction of population replaced by crossover and mutation steps is a tunable parameter.A commonly used value for this parameter is 0.8 which means that only 80% of total population will be replaced by crossover and remaining 20% will be replaced by mutation.The crossover generates intermediate values between the two selected parents.The mutation function only requires one parent solution vector in which values of only few randomly selected parameters is changed satisfying the corresponding LBs and UBs of those parameters.The new population of solution vectors generated by these operations is used to carry out VPSC simulations what is called as next generation.This procedure of calculation of fitness value,selection,crossover and mutation is carried out for subsequent generations until a stopping criterion is reached.The stopping criterion is triggered by maximum number of generations or tolerance in fitness value.The plot of fitness value with subsequent generations can be shown to prove the convergence of the solution to an optimal value.The optimal values of hardening parameters are,then,used to run VPSC simulations to compute the CRSS values of different deformation modes.
The major deformation modes of Mg alloys such as{0002}<1120>basal slip,{100} <110>prismatic slip,{112} <11>pyramidal II
whereΓwas the accumulated shear in the grain;andwere the initial CRSS,the initial hardening rate,the asymptotic hardening rate and the back-extrapolated stress,respectively.In order to fulfill the twin reorientation problem during plastic deformation,the predominant twin reorientation (PTR) scheme was implemented in this code [30].At each incremental step,the accumulated twin fraction in the individual twinning systems of each grain was compared with a threshold fraction,Vth,mode,defined as follows:
where Vacc,modeand Veff,modewere the accumulated twin fraction and the effective twinned fraction,respectively.The threshold values,Ath1and Ath2,determine the evolution of the twin volume fraction during the plastic deformation.The parameters of the PTR-model was set as Ath1=0.5 and Ath2=3.5 for the {1012} tensile twin;Ath1=0.1 and Ath2=0.5 for the {1011} compressive twin,respectively.How the material parameters derived via the VPSC-GA code were described in Fig.2.It is generally accepted that slip was rate sensitive,twinning was usually considered to be rate insensitive.Since the derivation of twin stress and an evolution of twinning with temperatures were the main focus of this study,a rate-insensitive model was chosen.

Fig.2.A flow chart showing that how material parameters were derived via the VPSC-GA code.
3.Results and discussion
The tensile specimens with three different orientations were prepared and they were designated as A type,B type and C type specimens,respectively.Their initial orientations were measured using EBSD as well as XRD and shown in Fig.3.From the (0002) and (1010) pole figures observed from macroscopical XRD,it can be seen that the orientations are accurate.The EBSD-IPF map shows red-color and the maximum intensity of the (0002) basal pole is located in the center (Fig.3(a)),indicating that the (0002) basal plane is perpendicular to the normal direction (ND) of the tensile sample.The (1010) prismatic pole shows six-fold symmetry and one pair of the (1010) poles is directed at the loading direction (LD),indicating that the [1010] axis is aligned parallel to the LD.Fig.3(b) shows blue color and one of the(1010) prismatic poles is parallel to the ND,revealing that the [1010] axis is parallel to the ND.Based on the distribution of (0002) basal pole figure,it can be found that the(0002) basal plane is nearly 45° inclined with the LD.The EBSD-IPF map and the (0002) basal pole of Figs.3(a) and Fig.3(c) are nearly identical.The difference is the LD.The loading direction of the A type specimen is confirmed to be parallel with the [0110] direction,while those of the B and C type specimens are inclined at an angle of 45° with basal plane and prismatic plane,respectively.

Fig.3.EBSD inverse pole figure (IPF) maps and (0002) and (1010) pole figures measured by XRD showing initial orientations of (a) A-type specimen,(b)B-type specimen and (c) C-type specimen.
3.1. Effects of orientation and temperature on deformation behavior of Mg single crystals
The tensile and compressive curves of the A-type specimens deformed in the temperature range RT ∼733K are shown in Figure (4)a,in which the solid lines indicate the tensile curves,and the dashed lines represent the compressive curves,respectively.A higher magnification of the rectangular box marked in Fig.4(a) is shown in Fig.4(b),which provides easy visualization of the tensile and compressive curves obtained at elevated temperatures.With the testing temperature increasing,both the tensile and compressive flow stresses decrease considerably.Additionally,a significant difference between the tensile and compressive curves can be seen.The tensile curves show a convex shape,while the compressive curves show a concave shape except the curves obtained from the specimens deformed at 693 K and 733 K.This indicates that mechanisms responsible for the tensile and compressive deformation are different.A recent study made by Barnett et al.reported that flow curves having convex nature were governed by slip formation and flow curves showing concave nature were governed by the twin formation [39].SFs of the major deformation modes such as basal slip,prismaticslip,pyramidal I
Table 1SFs of basalslip,prismaticslip,pyramidal I
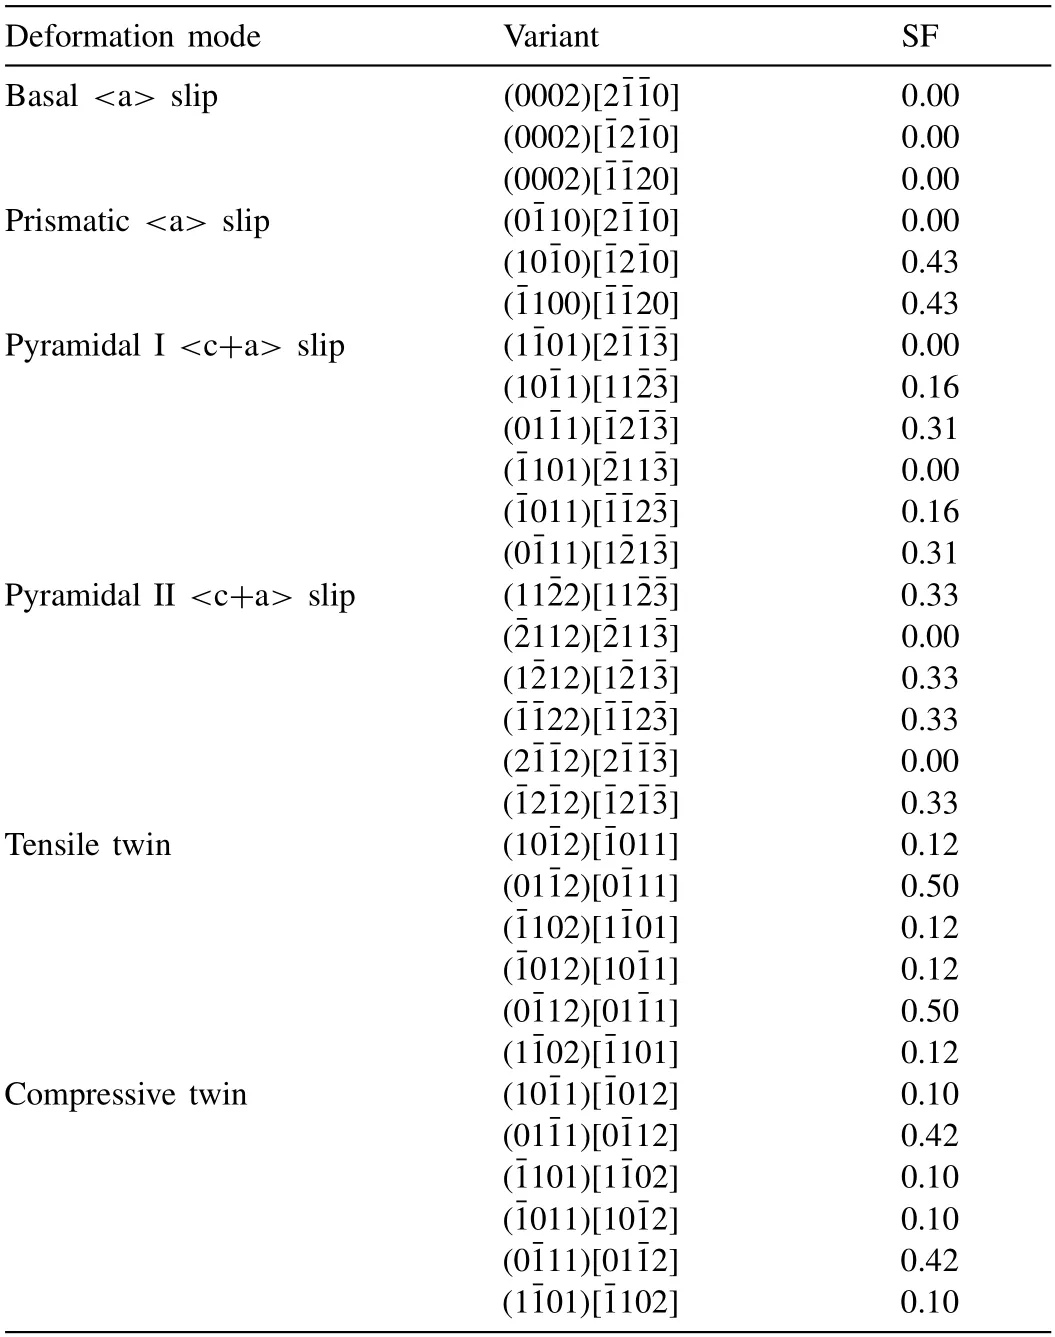
Table 1SFs of basalslip,prismaticslip,pyramidal I

Fig.4.(a)Tensile and compressive curves of the A-type specimens deformed in the temperature range RT ∼733 K,and (b) the enlargement of the area marked by square in Fig.4a.

Fig.5.Predicted traces of possibly active variants of prismatic slip,pyramidal I
The microstructures of the A-type tensile specimens deformed at temperature range RT∼733 K are shown in Fig.6.The wider (0001) plane surfaces are systematically observed using optical microscope.All the tensile deformed samples are found to have surface steps on the (0001) plane.Additionally,these micrographs are taken directly from the(0001) plane (as shown on the left-hand side) without further treatments including polishing and etching.These surface steps are removed easily by re-polishing and thus considered to be generated by slips not by twins [36].Obvious slip traces can be observed from the 613 K deformed specimen.Moreover,the angle of the intersected slip lines is measured to be in a range of 57° to 67°,which are close to the calculated angle of 60° for the prismatic slip.Therefore,these slip traces are considered to be generated by the prismatic slip on the (0001) surface.Nevertheless,the prismatic slip is not supposed theoretically to produce slip steps on the (0001) surface because its Burgers vector is parallel to that surface.Since it is quite difficult to cut the surface exactly parallel with the (0001)plane,the slip steps produced by the prismatic slip may be associated with the slight deviation from the (0001)plane.
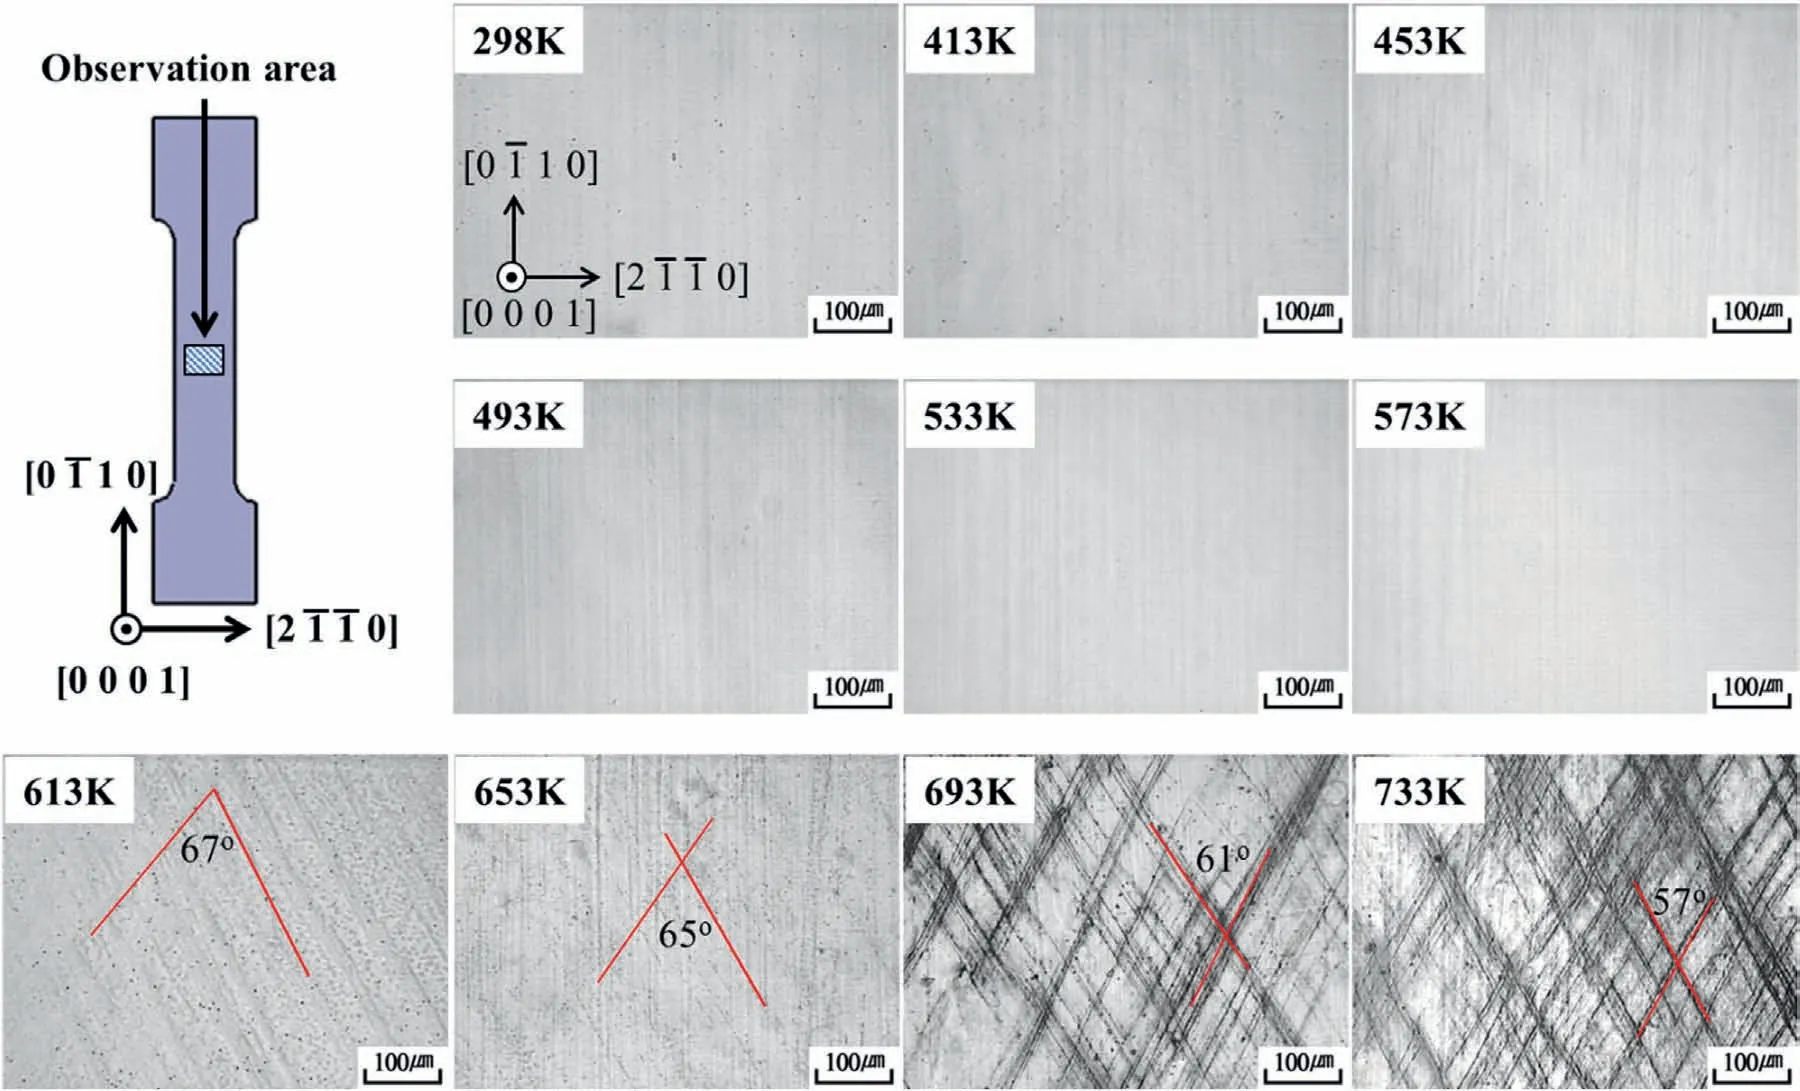
Fig.6.OM images showing microstructures of the A-type tensile specimens deformed in the temperature range RT ∼733 K.The images were taken from the (0001) plane of the 10% tensile deformed specimens.
The EBSD-IPF maps taken from (0001) plane and (0002)as well (1010) pole figures of A-type Mg single crystal after compression are shown in Fig.7.It can be seen that many twins are distributed in the microstructure of all samples.It is consistent with the flow stress curves in Fig.4 that twinning dominated deformation mechanisms during compression in A-type orientation Mg crystal specimen.According to the SF law,the variants should be {1012} tensile twins.The individua crystal orientation of the matrix and twin in RT sample are shown in right of the figure.From the (0001) pole figures and the individual grain orientation observation,the red-colored parts corresponding to the matrix parts and the blue-colored parts are confirmed to be twinned parts.These microstructures are responsible for the serration evolution in the stress-strain curves at elevated temperatures.

Fig.7.EBSD-IPF maps showing microstructures of the A-type compressive specimens deformed in the temperature range of RT ∼733 K.These images were taken from the (0001) plane of the 5% compressive deformed specimens.
Fig.8 shows the tensile curves of the B-type specimens deformed in the temperature range RT ∼733 K.The flow stresses are extremely low even at high strains.Specifically,the flow stress only reaches ∼3 MPa with 10% strain at RT.Moreover,the flow stresses do not change significantly with increasing temperatures,particularly temperatures above 493 K.Serrations on the stress-strain curves could be observed,but they occurr due to the high resolution of the testing machine.The basal slip has the highest SF value of 0.5 in this type specimen,as shown in bold value in Table 2 (SFs of various deformation modes of types B),and thus is expected to be the main deformation mode in accommodating tensile deformation.
Table 2SFs of basalslip,prismaticslip,pyramidal II
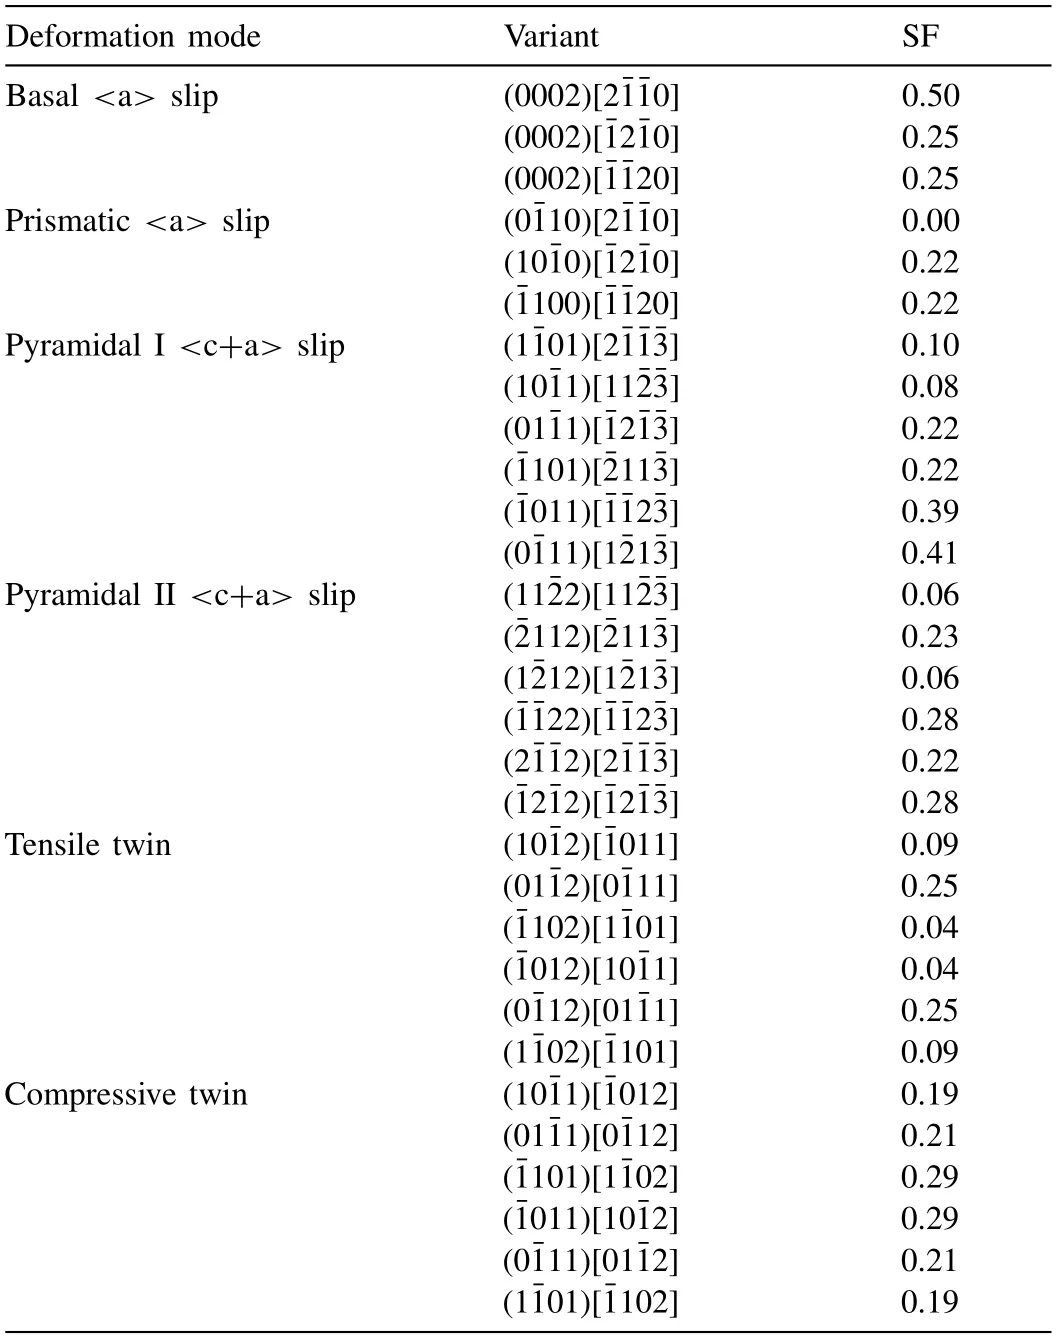
Table 2SFs of basalslip,prismaticslip,pyramidal II

Fig.8.Tensile curves of the B-type specimens deformed in the temperature range RT ∼733 K.
In order to confirm whether the basal slip is the predominant deformation mode,slip trace analysis on the (0110)surface is conducted.The deformed microstructures are directly taken without further treatments including polishing and etching,since they can remove any trace generated by slips.The surface steps can be seen clearly on the (0110) surface and they incline at an angle of 42 ∼49° with the vertical direction,as shown in Fig.9.Trace prediction on the (0110)surface for the basal slip is presented in the left corner of Fig.9.By comparison,the surface steps are demonstrated to be generated by basal slip,revealing the single basalslip is the main deformation mode to accommodate the tensile deformation.Note that the interval of the basal slip traces increases gradually from a few microns to about 35 microns with increasing the test temperature from RT to 733 K.It was reported that strain localization became more pronounced with increasing temperature in Mg–1Mn–0.7Nd alloy (wt.%) and led to an increased interval of slip traces.Therefore,the increase in the interval of the basal slip in the present study can be ascribed to the strain localization[44].

Fig.9.OM images showing microstructures of the B-type tensile specimens deformed in the temperature range RT ∼733K.The images were taken from the wide surfaces,i.e.,(0110) plane,of the 10% tensile deformed specimens.
The tensile curves obtained from the specimens with the orientation C are shown in Fig.10.The flow stresses are found to decrease considerably with increasing the test temperature.Additionally,these specimens exhibit an insignificant strain hardening except the specimen deformed at RT.To be more specific,the work hardening rate becomes zero essentially during further deformation beyond a certain strain.This critical strain gradually decreases with increasing test temperature.On the other hand,(0002) and (1010) pole figures measured by XRD show that the prismatic plane is inclined 45° and the basal plane is parallel to the tensile direction for this type of specimen.As such,the prismatic slip has the maximum SF value of 0.5 and the basal slip and the {1012} tensile twin are geometrically impossible to be operated.The variants with the highest SF for the non-basal slip and the {1011} compressive twin are highlighted in blod and italic in Table 3 and traces that can be generated by these variants on (90 330) and (0001) side surfaces are shown in Fig.11.
Table 3SFs of basalslip,prismaticslip,pyramidal II
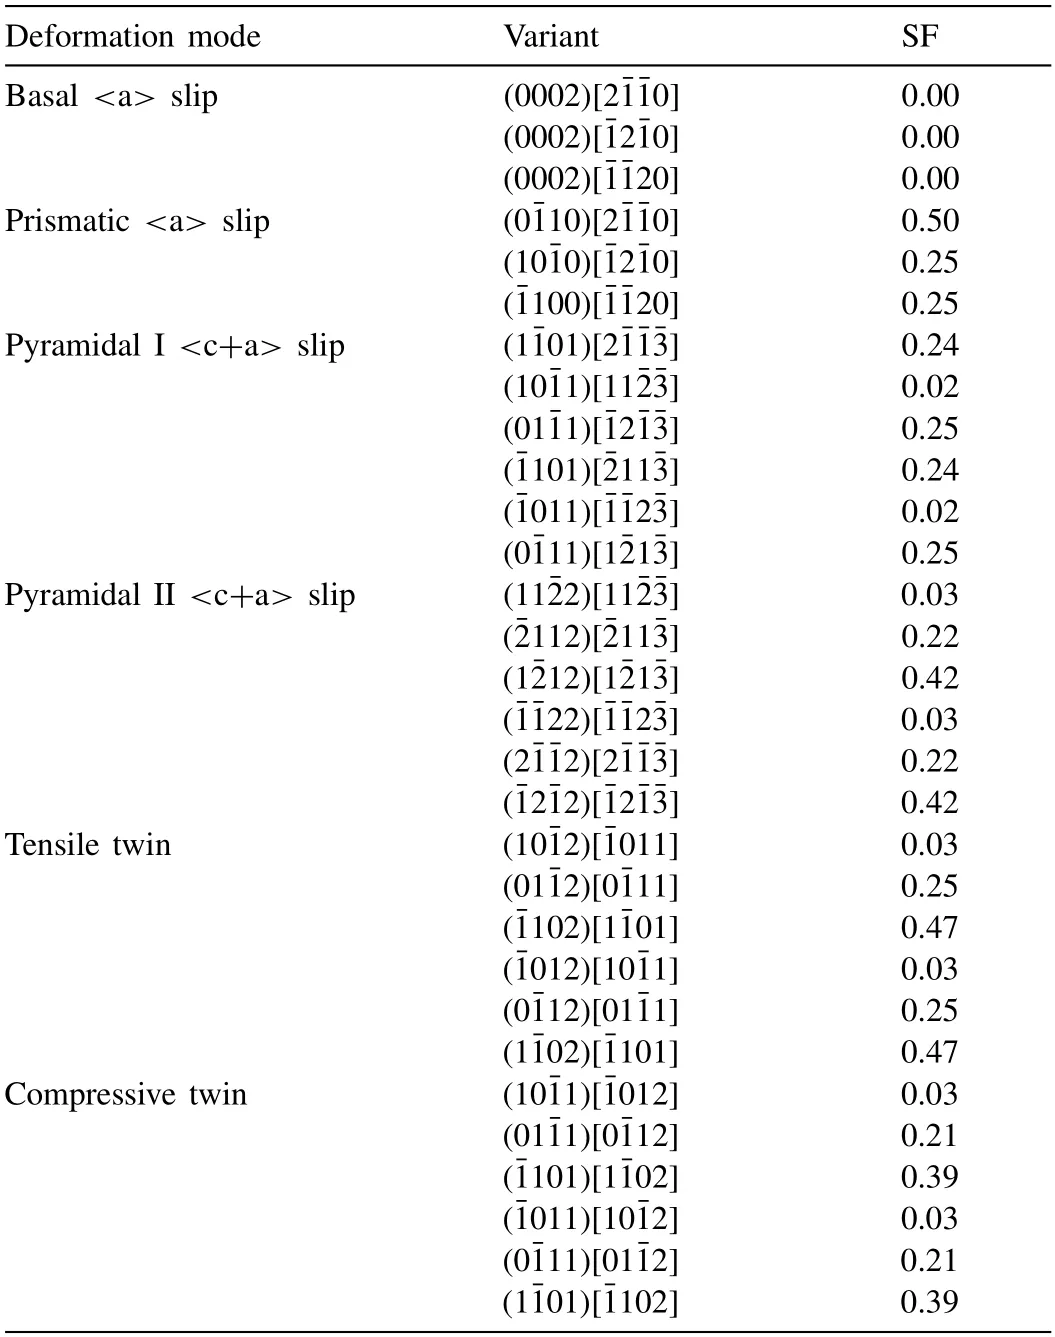
Table 3SFs of basalslip,prismaticslip,pyramidal II

Fig.10.Tensile curves of the C-type specimens deformed in the temperature range RT ∼733K.

Fig.11.Predicted traces of possibly active variants of prismatic slip,pyramidal I
Fig.12 shows the microstructures of the C-type specimens deformed in the temperature range RT ∼733 K.The observe area is shown in left of the figure.Surface steps start to appear on the (0001) surface of the 413 K deformed specimen and become obvious from that of the 613 K deformed specimen.These steps incline at an angle of 43° ∼50° with the vertical direction,which are close to the calculated angle of 45° for the prismatic slip.Therefore,the single prismatic slip is considered to be the main deformation mode in the temperature range from 413 K ∼733 K.Similar to the basalslip,the interval of the prismatic slip traces also increases gradually from a few microns to about 50 microns with increasing test temperature from RT to 733 K,which is associated with the localized strain at higher temperature.

Fig.12.OM images showing microstructures of the C-type specimens deformed in the temperature range RT ∼733K.The images were taken from the wide surfaces,i.e.,(0001) plane,of the 10% tensile deformed specimens.
To confirm the deformation mechanism responsible for the RT deformed C-type specimen,its microstructure is further characterized by TEM.Fig.13 shows images taken with an incident electron beam direction of <1120>under the twobeam diffraction condition using reflections of g=0002,g=0110,and g=0111,respectively.Based on the g.b criterion [45–47],dislocations having the type Burgers vector are out of contrast,and only the

Table 4The g .b values for perfect dislocations in magnesium.

Fig.13.Bright-field TEM images showing the microstructure of the RT deformed C-type specimen,where these images were taken under the two beam condition using diffraction vector of g=0002,g=0110 and g=0111.
3.2. Derivation of CRSS of major deformation modes in Mg using VPSC model and Schmid’s law
Since the duplex slip occurred in the tensile tested Atype specimen,SF criterion cannot be used to derive CRSSs.Therefore,VPSC-GA simulations were carried out using the tensile curves obtained from the A-type specimens.In order to obtain more accurate CRSSs,the compressive and tensile curves are simulated simultaneously.Fig.14 shows a comparison of the theoretically simulated and measured true stressstrain curves.The area marked by square in Fig.14(a) is enlarged and shown in Fig.14(b).The simulated curves are found to be in good agreement with the experimental curves.The CRSSs and other Voce hardening parameters determined by fitting the tensile and compressive curves are listed in Table 5.By using these parameters,a comparison between the experimentally measured response (full line) and the fit produced by the model (dotted line) is plotted as a function of temperature in Fig.15.At RT,basal slip and {1012}tensile twinning have much lower CRSSs compared to other deformation modes.Thus,basal slip and {1012} tensile twin generally act as predominant deformation modes to accommodate the plastic deformation of Mg and its alloys at RT.With increasing the temperature,the CRSSs of basalslip and {1012} tensile twin are found to be insensitive to the test temperature.In contrast,the CRSSs of prismatic,
Table 5CRSS and Voce hardening parameters of basal slip,prismatic slip,pyramidal II
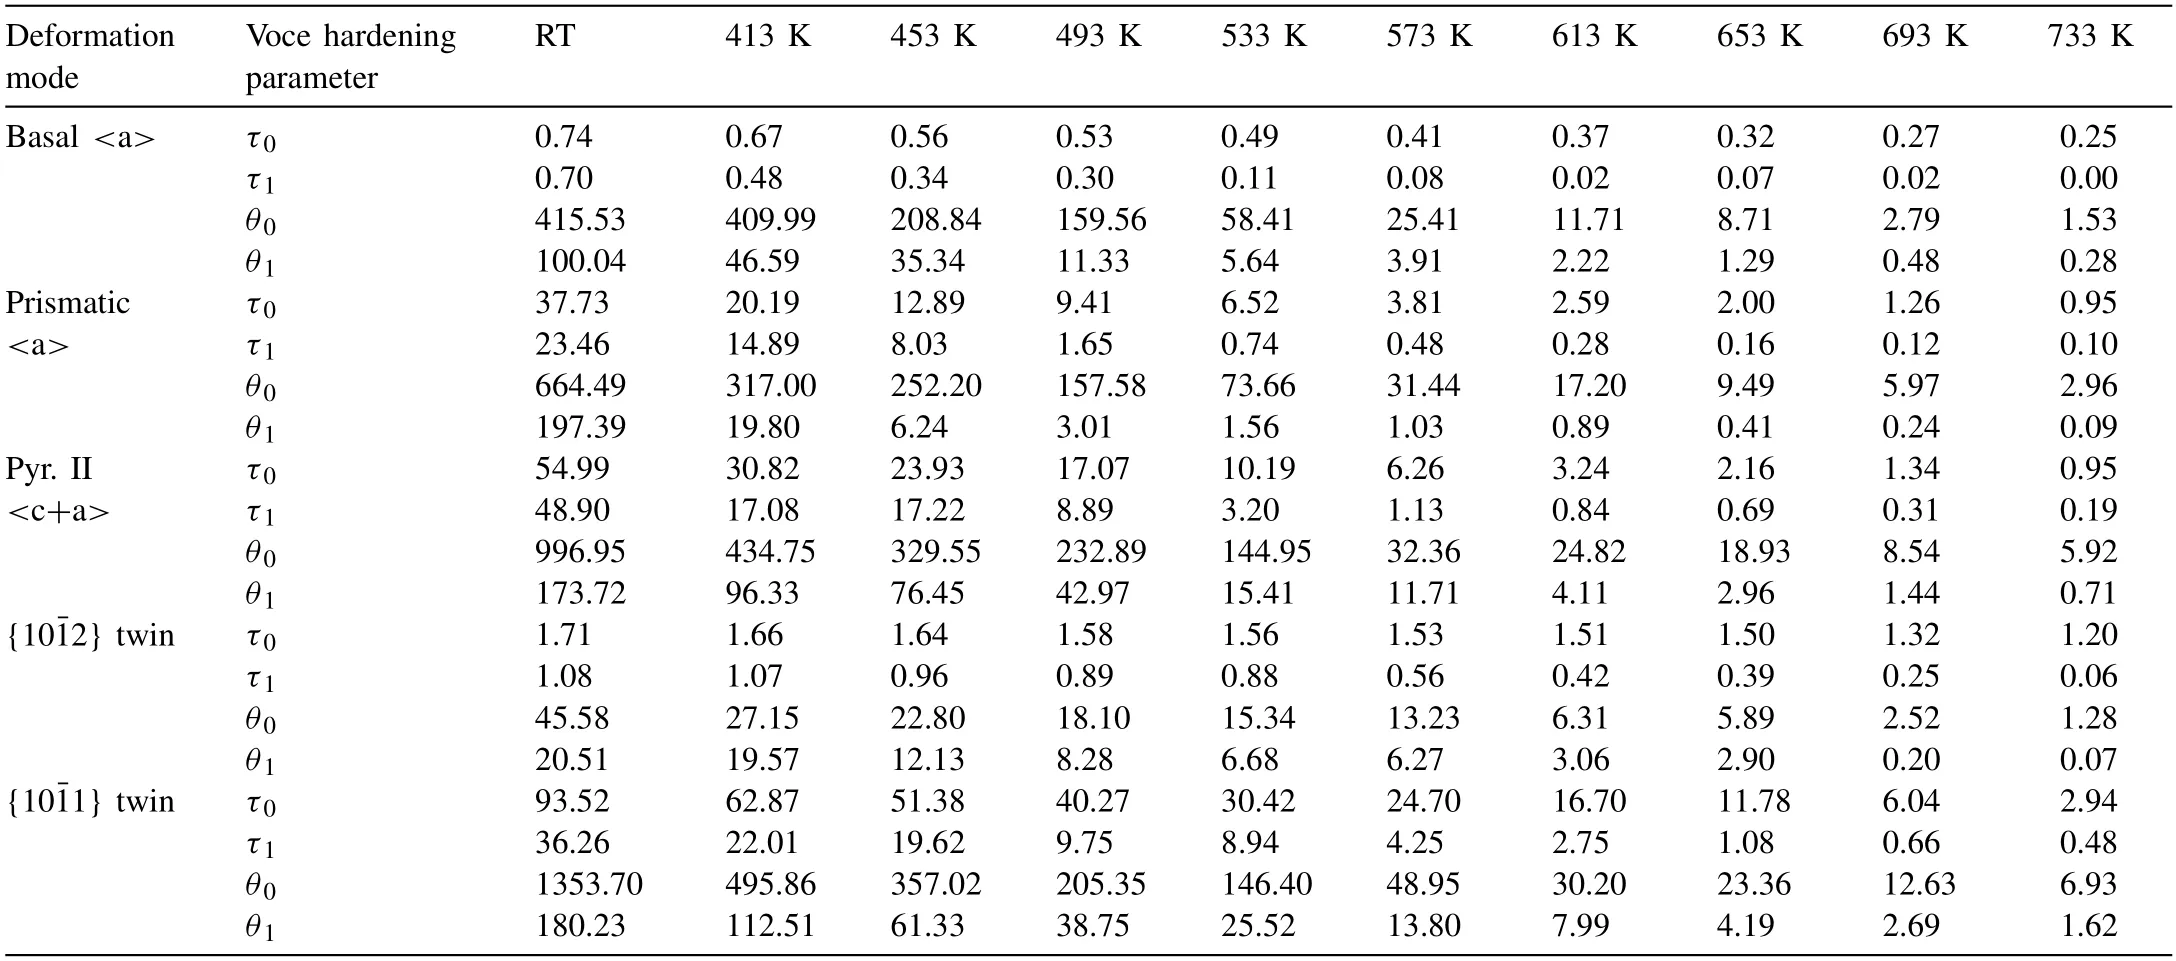
Table 5CRSS and Voce hardening parameters of basal slip,prismatic slip,pyramidal II

Fig.14.(a) Measured and simulated stress-strain curves of the A-type specimens,and (b) the enlargement of the area marked by square in Figure 14(a).
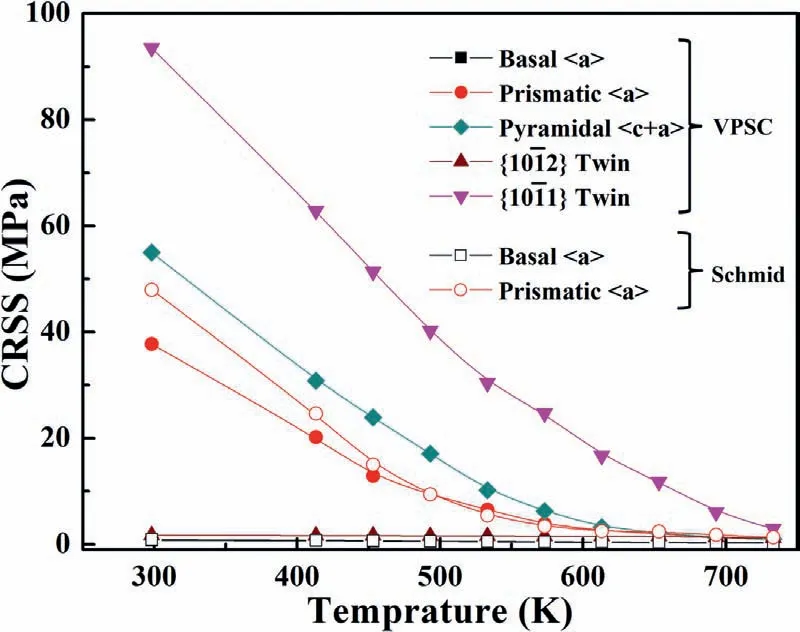
Fig.15.CRSSs of basal slip,prismatic slip,pyramidal
The tensile specimens with orientation B and C are confirmed to be mainly deformed by the single basal slip and the single prismatic slip,respectively.As such,the Schmid’s law,i.e.τc=σycosΦcosλcan be used to derive the CRSS values for the single slip condition,whereτcandσyare the CRSS and the 0.2% proof yield=stress,respectively.Φis the angle between the loading direction and the slip (twin) plane normal andλis the angle between the loading and the slip (twinning) direction.The CRSSs of the basal slip and the prismatic slip are derived using the Schmid’s law and also plotted in Fig.15.Similar with the VPSC-GA simulation results,the basal slip shows a much lower CRSS at RT compared to the prismatic slip.Moreover,the CRSS of the former is found to be insensitive to the test temperature,while the latter exhibits a strong temperature dependency.
Fig.16(a) and (b) show the evolution of the relative activities of basal slip,prismatic slip,pyramidal II

Fig.16.Relative activities of basalslip,pyramidalslip,pyramidal

Fig.17.Comparison of the CRSS values between a present work and previously published data;(a) basal slip,(b) prismatic slip,(c)
3.3. Comparison of CRSSs obtained from the present study and previously reported data
The CRSSs of major deformation modes obtained from the present study are compared with the results previously reported.Figs.17(a)-(e) show the comparison results of basalslip [17,25,29],prismatic slip [16,18,29,52],pyramidal II
4.Conclusions
Magnesium single crystal specimens with three different orientations have been tested over a wide temperature range from RT ∼733K to systematically evaluate the effect of temperature on the CRSSs of various slips and twinning modes.Viscoplastic self-consistent simulations with GA code were carried out to derive CRSSs of basalslip,prismaticslip,pyramidal II
Declaration of competing interest
The authors declare that they have no known competing financial interests or personal relationships that could have appeared to influence the work reported in this paper.
Acknowledgements
This work was supported by the Ministry of Science and Higher Education of the Russian Federation for financial support under the Megagrant (no.075-15-2022-1133) and the National Research Foundation (NRF) grant funded by the Ministry of Science and ICT (2015R1A2A1A01006795) of Korea through the Research Institute of Advanced Materials.
 Journal of Magnesium and Alloys2023年6期
- Journal of Magnesium and Alloys的其它文章
- Carbon nanotube and graphene reinforced magnesium matrix composites:A state-of-the-art review
- Stress corrosion cracking of magnesium alloys: A review
- Simultaneous enhancement of mechanical properties and corrosion resistance of as-cast Mg-5Zn via microstructural modification by friction stir processing
- Effect of wire-arc directed energy deposition on the microstructural formation and age-hardening response of the Mg-9Al-1Zn (AZ91) alloy
- Regulating local coordination environment of Mg-Co single atom catalyst for improved direct methanol fuel cell cathode
- Hydrogen-induced optical properties of FC/Pd/Mg films: Roles of grain size and grain boundary
