
Temporal and spatial variation of cloud cover in arid regions of Central Asia in the last 40 years
2023-08-29 03:38:36KaiLiangZhaoGuoFengZhuLiYuanSangJiaWeiLiuLeiWangYuWeiLiuYuanXiaoXuXinRuiLinWenHaoZhangLinLinYe
KaiLiang Zhao, GuoFeng Zhu,*, LiYuan Sang, JiaWei Liu, Lei Wang,YuWei Liu, YuanXiao Xu, XinRui Lin, WenHao Zhang, LinLin Ye
a College of Geography and Environmental Science, Northwest Normal University, Lanzhou, Gansu 730070, China
b Shiyang River Ecological Environment Observation Station, Northwest Normal University, Lanzhou, Gansu 730070, China
c Lanzhou Sub-Center, Remote Sensing Application Center, Ministry of Agriculture, Lanzhou, Gansu 730000, China
Keywords: Central Asia Cloud cover Temporal and spatial changes Cloud type frequency
ABSTRACT Water resources are one of the key factors restricting the development of arid areas,and cloud water resources is an important part of water resources.The arid region of central Asia is the core region of the current national green silk road construction,and is the largest arid region in the world.Based on cloud cover data of ECMWF,the current study analyzed temporal and spatial characteristics of cloud properties in arid regions of Central Asia between 1980 and 2019.Our findings show that: (1) From the point of view of spatial distribution, total cloudiness in arid regions of Central Asia was low in the south and high in the north.The distribution of high cloud frequency and medium cloud frequency was higher in the south and lower in the north, while low cloud frequency distribution was low in the south and high in the north.(2) In terms of time, the variation of cloud cover and cloud type frequency had obvious seasonal characteristics.From winter to spring, cloud cover increased, and the change of cloud type frequency increased.From spring to summer, cloud cover continued to increase and the change of cloud type frequency increased further.Cloud cover began to decrease from summer to autumn, and the change of cloud type frequency also decreased.(3) Generally, average total cloud cover decreased in most of central Asia,and high and medium cloud cover increased while low cloud cover decreased.This study provides a reference for the rational development of cloud resources in the region.
1.Introduction
Clouds play a critical role in atmospheric and water cycles,and cloud cover changes associated with climate change remain one of the most challenging aspects of predicting future climate change (Mishra, 2019).Cloud cover plays an important role in the global energy balance and water cycle (Wild et al., 2014), it regulates the radiation balance of the atmospheric system,and plays an important role in heat exchange and in the water cycle (Niu et al., 2012).As one of the main parameters of the climate system,the change in cloud cover can affect the climate system to a great extent.Their formation and change characteristics are the result of a combination of various ground and atmospheric dynamics and thermal processes.Clouds play a vital role in the ground-air system,regulating the balance of radiative energy and moisture circulation,and are one of the critical factors to be considered in climate simulations and future climate change projections (Ramanathan et al., 1989; Houghton et al.,2001;Ma et al.,2017).Cloud cover,temperature,and precipitation are important for weather and climate parameters(Lin et al.,2002).Also,there is a link between cloud mass and solar radiation.Clouds have an important influence on climate change and atmospheric radiative transfer.Solar radiation is the most basic and important energy source at the surface and is the primary driver of terrestrial processes such as photosynthesis, transpiration, and soil evaporation in plants (Liu et al.,2009;Wang et al.,2021),and the basis for the formation and change of weather and climate(Xu,2013).The arid area in Central Asia is located deep inland and is a typical arid area in the world.Therefore, a comprehensive understanding of the distribution and change of clouds is particularly important to evaluate the role of clouds in climate change.
Some scholars have analyzed cloud characteristics of global and other regions using cloud data from weather forecasting centers and satellite remote sensing data.The global total cloud cover distribution is mainly determined by mean atmospheric circulation and distribution of land and sea, and the result shows a decreasing trend (Ding et al., 2005).One scholar used Climate Forecast System Reanalysis (CFSR) information to analyze the average distribution of global total cloud cover and low,medium,and high clouds and their variation with latitude from 1979 to 2009.This study concluded that total global cloud tends to decrease and then increase significantly over time, with an increasing trend for both high and low clouds and the opposite for medium clouds (Xiang et al.,2014).The total global ocean cloud amount remained stable from 1950 to 2010 (Warren et al., 1988) and increased significantly in North America,eastern Asia,and western Europe(Angell et al.,1984;Karl and Stewrer,1990;Ann Henderson-sellers,1991).Wang et al.(2014)studied cloud volume changes in Central Asia,and the results show that the cloud volume in Central Asia is generally non-stable and shows a general downward trend.Yang et al.(2020) used Himawari-8 to study the seasonal, monthly, and daily cloud cover variations in four typical areas of Northwest China, North China, Southeast China, and the Qinghai-Tibet Plateau.The results show that cloud cover occurred most frequently in spring and summer.Due to the inconsistency of different research topics,data sources, and time scales, it is challenging to understand cloud coverage in a given region.In addition, some studies have shown that global warming has increased since 1980.Meanwhile, some scholars have used satellite data to study the distribution characteristics of clouds.A recent study further investigated the spatial and temporal variation of clouds over the Mongolian Plateau(MP)based on MODIS data and found that the maximum total cloud coverage is in summer (Bao et al., 2018).Using the Himawari-8 cloud product,Yang et al.(2020)investigated the seasonal,monthly,and daily variations as well as the spatial and vertical distributions of cloud properties over four typical regions in the northwest (NW), north (N), southeast (SE), and the Tibetan Plateau (TP) of China.The results showed that the cloud occurs most frequently in spring and summer,and the seasonal average cloud top height(CTH)has clear seasonal differences while the cloud top temperature(CTT)is negatively correlated with CTH (Yang et al., 2020).However, satellite data are constrained by factors such as low resolution and small time span, and have large uncertainties.
This study uses high,low,medium and total cloud data from 1980 to 2019 from the European Centre for Medium-Range Weather Forecasts(ECMWF) Central Asian Arid Zone Observatory to analyze the spatial distribution, seasonal variations and annual trends of total clouds and different cloud types in the Central Asian arid zone.We also discuss the characteristics of local cloud water resource changes and solar radiation changes due to cloud cover changes.This study can quantify temporal and spatial changes of cloud cover in the arid region of Central Asia,analyze the relationship between climate change and cloud cover, and provide scientific support for the evaluation of the development potential of cloud cover in the arid area of Central Asia and the rational development and utilization of cloud cover.
2.Materials and methods
2.1.Study area
The arid zone of Central Asia(34°34′N–55°43′N,46°48′E–106°98′E)is located north of the Hindu Kush Mountains, Pamir Plateau, Kunlun Mountains, Altun Mountain, Qilian Mountains,south of the Ural Mountains, Western Siberian Plain, Altai Mountains, east of the Volga River,and west of the Helan Mountains and Using Mountains(Fig.1).The main topography is a plateau and hilly area,which is high in the southeast and low in central and northwest.As the largest non-zonal arid zone globally,the region is mainly controlled by the mid-latitude westerly circulation.Therefore climatic characteristics here are significantly different from those of the Asian monsoon region (Chen et al., 2008).Climate of the region is typically temperate continental, characterized by low rainfall and extreme aridity.It is also the most dominant oasis agricultural and landscape distribution area in the world,with significant water resource variability and fragile oasis ecosystems,and therefore sensitive to global change response(Chen et al.,2019).
2.2.Data sources and statistical analysis
This paper used the new generation monthly ERA5 reanalysis data released by the European Numerical Forecasting Center (ECWMF) with global resolution.ECMWF is based on its prediction model and data assimilation system to"reanalyze"archived observations,thus creating a global data set describing the recent history of atmosphere, land, and ocean.The accuracy of the data was improved by making full use of the four-dimensional assimilation system.Compared with satellite data,ERA5 data has characteristics of higher resolution and longer time span.In recent years,the performance of ERA5 numerical prediction products has been generally recognized (Pan et al., 2013), and it has also been adopted to study water vapor transport(Xie et al.,2018)and cloud water content distribution (Liu et al., 2018a,b) in summer on the plateau and surrounding areas.Total cloud volume(TCC),high cloud volume(HCC),medium cloud volume (MCC), and low cloud volume (LCC) data from January 1980 to December 2019 were used for the analysis.
According to the number of clouds that obscure the view of the sky,the amount of cloud cover is classified into the following levels:0 means no clouds, 1 means full clouds, and the range of cloud cover is 0–1.We also categorized clouds into low, medium, and high clouds based on cloud height, where low clouds refer to clouds below 2 km, medium clouds are 2–4 km in height,and high clouds are 3–8 km in height.Cumulative statistics were obtained by averaging past annual statistics.Annual statistics were obtained by averaging each month of the year.Monthly averages are obtained by daily averages.Seasonal division adopts the meteorological division method: spring in March, April and May, summer in June, July and August, autumn in September, October and November,and winter in December,January and February.After the trend analysis,we then analyzed the temporal variation of the total cloud amount.
3.Total cloud characteristics of the Central Asian arid zone
3.1.Seasonal average and annual average distribution of total cloud cover
The seasonal distribution of total cloud cover in the arid zone of Central Asia is presented in Fig.2.The distribution of cumulative annual mean total cloud cover was less in the south and more in the north(Fig.2e).In spring, the high cloud area is mainly concentrated in northern Kazakhstan,with a value of more than 40%,while arid southern Xinjiang and eastern Gansu are low cloud areas,with a value of less than 10%(Fig.2a).In summer,cloud cover decreased throughout the region,with the most pronounced decrease in northeastern Kazakhstan, which was one reason for the hot and dry summer climate in the arid zone(Fig.2b).In autumn,compared to summer,the cloud cover increased in the northern region and the extent of the less cloud area decreased in the south.The total cloud cover shifted to the northwest and southeast(Fig.2c).In winter,the highest cloud values were found in northern and northwestern Kazakhstan.The lowest cloud values occurred in arid regions of Xinjiang and Gansu (Fig.2d).The above analysis shows that although both the total cloud cover and annual average total cloud cover were less in the south and more in the north,there was a clear seasonal divergence,with a consistent distribution of cloud high-value centers in spring and autumn,and an opposite distribution in winter and summer.The cloud frequency gradually increased from winter to summer and decreased from summer to autumn (Fig.3).The distribution of total cloud cover in the arid zone was less in the south and more in the north,among which annual average clouds in the northeast were the most,above 80%;the least in the southwest,below 40%(Fig.2e).This region is affected by water vapor from the Siberia Plain,and when it confronts the mountains,the windward slope airflow rises to form higher cloud cover.
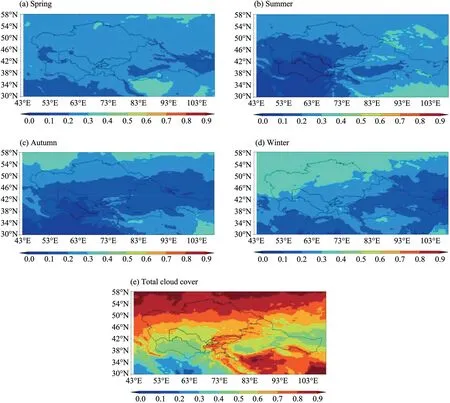
Fig.2.The cumulative annual average total cloud cover and seasonal distribution in the arid region of Central Asia from 1980 to 2019.

Fig.3.Temporal variation of cumulative annual total cloud cover and seasonal total cloud cover in the arid region of Central Asia between 1980 and 2019.
3.2.Time distribution of total cloud amount
3.2.1.Seasonal time distribution of total cloud coverage from 1980 to 2019
Cloud variability in the arid zone is characterized by significant interannual variability but has an overall decreasing trend.The variation was small until 1994,rising to the highest value of nearly 60%from 1996 to 2006 and showing a fluctuating decreasing trend after 2006, but overall cloudiness was around 50%(Fig.3a).
3.2.2.Interannual variation in seasonal total cloud cover during 1980–2019
The 40-year seasonal total cloud cover in the arid zone show distinct interannual variability.The interannual fluctuation range of spring total cloud cover was large, especially around 2000, with an overall upward trend (Fig.3b).Compared to spring, summer total cloud cover shows a smaller fluctuation range,which fluctuated smoothly from 1990 to 2012 and decreased from 2012 to 2019(Fig.3c).Both interannual fluctuations of total cloud cover in autumn and winter were a relatively smooth downward trend, with the former showing the greatest fluctuation around 2000 and the latter around 1985(Fig.3).
3.3.Cloud properties
3.3.1.Spatial distribution of cumulative cloud types
The distribution of high cloud frequency in the arid zone was low in the west and high in the east(Fig.4a),and the centers of high values were in the southeastern part of the arid zone of Xinjiang and Gansu,with the highest values exceeding 60%.The low-value centers were in the southern region of south and Xinjiang Tajikistan in the arid zone,and the lowest value was less than 20%.It can be seen from the medium cloud frequency distribution map(Fig.4b)that cloud frequency distribution in Central Asia was characterized by high in the south and low in the north.The high value was centered in eastern Tajikistan and southern Xinjiang in the arid zone,with the maximum value exceeding 85%.In contrast,the low value was centered in western Turkmenistan and southwestern Kazakhstan,with the minimum value not exceeding 20%.The low cloud frequency distribution in Central Asia show low south and high north(Fig.4c).The center of high importance was located in the north of Kazakhstan,with a maximum value of over 50%.The low-value centers were located in northern Tajikistan, southeastern Kazakhstan, northern Xinjiang and Gansu,with the lowest value of less than 10%.

Fig.4.Cloud-type frequency distribution in the arid region of Central Asia.
3.3.2.Spatial distribution of seasonal cloud types
The frequency distribution of high clouds in the arid zone was high in the south and low in the west in all seasons(Fig.5).In spring,low-value centers in north-central Kazakhstan were less than 20%.The high-value centers were in southeastern Kazakhstan, western Xinjiang, western Gansu, and central Kyrgyzstan, where the values were above 30%(Fig.5a).In summer,the range of high-value centers narrowed while the low-value center expanded.The high-value center was in the eastern part of Kazakhstan,with a value exceeding 35%.The low-value centers were in Turkmenistan and southern Tajikistan, with values less than 5%(Fig.5b).In autumn, the range of the low-value region expanded while the high-value region narrowed,with the center of the high-value located in central Turkmenistan and most of Xinjiang and Gansu,where its value exceeded 20%, and the center of the low value located in southern Tajikistan, where its value was less than 5% (Fig.5c).In winter, highvalue centers were found in eastern Kazakhstan, southern Tajikistan,western Xinjiang, and western Gansu, with a maximum high cloud frequency of more than 30%,and southern Tajikistan was a low cloud frequency region with a minimum value of less than 5%(Fig.5d).
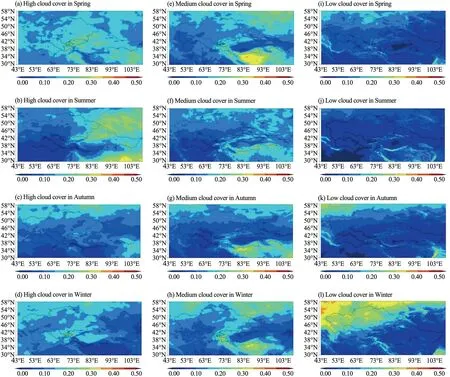
Fig.5.Distribution of high, medium and low cloud frequency in the arid region of Central Asia.
From the distribution map of cloud frequency in arid areas(Fig.5),it can be seen that in the spring in Turkmenistan and southern Tajikistan,the center of the high value of cloud frequency was more than 30%,and the cloud frequency reached the lowest in some areas of Kyrgyzstan with values less than 5% (Fig.5e).In summer, the area of high values of medium cloud frequencies expanded.In Turkmenistan, Tajikistan and parts of Xinjiang, high-value centers had values exceeding 30%, and in eastern Kazakhstan and parts of western Turkmenistan,the centers of low values were less than 5%(Fig.5f).In autumn,Xinjiang's southern part is the center of high values that reached 20%.The eastern part of Turkmenistan and the eastern part of Gansu centered on low values of less than 5% (Fig.5g).Winter in southern Tajikistan and southern Xinjiang,the centers of high mid-cloud frequency had values exceeding 30%.At the same time,in southwestern Kazakhstan and northern Uzbekistan,the centers of low mid-cloud frequencies had values less than 5%(Fig.5h).
From the map of low cloud frequency distribution(Fig.5),low values of low cloud frequency were observed in all seasons.In spring (Fig.5i),there were small areas with high values of low cloud frequency centers in the north of Kazakhstan,which exceeded 20%,and most of the remaining areas had low-value centers with a value of less than 5%.In summer(Fig.5j), some areas in southern Xinjiang had high values of over 20%,and the remaining areas had low values of less than 5%.In autumn(Fig.5k),Kazakhstan's north-central region was the center of high values,which exceeded 20%.At the same time, in Turkmenistan, Uzbekistan,Xinjiang,and most of Gansu had centers of low values of less than 5%.In winter, central and northern Kazakhstan are high-value centers, with a value of up to 35%,and China's Xinjiang and Gansu regions are low-value centers,with a value of less than 5%.
3.3.3.Time evolution characteristics of cloud types
As indicated in the graph of temporal changes of high,medium,and low cloud cover in the arid region of Central Asia (Fig.6), the interannual variation of high cloud cover was obvious, with a general upward trend.From 1980 to 1988, the cloud amount increased rapidly and reached 37.4% in 1988.After that, it decreased significantly and then fluctuated again, reaching its peak in 2006 at 39.5%.It steadily increased to roughly 35%after 2010.The amount of medium cloud was generally on the rise.From 1980 to 2004, the cloud amount rose the fastest,reaching 35.8%in 2006.After 2006,volatility decreased,but it fluctuated around 30%.
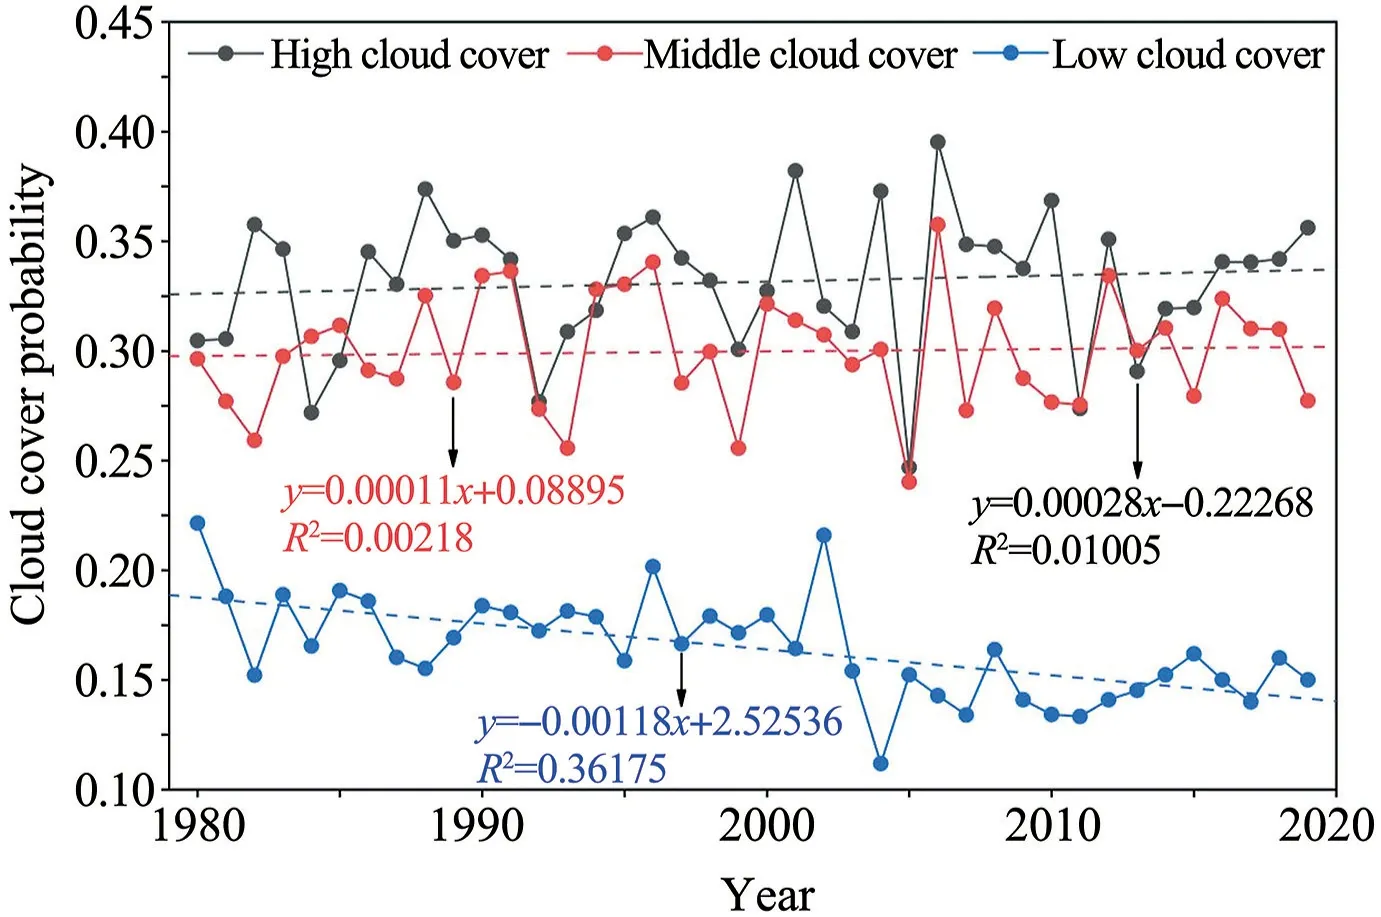
Fig.6.Temporal changes of high, medium and low cloud cover in the arid region of Central Asia between 1980 and 2019.
Low cloud cover shows a decreasing trend.Before 2002, medium cloud cover fluctuated and decreased;a peak of 21.6%occurred in 2002,and after 2002,it started to decrease more significantly and dropped to a minimum of 11.2%in 2004.Low cloud cover frequency was lower than medium and high cloud cover.
4.Discussions
4.1.Impacts of cloud cover on precipitation and assessment of cloud water resources
Precipitation in the arid zone of Central Asia is mainly influenced by water vapor caused by the prevailing westerly winds in the Atlantic Ocean (Liu et al., 2014, 2018), but airborne cloud water resources are scarce due to the deep inland location.Clouds are very closely related to precipitation, and they play an important role in the water cycle of the climate system.Therefore atmospheric precipitation is an important source of sustainable use of water resources.As a potential water resource, air cloud water resources have the potential value to alleviate water shortage.The formation and evolution of clouds and their global distribution are the pooled results of the interaction of dynamic,thermal,and microphysical processes.It not only determines changes in the climate state of variables such as temperature, water vapor,and precipitation but is also affected by these and other climate factors(Zhang et al.,2011).Water vapor resources cannot be directly utilized,but the product of its condensation, cloud water, is the resource that can be utilized.It was found that distribution characteristics of total cloud amount, medium cloud amount, and low cloud amount are consistent with distribution characteristics of water vapor content, and distribution characteristics of high cloud amount and water vapor content are quite different.Therefore, total cloud amount, medium, and low cloud cover are closely related to water vapor content.Thus,research on cloud cover and water resources is of great strategic significance for the rational and full development and utilization of cloud water resources in arid areas and for ensuring the safety of regional water resources.
4.2.Effect of cloud cover on regional solar radiation
Solar radiation is not only an important source of energy for physical,chemical and biological processes at the Earth's surface, but also an important parameter in hydrological and water quality models,ecosystem models and biophysical modeling studies(Yang et al.,2013).Mefti et al.(2008)used a new satellite-based model,SICIC,to provide a reasonable estimate of the hourly global solar radiation flux for each location shown in meteorological satellite images.SICIC is a model developed by processing collected high-resolution visible meteorological satellite images and ground-based solar radiation flux measurements.Numerous studies have demonstrated that the thicker the cloud layer and the more cloud cover, the weaker the total radiation.This is mainly because more cloud cover and the thicker the cloud cover,the weaker the direct radiation(Dudek,1996;Zhang et al.,2010;Benedict et al.,2020).Therefore, clouds significantly influence total solar radiation reaching the ground,and the variation of solar radiation due to clouds'spatial and temporal variation cannot be ignored.Understanding clouds'spatial and temporal distribution and their influence on solar radiation at the surface is very important for estimating solar radiation.
5.Conclusions
This study used ERA5 reanalysis data to analyze the temporal and spatial distribution, annual average, and seasonal average distribution characteristics of cloud cover in arid regions of Central Asia from 1980 to 2019.The results show that:
(1) In the past 40 years, the spatial distribution of annual average total cloud cover in Central Asia's arid zone has shown a trend of less in the south and more in the north.Parts of northern Kazakhstan have cloudy centers with annual average total clouds above 70%; low-value centers in Turkmenistan, Xinjiang, and Gansu regions of China have middle yearly clouds below 40%.
(2) The variation of cloud cover in the arid zone of Central Asia had prominent seasonal characteristics.The cloud amount continued to increase from winter to spring to summer and gradually decreased from summer to autumn.The centers of high cloud cover values in winter and autumn were generally consistent,and the centers of high values of cloud cover in spring and summer did not overlap.The high-value centers of cloud cover moved to the southeast in spring and to the southwest in summer.
(3) The high cloud frequency distribution in Central Asia's arid zone was "high in the south and low in the north," while low cloud frequency distribution was the opposite.The center of both high and low values of medium cloud frequency was in the southern part of the arid zone.Cloud frequency variation also had obvious seasonal characteristics, increasing frequency from winter to spring,greater frequency from spring to summer,and decreasing frequency from summer to autumn.
(4) Most of the arid regions in Central Asia show a decreasing trend in total annual mean cloud cover.High cloud cover show an increasing trend, medium cloud cover show a rising trend, and low cloud cover show a decreasing trend.
Acknowledgements
This research was financially supported by the National Natural Science Foundation of China(41867030, 41971036), the National Natural Science Foundation innovation research group science foundation of China (41421061).The authors thank the aforementioned institutions for valuable financial support.
 Sciences in Cold and Arid Regions2023年2期
- Sciences in Cold and Arid Regions的其它文章
- Long-term feeding of sand rice (Agriophyllum squarrosum seed) can improve the antioxidant capacity of mice
- Relationships between modern pollen and vegetation and climate on the eastern Tibetan Plateau
- Ecosystem changes revealed by land cover in the three-river headwaters region of Qinghai, China (1990–2015)
- Parameter sensitivity analysis for a biochemically-based photosynthesis model
- Editor-in-Chief Yuanming Lai
- Experimental study on mechanical and frost heave behaviors of silty clay improved by polyvinyl alcohol and polypropylene fiber