Frequency domain analysis of pre-stressed elastomeric vibration isolators
S.Somnth ,R.Mrimuthu ,Shnkr Krishnpilli
a Indian Space Research Organisation, Anthariksh Bhavan, New BEL Road, Bengaluru, 560231, India
b STR/VSSC, Indian Space Research Organisation, Thiruvananthapuram, 695022, India
c Department of Mechanical Engineering, IIT Madras, Chennai, 600036, India
Keywords:Elastomer Isolator Axi-symmetric Frequency Random Response Strain amplitude Complex modulus Transmissibility
ABSTRACT Two types of elastomeric vibration isolators used for equipment vibration isolation in aerospace vehicles are considered for the present study.These isolators are constructed using elastomers mounted in steel encasings.These isolators are initially deformed statically and dynamic loads are applied on the deformed configuration.To capture the static deformation,equivalent static load corresponding to its load rating and specified displacements are created.Static deformation is computed using Finite Element methods with four node axi-symmetric element which include the geometric non-linear effect for steel and with standard Yeoh hyper-elastic material model for elastomers(Muhammed and Zu,2012)[1].Yeoh material constants are derived from uni-axial tension test data of the elastomer specimen.These isolators are subjected to harmonic and random excitations in the pre-deformed state.For numerical analysis,elastomeric constants at dynamic conditions are obtained as complex function of frequency using Dynamic Mechanical Analyzer (DMA) for a range of frequencies.The standard material model of Yeoh is modified incorporating frequency dependant material characteristics and damping in the range of frequencies of interest.A multiplicative non-separable variables law is derived for Yeoh material model to include the effect of static pre-stress,based on the methodology given in literature(Nashif et al.,1985;Beda et al.,2014)[2,3].The modifications of Yeoh model suitable for frequency domain analysis is the novelty in the present study.In the analysis,while dynamic loads are applied,the configuration is updated considering initial static loading.The frequency response of the isolators is computed using material properties evaluated at progressive dynamic strains until a match in natural frequency is observed.Appropriate damping corrections are then incorporated to match the test observed transmissibility.Then updated material properties are used to compute the random response which showed good agreement with results of experiments,validating the approach taken for the development of this model.
1.Introduction
Rubber based vibration isolators play an important role in vibration control,and have been widely used in machine components for their low stiffness and suitable damping properties at relatively low costs.They have been employed in numerous applications including aerospace,civil and railway structures,automotive parts[4,5] and seismic load mitigation [6].Rubber-based vibration isolation systems being passive in nature,are less complex,cheaper and easier to manufacture than their active counterparts.Rubbers are essentially long chain molecules or polymers,and exhibit elastic behavior.Hence,the term ‘Elastomer’ is used synonymously with rubber [7].Elastomers generally exhibit large deformations when subjected to large quasi-static loads,which exceed linear elastic theory,and also stress softening [8].In addition,elastomers also exhibit loss of stiffness under the effect of cyclic loading,due to which the stress-strain curve of an elastomer varies after each cycle of loading.This is called the Mullins effect[9].Den Hartog[10]was one of the first researchers to suggest the use of isolators,absorbers and Dampers for vibration isolation.Finite element method plays an increasingly important role in the design of such isolation systems.Due to their behavior,Non-linear finite element method is required to perform a computational analysis of components containing elastomers [1,11-17].Over the years,many hyper-elastic material models have been formulated to model the large deformation characteristics of elastomers.These models define the strain energy density for an elastomeric material in terms of the strain invariants and material constants [18-21].In the present study,the Yeoh hyper-elastic material model is used to represent the rubber material.Finite element formulation for hyper-elastic material is represented through Total Lagrangian (TL) or Updated Lagrangian (UL) frame of reference.In TL formulation,the deformation is always with respect to the original undeformed configurations.The stress and strain measures are computed with reference to undeformed frame,which can be transformed to the present deformed configuration using continuum mechanics principles.UL formulation is derived with respect to previously converged deformed configuration.Mathematically both the formulations are equivalent and used depending upon convenience.Presently TL formulation is considered to study the non-linear static deformation of the isolator.
The dynamic properties of elastomers are seen to depend highly on the frequency of excitation,temperature and strain amplitude.Many experimental studies have been conducted to study this dependence and have been well documented,for example,by De Wilde et al.[22] and Jurado et al.[23].Elastomers exhibit a combination of viscous fluid behavior and elastic solid behavior,termed as visco-elasticity.Visco-elastic materials show a time-dependent behavior where the applied load does not cause an instantaneous deformation,but there is a time lag between the application of load and the resulting deformation.This behavior is modelled mathematically using different approaches,the simplest among which,is to represent the constitutive relation as a combination of several spring and dashpot elements connected in series and parallel,each with different stiffness and viscosity respectively.This form of representation is explained in detail by Betz [24].
Another approach is to relate the time-dependent stresses and strains using differential operators.To model material with frequency dependence a large number of higher-order time derivatives and parameters are required,making this model timeconsuming.This gave rise to the use of fractional derivative model for the frequency dependent properties of elastomers,which uses fewer parameters,reducing the complexity [25,26].Enelund et al.[27] studied the time domain response of viscoelastic structures governed by constitutive relations involving fractional calculus operators,and compared the results obtained with analytical solution.Fredette et al.[28] propose a novel spectral element approach to determine the dynamic stiffness of elastomeric isolators with frequency dependent damping characteristics.
To simulate the linear viscoelastic behavior of elastomers,the complex modulus model has been widely used,as described in detail in Refs.[29,30].The frequency-dependent complex modulus of an elastomeric sample is obtained by conducting Dynamic Mechanical Analyzer (DMA) testing.Gil-Negrete et al.[31],presented the variation in shear modulus of several natural rubbers of different hardness with frequency and strain amplitude.It is generally observed that the storage modulus of elastomeric materials increases with increasing excitation frequency,and decreases with increasing dynamic strain amplitude[2].
Additionally,the complex modulus of elastomeric materials is also dependent on the static preload.Nashif et al.[2] documented that with increasing preload,the storage modulus increases,while the loss factor decreases at any frequency of excitation.It thus becomes imperative to model the elastomeric properties as a function of both static and dynamic strains.The properties of elastomers under combined static and dynamic loads can be obtained experimentally,but requires a large number of tests due to the number of parameters involved.Kim et al.[32,33] proposed a viscoelastic constitutive equation for pre-stressed rubbers,derived through linearization of Simo's nonlinear viscoelastic constitutive model and reference configuration transformation [34].They further compared the results for different rubber specimens from their model with extensive experimental data and reported good prediction of elastomeric characteristics.Ahn &Kim [35] further provided a simple semi-empirical method to estimate the dynamic stiffness of pre-deformed elastomers using their static deformation characteristics.Beda et al.[3] later proposed a multiplicative non separable variables law for characterizing highly preloaded viscoelastic materials subjected to small-amplitude vibrations.This involved splitting the material property dependency on static stretch and time/frequency as though they are independent of each other,allowing the modelling of elastomeric materials with independent static and dynamic tests.They further validated their model with the experimental results obtained by Kim&Yuon[32],and reported a good match.This model representing the combined static and dynamic effects on an elastomer was proposed by Nashif et al.[2] and is considered in the current study,though it has not been presented for Yeoh material model in literature.Moreover,application of this method for obtaining accurate dynamic response of pre-stressed vibration isolators using Finite Element(FE)analysis and comparison with experimental results is the specific outcome of the present work.
In the design of vibration isolators for aerospace vehicles,inertial acceleration is generated by the thrusting of the vehicle and random vibration excitation are considered applied over the preloaded systems.The present study is on vibration isolators used in aerospace applications subjected to dynamic loads in a preloaded state,which is hitherto not addressed in the referred literature.This paper presents an improved approach to generate a mathematical model for the elastomeric materials and a corresponding FE formulation to satisfactorily predict the random vibration response of typical isolators.
Axisymmetric Finite Element Formulation is developed using Total Lagrangian approach to predict the static deformation of the isolator.The deformed state under static load is considered for further dynamic studies.The elastomeric constants are obtained from uniaxial tension tests and shear mode tests using Dynamic Mechanical Analyzer (DMA).The modified material properties of the elastomers to account for the pre-deformation and frequency dependence are used to compute the harmonic response and random response of two types of vibration isolators with different elastomer formulations.Quadratic quadrilateral element is developed and used effectively for the analysis of rocket motor solid propellant grains[36] whose linear version with pressure variable condensation is used for the present study.
2.Material characterization
The vibration isolators considered in the present study consist of parts made from steel and two types of elastomers,viz.VPM2-225A and VPM2-450B,where VPM2 is the nomenclature of isolators used in VSSC which is based on Polymeric(Silicone rubber)and Molded construction,whereas 225A and 450B represent the load rating applicable.These materials are selected depending on where it is being used: in general elastomers with good heat,weather and wear resistance with good damping characteristics are preferred.For the present case it is chosen with good damping characteristic to reduce the tramissibility to have good vibration control in the load transfer end.These molded vibration isolators are used for mounting of equipment in a launch vehicle.The properties of steel are taken from literature and elastomers are statically characterized to study the non-linear static deformation.To numerically simulate these elastomers under dynamic loads,the elastomeric material samples are tested in a DMA for different dynamic strain amplitudes and the properties are obtained as complex frequency dependent functions over a range of frequencies.The properties obtained from DMA are modified to account for the preload effect by including the static stretch and non-linear material constants.The procedure used to obtain these properties is provided in this section.
2.1.Static material characterization
The behaviour of hyper-elastic materials is derived from the strain energy density function,U,which is a function of the three invariants,I1,I2andI3of the Green deformation tensor.In the current study first,the suitability of Mooney-Rivlin and Yeoh material models are initially considered for comparison.The constants for these models are obtained by performing a uniaxial tension test.
A uniaxial tension test was conducted on dumbbell shaped specimens prepared according to ASTM D412 standards.The dimensions of the specimen used for the test are shown in Fig.1.It is generally accepted that tensile test data is sufficient to compute Yeoh constants and this can represent deformation in other modes as well.
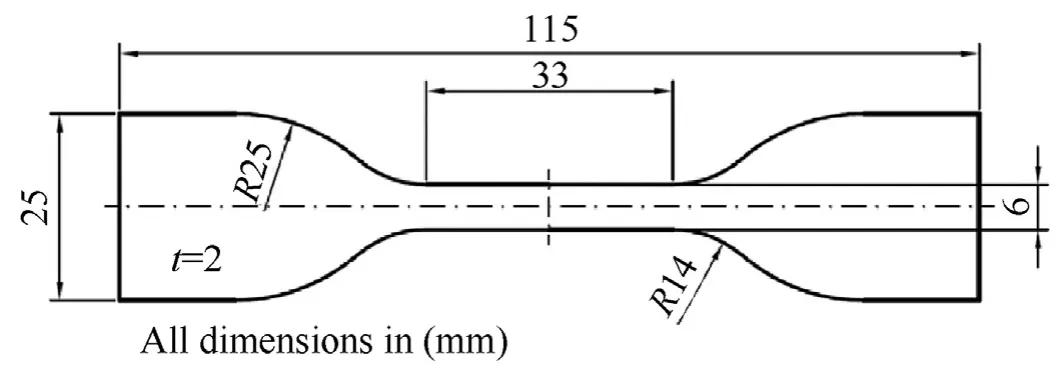
Fig.1.Uniaxial tension test standard specimen dimensions.
The test was conducted at ambient conditions for both the elastomeric material samples of VPM2-225A and VPM2-450B,and the measured stress vs.strain plots are presented.The hyper-elastic curve fitting capability in ABAQUS software is used to compute the hyper-elastic material constants for Mooney-Rivlin and Yeoh material models by providing the nominal stress vs.nominal strain data obtained from the tension test.By iterating through the constants using a least-squares fit method,the relative error between the predicted and experimental values is reduced by ABAQUS[37].
The material constants calculated along with the corresponding goodness of fit values are presented in Table 1.The Fit obtained with both the material models are shown in Fig.2 and Fig.3 for materials VPM2-225A and VPM2-450B respectively.Brief description of the procedure to obtain Mooney-Rivlin and Yeoh material constants provided in the table below.These are from a linear fit between Cauchy's stress vs principal stretch and quadratic fit between Cauchy's stress vs(I1-3).Cauchy's stress can be obtained from strain energy density function for uniaxial tension which is provided in Section 3 for Yeoh material model.For Mooney-Rivlin model,strain energy density function is given as
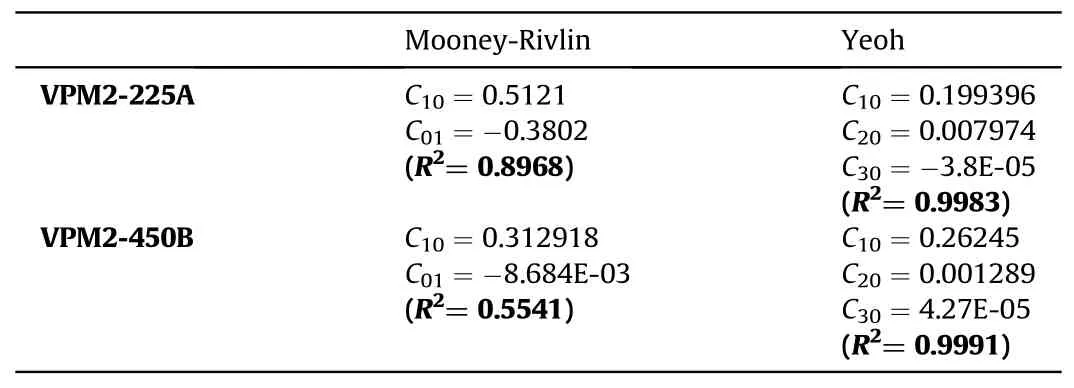
Table 1 Material constants obtained from ABAQUS.
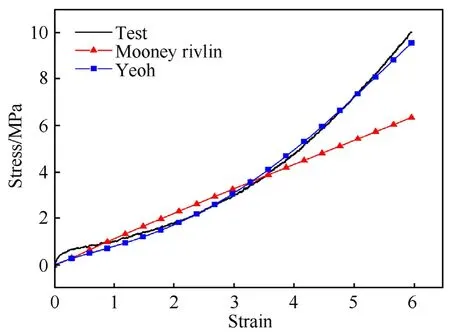
Fig.2.Moony Rivlin &Yeoh models fit with Tension Test data for VPM2-225A.
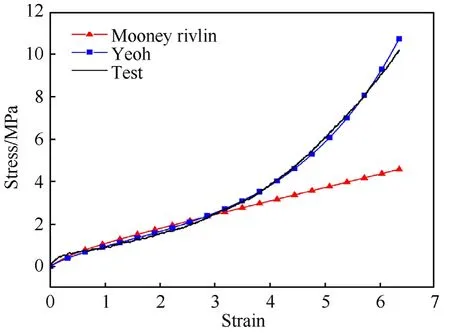
Fig.3.Moony Rivlin &Yeoh models fit with Tension Test data for VPM2-450B.
From Fig.2 and Fig.3 it is clearly evident that Yeoh material model fit much better compared to Mooney-Rivlin model.Hence Yeoh material constants will be used for numerical study.
It can be seen from Fig.2 and Fig.3 that the Yeoh material model matches well with the observed non-linear behavior very closely.It can also be noted that the Mooney-Rivlin model fails to predict the“upturn” or stiffening at higher strains.Yeoh material model is further used for model improvement and response studies as the baseline.
2.2.Dynamic material characterization
The dynamic characterization for the elastomers under study is done using the TA Instruments Q800 Dynamic Mechanical Analyzer(DMA).The force resolution of the DMA is 0.0001 N with a maximum force of 18 N,while the strain resolution is 1 nm.The measurement range of modulus for the Q800 DMA is 10E3 to 30E12 Pa with a precision of ±1% [38].
The Q800 DMA can be used to conduct dynamic property evaluation in different modes such as single/dual cantilever,thin film tension,compression etc.For the current study,the dynamic characterization is done in the shear mode by using the TA instruments shear sandwich clamp.This mode of test is preferred,because the elastomer in the isolators under study experience predominately shear deformation due to their geometric configuration.The test is conducted at room temperature for different strain amplitudes(Υd)with the frequency ranging from 1 to 60 Hz.The frequency dependent storage modulus (shear) and loss factor are measured at different dynamic strain amplitudes and the results are presented in Fig.4 and Fig.5.
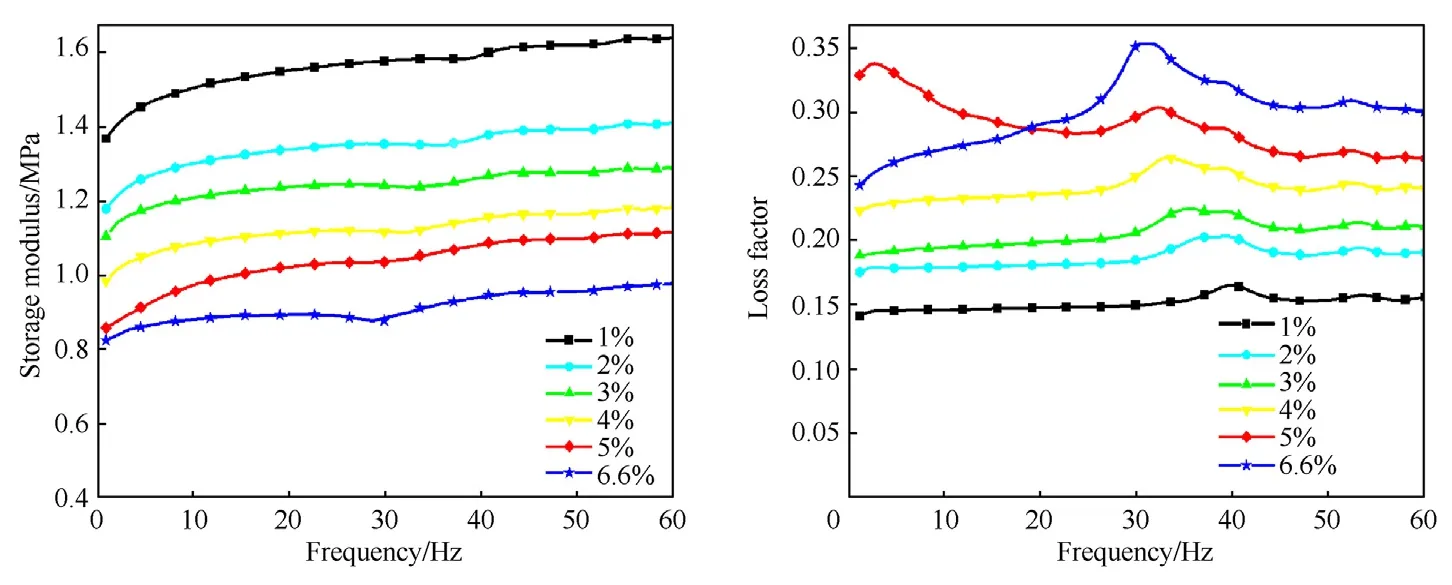
Fig.4.Frequency dependent properties of VPM2-225A.
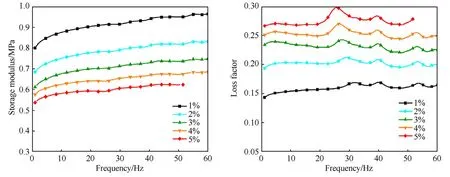
Fig.5.Frequency dependent properties of VPM2-450B.
It can be seen that at a constant dynamic strain amplitude,the storage modulus increases with excitation frequency,while the loss factor remains almost constant.At constant frequency however,the storage modulus reduces with increasing strain amplitude while the loss factor increases.For VPM2-225A,the testing is done till Υdof 6.6%,and for Υdabove this value,the material sample slips off the clamps.
2.3.Geometry and material properties
The 3-D geometric configuration of type-A and type-B vibration isolators used for present analysis,are shown in Fig.6 and Fig.7 respectively.The isolator consists mainly of four parts,the pin,body,elastomer and cover.The pin,body and cover are made of AISI 304 steel.
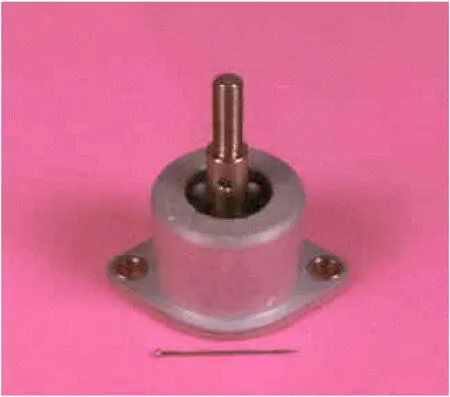
Fig.6.Configuration of Type-A (VPM2-225A) isolator.
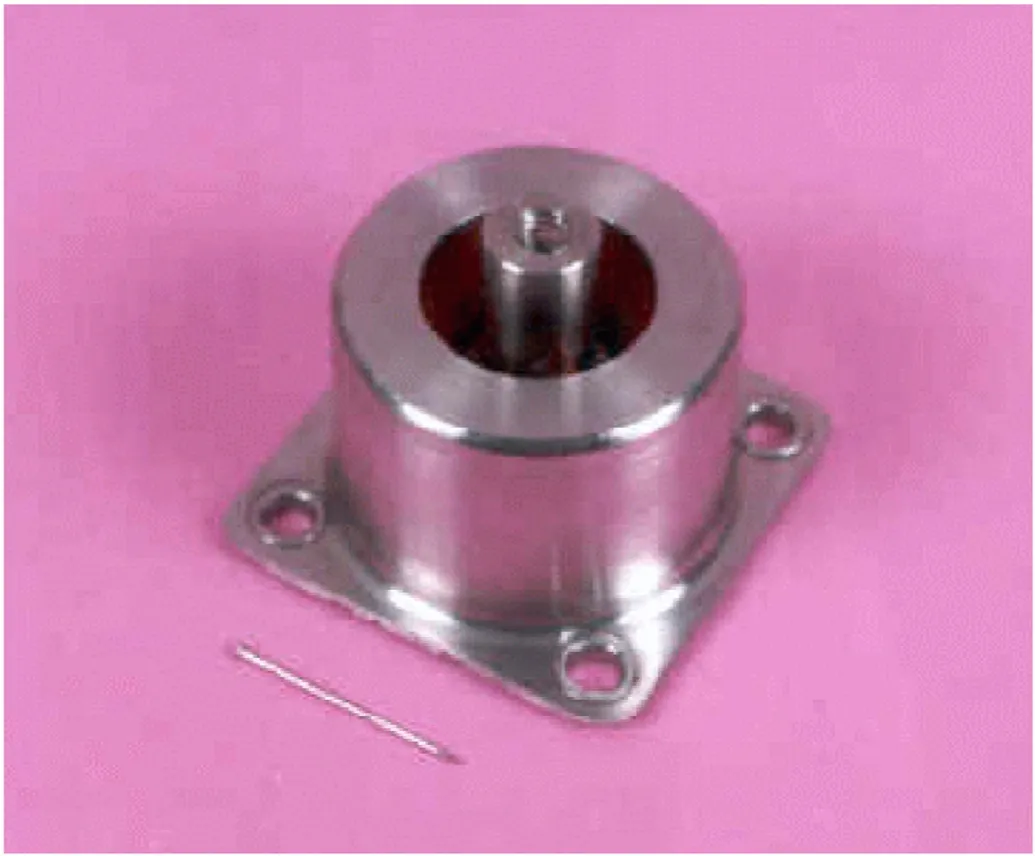
Fig.7.Configuration of Type-B (VPM2-450B) isolator.
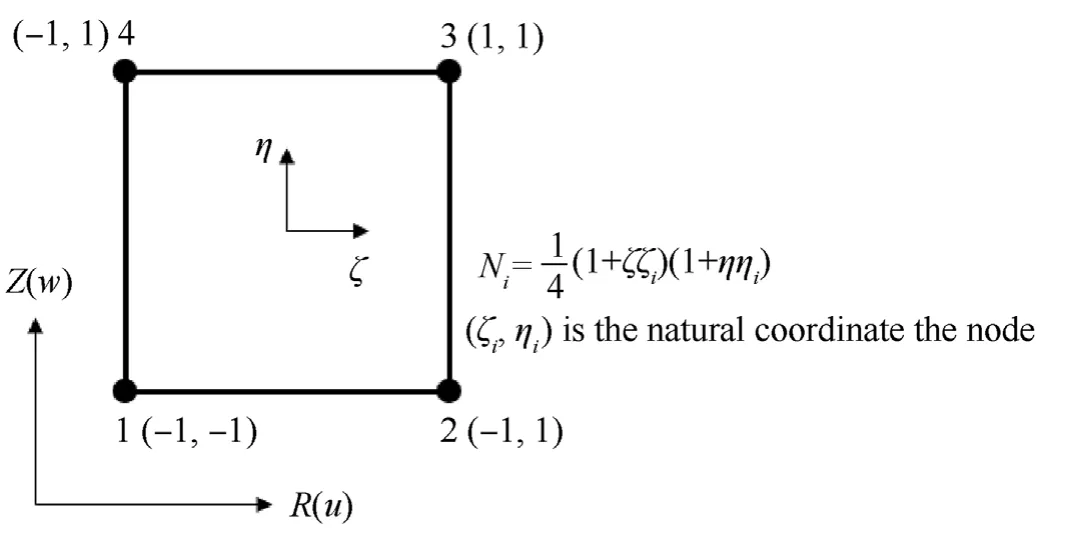
Fig.8.4-Node Quad element.
The material properties considered for the analysis are given in Table 2.

Table 2 Material properties used for non-linear static analysis.
3.Material model formulation for incorporating staticstretch dependence
In this section,a novel multiplicative non-separable variables law is derived,accounting for the static deformation and its effect on dynamic material characteristics,for Yeoh material model.The method used is similar to that given in Refs.[2,3].The assumption involved is that the effects of static stretch and frequency of excitation on the dynamic material properties are independent of each other.For elastomeric materials subjected to a dynamic load superimposed on a non-linear static deformation,the stress can be factored into a function of frequency (ω) and a function of stretch ratio (λ) as
Strain energy density function as given by the standard Yeoh material model,
where,I1is the first invariant of the green deformation tensor,
where,λ1,λ2,λ3are the principal stretches in 3 directions.For uniaxial tension,
From Eq.(4),Eq.(3) becomes
The stress is given as
Simplifying,
Taking the right-hand side of Eq.(7) asF(λ)in Eq.(1),
Eq.(9) can be used to represent the combined static and dynamic properties given after simplification,
Using the complex modulus representation of the elastomeric material properties,
Separating the real and imaginary parts of the above equation,real part is provided in Eq.(10) and imaginary part is given as
To determine η1,η2,η3and H,it is to be noted that from Ref.[27],η2and η3can be assumed to be zero.As λ→1,
From Eq.(10) to Eq.(16),
Thus,Eq.(10) and Eq.(15) become
whereY(ω)and η(ω)are the frequency dependent storage modulus and loss factor obtained from DMA testing.Using Eq.(18) and Eq.(19),the material properties are modified for at each frequency value while computing the response.Eq.(18)is modified with shear modulus and bulk modulus using elasticity relations with the material constants obtained from DMA tests for numerical computation.It is evident that with increase in static stretch (increase in load) the storage modulus increases and the damping reduces.Especially at higher static preloads,the modulus increases significantly.In the present study,significant effects on elastomeric constants are observed due to pre-load so as to change the dynamic characteristics of the isolator.
4.Finite element (FE) formulation for response studies
The axi-symmetric four node quadrilateral element for geometric non-linear analysis using Total Lagrangian approach is provided along with Newton-Raphson solution technique.The statically deformed configuration is updated to study frequency domain response.For this purpose,axi-symmetric four node element is developed using mixed u/p formulation with condensation of pressure degrees of freedom.Two by two Guassian quadrature is used for numerical computation of load vector and finite element matrices.Throughout this section,formulation is provided for one element and load vector and other assembly and solution procedure follows the usual finite element methods.
4.1.Non-linear axisymmetric FE formulation for hookean material
The formulation for 3D finite elements is given by Zienkiewicz[39],and is suitably modified for four-node axisymmetric finite elements,as presented in this section.The residual force for axisymmetric four-node quadrilateral element is given as
whereArepresents area of the element,is the incremental strain displacement matrix and can be obtained from Green-Lagrange strain vector Ev,for axi-symmetric body.Svis the second P-K stress vector and Feis the externally applied load vector which is deformation independent.For the present study,only traction is applied,the details of the load vector for the traction are given as
where l represents the line of the edge where pressurepris applied andm,nare the direction cosines of the edge and N is the shape function matrix.Relation between second P-K stress vector and Green-Lagrange strain vector is given as
where D is the stress-strain relation.Axisymmetric quadrilateral four-node element is shown in Fig.8.
The non-linear Eq.(20) is linearized through Taylor's series expansion considering only the linear term as provided in Zienkiewicz [39].Equilibrium solution which satisfies Eq.(20) is obtained in an iterative process using the linearized equation starting with zero displacement.To obtain the iterative solution,tangent stiffness matrix is computed as given below having relevance for Yeoh material model provided in the next section.
where KT(q),G,MSare tangent,geometric stiffness,stress matrices respectively and dψ,dq are incremental residual force and displacement vectors respectively.
4.2.Axisymmetric FE formulation for yeoh material model
The relations for second P-K stress vector and constitutive matrix for axisymmetric mixed p-type element is given by Muhammed et al.[1],and is modified for Yeoh material model as presented in this section.The residual force vector and tangent stiffness matrix provided can be directly used for Yeoh material model with proper definition of second P-K stress vector and the constitutive relation.For that purpose,strain energy density function for Yeoh material model is used.The first and the second partial derivative of strain energy density function with respect to Green Lagrange strain provides second P-K stress vector and the constitutive matrix respectively.Strain energy density function for Yeoh material model is given as
where,C10,C20,C30are Yeoh material constants,D1,D2,D3are penalty parameter to impose the incompressibility constraints,
For axi-symmetric element,
Second P-K stress tensor is defined as
Green-Lagrange strain tensor is defined as
where I is a 3 × 3 Identity matrix,F is the deformation gradient given as
Second P-K stress vector is given as
where,
The constitutive matrix for Yeoh material is given as
Using the above formulation non-linear static analysis is carried out.The details of loading and displacement boundary conditions are provided in the numerical study.The statically deformed state is used to carry out further the frequency domain response analysis.
4.3.Axisymmetric FE formulation for frequency domain response
Static mixed u-p based formulation for quadratic elements to address incompressibility effects is given by Marimuthu et al.[36],whose linear element version is used in the present study with pressure condensation.In this section,four-node quadrilateral finite element formulation is presented for incompressible material for static load.The same formulation is used for compressible material as well,and necessary modifications are made to study the frequency domain response.The total potential for an axisymmetric solid by imposing incompressibility constraint is given as
where ε,σ,εvare the linear strain,stress vectors and volumetric strain respectively,p is the hydrostatic pressure at the element centroid,k is the bulk modulus,b is the body force,t is the traction,u is the displacement vector at any point within the element,and q is the nodal displacement vector.Minimization of total potentialw.r.to q,p after substituting strain vector as a sum of deviatoric and volumetric parts and stress vector as a sum of deviatoric and hydrostatic part results in the following with pressure condensation given as
where Gdis a diagonal matrix given as{2G,2G,2G,G}which relates deviatoric stress and strain vectors,Bdis the deviatoric strain displacement matrix and Bvis a vector which relates voulmentic strain and displacement vector.
4.3.1.FE formulation for frequency response analysis
The static finite element equation for an incompressible material can be modified and written for dynamics by using the d’Alembert's principle [39].In dynamic analysis,the displacement vector at any point within the element u and nodal displacement vector q be complex and henceforth will be represented with a × superscript.When displacements of an elastic body vary with time,two sets of additional forces are called into effect.The first is the inertia force,which for an acceleration characterized by ü*can be replaced by its static equivalent,-ρü*where ρ is the mass density.The second force is that due to resistance opposing motion.A linear,viscous type resistance can be characterized by an equivalent static force of magnitude -c˙u*,wherecis damping property per unit volume.The equivalent static problem,at every instant of time,can be discretized in a manner similar to previous section,by replacing the distributed body force b by its equivalent
In the present study,damping is expressed in the material property itself,hence viscous damping is neglected.Assuming
Static finite element formulation provided in Eq.(43) get modified for frequency response as
The above matrix is a complex function of frequency and static stretch dependent is due to the material properties.The diagonal matrix Gdin equation and bulk modulus in which was provided in static formulation get modified as={2G*(ω,λ),2 G*(ω,λ),2 G*(ω,λ),G*(ω,λ)} andk*(ω,λ).
whereG(ω,λ)andk(ω,λ)are storage shear and bulk modulus respectively and η(ω,λ)is the loss factor and static stretch λ is a geometric mean of the eigen values of matrix CM.Mass matrix M is given as
4.3.2.FE formulation for random response analysis
A random process is said to be stationary when its mean does not change over time.This essentially means that a stationary process is one whose probability distribution does not change with time.In addition,if the mean obtained for a sample of an ensemble,is equal to the mean across the ensemble at any arbitrary time ti,the process is called ergodic[40].For the numerical analysis presented in this study,all random processes are assumed to be stationary ergodic.The finite element formulation for obtaining the random response is an extension of the formulation presented in the previous section for obtaining the frequency response.The RMS value of the reactive response in the Z direction to a random excitation with a spectral densitySF(fn) can be obtained as
wherefnis the excitation frequency in Hertz,Nis the number of equal intervals of excitation frequency,andSRZ(fn)is the spectral density of the response given as
where,|Hn| is the absolute value of the net reactive frequency response at frequency inZdirection atfn.
4.4.Implementation algorithm
The procedure implemented for obtaining the frequency response of the isolators is described in Fig.9 is as follows:
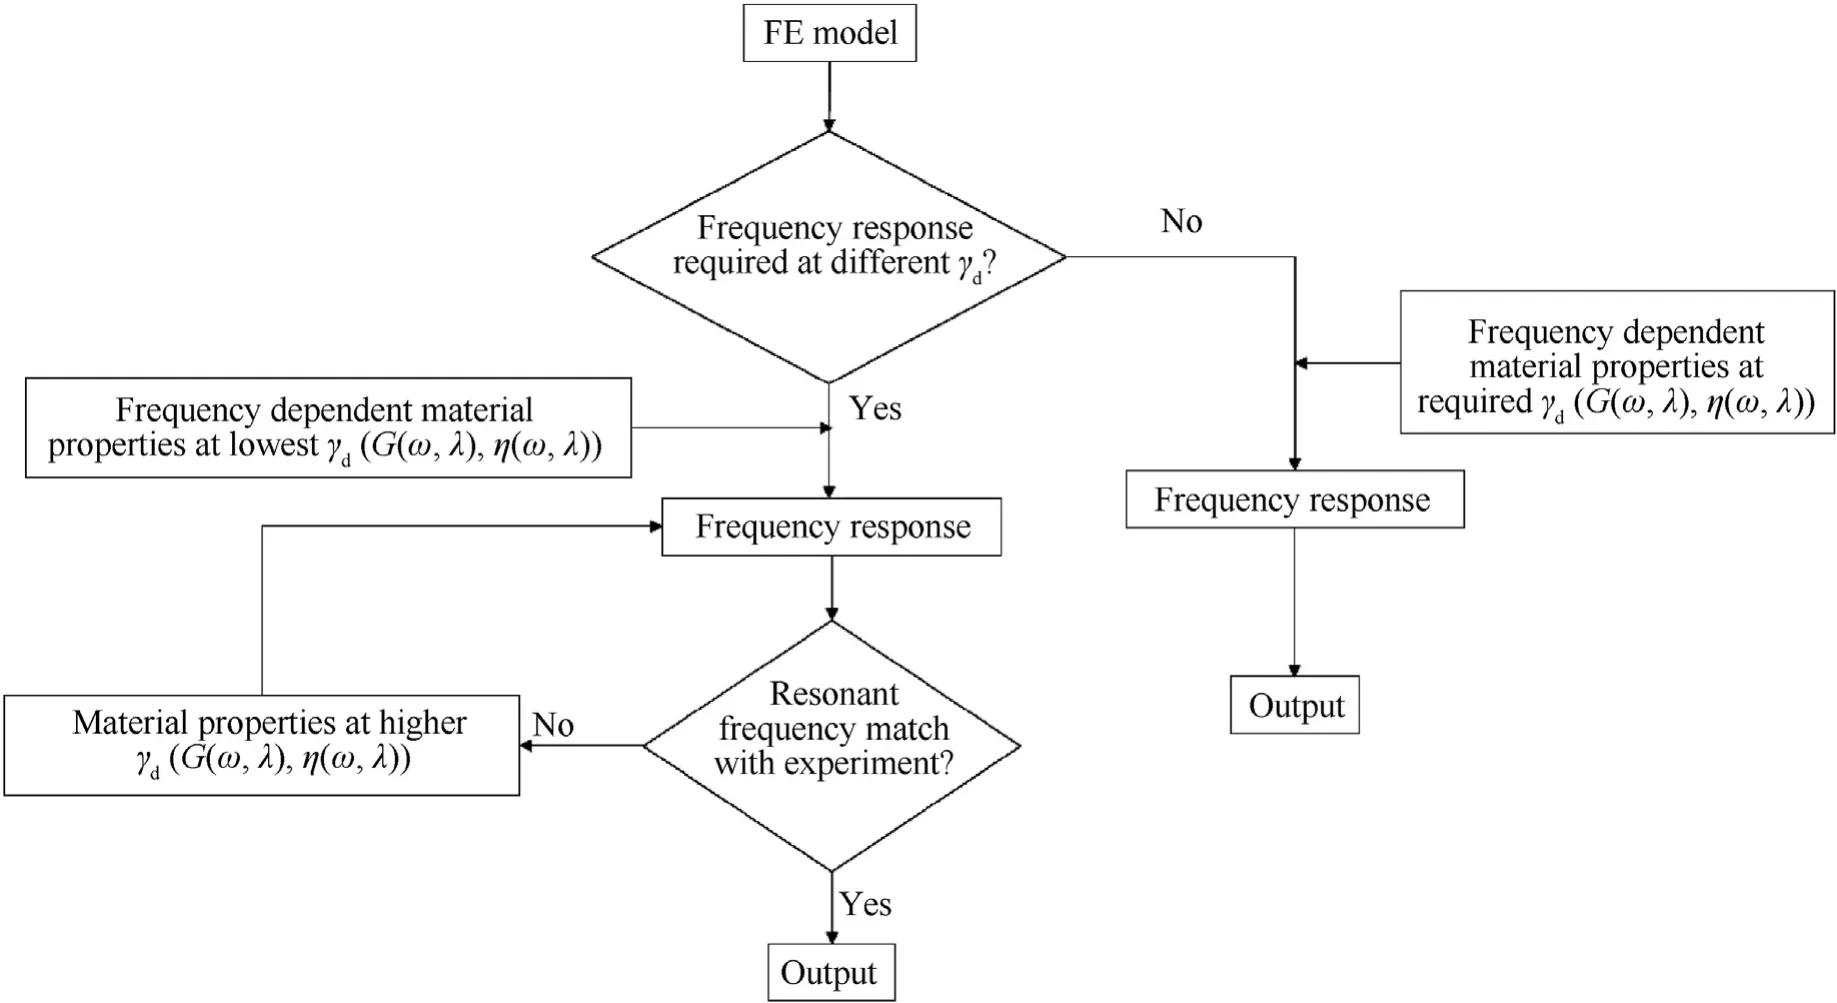
Fig.9.Implementation algorithm for frequency response analysis.
The non-linear static analysis of the isolators shown in Fig.6 and Fig.7 is carried out under static loading conditions at the rated load and the deformed configuration thus obtained is considered for the dynamic analyses.For the present study,the dynamic material properties of the elastomers have been obtained at different dynamic strain amplitude(Υd)values as a function of frequency.These properties are modified to include the effect of static stretch as described in section 3.
The frequency response analysis is first carried out using the material properties at lowest Υdand the resonant frequency match between the experiment and numerical result is checked.If a match is not observed,the material properties at a higher Υdare used for obtaining the response.This process is continued until a close match is observed in the resonant frequency obtained from experiment and simulations.Further,a suitable material damping correction is provided to match the numerical transmissibility to the experiments.
5.Experimental setup for vibration response studies
The experimental study of isolators for harmonic response and random response is conducted using the electrodynamic shaker consists of an electromagnetic circuit with a stationary (field) coil and a moving (drive/armature) coil which is a part of the “Head”that vibrates.The force rating of the shaker is 3.5 ton with 50 mm double amplitude capability having frequency range is up to 2000 Hz shown Fig.10.The isolator used for the present study is fixed on top of the moving head.To simulate the load rating an equivalent to mass of 2.25 kg and 4.5 kg for Type-A and Type-B isolators,a dummy mass is made in hollow cylindrical form with bottom closed whose inverted position is placed on top of the isolator shown in Fig.10.Due to the placement of mass on the pin an equivalent load is transferred to the pin and futher a precompression is created due to specified displacement on the cover.This pre-stressed state is obtained using non-linear analysis presented in numerical study section.This pre-compressed state is used for the dynamic experimentation by fixing an accelerometer on top of dummy mass as shown in Fig.10 which is close to the flexural centre to avoid unwanted noise pick up.The experimental observations are compared in a graphical form with the present FE formulation are detailed in subsection 6.3.
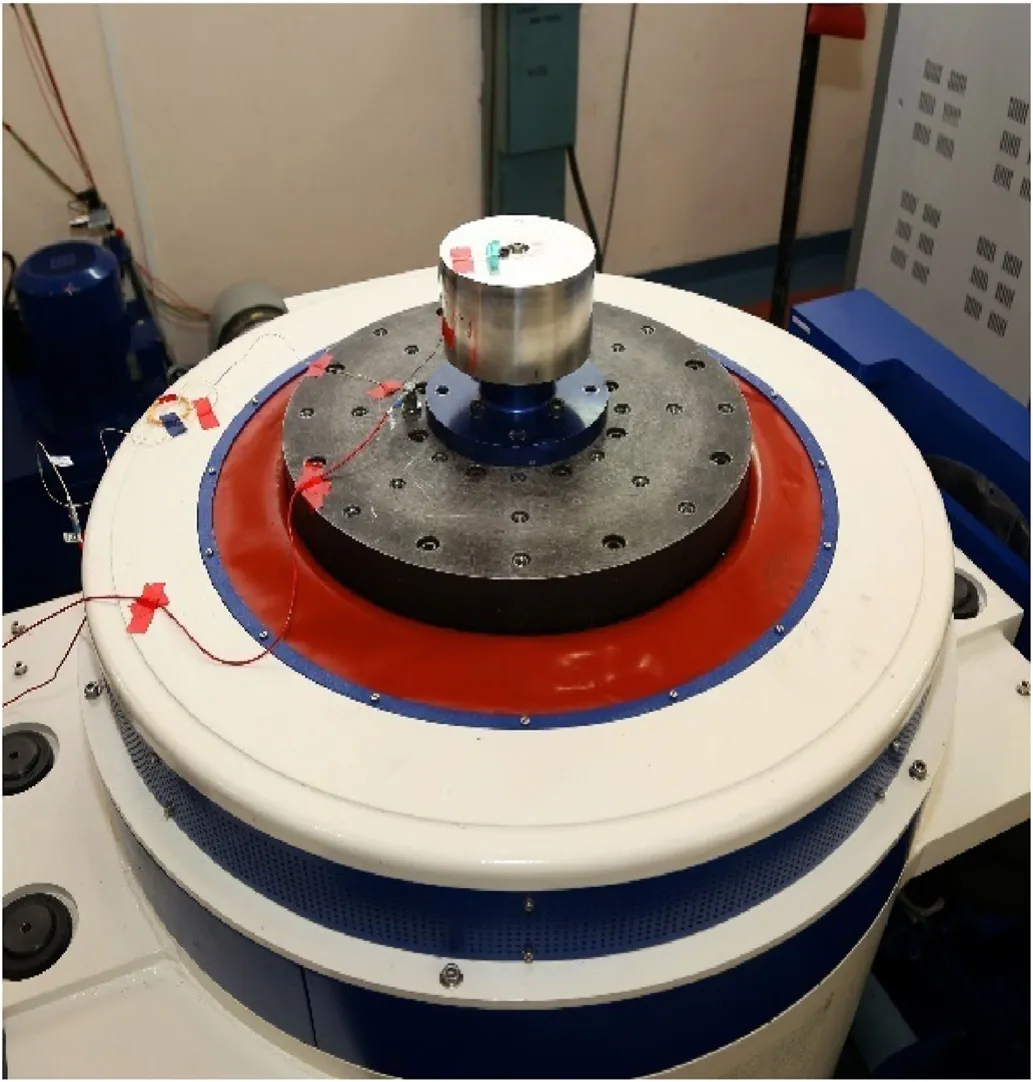
Fig.10.Dummy mass placed on top of the isolator for test with accelerometer attached.
The data acquisition system used is the Spider-81 supplied by Crystal Electronics.The Integrated Electronics Piezoelectric (IEPE)accelerometer used is of Endevco make with a sensitivity of 10 mV/g.Data analysis is performed using the Engineering Data Management(EDM)software,compatible with Spider-81.The above test is conducted at Saraswathi Dynamics at the Vibration Test Facility in Liquid Propulsion Systems Centre(LPSC),ISRO,Trivandrum.
6.Numerical study
The results from static and frequency domain analyses are presented in this section.The appropriate material properties are taken from Table 2.The numerical results are presented in contour and graphical form.
6.1.Finite element mesh
The axisymmetric finite element mesh with the applied boundary conditions for type-A and type-B isolators are shown in Fig.11 and Fig.12 respectively.The nodes with red circles are fully fixed,whereas the nodes with blue circles are constrained in the radial direction.The arrows represent the location and direction of the applied load.The finite element mesh connectivity and nodal coordinates are generated using ‘PreWin’,a pre and post processing software which is developed in ISRO for the Finite Element Program“FEAST”.The data generated is then exported to a MATLAB code for further computations.The elements colored green and white in Fig.11 and Fig.12 correspond to the elastomer and the steel parts respectively.The FE details of the models used are provided in Table 3.

Table 3 Finite Element details.
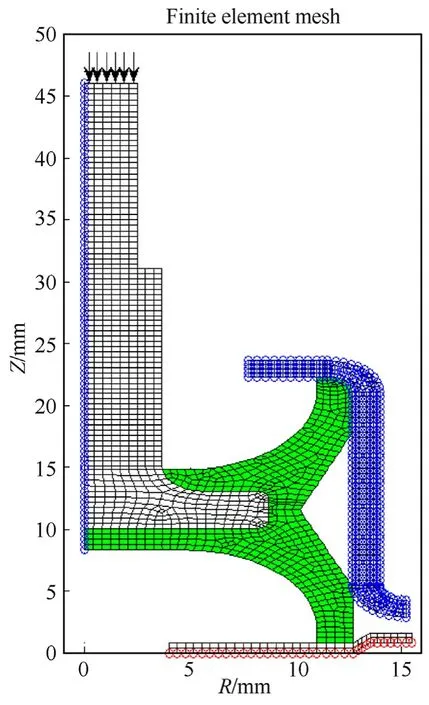
Fig.11.Finite Element mesh of Type -A isolator.
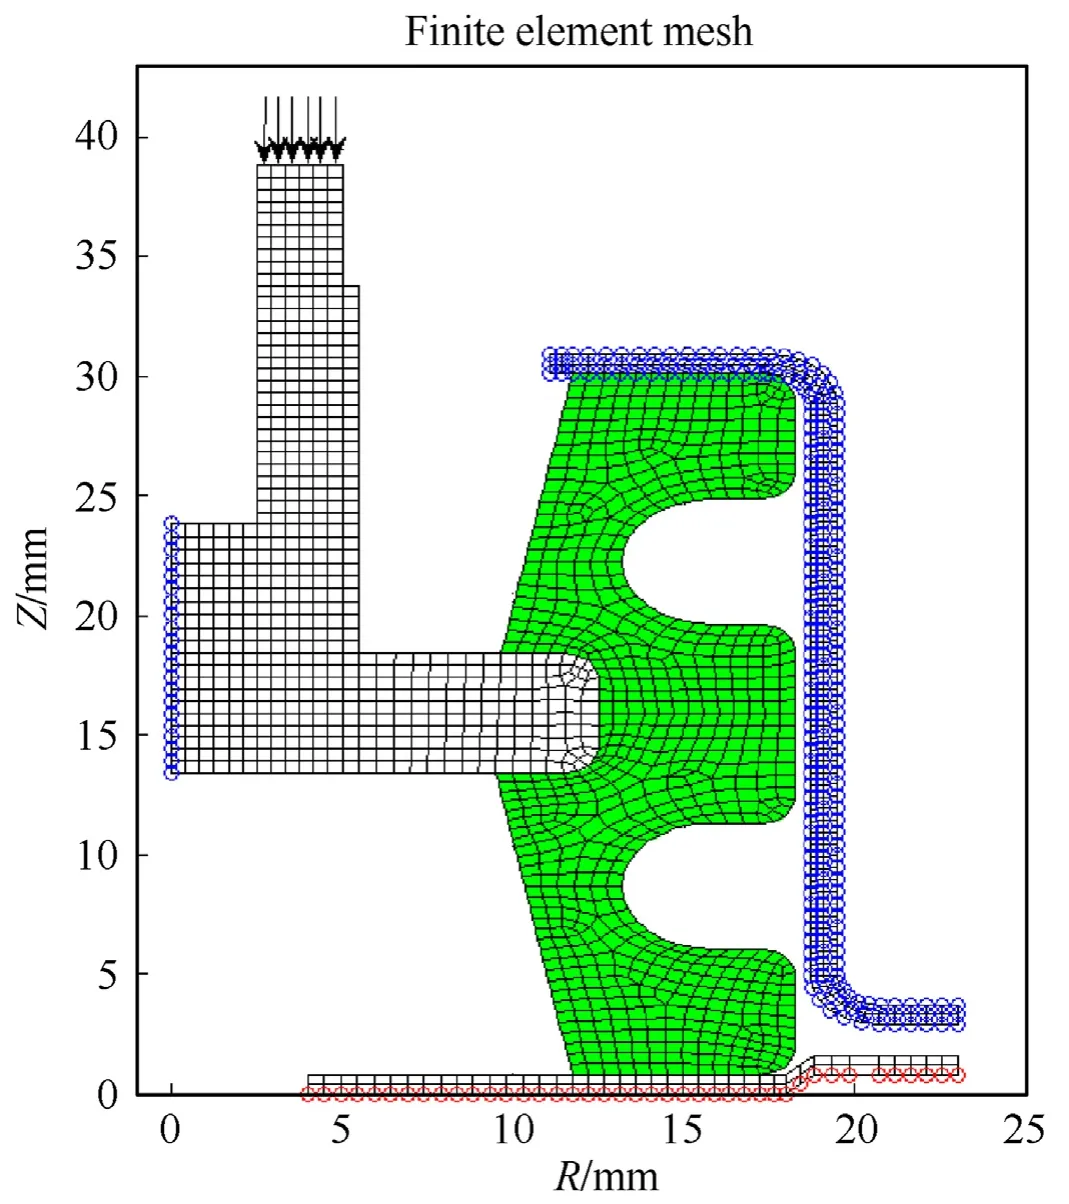
Fig.12.Finite element mesh of Type -B isolator.
In Figs.11 and 12,the interface between the pin and elastomer are assumed as bonded and modelled using common nodes and this assumption is valid due to high friction coefficient for elastomers.
6.2.Non-linear static analysis
For the isolators under study,an initial pre-compression isprovided when the isolator body and cover are riveted together.A mass equal to the rated mass of the isolator is also placed on top during its operation and testing.For both the isolators,the precompression provided is 1.3 mm.For type-A isolator which has a mass rating of 2.25 kg,the static load applied is 22.5 N as edge load on the pin.For type-B isolator with a mass rating of 4.5 kg,the static load applied is 45 N.The results of the static analysis carried out using the code are presented in Table 4.The response is given in terms of displacement of the pin.The resulting deformation contour is given in Fig.13 and Fig.14 for type-A and type-B isolators respectively.

Table 4 Pin displacements obtained from non-linear static analysis.
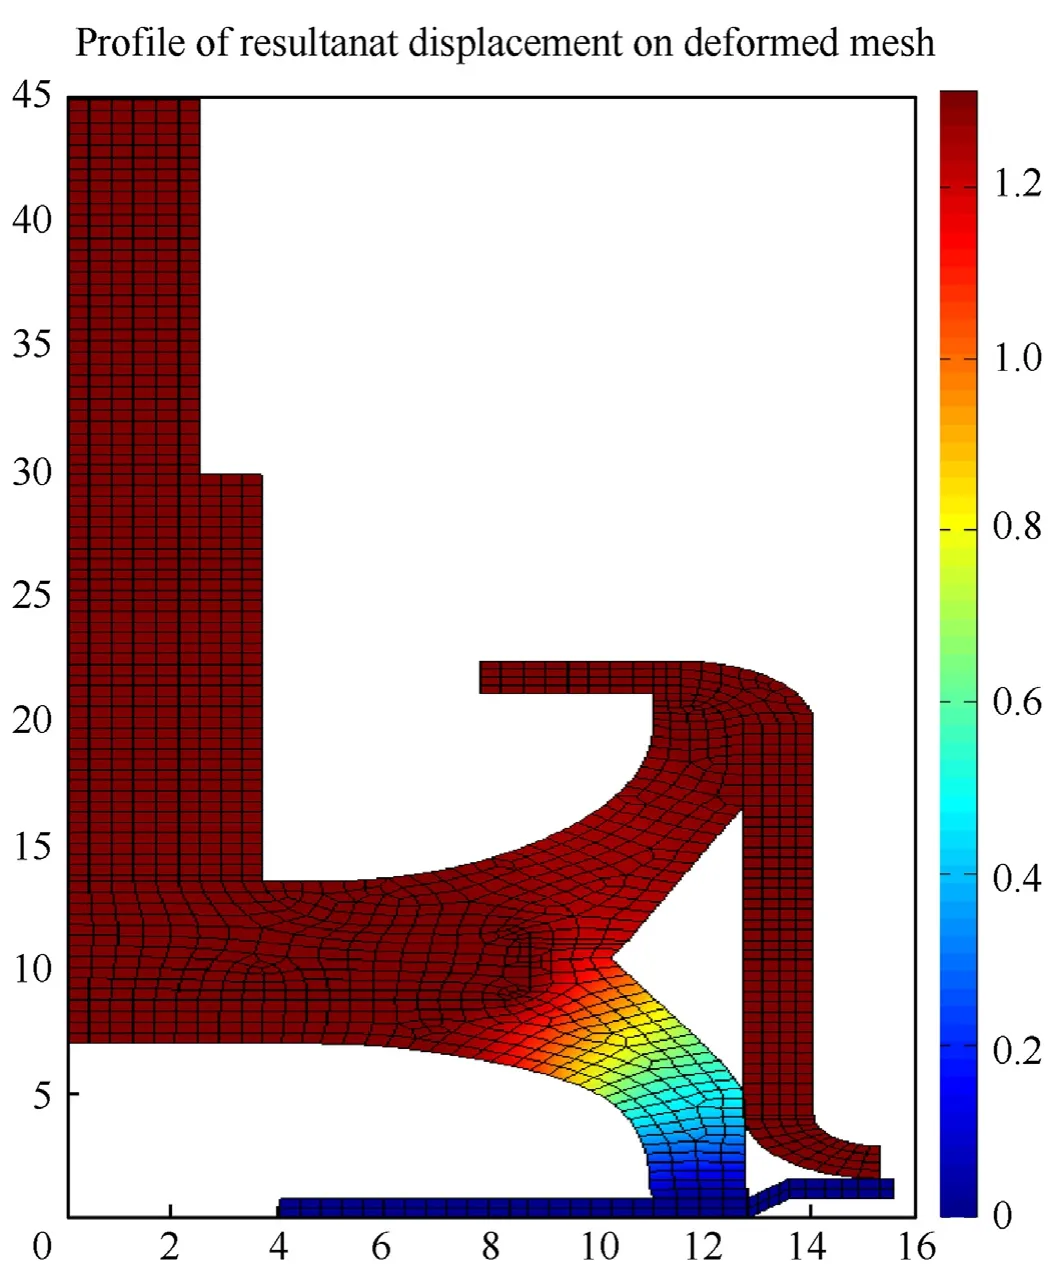
Fig.13.Deformation contour of Type -A isolator.
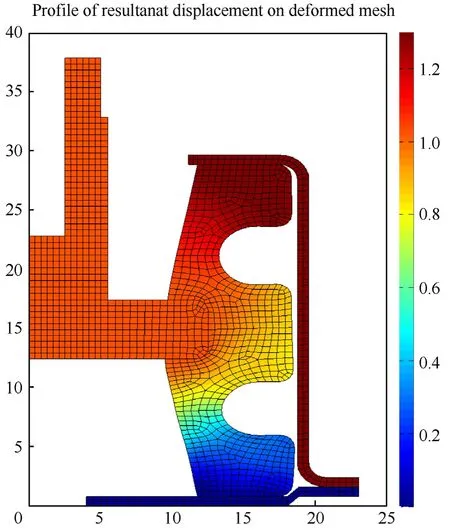
Fig.14.Deformation contour of Type -B isolator.
6.3.Frequency domain analysis
The statically deformed configuration is considered for the numerical and experimental studies with the addition of point mass equivalent to dummy mass at the top most node in axis of the pin.Five and three experiments respectively are conducted for frequency and random response which are bought out in tabular form provided in Table 5 and Table 6 for Type-A and Type-B isolator.The difference in numerical values from one experiment to another is attributed to variation in material properties.

Table 5 Frequency response data obtained from 5 trials with Type -A,B isolators.

Table 6 Response RMS obtained from random excitation of isolators.
6.3.1.Experimental frequency response
Five experiments are conducted on different isolators whoseresonance frequency and amplitude are given in Table 5.
6.3.2.Comparison of frequency response results
For the numerical comparison one of the experiments is chosen which is trial-1 from Table 5.Numerically observed frequency response is a net reactive response computed from eliminated system matrix,with multiplication of displacement vector computed for frequency ranging from 10 to 60 Hz in the interval of one Hz.Fig.15 shows the comparison between experimental observation and numerically computed values as the properties obtained for different Υdvalues as shown in Fig.4.
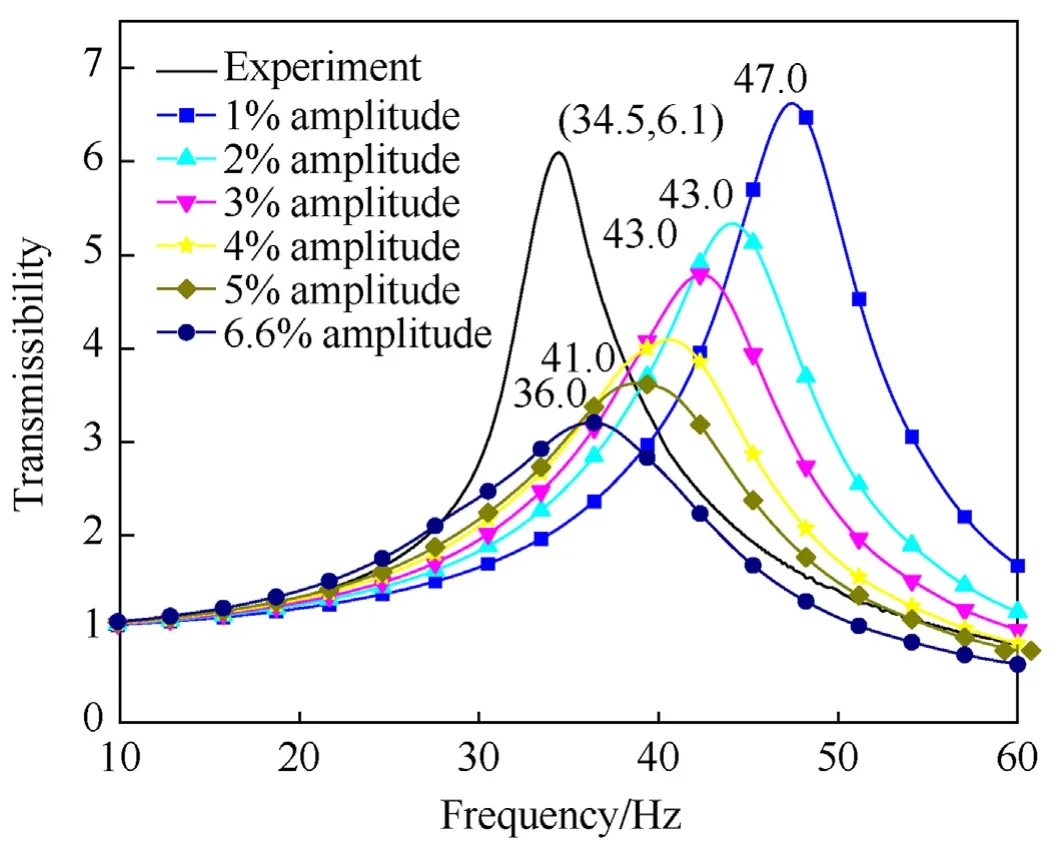
Fig.15.Comparison of frequency response with material properties at varying dynamic strain amplitudes.
It can be seen from Fig.15 that resonance frequency and amplitude are high compared to the experimental value for lower strain amplitude due to the dynamic elastomeric properties such as storage modulus and loss factor which are progressively lower and higher respectively as the frequency increases.This phenomenon is well presented in Fig.4 and explanation are provided thereafter.From the numerical comparisons shown in Fig.15 has a decent match in natural frequency is achieved for 6.6%Υd,while the peak transmissibility is only 3.2.The resonance frequency is indicated against each response curve.Here,a damping correction factor is introduced into the mathematical model to correct and match the numerically obtained transmissibility with that of the experiment.Since the random response computations are dependent on the response at each frequency component,applying this correction factor is essential for accurate response predictions.This will be evident with the results presented in the subsequent section.Transmissibility shown in Fig.15 is a magnification factor for the input provided on the isolator.Elastomers are designed such a way that this factor should be the least to ensure minimum response for sinusoidal excitation.For random excitation lower resonance frequency with lower transmissibility helps in overall responsereduction for acoustic excitations,stage separation etc.,to protect mission critical electronic packages mounted in launch vehicles.
An important aspect to note here regarding hysteretically damped systems is that their natural frequency is not affected by the damping present in the system but rather only by the stiffness.A change in damping will only affect the transmissibility of the system as shown in Fig.16.
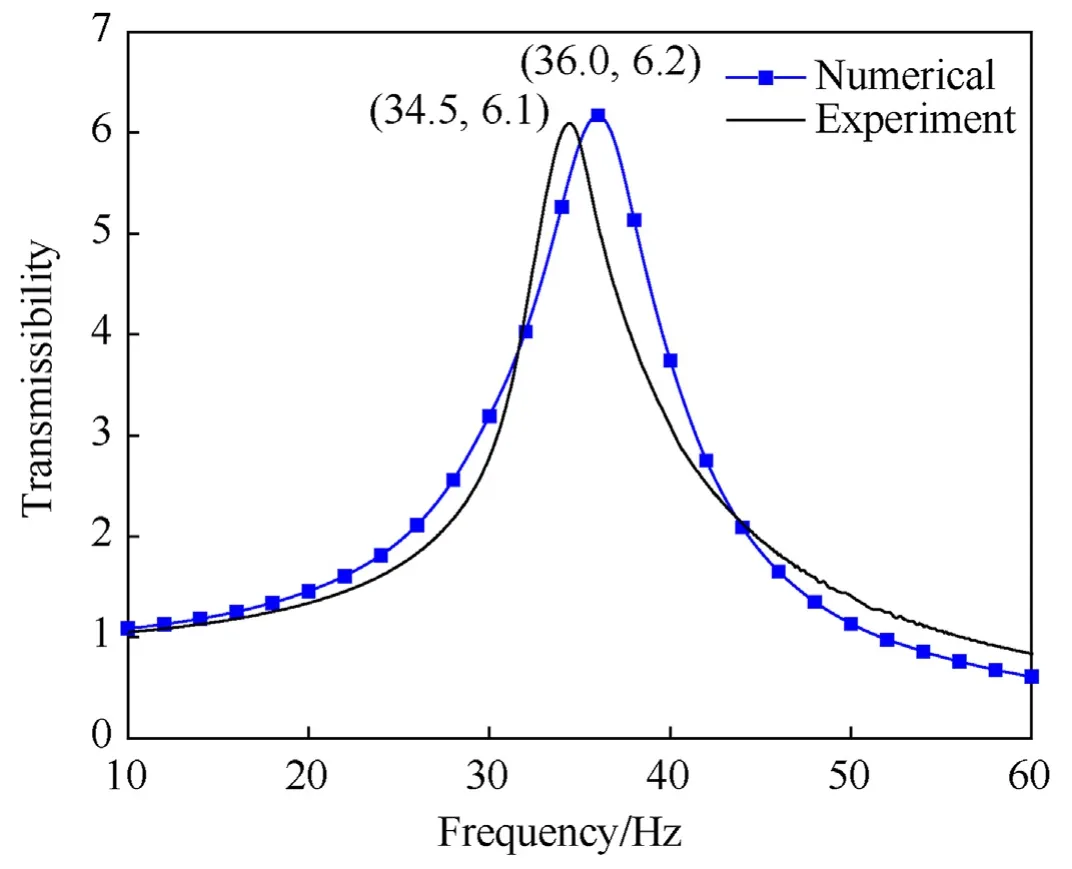
Fig.16.Experimental vs.numerical frequency response with updated damping.
The response shown in Fig.16 is obtained by scaling down the damping to 50% of the value obtained from DMA testing.The variation in natural frequency between FE analysis and experiment is 4.3% while the variation in peak transmissibility after scaling down the damping is 1.9%.The same scaling factor for damping is applied for random response study of Type-A isolator.The experimental frequency response of the isolator shows a small peak at around 860 Hz.Resonance at such a high frequency suggests that it might be due to the highly stiff components of the isolator such as the steel base,cover and pin.A sharp dip is seen in the numerical frequency response as shown in Fig.17.The cut-off frequency is under-predicted numerically at 51.5 Hz against that observed experimentally at 56 Hz.
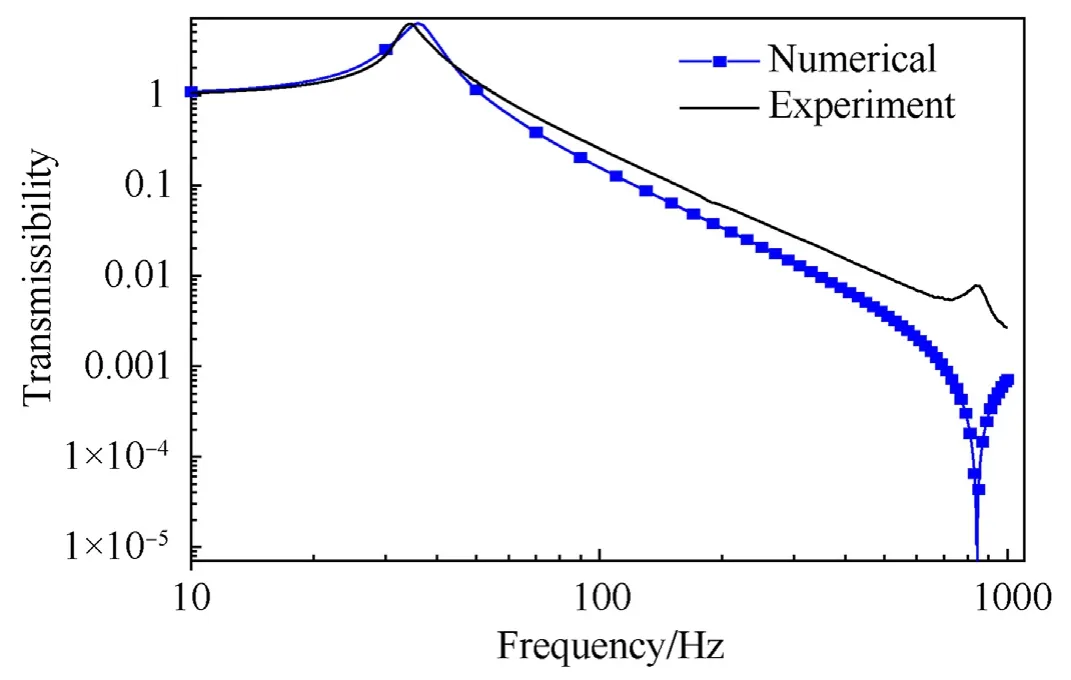
Fig.17.Frequency Response of Type -A Isolator: Numerical vs.Experiment.
Fig.18 shows the real and imaginary parts of the response and it can be seen that the real part of the response changes sign and goes to zero at resonance and the response is affected only by the imaginary part i.e.,the damping associated response.
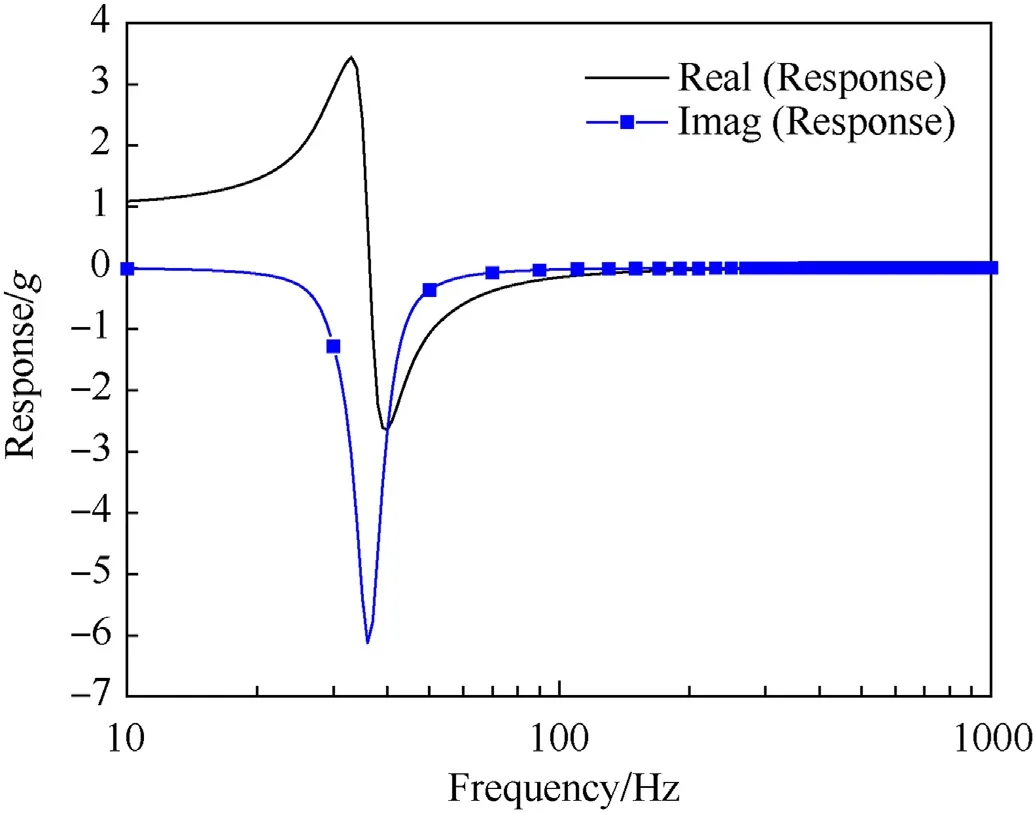
Fig.18.Real and imaginary parts of numerical frequency response.
In the present mathematical model,the damping properties of steel are not considered,hence both the real and imaginary parts of response go to zero at the second resonance point,as shown in Fig.19.
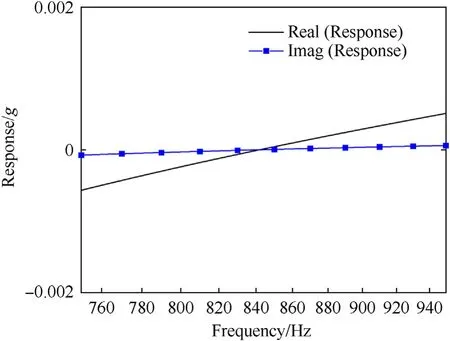
Fig.19.Real and imaginary parts of numerical frequency response at 840 Hz.
This leads to the response at this frequency being close to zero.In spite of this,as can be seen from Fig.17,that the response at such high frequencies is very low and this mismatch in transmissibility is considered acceptable here.This behaviour of the numerical result is further noticed in the random response studies as well.
The material properties for the compound VPM2-450B are obtained up to 5% Υd.It is noticed that there is good match in the natural frequency with properties at 1%Υdand the higher dynamic strain data is not used.The numerical frequency response is shown in Fig.20.
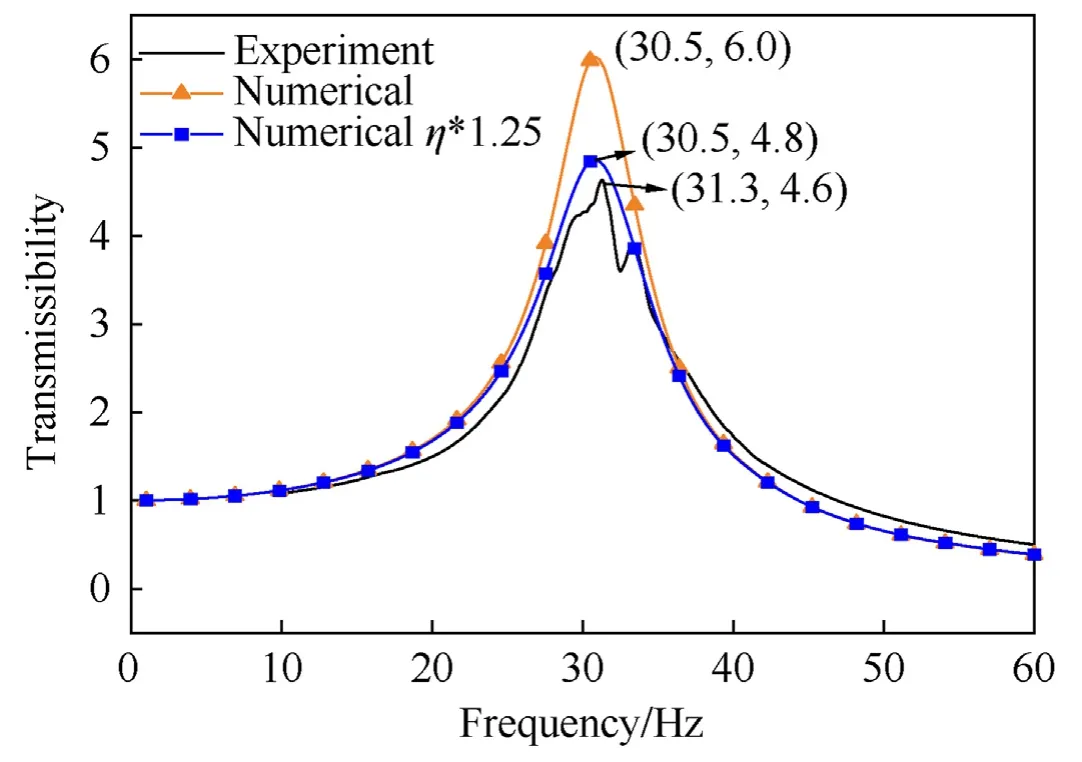
Fig.20.Numerical vs.experimental frequency response of type -B isolator.
The correction factor for damping applied in this case is 1.25.The variation in natural frequency is0.92%and that in peak transmissibility is4.5%.The numerical response is compared with that from the experiment and is presented in Fig.21.The cut-off frequency obtained numerically is 44.5 Hz,while the experimentally observed value being 47 Hz.It can be inferred that the cut-off frequency is under-predicted with the current mathematical model.
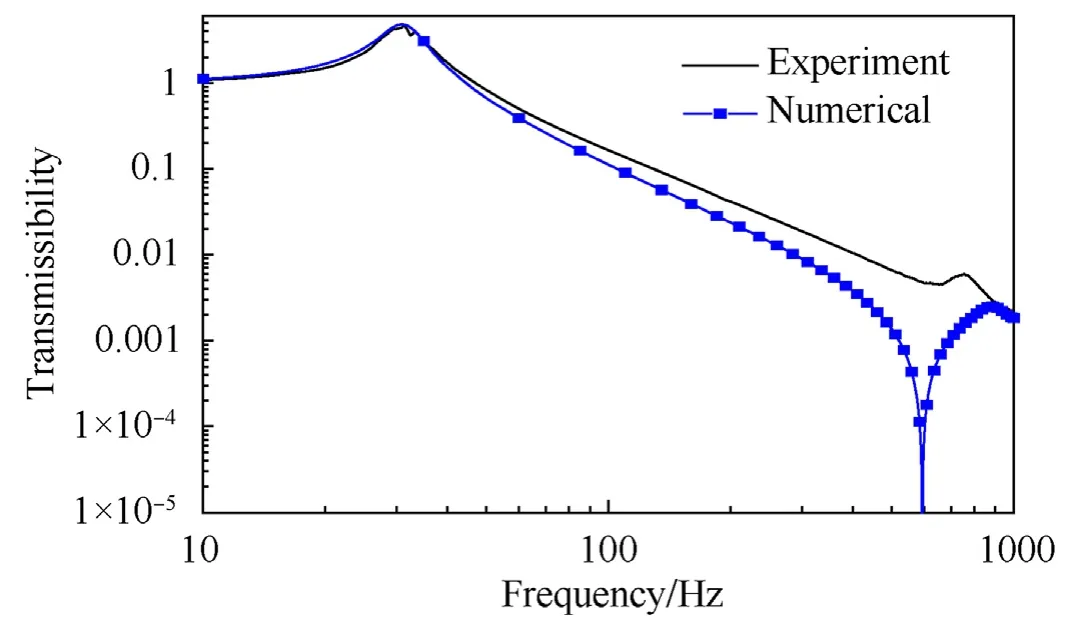
Fig.21.Frequency response of type -B isolator: numerical vs.experiment.
6.3.3.Experimental random response
Experiments were done with three different isolators of Type-A and Type-B with excitation having same power spectral density and an RMS value of 13.5 g.The response RMS is listed in Table 6.6.3.4.Comparison of random response results
The power spectral density of the excitation,with an RMS value of 13.5 g,and the corresponding response are shown in Fig.22 and Fig.23 in comparison with the numerical results,where,‘Control Input’is the input PSD.The FE model used for obtaining the random response is the same as described in frequency response.
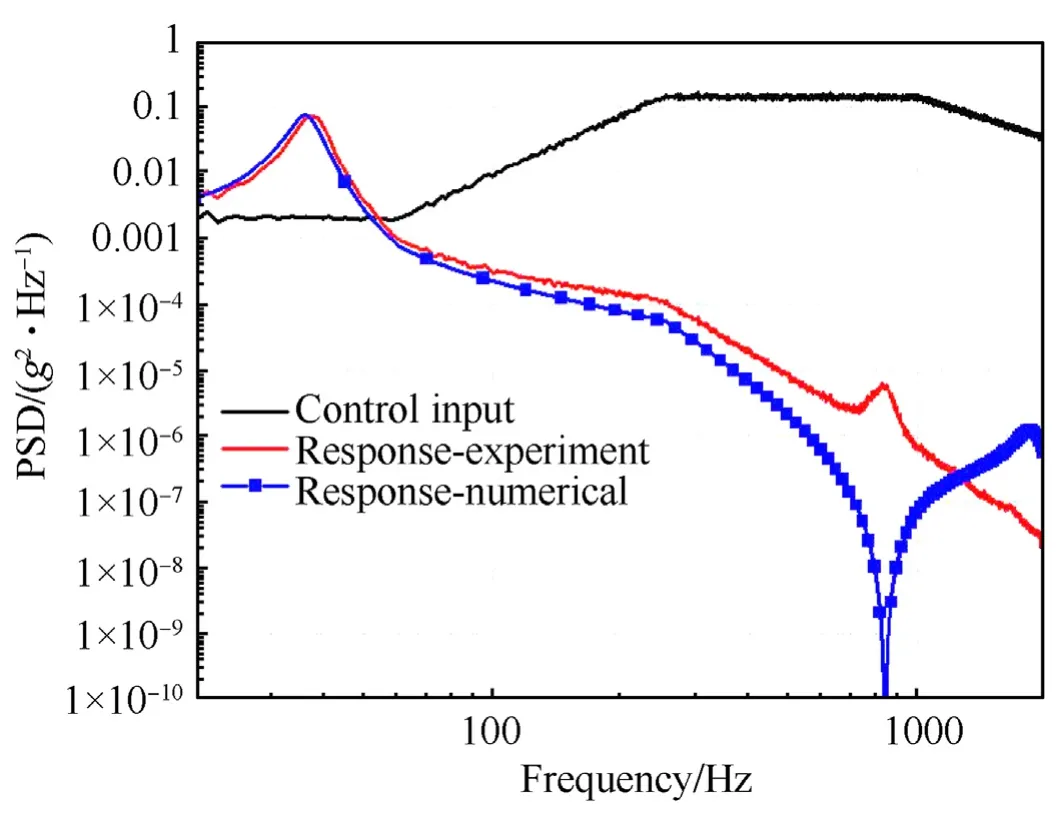
Fig.22.Random Response of Type -A Isolator: numerical vs.experiment.The response RMS obtained numerically is 0.8538 g with an error of 2.7% with respect to the experimental mean,which is 0.8629 g.The comparison of numerical and experimental random response for type-B isolator is shown in Fig.23.
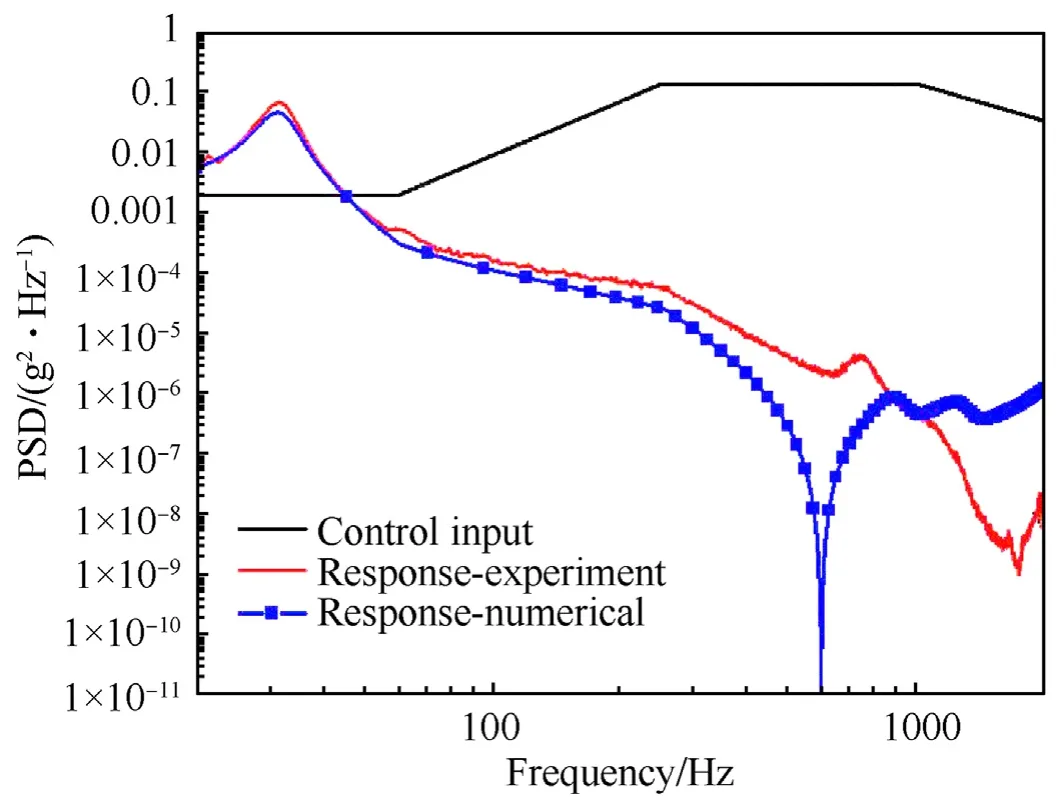
Fig.23.Random Response of Type -A Isolator: numerical vs.experiment.
The response RMS obtained numerically is0.673with an error of 14.5%with respect to the experimental mean,which is0.7872 g.
7.Conclusions
An improved material model for elastomers and a finite element formulation for frequency domain analysis of the vibration isolators is presented.The dynamic analyses are carried out using a mathematical model based on Yeoh hyper-elastic material model modified to handle preload and frequency dependence.The material data obtained from uniaxial tension test and DMA tests are used for the mathematical model generation.The frequency response of both type-A and type-B isolators are computed numerically and with material properties obtained at all Υdvalues.It is observed that for type-A isolator,the properties obtained at 6.6% Υdgive a close match in natural frequency of the isolator obtained experimentally.For type-B isolator,a match in natural frequency is obtained with material properties at 1% ΥdHowever,in both cases the error in the computed peak transmissibility is high,and hence a suitable damping correction factor is applied to the loss factor measured with the DMA,to match the numerically computed transmissibility with the experiments.This is done in order to compute the random response of the isolators with good accuracy.With the corrected loss factor,the random response of the isolators is computed numerically and compared with experiments.A good match in the response RMS between the numerical and experimental values is observed.Frequency response and random response matches well between 10 and 60 Hz after a suitable damping correction.The reason for this match can be attributed to the dynamic elastomeric constants that are obtained only up 60 Hz,but for higher frequencies the same material constants are being used and the deviation in the numerical simulations are well observed in the response graph.The system matrix is close to singularity at higher frequencies,which is due to assumption of zero damping of steel parts.
The approach presented in this paper can be used for predicting the vibration response of equipment mounted using elastomeric vibration isolators in aerospace vehicles,where random excitations are generally encountered on statically loaded systems.Similar such approach can be suitably adopted for other FE model depends on as is where is basis.
Declaration of competing interest
The authors declare that they have no known competing financial interests or personal relationships that could have appeared to influence the work reported in this paper.
Acknowledgements
The authors like to gratefully acknowledge the contributions of Shri S Sai Sandeep Kumar,Dr RS Rajeev and Shri S Chandramouli of VSSC,ISRO.The authors would like also to thank Dr S Unnikrishnan Nair,Director,VSSC,ISRO for his unwavering support in carrying out this work.
- Defence Technology的其它文章
- Structural design of the fluted shaped charge liner using multi-section optimization method
- An aerial ammunition ad hoc network collaborative localizationalgorithm based on relative ranging and velocity measurement in a highly-dynamic topographic structure
- Molecular simulation study of the stabilization process of NEPE propellant
- Damage assessment of aircraft wing subjected to blast wave with finite element method and artificial neural network tool
- Experimental and numerical studies of titanium foil/steel explosively welded clad plate
- Effects of connection types and elevated temperature on the impact behaviour of restrained beam in portal steel frame

