ldentification of hub genes for glaucoma: a study based on bioinformatics analysis and experimental verification
Rui-Ling Xie, Hai-Yan Nie, Yu-Xin Xu
1Department of Ophthalmology, Anhui Public Health Clinical Center, the First Affiliated Hospital of Anhui University North District, Hefei 230000, Anhui Province, China
2Department of Ophthalmology, the Second Hospital of Anhui Medical University, Hefei 230000, Anhui Province, China
Abstract● AlM: To explore hub genes for glaucoma based on bioinformatics analysis and an experimental model verification.
● KEYWORDS: glaucoma; biomarkers; hub genes
INTRODUCTION
G laucoma, the second leading cause of blindness, is a group of chronic progressive optic nerve diseases[1].It is estimated that 111.8 million people will have glaucoma due to the expansion of the ageing population in 2040[2].Currently, lasers therapy, and drugs are the main treatments for glaucoma[3-5].But other diseases are induced in the treatment of glaucoma, such as corneal endothelial cell loss, causing corneal decompensation[6].Therefore, it is extremely important to further explore the molecular mechanisms and therapeutic targets of glaucoma.
Glaucoma is characterized by loss of retinal ganglion cells,thinning of the retinal nerve fiber layer, and progressive depression of the optic nerve disc[7].Elevated intraocular pressure(IOP) is the most important predisposing factor for glaucoma[8].Glaucoma is influenced by genetic factors.Early-onset, which occurs before age 40, is associated with Mendelian inheritance,and adult-onset glaucoma has complex genetic features[9].Mutations inOPTNandTBK1account for approximately 2%-3% of familial normal-tension glaucoma, inducing patients to develop the disease before the age of 40y[10-11].In addition,the vascular endothelial growth factor (VEGF) family is a key inducer of corneal neovascularization, consisting of positive regulators of retinal angiogenesis[12-13].Studies have shown that VEGF-A gene showed significant changes in expression upon recovery from hypoxic tissue damage in retinal diseases and in proliferative vitreoretinopathy samples[14-15].
In recent years, with the rapid development of bioinformatics and high-throughput sequencing, a growing number of genes related to glaucoma have been identified.The GSE218153 gene expression profile in the Gene Expression Omnibus(GEO) database shows thatTIPARPis associated with IOP regulation[16].Margetaet al[17]found that Apoe and Galectin-3 are upregulated in the glaucomatous retina and during the transformation of microglia into a neurodegenerative phenotype, as revealed by high-throughput sequencing.Further study shows that diminished activation of APOE4 microglia offers protection in glaucoma, and targeting APOEGalectin-3 signaling presents a potential therapeutic strategy for this vision-impairing condition[18].However, the underlying molecular mechanisms are not fully understood and need to be further explored for better clinical application.
In this study, the GSE25812 and GSE26299 datasets from the GEO dataset were selected to analyze differentially expressed genes (DEGs).Hub genes were identified by bioinformatics analysis.Hub gene expression was experimentally validated by constructing a mouse model of glaucoma.This study may provide new biomarkers and therapeutic targets for glaucoma.
MATERIALS AND METHODS
Ethical ApprovalAll experimental protocols were approved by the Animal Ethics Committee of Anhui Medical University.(No.LLSC20221257).All methods were carried out in accordance with the Guide for the Care and Use of Laboratory Animals.All methods are reported in accordance with ARRIVE guidelines for the reporting of animal experiments.The study was carried out in accordance with the relevant guidelines and regulation.
Microarray Data SourceWe selected the GSE25812(GPL6887, Illumina MouseWG-6 v2.0 expression beadchip)and GSE26299 [GPL1261, (Mouse430_2) Affymetrix Mouse Genome 430 2.0 Array] datasets from the GEO database.Three non-glaucomatous samples and three glaucomatous samples in the GSE25812 dataset were selected.Ten nonglaucomatous samples and ten glaucomatous samples in the GSE26299 dataset were chosen for analysis.
Identification of Differentially Expressed GenesThe GSE25812 and GSE26299 datasets were analyzed using the GEO2R tool (www.ncbi.nlm.nih.gov/geo/geo2r).The overlapping DEGs of the two datasets were identified by plotting the Venn diagram (http://jvenn.toulouse.inra.fr/app/example.html).
Functional Enrichment Analysis of Differentially Expressed GenesGene Ontology (GO) functional enrichment analysis and Kyoto Encyclopedia of Genes and Genomes (KEGG)pathway enrichment analysis for the overlapping DEGs were performed in the Database for Annotation, Visualization, and Integrated Discovery database (https://david.ncifcrf.gov/).Box plots and bubble plots for the top 6 GO terms and the top 8 KEGG pathways based onP-values were then plotted using the cluster Profiler package in R software (version 3.6.1).
Construction of the Protein-Protein Interactions Network and Identification of Hub GenesThe DEGs were analyzed using the STRING (https://www.string-db.org/) online database to predict the interaction relationships between proteins encoded by DEGs.For the significance criteria, the confidence interaction score was set at 0.15.The proteinprotein interactions (PPI) network was visualized using Cytoscape software (version 3.9.1).Hub modules were identified using the Molecular Complex Detection (MCODE)plug-in.The screening criteria were: Degree cutoff ≥2, node score cutoff ≥0.2, K-core ≥2, and max depth=100.
为验证上述分析,本文针对性地进行了大量前期的地铁站台现场测试工作,后期将联合地铁消防支队进行后期测试工作。测试环境覆盖了地铁站台的上下楼梯、拐弯通道、直行通道、进站闸机大厅和列车到站站亭等区域,时间跨越24:00至09:00高峰时段。
Analysis of Hub GenesWe mapped the ridge plot of hub genes expression as well as screened for diagnostic biomarkers of glaucoma by receiver operating characteristic (ROC)curves analysis and principal component analysis (PCA).The corresponding area under the ROC curve (AUC) greater than 0.5 was considered to be significant.An interpretation rate of greater than 50% for the PC axis was considered significant.
Construction of a Model Mouse for GlaucomaWe induced glaucoma in the eye of mice by injecting magnetic microbeads[19].C57 mice (6-8 weeks old, weighing 18-20 g, SPF Biotechnology Co.Ltd., Beijing, China) were used to generate the glaucoma models.Two days before the anterior chamber injection, mice were treated with ofloxacin hydrochloride eye drops (H20067760, Shanglinag Pharmaceutical, Jiangxi Province, China) for against infection.The eyes of the mice were dilated with compound tropicamide drops (J20180051,Santen, Pharmaceutical, Osaka, Japan), and then injected with intramuscular injection of Zoletil 50 [8ADTA, Virbac Trading(Shanhai), Shanhai, China] and xylazine hydrochloride injection (20210308, Fangzheng, Pharmaceutical, Jilin, China),at doses of 10 and 4 mg/kg, respectively, for general anesthesia and corneal surface anesthesia.Approximately l-2 mm away from the cornea at the corneoscleral limbus of the mice, an insulin syringe with a needle diameter of 30 G (Yeso-med,Wuxi, China) was injected into the anterior chamber with 20 μL of a suspension of silica magnetic beads (Knowledge & Benefit Sphere, Suzhou, China) at a concentration of 50 mg/mL.The mice were then placed intraoperatively with their eyes up on a warming pad and cared for until awakening.After 14d, mice were anesthetized by intraperitoneal injection of Zoletil 50 and xylazine hydrochloride injection.After cervical dislocation execution, the eyes of the mice were immediately removed and immersed in paraformaldehyde.
Hematoxylin-Eosin StainingTissue from each group of mouse eye tissue was taken and placed in 4% paraformaldehyde solution for fixation.After dehydration in ethanol, the tissue was embedded in paraffin impregnation and sectioned to 4 microns for hematoxylin-eosin (HE) staining.The mouse eye tissue physiological changes were observed under a light microscope (OLYMPUS, Japan) and photographed.
Real-time Reverse Transcriptase - Quantitative Polymerase Chain Reaction AssayWe have referred to the relevant literature for the specific experimental steps of reverse transcriptase - quantitative polymerase chain reaction (RTqPCR)[20].The primer sequences used are shown in Table 1.
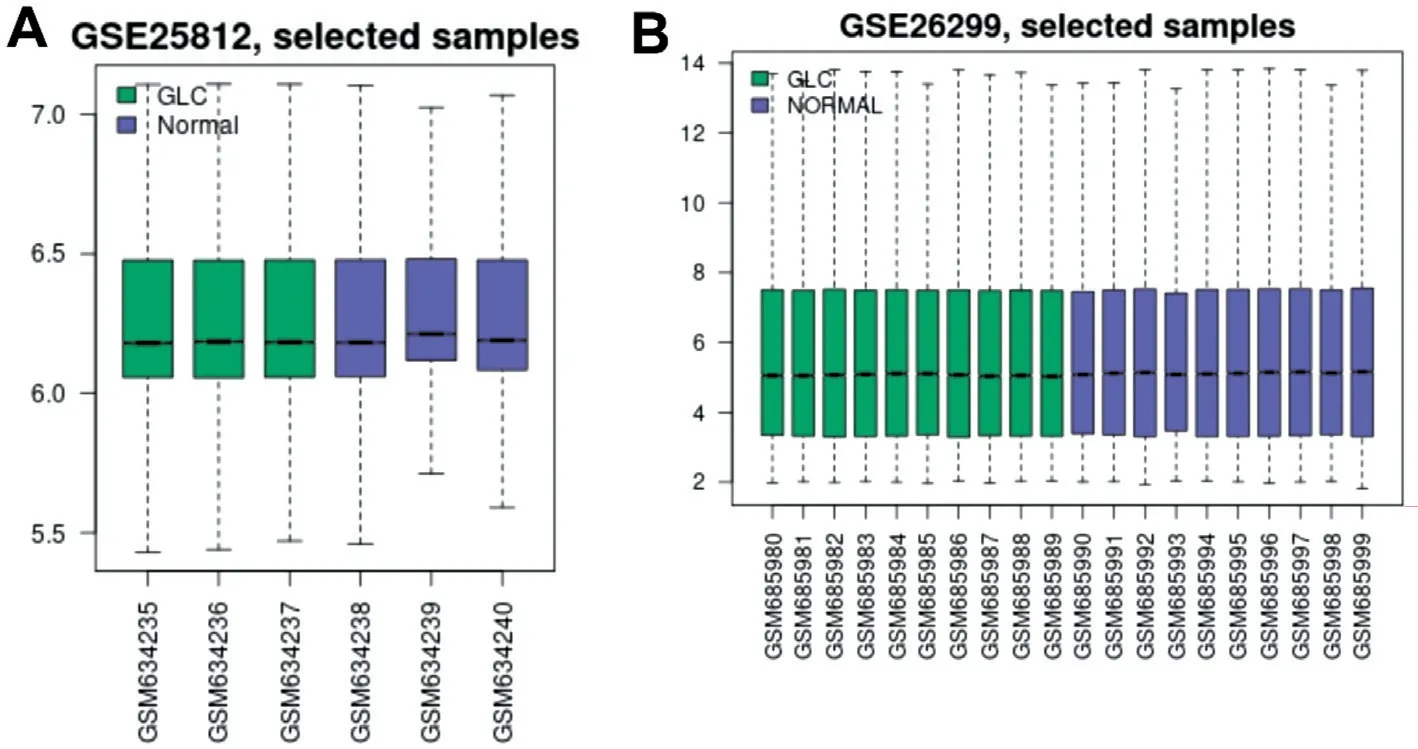
Figure 1 Normalization to samples in the GSE25812 and the GSE26299 datasets A: Cross-comparability evaluation of data set samples in the GSE25812; B: Cross-comparability evaluation of data set samples in the GSE26299 dataset.
Statistical AnalysisGraphPad Prism 9 (version 9.5.0.730) was used to conduct the statistical analysis.To compare continuous variables between the two groups, an unpairedt-test was conducted.P<0.05 was regarded as statistically significant.
RESULTS
Identification of Differentially Expressed GenesGSE25812 and GSE26299 datasets were downloaded from the GEO database to screen DEGs.The GSE25812 dataset contains 6 samples: 3 non-glaucomatous samples (control) and 3 glaucomatous samples (model).Meanwhile, the GSE26299 has 20 samples, including 10 non-glaucomatous samples (control)and 10 glaucomatous samples (model).We first standardized the read counts for each sample in GSE25812 and GSE26299 datasets.The findings revealed that the median values are nearly identical for each sample (Figure 1A: GSE25812,Figure 1B: GSE26299), demonstrating that the GSE25812 and GSE26299 datasets fit the criteria for further research.There were 1737 DEGs in the GSE25812 dataset, of which 742 were up-regulated, and 995 were down-regulated (Figure 2A).In the GSE26299 dataset, there were 1532 DEGs, including 647 upregulated genes and 885 down-regulated genes (Figure 2B).Then we plotted the heatmap of the top 25 up-regulated and down-regulated genes (Tables 2 and 3) according toPvalue in the GSE25812 and GSE26299 datasets (Figure 2C and 2D).Venn diagram showed that there were 128 overlapping DEGs for GSE25812 and GSE26299 datasets (Figure 3).
Functional Enrichment Analysis of Overlapping Differentially Expressed GenesGO annotation analysis and KEGG pathway analysis was performed in the DAVID database to explore the potential molecular functions of the overlapping DEGs.According toP-value, the top 6 GO terms with the most significant enrichment were picked out, and the results were shown in the bubble plot of GO enrichment analysis (Figure 4A).The results showed that in the MFcategory, the DEGs primarily had an essential correlation with protein kinase binding, protein serine/threonine kinase activity and metal ion binding.For the BP category, the DEGs were mainly involved in neural crest cell migration, vasodilation and TOR signaling.For the CC category, the DEGs were mainly enriched in the cell surface, nucleoplasm and endoplasmic reticulum.According to p-value, the top 8 KEGG pathways with the most significant enrichment were picked out, and the results are shown in the bubble plot of KEGG pathways enrichment analysis (Figure 4B).The results showed that the DEGs were mainly enriched in expression and PD-1 checkpoint pathway in cancer, cell adhesion molecules and Ras signaling pathway.
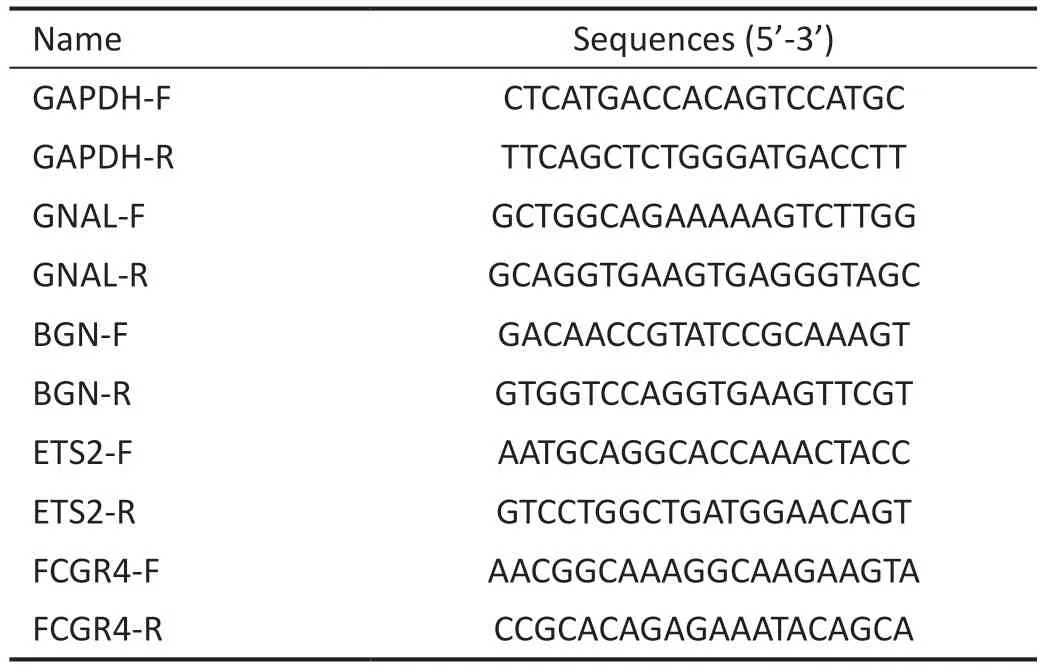
Table 1 Primer sequence information used in this study
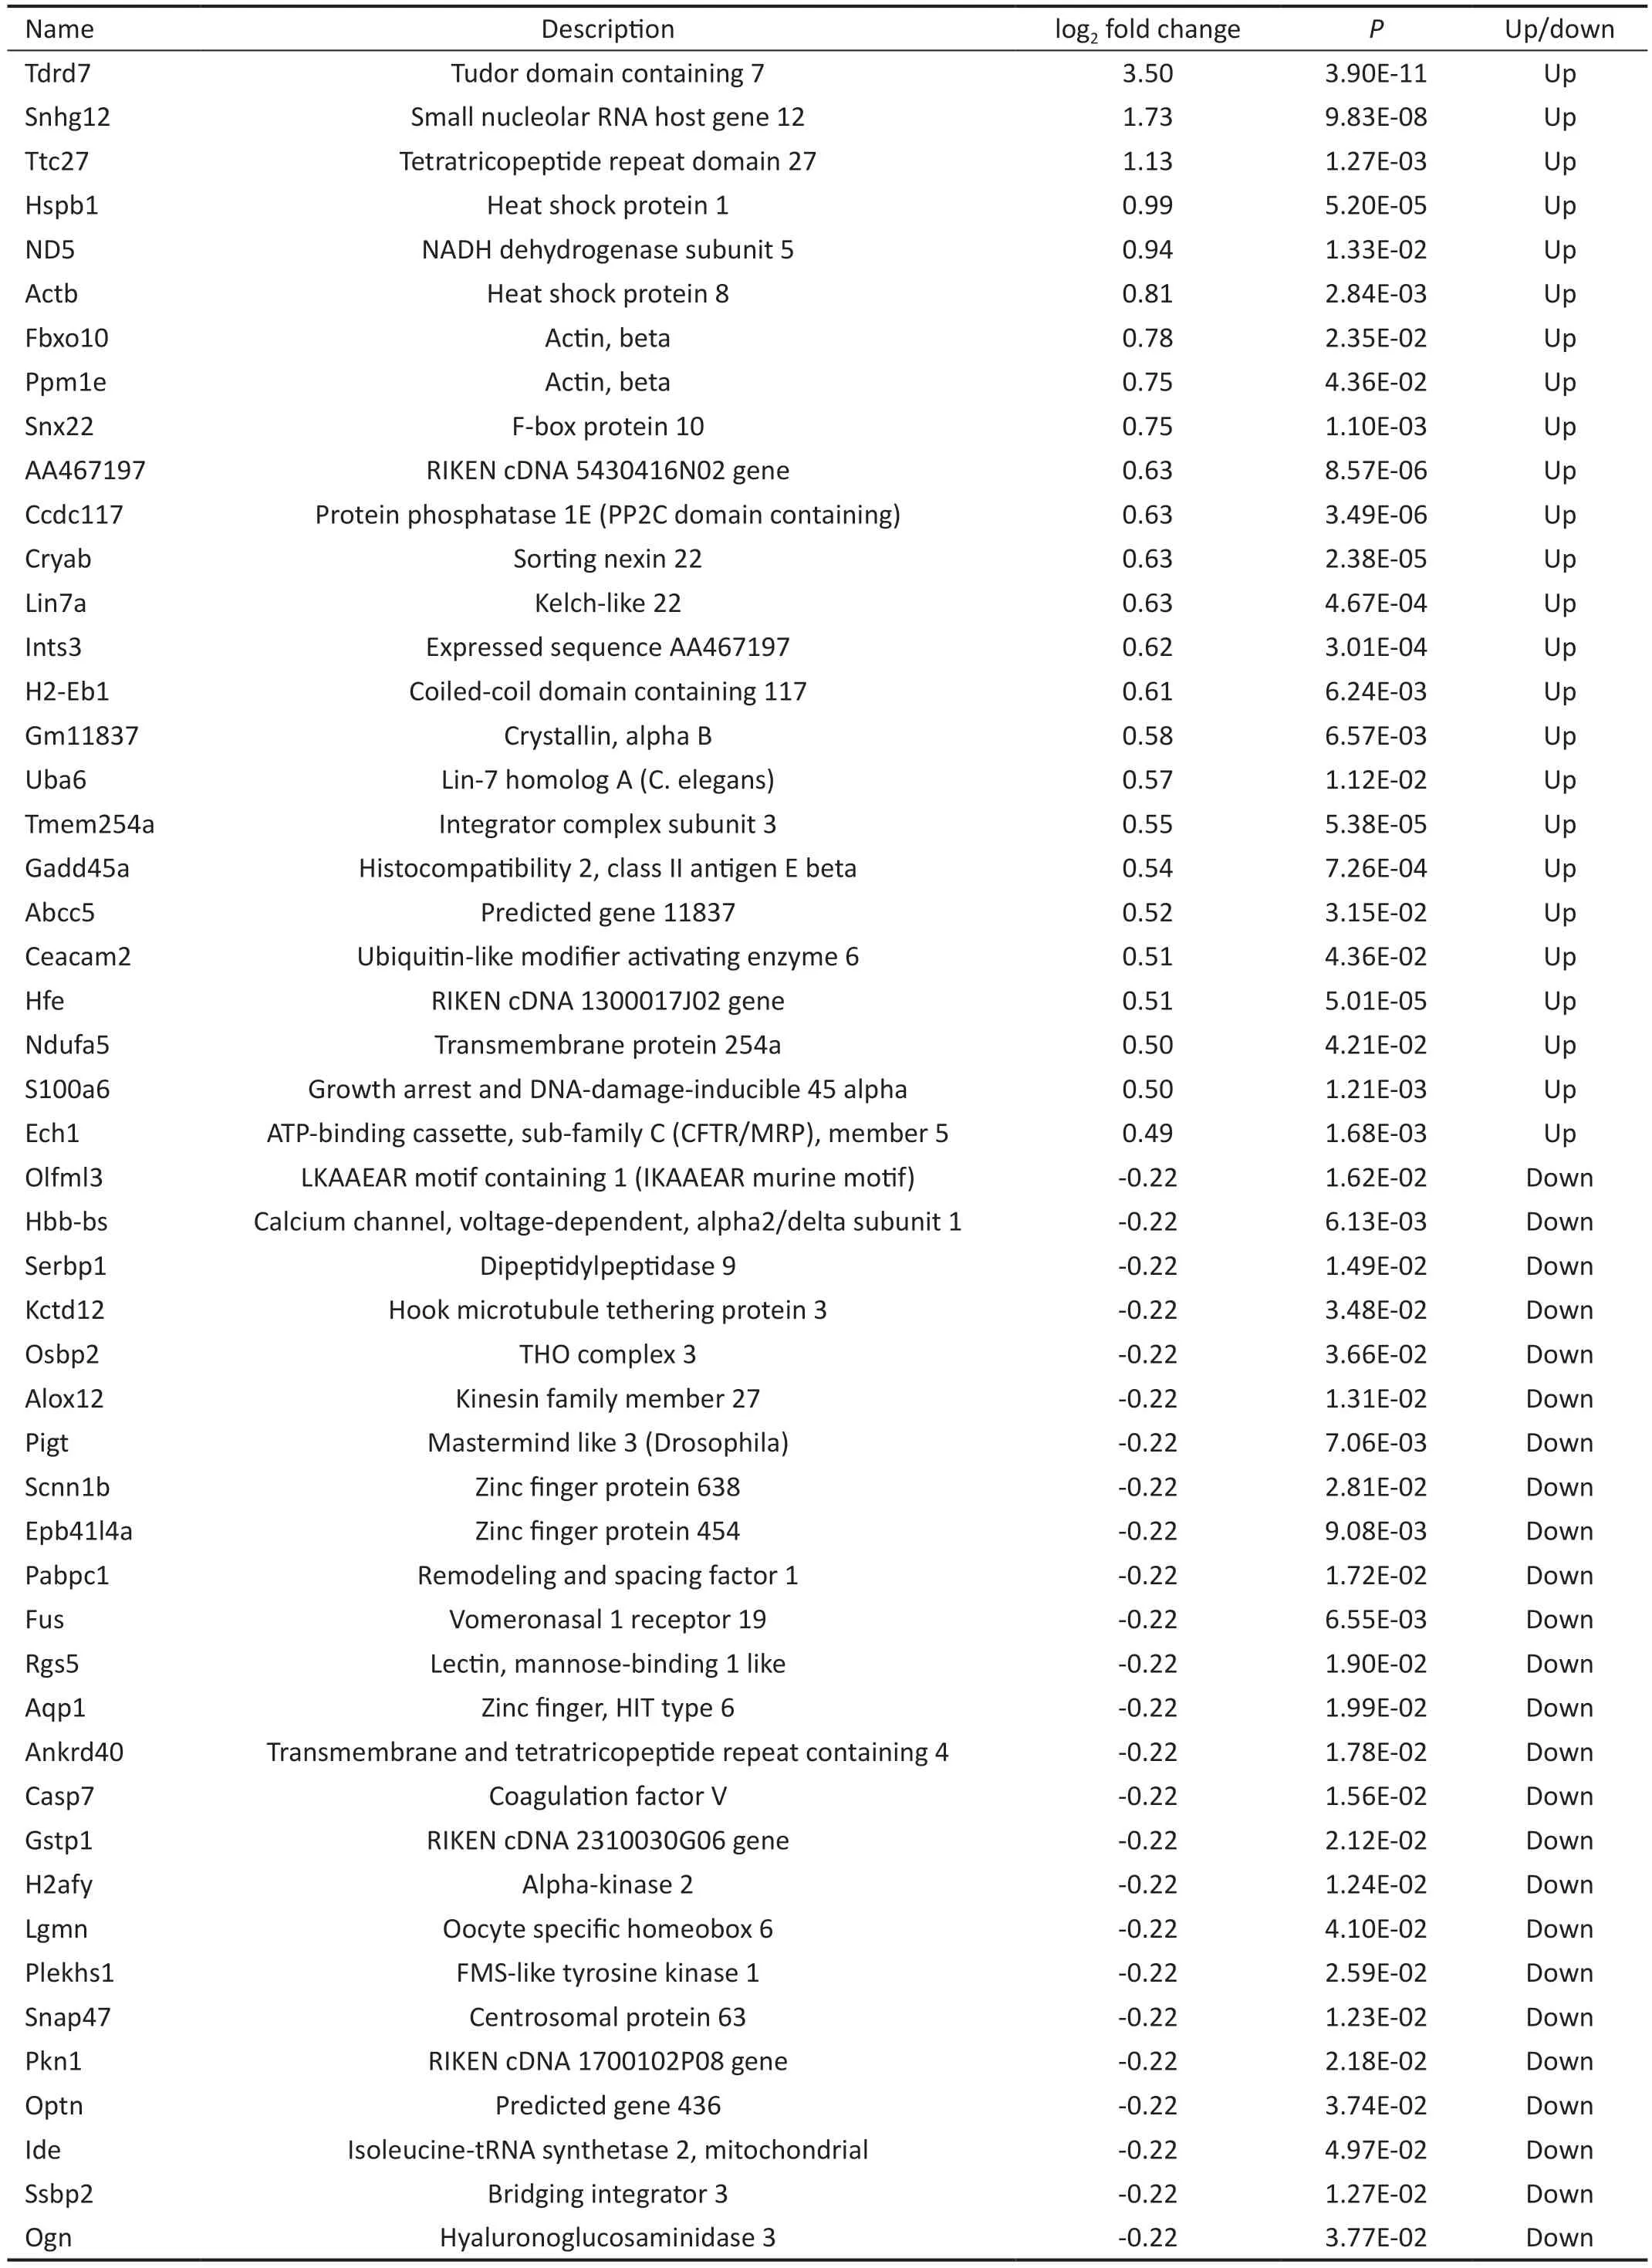
Table 2 The top 25 DEGs of the up-regulated versus down-regulated genes in the GSE25812 dataset
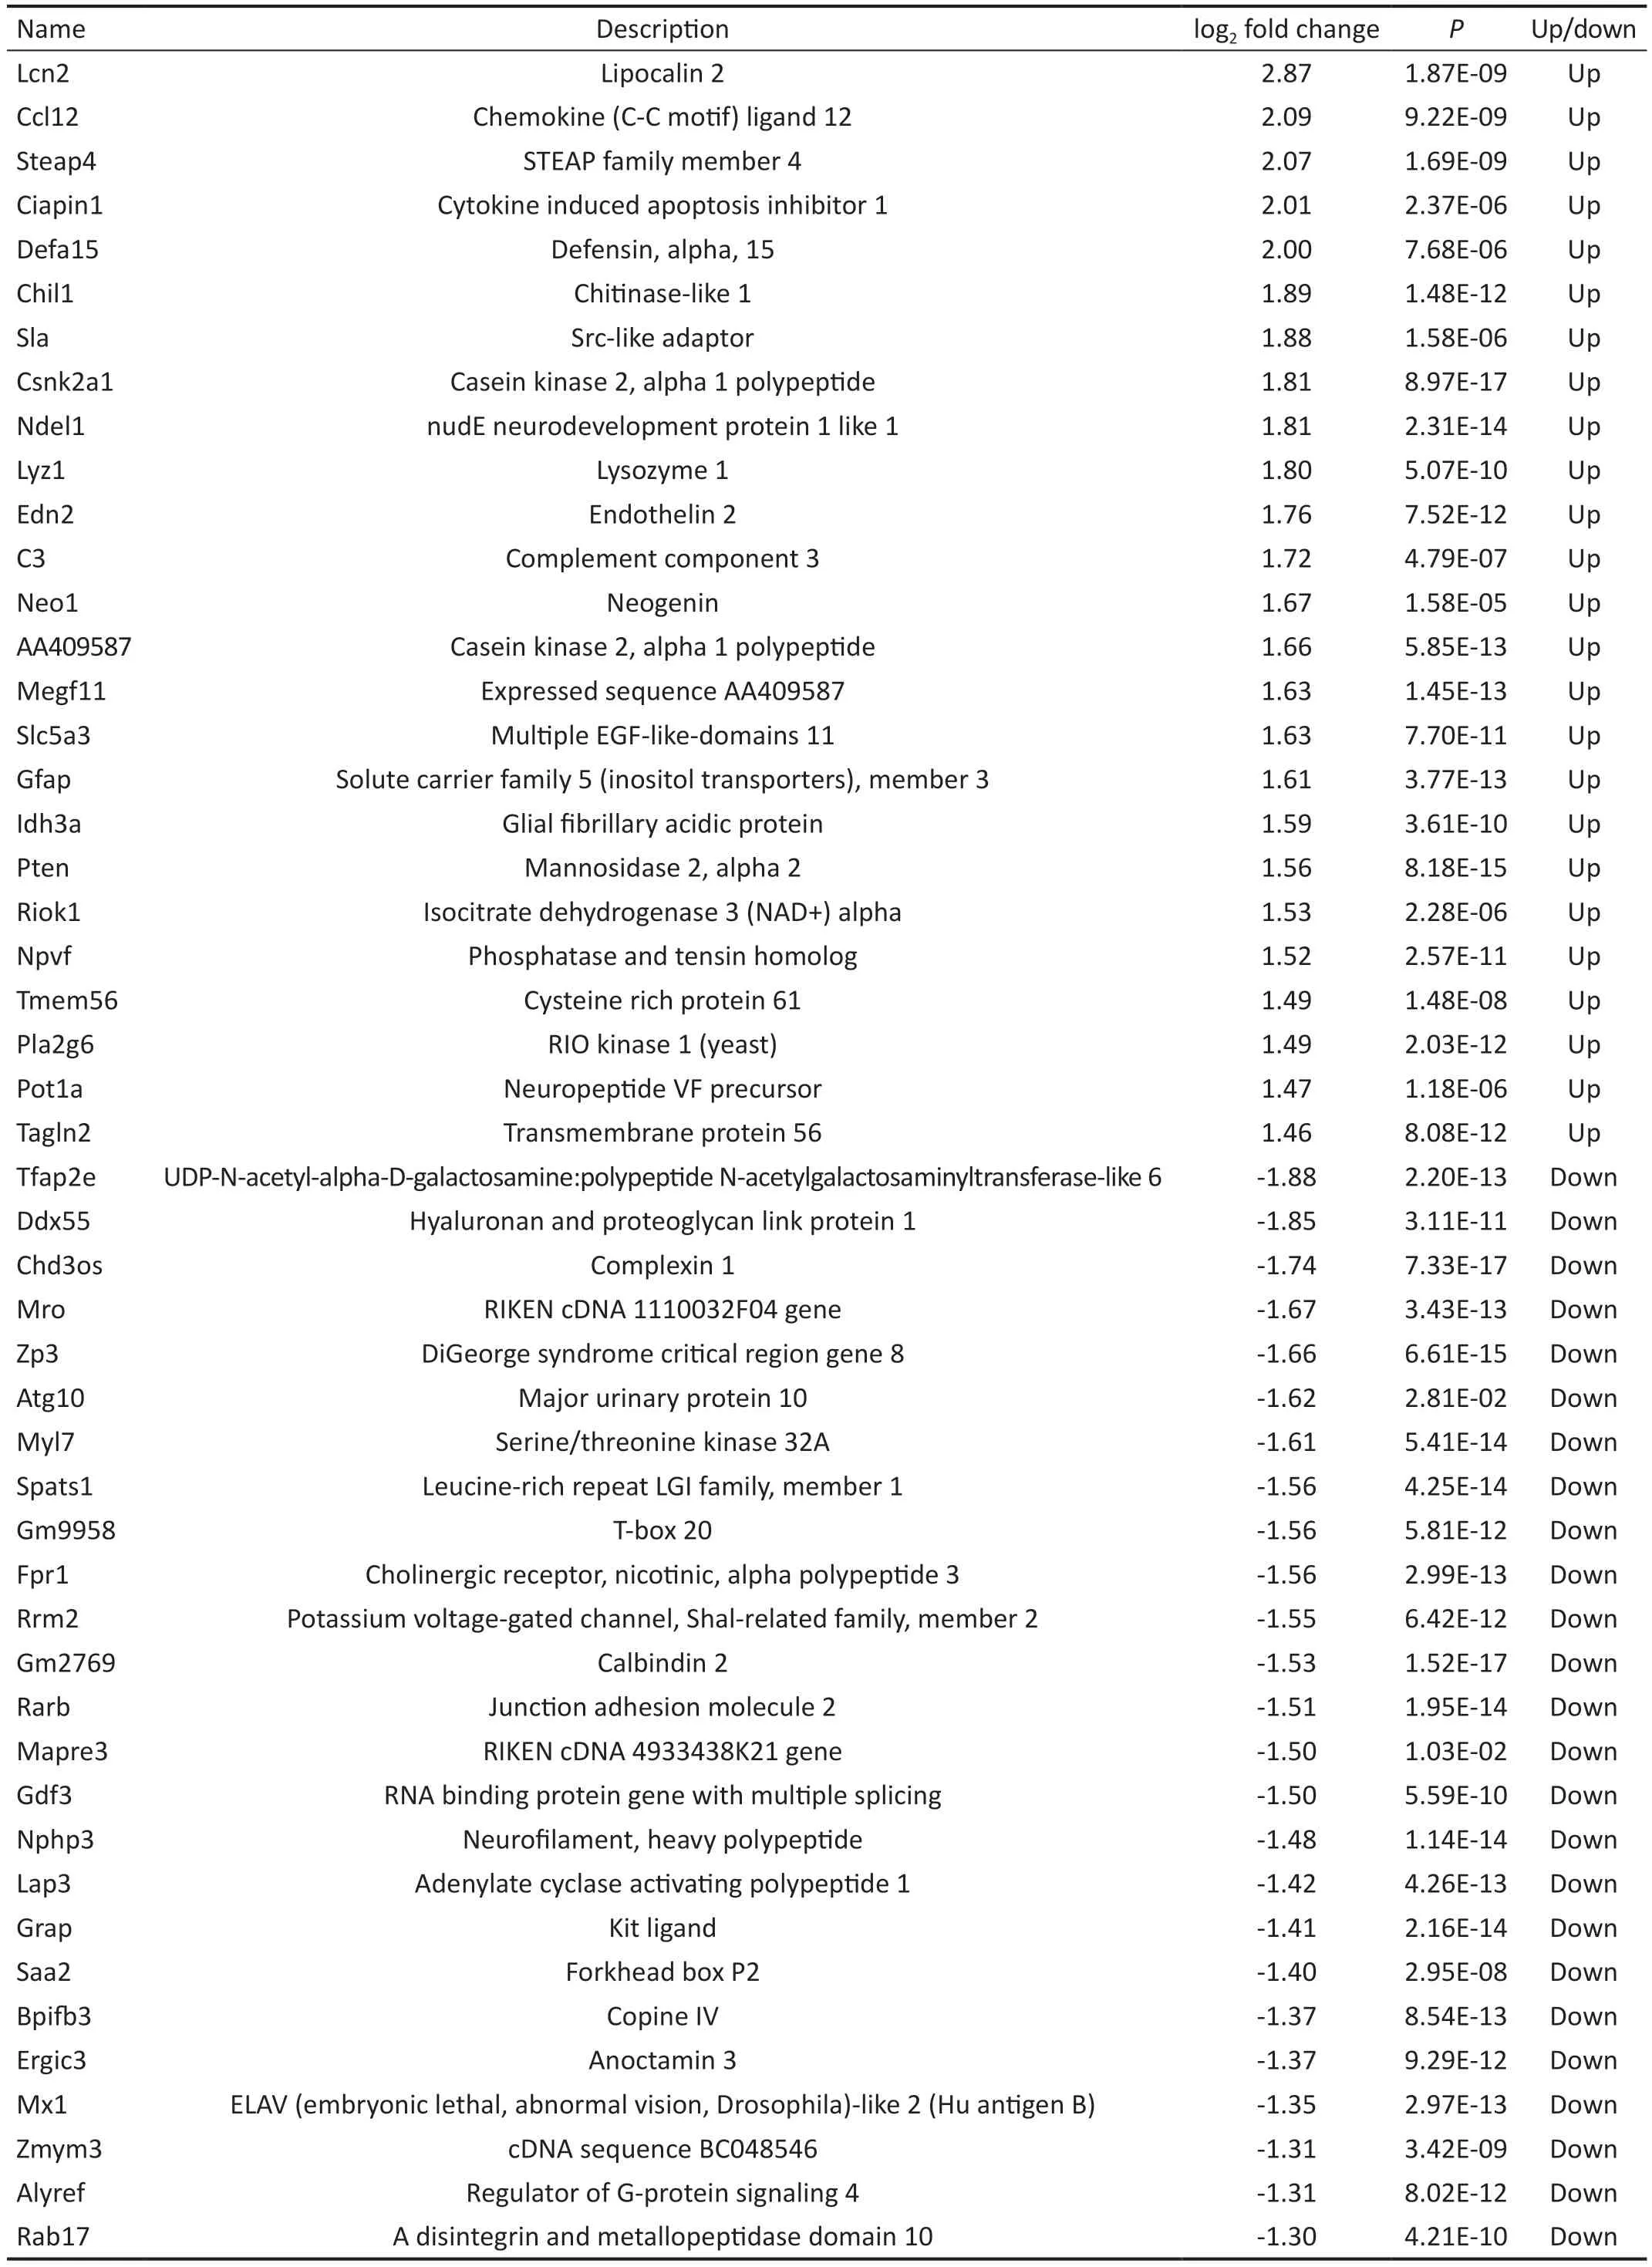
Table 3 The top 25 DEGs of the up-regulated versus down-regulated genes in the GSE26299 dataset (continued)

Figure 2 Identification of DEGs for glaucoma A: Volcano plot of DEGs in the GSE25812 dataset.Red dots represent up-regulated genes in the group, and blue dots represent down-regulated genes in the group.B: Volcano plot of DEGs in the GSE26299 dataset.C: Heatmap of the up-regulated versus down-regulated genes ranked the top 25 in the GSE25812 dataset.Red represents highly expressed genes, and blue represents lowly expressed genes.D: Heatmap of the up-regulated versus down-regulated genes ranked the top 25 in the GSE26299 dataset.DEGs: Differentially expressed genes.

Figure 3 Venn diagram for overlapping DEGs in GSE25812 and GSE26299 dataset DEGs: Differentially expressed genes.
Biomarkers of Nine Hub Genes for GlaucomaBased on the GSE25812 dataset, the ridge plot of hub genes expression were mapped by the ggridges packages in R software.The results showed that among nine hub genes, the data distribution of MMP15 and STAT1 is relatively dense, and STAT1 had the highest expression.The sample size expressing FCGR4 was the largest (Figure 7).We plotted the ROC curve for nine hub genes by the pROC packages in R software, according to the GSE25812 dataset.The results showed that the AUC values of nine hub genes were greater than 0.8 (Figure 8A-8E),indicating that they could be used as diagnostic biomarkers for glaucoma.Then we performed PCA on nine key genes.Figure 9 showed that a total of two PC axes are generated, including PC1 and PC2.PC1 explained the vast majority of the variance(70.5%), while PC2 provided a lower rate of explanation(11.3%; Figure 9), which illustrating that PC1 could be used to distinguish the glaucoma from the normal eyes.
Construction of a Mouse Model for GlaucomaNext, we constructed a mouse model for glaucoma.HE staining showed that in the control group, ocular tissues such as atrial angle and retina were normal.However, the model group exhibited some ocular hypertension induced retinopathy, such as retinal atrophy and thinning, disorganized cells in the inner and outer nuclear layers, and significantly fewer retinal ganglion cells(Figure 10).
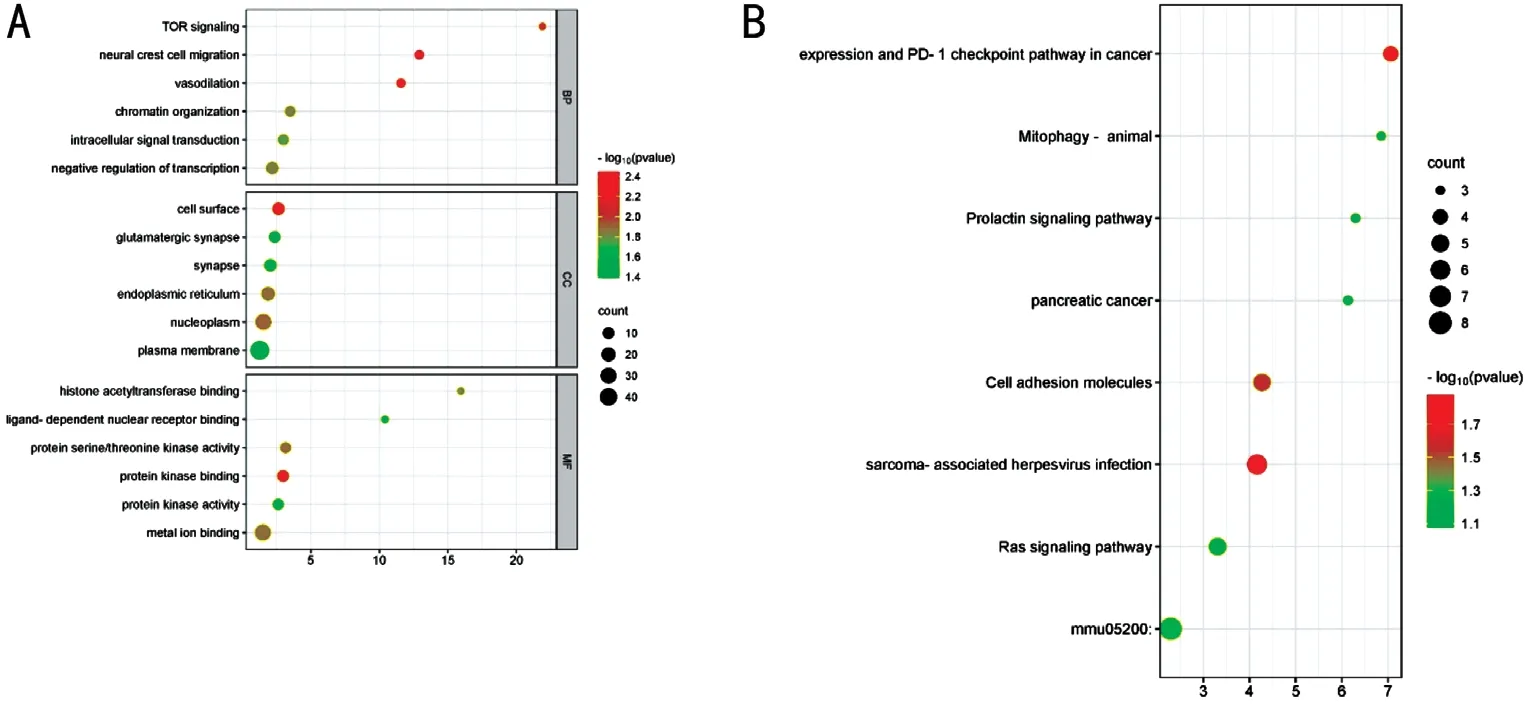
Figure 4 GO annotations and KEGG pathways for overlapping genes A: The top 6 items of the GO annotations are illustrated in a bubble plot.B: The top 8 KEGG pathways are illustrated in a bubble plot.GO: Gene Ontology; KEGG: Kyoto Encyclopedia of Genes and Genomes.

Figure 5 The PPI network of the overlapping DEGs DEGs:Differentially expressed genes; PPI: Protein-protein interactions.

Figure 6 The hub modules of the overlapping DEGs DEGs:Differentially expressed genes.
Validation of mRNA Expression of Nine Hub GenesWe then performed RT-qPCR to validate the expression of nine genes in glaucoma.The results showed that the mRNA expressions of BGN, ETS2, FCGR4, STAT1,TSPAN8 and VCAM1 were significantly elevated in the model groups compared with the control groups.while the mRNA expressions of GNAL, MAPK10 and MMP15 were significantly decreased (Figure 11).Figure 7 The expression abundance analysis of hub genes The horizontal coordinates represent the amount of gene expression,the shape of the peaks indicates the dispersion between a set of data, and the vertical coordinates represent the number of samples corresponding to the amount of gene expression.
DISCUSSION
The pathophysiology of glaucoma is frequently associated with hereditary factors.Genetic linkage analysis[21], whole exome sequencing[22]and genome-wide association study[23]are used to identify the genes that are responsible for glaucoma[24].In recent years, an increasing number of genes associated with glaucoma have been revealed.In the trabecular meshwork,the expression of BDKRB1 was significantly reduced after dexamethasone treatment[25].VEGF plays a crucial and possibly dominant role in the development of intraocular neovascularization and neovascular glaucoma[26].In the present study, we downloaded the datasets of GSE25812 and GSE26299 from GEO database and finally identified 9 key genes including GNAL, BGN, ETS2, FCGP4, MAPK10,MMP15, STAT1, TSPAN8 and VCAM1.The AUC curve area for the 9 key genes was greater than 0.8, and the PC1 axis composed of them had an interpretation rate of 70.5%to distinguish glaucoma from normal eyes.Moreover, the expression of BGN, ETS2, FCGR4, STAT1, TSPAN8 and VCAM1 was increased in the mouse model of glaucoma.Conversely, the expression of GNAL, MAPK10 and MMP15 was decreased.

Figure 8 ROC curve analysis of key genes A: GNAL; B: BGN; C: ETS2; D: FCGP4; E: MAPK10; F: MMP15; G: STAT1; H: TSPAN8; I: VCAM1.ROC:Receiver operating characteristic.
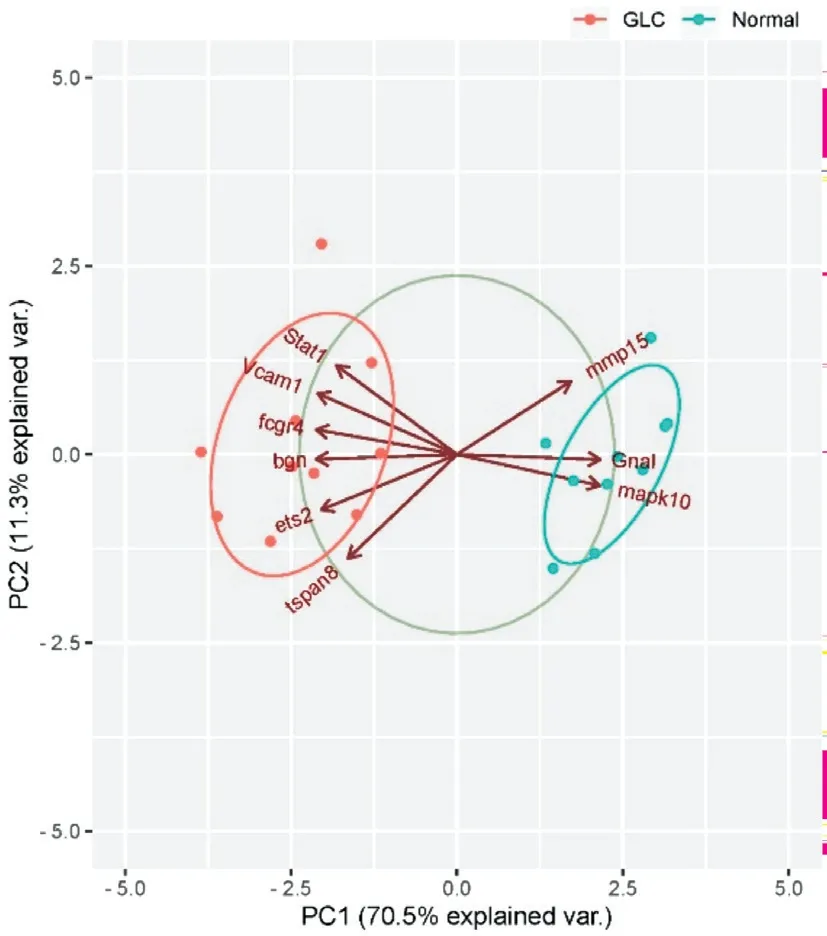
Figure 9 PCA analysis of key genes The coordinate axes PC1 and PC2 of the plot are the first and second principal components (rate of variance explained by latent variables).Dots represent samples and different colors indicate different groupings.PCA: Principal component analysis.

Figure 10 Histological changes in glaucoma was observed by HE staining HE staining: Hematoxylin-eosin staining.

Figure 11 Validation of mRNA expression of 9 hub genes A: RT-qPCR to detect mRNA expression levels of GNAL.B: BGN.C: ETS2.D: FCGR4.E:MAPK10; F: MMP15; G: STAT1; H: TSPAN8; I: VCAM1.aP<0.05, bP<0.01, cP<0.001.RT-qPCR: Real-time reverse transcriptase-polymerase chain reaction;GLC: Glaucoma.
In this study, a total of 128 overlapping DEGs were screened in the GSE25812 and GSE26299 datasets.The utilization of GO and KEGG functional enrichment analyses for DEGs facilitated the identification of genes associated with various biological processes.In the MF category, the DEGs primarily associated with protein kinase binding, protein serine/threonine kinase activity and metal ion binding.The previous study has shown that CDC42 binding protein kinase beta is associated with changes in the number of necrotic axons in the optic nerve[27].Rho kinase, a serine/threonine protein kinase, its inhibitors reduce IOPin vivoandin vitro[28].Moreover, a previous study showed that dithiocarbamates ligated with metal ions to exert an anti-glaucoma effect[29].In the BP category, the DEGs were mainly involved in neural crest cell migration, vasodilation and the target of rapamycin (TOR) signaling, which was consistent with previous findings[30-32].In the cellular components (CC)category, the DEGs were mainly enriched in the cell surface,nucleoplasm and endoplasmic reticulum, which might be related to the binding of signaling molecules, genetic alterations, and protein metabolic processes[33-34].In addition,KEGG enrichment analysis showed that the DEGs were mainly enriched in expression and PD-1 checkpoint pathway in cancer, cell adhesion molecules and Ras signaling pathway.Integrins, a group of cell adhesion molecules, are involved in the progression of ocular diseases[35].The reduction of IOP by Ras inhibitors is most probably by the reestablishment of the extracellular matrix (ECM) homeostasis[36].In addition,immune response plays an important role in glaucoma, and perhaps immune checkpoint inhibition is a new target for glaucoma treatment[37].
Further studies found that the expression of BGN, ETS2,FCGR4, STAT1, TSPAN8 and VCAM1 was increased in the mouse model of glaucoma.Conversely, the expression of GNAL, MAPK10 and MMP15 was decreased.GNAL, also known as G protein subunit alpha L, encodes a stimulatory G protein alpha subunit.Mutations in GNAL are closely related to dystonia, which are involved in glaucoma[38-40].VCAM1, a member of the Ig superfamily, produces a cell surface sialoglycoprotein[41].A genome-wide Meta-analysis identifies VCAM1 as a high-risk gene for primary openangle glaucoma[42].In the aqueous humor, VCAM1 might be used as a biomarker to predict the progression of diabetic retinopathy,and VCAM1 is overexpressed in the iris of uveitis patients[43-44].STAT1 encodes a member of the STAT protein family that several ligands, such as interferon-alpha, interferon-gamma,epidermal growth factor, platelet-derived growth factor, and interleukin (IL)-6, can activate.STAT1 is mainly associated with immunity[45-47]and viral infections[48].In the early period after glaucoma filtration surgery, STAT1 expression was reduced, acting in a manner complementary to STAT3[49].A study reported that STAT1 expression was upregulated in glaucoma but not significantly changed in optic nerve crosssections[50].Differential pathway activity between retinal ganglion cell subpopulations may be regulated by STAT1[51].ETS2 encodes a transcription factor that regulates development and apoptosis.CDK10 interacts with ETS2 and is involved in corneal epithelial wound healing[52].Arsenic trioxide inhibits VEGF-A expression in vascular endothelial cells by upregulating ETS2[53].In addition, BGN, FCGR4, TSPAN8,MAPK10 and MMP15 were found to be aberrantly expressed in glaucoma for the first time and may be used as biomarkers.Taken together, we hypothesized that the nine hub genes might play an important role in the development of glaucoma.
However, there are several shortcomings in this study.First,through bioinformatics analysis, we found that the DEGs were significantly associated with TOR and Ras signaling pathway, but we only studied the key genes and did not investigate the signaling pathway in depth.Second, functional experiments were not designed due to the limitation of scientific research.Nevertheless, our study still provides new molecular mechanisms and possible therapeutic targets for glaucoma.
In conclusion, a total of 128 DEGs were screened by analyzing the GSE25812 and GSE26299 datasets.These DEGs were associated with protein kinase binding, cell adhesion molecules, and TOR and Ras signaling pathways.Finally,9 hub genes for glaucoma were screened, including GNAL,BGN, ETS2, FCGP4, MAPK10, MMP15, STAT1, TSPAN8 and VCAM1, which might provide a theoretical basis for clinical application.
ACKNOWLEDGEMENTS
Authors’contributions:Xie RL: conception, design and analysis of data, performed the data analyses and review the manuscript; Nie HY and Xu YX: performed the data analyses and wrote the manuscript.All authors have read and approved the manuscript.
Foundation:Supported by Research Fund of Anhui Institute of Translational Medicine (No.2022zhyx-C73).
Conflicts of Interest: Xie RL,None;Nie HY,None;Xu YX,None.
 International Journal of Ophthalmology2023年7期
- International Journal of Ophthalmology的其它文章
- Research on classification method of high myopic maculopathy based on retinal fundus images and optimized ALFA-Mix active learning algorithm
- Predicting visual acuity with machine learning in treated ocular trauma patients
- Protective effect of ginsenoside Rg1 on 661W cells exposed to oxygen-glucose deprivation/reperfusion via keap1/nrf2 pathway
- Effects of endogenous dopamine induced by low concentration atropine eye drops on choroidal neovascularization in high myopia mice
- Differential analysis of aqueous humor cytokine levels in patients with macular edema secondary to diabetic retinopathy or retinal vein occlusion
- Subcutaneous pedicled propeller flap technique for microscopic reconstruction of eyelid defects
