Predicting visual acuity with machine learning in treated ocular trauma patients
Zhi-Lu Zhou, Yi-Fei Yan, Jie-Min Chen, Rui-Jue Liu, Xiao-Ying Yu, Meng Wang,Hong-Xia Hao,5, Dong-Mei Liu, Qi Zhang, Jie Wang, Wen-Tao Xia
1Department of Forensic Medicine, Guizhou Medical University, Guiyang 550009, Guizhou Province, China
2Shanghai Key Laboratory of Forensic Medicine, Shanghai Forensic Service Platform, Institute of Forensic Science,Ministry of Justice, Shanghai 200063, China
3The SMART (Smart Medicine and AI-based Radiology Technology) Lab, Shanghai Institute for Advanced Communication and Data Science, Shanghai University,Shanghai 200444, China
4School of Communication and Information Engineering,Shanghai University, Shanghai 200444, China
5Basic Medical College, Jiamusi University, Jiamusi 154007,Heilongjiang Province, China
Abstract● AlM: To predict best-corrected visual acuity (BCVA) by machine learning in patients with ocular trauma who were treated for at least 6mo.
● KEYWORDS: ocular trauma; predicting visiual acuity; bestcorrected visual acuity; visual dysfunction; machine learning
INTRODUCTION
Ocular trauma is the leading cause of blindness in young adults and children[1].Approximately 19 million people worldwide are visually impaired or even blind on account of ocular trauma[2].Owing to the complexity and diversity of ocular trauma and the great difference in posttreatment recovery, clinicians and forensic doctors often pay great attention to the recovery of post-traumatic visual acuity(VA).To better understand visual recovery after surgery or trauma, many researchers have investigated the relationship between macular[3-4], retinal[5-6], and vireteal[7]injuries caused by diseases or trauma.Houet al[8]found that macular injury involving the fovea or a thin optic nerve fiber layer results in severe vision loss.Phillipset al[9]found that in the lens and anterior chamber, timely treatment and effective control can effectively help the recovery of VA.Lianget al[10]found that postoperative VA was positively correlated with cube volume and cube average thickness (CAT).
With the advent of electrophysiology, new progress has been made in the examination of visual functional conductivity.Studies have found that VA can be assessed by the amplitude waveform and latency period of the pattern visual evoked potential (PVEP) in the scope of vision[11].However, in forensic medicine, the actual VA cannot be determined when performing visual function tests because of the patient's lack of cooperation.Various methods have been proposed to address this problem.At present, the most common are methods of the fogging test, distance transformation, and electrophysiology,but there are many subjective influencing factors of the first two.The waveform of PVEP can be affected by several factors,such as unstable resistance, misalignment of the eye when the patient annotates the stimulus screen, and poor cooperation.Therefore, the results of the image visual evoked potentials therefore need to be combined with the findings of the ocular examination, the site of the ocular injury and the magnitude of the acting forces.During literature review period, it is found that the ocular trauma score (OTS) takes full account of structural changes to the eye, and has been used to predict VA in patients with ocular injuries since the year of 2002[12].Some researchers argue that OTS can provide objective, real, and effective information for the prognosis of ocular trauma, which is also found to be closely related to the severity of ocular trauma and prognosis[13-14].Xianget al[15]found that OTS helped identify situations that disguise or exaggerate VA loss in patients with ocular trauma.
Interdisciplinary cross-collaboration has become a new trend,and research on the application of artificial intelligence to ophthalmology is maturing.Chenet al[16]used an artificial neural network-based machine-learning algorithm to automatically predict VA after ranibizumab treatment for diabetic macular edema.Huanget al[17]predicted VA and bestcorrected visual acuity (BCVA) using a feed-forward artificial neural networks (ANN) and an error back-propagation learning algorithm in patients with retinopathy of prematurity.Rohmet al[18]used five different machine-learning algorithms to predict VA in patients with neovascular age-related macular degeneration after ranibizumab injections.Weiet al[19]developed a deep learning algorithm based on optical coherence tomography (OCT), to predict VA after cataract surgery in highly myopic eyes.Murphyet al[20]developed a fully automated three-dimensional image analysis method for measuring the minimum linear diameter of macular holes and derived an inferred formula to predict postoperative VA in idiopathic macular holes.
However, most of the above studies are restricted to singledisease studies and no information has been reported so far in relation to the assessment of VA after ocular trauma.This study utilized the relationship between eyeball structure and vision, extracted features from ophthalmology examination,and introduces OTS scores combined with machine-learning techniques to develop a model for predicting BCVA.In addition, the weight of each feature in the model was visualized using a (Shapley additive exPlanations) map to explore the importance of the above features in the task of BCVA prediction.
MATERIALS AND METHODS
Ethical ApprovalAs this study was a retrospective analysis experiment, our ethics committee ruled that approval was not required for this study, and the requirement for individual consent for this study was waived.
MaterialsAll internal experimental data were obtained from the Key Laboratory of the Academy of Forensic Science,Shanghai, China.The cases were reviewed to evaluate eligibility based on clinical data, OCT images (Heidelberg,Germany; Carl Zeiss, Goeschwitzer Strasse, Germany),and fundus photographs (Carl Zeiss, Goeschwitzer Strasse,Germany).As of October 2021, the datasets comprised 1589 eyes, including 986 traumatic eyes and 603 healthy eyes.Our inclusion criteria were as follows: 1) differing degrees of ocular trauma; 2) the time between injury was at least 6mo; 3)the therapy records were complete; 4) the BCVA after recovery was proven to be real.Patients with ocular or other systemic diseases that likely affected the VA and poor cooperation were excluded.The test dataset was collected while these models training and validating, was also obtained from the Key Laboratory of the Academy of Forensic Science (Shanghai,China) using the same inclusion and exclusion criteria.From January 2022 to April 2023, the test dataset comprised 100 eyes, including 71 traumatic eyes and 29 healthy eyes, after removing the cases that do not meet the inclusion criteria.
Optical Coherence Tomography ImagesOCT images of the internal dataset were obtainedviatwo different devices:Heidelberg and Zeiss.Because the OCT images were obtained from two machines, and to avoid the effect of fusion of data from two different machines, we divided the data into group I(data from Zeiss), group II (data from Heidelberg), and group III (data from Zeiss and Heidelberg, namely all data).Each group was further divided into a traumatic group (group A)and a healthy and traumatic group (group B).For example,IA represented the traumatic group of Zeiss, ⅡB represented the traumatic and healthy eye group of Heidelberg, and ⅢA represented the traumatic eyes of all data.

Figure 1 Process of sample selection and source of the variables OCT: Optical coherence tomography; UVA: Uncorrected visual acuity; GOTS:Grading of ocular trauma score; COTS: Classification of ocular trauma score; IVA: Initial vision acuity; CAT: Cube average thickness; CST: Cube subfield thickness; RNFL: The average thickness of retinal never fiber layer; RNFL-S: Superior RNFL; RNFL-I: Inferior RNFL; RNFL-N: Nasal RNFL;RNFL-T: Temporal RNFL; ASV-ANM: Areas the specific value of abnormal and normal macula; CDR: Cup to disc ratio.
OCT images of the test dataset were also obtainedviathe Zeiss and Heidelberg device, which consisted of 100 eyes.
Feature ExtractionWe obtained 17 variables (Figure 1),which consisted of six variables from clinical data, eight extracted from OCT images, and three extracted from fundus photos.Table 1 shows the OTS scoring and grading process[12].BCVA was obtained using a projector-eye chart (NIDEK;Aichi magistrate, Japan).For the convenience of statistical analysis, we converted the decimal VA to logarithm of minimal angle of resolution (logMAR) VA[21].To extract variables from fundus photographs, we used the fundus photo reader software RadiAnt DICOM Viewer (Medixant, Poznan, Poland)to measure the area or length that we needed.To decrease the error, the data were measured by the same person, and the average value of the two measurements was taken.The main variable extraction process is shown in Figure 2.
Vision Acuity ConversionThe VA was converted to its logMAR equivalent, with counting fingers being assigned a value of 1.9, hand motion 2.3, light perception 2.7, and no light perception 3.0[19,21].
Overview of Machine-Learning Analytic SystemsWe proposed a BCVA analysis system based on machine-learning methods, including the prediction and grading of BCVA using the Extreme Gradient Boosting (XGB) model, and combined it with the method of model post-hoc interpretation, namely SHAP, to analyze the importance of input features of the model.
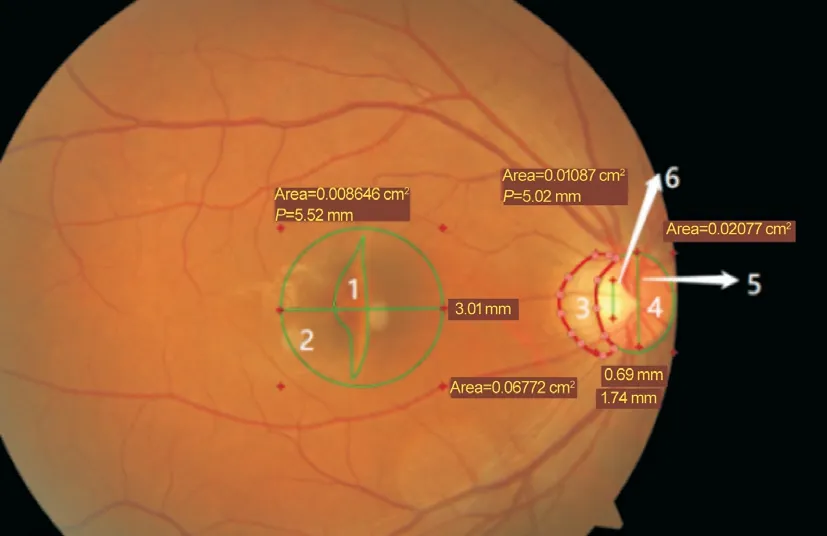
Figure 2 Process of variable extraction from fundus photos Area 1 is the abnormal area of the macula, 2 is the normal area of the macula, and 1/2 is areas the specific value of abnormal and normal macula (ASV-ANM).Area 3 denotes abnormal areas of the optic disk,4 denotes normal areas of the optic disk, and 3/4 denotes Comus.Area 6 denotes the vertical diameter of the optic cup, 5 denotes the vertical diameter of the optic disc, and 6/5 denotes the cup to disc ratio (CDR).
A flowchart of the experiment is shown in Figure 3.First, to determine the importance of each feature, all available features were used to predict BCVA using the XGB model and SHAP method, and then features were filtered by combining the least absolute shrinkage selection operator (LASSO) with an independent samplet-test.
Second, to complete the regression and classification task the features obtained after screening were randomly divided into the training dataset and the validation dataset by a fivefold cross-validation method using the four models.Then,we performed ablation experiments on screened features and investigated the role of each feature in the corresponding task using SHAP.Finally, the eligible test dataset was used further validate the best-performing model and best variables.
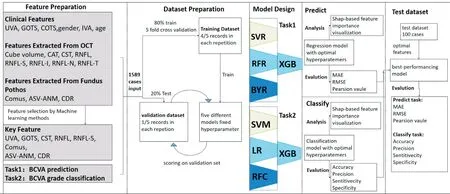
Figure 3 The flowchart of our experiment UVA: Uncorrected visual acuity; GOTS: Grading of ocular trauma score; COTS: Classification of ocular trauma score; IVA: Initial vision acuity; CAT: Cube average thickness; CST: Cube subfield thickness; RNFL: The average thickness of retinal never fiber layer; RNFL-S: Superior RNFL; RNFL-I: Inferior RNFL; RNFL-N: Nasal RNFL; RNFL-T: Temporal RNFL; ASV-ANM: Areas the specific value of abnormal and normal macula; CDR: Cup to disc ratio; BCVA: Best-corrected visual acuity; SVR: Support vector regression; RFR: Random forest regressor; BYR: Bayesian ridge; XGB: Extreme gradient boosting; SVM: Support vector machine; LR: Logistic regression; RFC: Random forest classifier; MAE: Mean absolute error; RMSE: Root mean square error.

Table 1 The input variables’statistics
Feature SelectionThe optimal combination of features was selected using the SHAP method combined with the LASSO and an independent samplet-test.SHAP is an additively explanatory model inspired by cooperative game theory, in which all features are considered “contributors”to the model.The model generates a contribution value, the Shapley value,for each predicted sample, which is the value assigned to each feature in the sample (i.e., the importance of each feature in the model).The LASSO method is widely used in model improvement and selection, and it makes the non-importance coefficient of features parallel to zero to select features by compressing the coefficient of the features and selecting the punishment function.However, the independent samplet-test is a common method in statistical analysis that can be used to test whether the difference between the means of the two types of samples is significant.
The specific methods were 1) inputting all features of group III into the model to predict BCVA and the Shapley value of this model corresponding to all features was calculated by the SHAP method and ranked.2) Input all features of group III into the model, and the feature that is screened by the LASSO method is viewed as group L.3) Divide group III data into two groups with logMAR of 0.3 as the critical value, and perform an independent samplet-test on all features of these two groups, and the feature with a significant difference as group T.4) The intersection of groups L and T was determined, and the feature with too small a Shapley value was derived as the final feature.
Extreme Gradient BoostingExtreme Gradient Boosting(XGB) is a tree-integrated model widely used in Kaggle competitions and many other machine-learning competitions with good results.This inference was computed based on the residuals of the upper model.XGB is an optimized gradient tree boosting system that improves computational speed through algorithmic innovations, such as parallel and distributed computation and approximates greedy search,which is controlled by adding regularization coefficients and residual learning to the loss function.In addition, XGB can learn sparse data and has good generalization ability.
Regression and Classification ModelThe features used in this experiment were extracted based on small samples of clinical variables, using OCT images.Considering the high applicability of machine learning to small sample sets, we selected XGB, support vector regression (SVR), Bayesian ridge (BYR), and random forest regressor (RFR) regression models using the filtered features as model inputs and a grid search approach to find the optimal hyperparameters to predict BCVA for each of the three data sets.For the BCVA classification task, we classified the BCVA of all patients into two categories using logMAR equal to 0.3 as the threshold value.For patients with logMAR less than or equal to 0.3, we assigned label 1, and for patients with logMAR greater than 0.3, we assigned label 0.For this binary classification task, we also used four machine-learning models: XGB, Support Vector Machine (SVM), Logistic Regression Classifier (LRC), and Random Forest Classifier (RFC), to filter the features as input,and grid search hyperparameters to complete the classification of BCVA.
Evaluation StandardsFor the three experimental datasets,we used a five-fold cross-validation method to separate the training and test sets.For the prediction of corrected VA, we used Pearson correlation coefficient (PCC), Mean absolute error (MAE), and root mean square error (RMSE) to measure the accuracy of model prediction, whereyiis the true value of corrected VA,ŷiis the predicted corrected VA, andnis the number of samples.
For the classification of corrected VA classes, we used accuracy, sensitivity, specificity, and precision as evaluation metrics, TP, TN, FP, and FN denote the numbers of true positives, true negatives, false positives, and false negatives,respectively, and samples with logMAR >0.30 represent positive samples.
StatisticsThe experiments were performed on a Dell computer with an Intel (R) Core (TM) i7-10870H CPU @2.20 GHz and 32 GB RAM.The model development was performed using Python (version 3.10) with the sci-kit-learn library (version 1.0.2), and statistical analyses were performed using a commercially available statistical software package(SPSS Statistics; IBM Chicago, USA).

Figure 4 Consistency of BCVAs between prediction and ground truth Agreement assessed using Bland-Altman for the predicted value of BCVA and the gold standard in groups A (A) and B (B).In the plots, the solid lines represent the actual mean difference (bias), and dotted lines show 95% limits of agreement.BCVA: Best-corrected visual acuity.

Table 2 The performance predicted in four models

Table 3 The performance predicted in four models
The distribution of variables was described by calculating the mean and standard deviation of each continuous variable for all data.Continuous variables of group A were compared with those of group B using the independent samplest-test method.The consistency between the predicted and actual values was verified using the Bland-Altman diagram.PCC was used to analyze the correlation between the predicted and actual values.
RESULTS
The characteristics of the input variables are listed in Table 1.The average age of all the groups was close to 44y.The number of men was higher than that of women in each group.The optimal variables for predicting BCVA include uncorrected VA (UVA), grading of ocular trauma score (GOTS), cube subfield thickness (CST), the average thickness of retinal never fiber layer (RNFL), superior RNFL (RNFL-S), Comus,areas the specific value of abnormal and normal macula (ASVANM), and cup to disc ratio (CDR) were obtained after feature selection.
Best-Corrected Visual Acuity Prediction Performance AnalysisIn Tables 2 and 3, we compare the performance of the four machine-learning algorithms after using fivefold cross-validation when classifying the dataset into three groups.XGB obtained better results in Groups IA, IIA, and IIIA, with MAEs of 0.32±0.03, 0.30±0.04, and 0.32±0.02,respectively, and RMSEs of 0.45±0.05, 0.40±0.05 and 0.42±0.03, respectively.The best results were obtained for the random forest model in three data groups, IB, IIB, and IIIB,with MAEs of 0.20±0.01, 0.20±0.01, 0.20±0.02, and RMSEs 0.24±0.03, 0.33±0.02, 0.33±0.03, respectively.
Figure 4 shows a Bland-Altman plot assessing the agreement between the model predictions and the ground truth.The 95%confidence intervals and mean deviations for the consistency of predictions for group III are presented separately.The 95%confidence intervals for groups IIIA and IIIB are -0.47 to 0.89 logMAR and -0.49 to 1.04, with mean deviations of 0.21 and 0.28 respectively.
Best-Corrected Visual Acuity Grade Classification Performance AnalysisThe experimental results were evaluated using five-fold cross-validation and a grid search approach to determine the best parameters for the model.The qualitative results shown in Tables 4 and 5 indicate that XGB obtained better results for all groups using the same combination of features than the other three methods.Sensitivity, precision, specificity, and accuracy for group IIIA classification were 0.92±0.02, 0.86±0.03, 0.71±0.07,and 0.85±0.03, respectively, and in group IIIB 0.82±0.03,0.82±0.04, 0.90±0.02, and 0.87±0.01, respectively.The sensitivity of group A was higher than the specificity in all three datasets, indicating that the prediction accuracy of BCVA≤0.3 (logMAR) was higher than the prediction accuracy of BCVA>0.3 (logMAR).

Table 4 The performance of the classified model

Table 5 The performance of the classified model
Test DatasetSince the XGB model has the most optimal performance for the performing the regression and classification tasks, the test dataset was used to determine the prediction performance and the accurate classification performance of the XGB model.As shown in Tables 6 and 7, the XGB model demonstrated stable promising results with an MAE of 0.20,RMSE of 0.29, and PCC of 0.96.The sensitivity, precision,specificity, and accuracy were 0.83, 0.92, 0.95, and 0.90,respectively.The Figure 5 shown the confusion matrixes of XGB modle in group ⅢB of internal dataset and test dataset.To understand the role of each feature in the model, we visualized the importance of the XGB model features that obtained the best results using SHAP, where importance refers to the extent to which each feature contributes to the model's predicted results.As shown in Figures 6 and 7, the UVA

Table 6 The result of regression between the internal dataset and test dataset
XGB: Extreme gradient boosting; PCC: Person correlation coefficient;MAE: Mean absolute error; RMSE: Root mean square error.Group IIIB represents the all samples in internal dataset.
XGB model Sensitivity Precision Specificity Accuracyplayed a key role in both the XGB prediction and classification models, and the importance of the remaining features varied in both tasks, with GOTS, RNFL-S, and CST showing a greater contribution to the models in both tasks.

Table 7 The result of classification between the internal dataset and test dataset
DISCUSSION
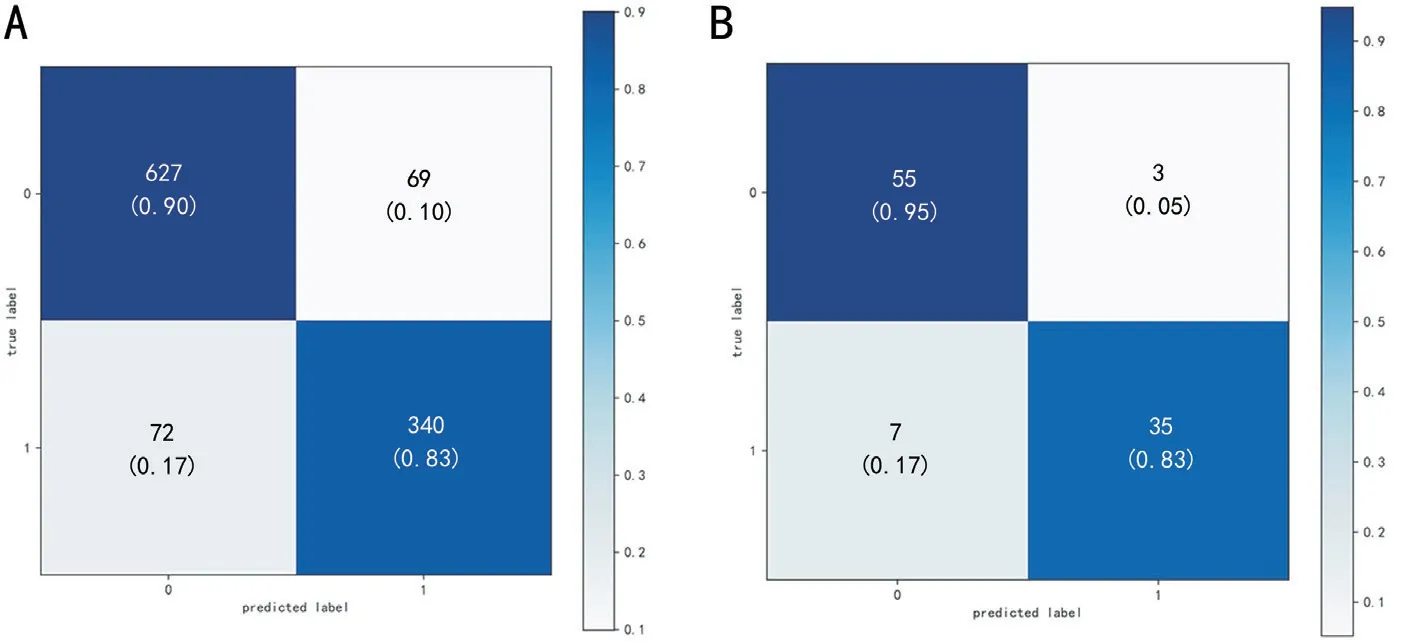
Figure 5 The confusion matrixes of XGB modle A: All samples in the internal dataset of the XGB model; B: The test dataset of the XGB model,the predicted label = 0 with ture label = 0 represents the correct prediction of visual acuity > 0.3 logMAR, the predicted label = 1 with ture label= 1 represents the correct prediction of visual acuity ≤0.3 logMAR.XGB: Extreme gradient boosting.
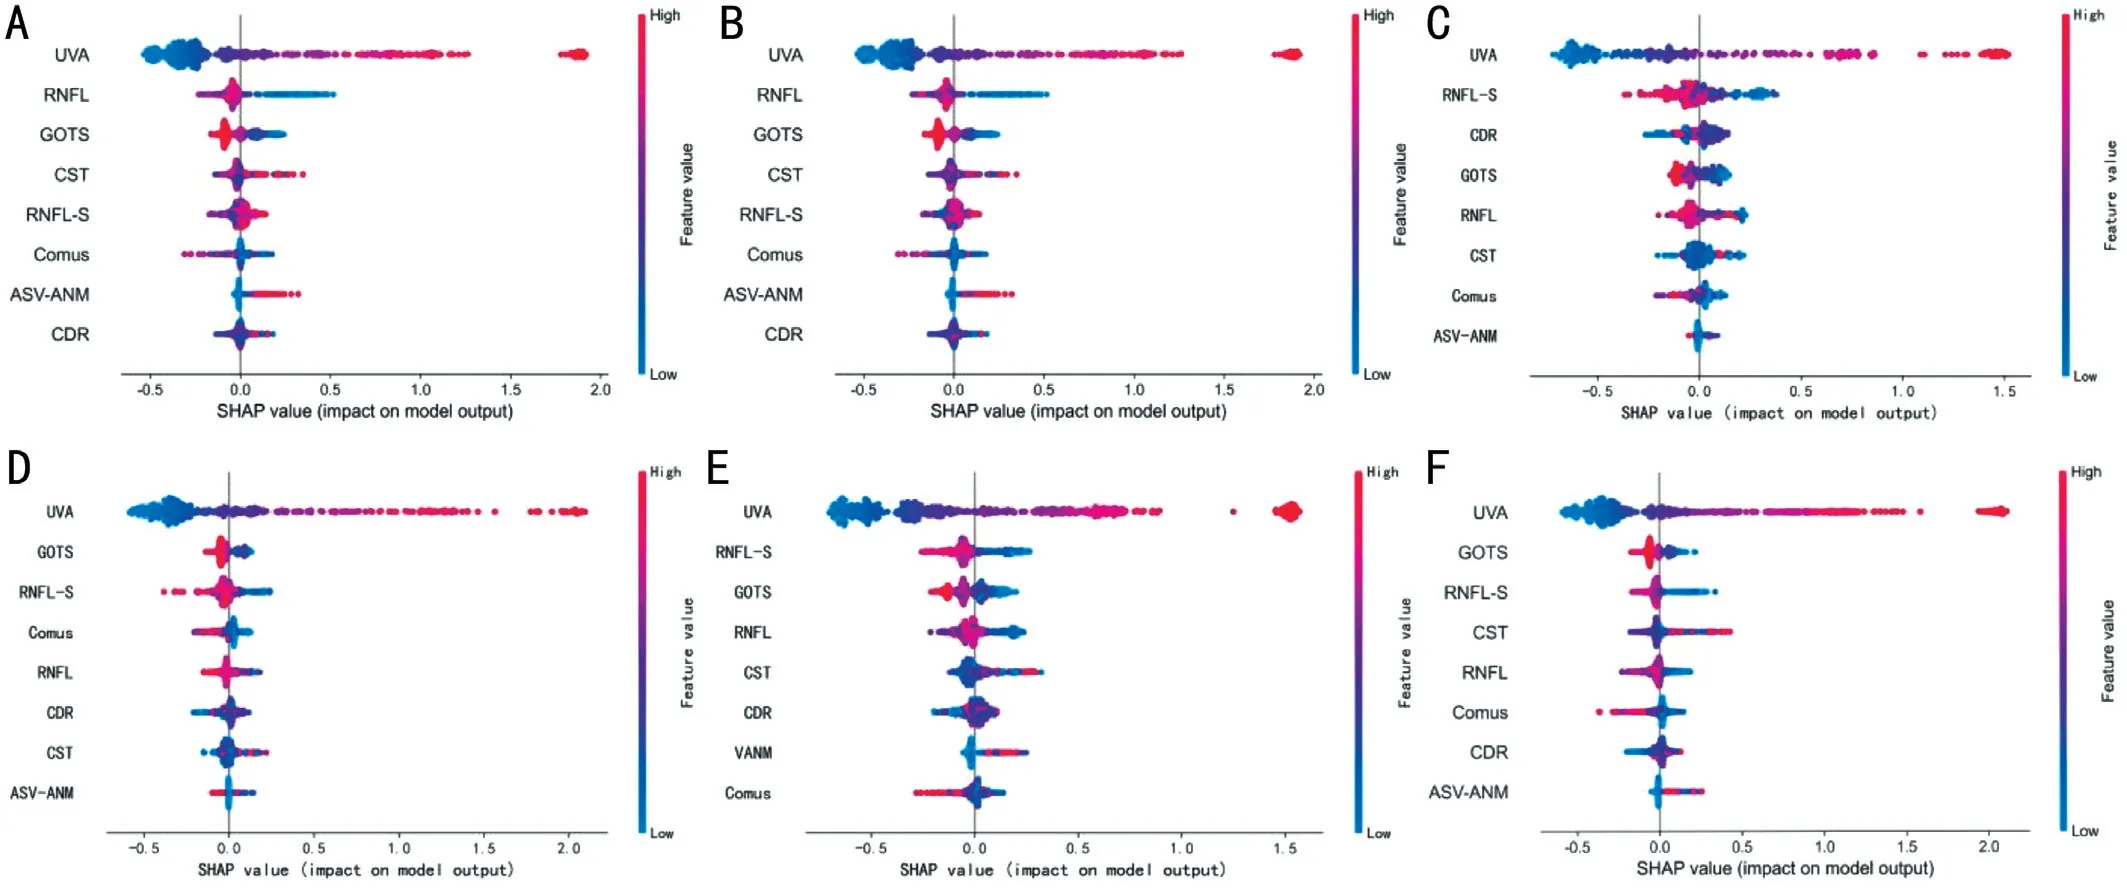
Figure 6 Plot of weights of the different features for the BCVA prediction task The global feature importance plots for all groups with the horizontal coordinates indicating the Shapley value for each sample corresponding to each feature and the color of each point representing the magnitude of this sample feature value.A, B, C, D, E, and F represent group IA, IB, IIA, IIB, IIIA, and IIIB, respectively.BCVA: Best-corrected visual acuity.
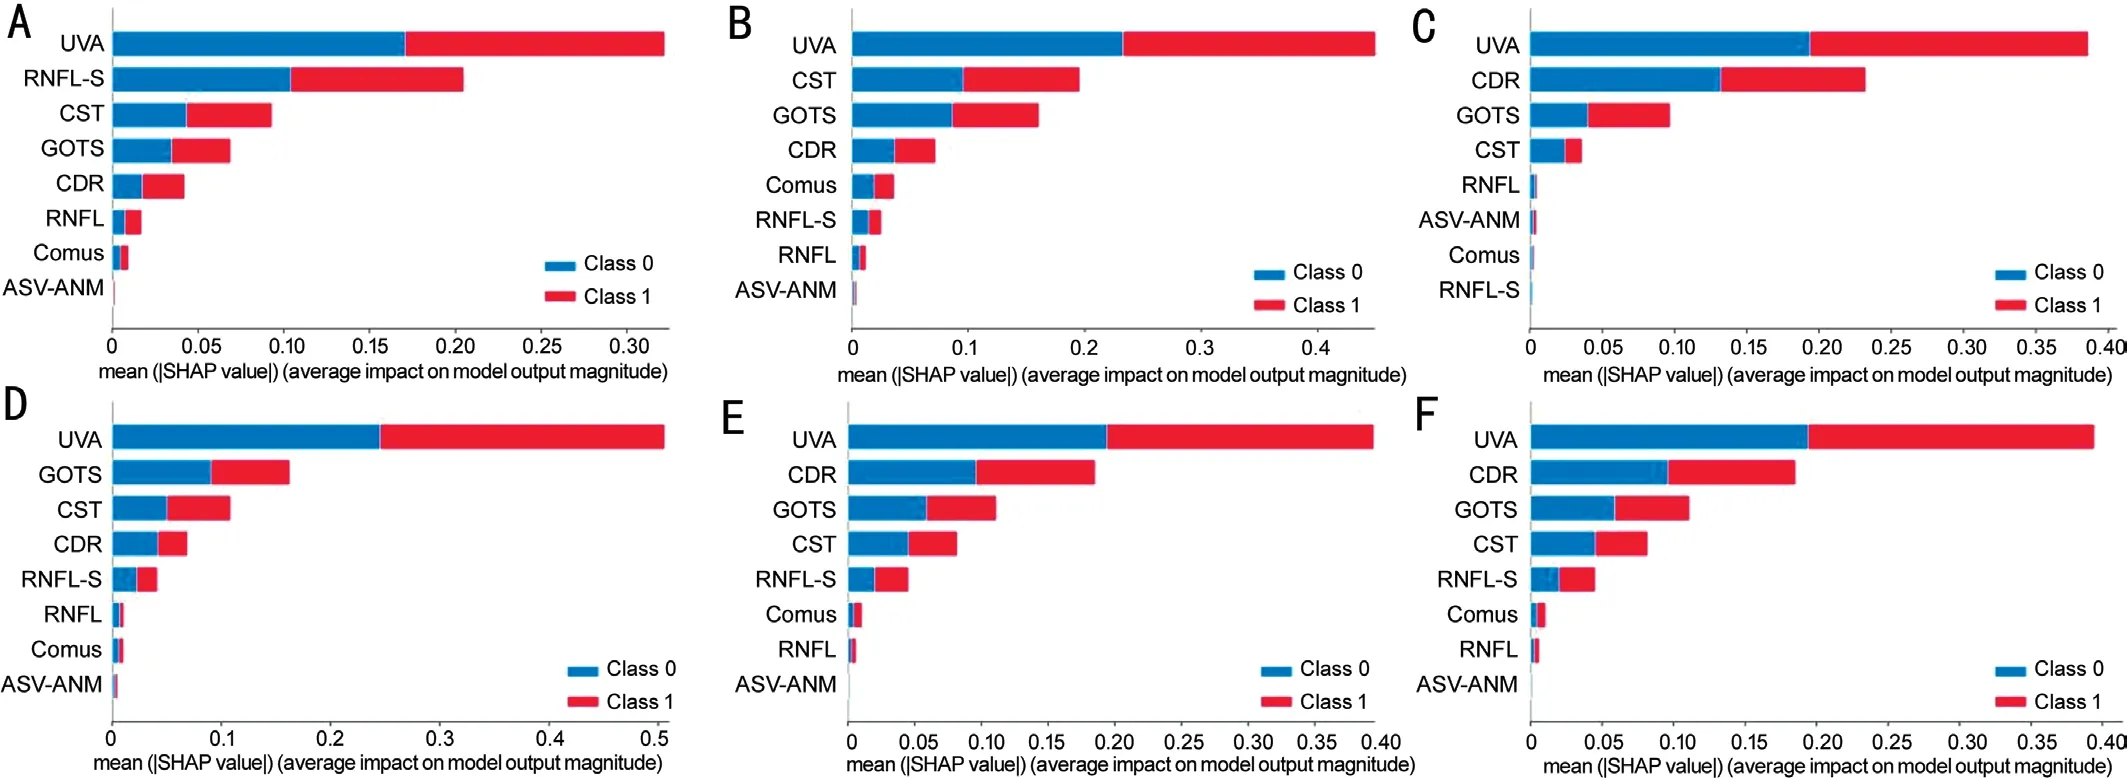
Figure 7 Plot of weights of different features of the BCVA classification task BCVA classification task in all groups, where class 1 represents BCVA≤0.3 and class 2 represents BCVA>0.3.A, B, C, D, E, and F represent group IA, IB, IIA, IIB, IIIA, and IIIB, respectively.BCVA: Best-corrected visual acuity.
To ensure judicial justice, we should clarify the cause of visual injury and confirm that the BCVA obtained by ophthalmology examination is reliable.In China, VA decline caused by accidental or intentional injury can obtain compensation or impose punishment on the perpetrator.Therefore, some patients disguise severe vision loss or blindness.VA in ocular trauma is usually worse in patients with posterior segment involvement.Therefore, a forecast model that can assess BCVA might be helpful for the accurate judgment of forensic workers.Although there are patients with poor cooperation in practice, because high-resolution OCT and fundus photographs may reveal morphological changes, the factors affecting VA can be identified.In recent years, machine learning has been extensively applied, and it has been found that an OCT scan of the macula could provide millions of morphological parameters affecting VA[22-23].Previous studies have mostly focused on the diagnosis and classification of eye diseases.Due to the complex and changeable nature of ocular trauma,such studies are relatively few.
Several studies have developed machine-learning algorithms to predict VA in patients with ocular or systemic diseases.Some of them used OCT images of the macular[19], and some used clinical data and measurement features from OCT (such as central retinal thickness)[24].Others use basic information, such as disease type or condition, age, and sex[25].
As shown in Table 1, the initial VA, UVA, GOTS, classification of ocular trauma score, RNFL, ASV-ANM, CDR, and BCVA were worse in group A than in group B.Our results could identify several rules of thumb: men easily suffered injuries compared to women, and the RNFL was more easily influenced than the macula lutea.The data from OCT images,fundus photos, and clinical information were used to predict BCVA in patients with ocular trauma using the XGB, SVR,BYR, and RFR models, and another four models for the accomplishment of the classification task.The results reveal that these models can predict BCVA in most patients with ocular trauma and shows promising performance.As expected,the best predictor variables by the auto-selected model were including UVA, GOTS, CST, RNFL, RNFL-S, comus[26], ASVANM, and CDR.This outcome coincides with the consensus that the VA is closely related to eyeball structure.We can observe that the predicted values are well correlated with the ground truth values (P>0.7), and the Bland-Altman plot shows good consistency between the gold standard and predicted values.The XGBoost model had the best performance in Group A, and the RFR model had the optimal results in Group B.In forensic clinical assessment of visual function,the recovery vision after ocular trauma below 0.3 logMAR can be used as a basis for assessing the degree of impairment and disability.To improve the efficiency and accuracy of identifying pseudo visual loss, this experiment was combined with the corresponding conditions of the visual function assessment, and finally a dichotomous experiment with a 0.3 logMAR cut-off was performed.From the classification results, the XGB model had the highest accuracy in all groups,and sensitivity was always greater than specificity in group A.We speculate that this is a problem of sample imbalance,and we found that in group A, there were more eyes with BCVA≤0.3 logMAR than eyes with BCVA>0.3 logMAR, but in group B, the increase in the number of healthy eyes leads to an increase in the number of eyes with BCVA>0.3 logMAR.Finally, to prove the generalization of the model, we combined OCT images captured by the two machines to predict VA and compared the outcomes with those of groups I and II; no significant difference in outcomes predicted and classification between each group was observed.We tested the model with additional data to determine how well it eventually performed the regression and classification tasks, and the test set was not involved in the training or gradient descent process of the model.It therefore makes sense to use an independent test set to test the best model against the best variables, and our results show that our model also performs well on the unexposed test set.The results of the test dataset showed that the regression and classification model also showed a stable and promising performance on the test dataset with MAE of 0.20 and RMSE of 0.29.The classification performance was also good.
The advantages of this experiment are as follows.Our experiments were designed based on the relationship between changes in the eye structure and VA.This innovative experimental design may help evaluate VA after injury.We divided the data into three groups to avoid errors due to OCT images obtained from different systems.Our study has some limitations.First, the data extracted from the OCT images and fundus photos were artificial, and several effective features were lost.Second, the sample size needs to be increased to further improve the robustness and generalizability of the machine-learning models.Finally, an error between the predicted and actual values still exists.
In the future, we plan to directly input OCT images and fundus photos into the model for VA prediction and continually increase the sample size to optimize the model.It is also expected to develop an open platform by using real-world clinical data for optimized software, which means inputting ophthalmic images into the model to directly obtain the VA and assist in accurate diagnosis.
In conclusion, owing to the complex and changeable conditions of ocular trauma, the prognosis of vision is difficult to clarify.This is based on the relationship between changes in eye structure and vision and the increasing application of artificial intelligence in ophthalmology.We used four different machine-learning models to predict the BCVA and found useful variables to predict BCVA.It can be used to predict VA and may be helpful for the auxiliary analysis of postoperative VA in clinical ophthalmology.
ACKNOWLEDGEMENTS
Foundations:Supported by National Key R&D Program of China (No.2022YFC3302001); the Human Injury and Disability Degree Classification (No.SF20181312); the National Natural Science Foundation of China (No.62071285).
Conflicts of Interest: Zhou ZL,None;Yan YFNone;Chen JM,None;Liu RJ,None;Yu XY,None;Wang M,None;Hao HX,None;Liu DM,None;Zhang Q,None;Wang J,None;Xia WT,None.
 International Journal of Ophthalmology2023年7期
- International Journal of Ophthalmology的其它文章
- Chickenpox followed streaky multifocal choroiditis with prednison treatment in a girl with asthma
- Pneumonia and ocular disease as the primary presentations of Takayasu arteritis: a case report
- Unilateral blurred vision in pediatric patient associated with cavum velum interpositum cyst
- Highly cited publication performance in the ophthalmology category in the Web of Science database:a bibliometric analysis
- Comparison of efficacy of conbercept, aflibercept, and ranibizumab ophthalmic injection in the treatment of macular edema caused by retinal vein occlusion: a Metaanalysis
- Ocular manifestations and quality of life in patients after hematopoietic stem cell transplantation
