
Analysis of retinal arteriolar and venular parameters in primary open angle glaucoma
2023-05-15 09:20JiaPengWangMeiTingYuBoLunXuJinPingHuaLiGangJiangJianTaoWangWeiHuaYangYuHuaTong
Jia-Peng Wang, Mei-Ting Yu, Bo-Lun Xu, Jin-Ping Hua, Li-Gang Jiang, Jian-Tao Wang,Wei-Hua Yang, Yu-Hua Tong
1Zhejiang University School of Medicine, Hang Zhou 310030,Zhejiang Province, China
2Quzhou Central Hospital of Zhejiang Chinese Medical University, Quzhou People’s Hospital, Quzhou 324000,Zhejiang Province, China
3Shenzhen Eye Hospital, Jinan University, Shenzhen 518040,Guangdong Province, China
Abstract
INTRODUCTION
Glaucoma is a major cause of irreversible blindness in adults worldwide[1].Primary open angle glaucoma(POAG) is a chronic progressive optic neuropathy and microvascular disease whose prevalence is increasing worldwide.A recent Meta-analysis showed that by 2020,43.78 million cases of POAG will be missed, 76.7% of which will occur in Africa and Asia[2].Although various risk factors for glaucoma have been reported, early detection or prediction of glaucoma progression is still very challenging.Glaucoma is characterized by the loss of retinal nerve fiber tissue, which is clinically defined as the both typical visual field defect and optic disc damage[3-4].When 40% or more axons of retinal ganglion cells are lost, visual field defects in glaucoma become detectable[5].Although the pathogenesis of glaucoma is still not fully understood, two main theories have been proposed: the “mechanical theory”and the “vascular theory”.Intraocular pressure (IOP) is considered to be the main risk factor for glaucoma, and the relevant cribriform plate retroflexion supports the mechanical theory[4].There is evidence that lowering IOP can reduce the risk of glaucoma or slow its development[6].However, elevated IOP alone cannot explain all glaucoma cases; for example, in glaucoma cases with relatively low or normal IOPs, especially in POAG patients, the involvement of vascular factors is considered to be crucial[7-8].
At the end of the 1980s, researchers found that the diameter of retinal vessels near the optic papilla in glaucoma was significantly smaller than that in normal eyes through fundus color stereoscopic photography, especially the diameter of the arterioles[9].Subsequent studies were also mostly based on fundus color photography, and blood vessel measurements depended on manual or standardized formula calculations.Almost all relevant studies have shown that the retinal arterioles in POAG are narrowed, while the changes in venules are inconsistent[10-14].The above studies based on fundus color photography have limitations; however, for example, they provide little information about the vessel wall and lumen diameter.Recently, adaptive optics technology has been applied to ophthalmic imaging to obtain ultrahigh resolution retinal images.It was found that the lumen of the retinal arterioles in POAG narrows, while the thickness of the vessel wall do not change[14].However, there have been no reports on the assessment of the retinal vein vessel walls in this condition.In previous research, we used spectral domain optical coherence tomography (SD-OCT) to obtain the cross-sections of the retinal blood vessels and introduced microdensity image segmentation technology based on the full-width at halfmaximum (FWHM) method.FWHM refers to the distance between the points where the value of the two functions is equal to half of the peak value.We established a method for quantitatively analyzing the retinal blood vessels that can measure and calculate their structural parameters, such as the retinal arteriolar outer diameter (RAOD) and retinal arteriolar lumen diameter (RALD), wall thickness (WT), wall crosssectional area (WSCA), and wall-to-lumen ratio (WLR)[15-16].In this study, we sought to obtain the parameters of the retinal vessels around the optic disc in POAG patients through OCT imaging to conduct morphological analyses on these vessels.
SUBJECTS AND METHODS
Ethical ApprovalThe study subjects were selected from patients and their families who visited the Outpatient Department of Quzhou People’s Hospital from January 2022 to December 2022 and were older than 40y.This study was approved by the Research Ethics Committee of Quzhou People’s Hospital and carried out in accordance with the principles of the Helsinki Declaration.Written informed consent was obtained from all participants.
General Data and GroupingThe inclusion criteria of the POAG group were as follows: 1) glaucomatous optic disc appearance and glaucomatous optic nerve injury confirmed by SD-OCT; 2) typical defects shown on at least 2 reliable consecutive standard visual field examinations; 3) open angle appearance during gonioscopy of a normal anterior segment;and 4) clear refractive medium and high image quality.The inclusion criteria of the control group were as follows: 1)IOP<21 mm Hg, normal optic disc appearance and thickness of the optic nerve layer fiber on OCT images; 2) at least 2 normal reliable continuous standard visual field examinations;3) normal anterior segment; 4) clear refractive medium and high image quality.Exclusion criteria: 1) spherical lens ≥6 D or cylindrical lens ≥3 D; 2) unclear media and collections that obviously cannot be analyzed; 3) history of intraocular surgery;and 4) history of ophthalmic diseases (such as diabetes retinopathy, hypertensive retinopathy, macular degeneration,and nonglaucoma optic neuropathy).A total of 62 subjects were included in the study and divided into the POAG group(32 subjects) and the normal group (30 subjects) according to the above criteria.The right eye was routinely chosen as the research target for each subject; if the right eye did not meet the inclusion criteria, the left eye was chosen.
The clinical data of all subjects were collected before enrollment, including age, sex, body mass index (BMI), the presence of hypertension, diabetes, other cardiovascular diseases, and smoking status.
Routine Examination of OphthalmologyRouting ophthalmic examinations, including routine slit lamp examination,gonioscopy and direct fundoscopy, were performed.A noncontact tonometer (NIDEK, Japan) was used to measure the IOP 3 times, and the average value was taken.The refractometer (NIDEK, Japan) was also used to determine the refractive state of the eye, and an IOL-MASTER-500 (ZEISS,Germany) was used to acquire the ocular axis length (AL).The retinal nerve fiber layer (RNFL) thickness was obtained by SD-OCT.Humphrey perimetry (ZEISS, Germany) was used to obtain the 24-2 visual field parameters from the center of fixation, including visual field index (ⅤFⅠ) and mean deviation(MD).
OCT Image Acquisition and Parameter Measurement of Retinal VesselsAll images were obtained by an SD-OCT instrument (Heidelberg Engineering, Heidelberg, Germany).The scanning mode is volume scan, and the parameter is set to 284 A-scans.The subjects rested their chins on the mandibular bracket of the instrument for head fixation and were instructed to look at a blue cross in the lens.SD-OCT was used to scan the supratemporal and infratemporal retinal arteriole and its accompanying venules in zone B, defined as an area 0.5 to 1.0 times the diameter of the optic disc from the edge of the optic disc (Figure 1A).The vessels in zone B are considered more morphologically consistent with the definition of arterioles and venules.Additionally, arteriovenous crossing and pulsation of the retinal arteriole are not common in this area and thus have little effect on the measurements.The scanning line was adjusted to be as perpendicular to the blood vessel as possible.If the vessel branched before reaching zone B, the part before the branching was scanned.The vertical and horizontal ratio of the captured OCT image is adjusted to 1:1 μm; after 8×magnification, the OCT image was saved in BMP format.The resolution of the captured vascular image is 512×512.At least three images clearly showing the vessel wall were used for the following analyses.

Figure 1 Operation process A: Line scan of the blood vessels in Zone B (an area 0.5 to 1.0 times the diameter of the optic disc from the edge of the optic disc).The line is manually adjusted to be as perpendicular to the running direction of the blood vessels as possible.B: The cross-sectional structure of retinal arterioles (red arrows) and venules (blue arrows) can be identified on OCT images.C: In Image J software, the diameter that vertically passes through the upper and lower blood vessel walls is selected to generate a gray-value distribution.D: The boundary points(arrows) are estimated at the semimaximum gray level on each side of the two parabolas in the graph.The distance between the boundary points of the outer diameter and inner diameter of the vessel is calculated.OCT: Optical coherence tomography.
The FWHM method was used to measure retinal vascular parameters on the OCT images.First, the OCT image was opened in Image J software (National Institutes of Health,USA).Then, a vertical line was drawn in the middle of the blood vessel with the straight line tool, and the gray value curve was obtained.There are two concave regions on the grayscale image, representing the upper and lower walls of the vessel on the OCT image.On the left and right sides of each of these regions, the average of three consecutive values are used to determine the maximum and minimum values of the crests and troughs, and the intermediate value between the maximum and minimum values was calculated.On each side of the concave regions, continuous points with the largest difference were used to fit a linear function.The intersection between the linear function and the horizontal line passing through the intermediate values was defined as the position of the vessel wall edge[17].Finally, the distance between the abscissa of these boundary points were used to calculate the lumen diameter and outer diameter of retinal blood vessels (Figure 1).All procedures were performed by the same experienced ophthalmologist.Each blood vessel was measured three times with this method, and the average value was taken to obtain the RAOD and RALD, retinal venular outer diameter (RⅤOD)and retinal venular lumen diameter (RⅤLD).The remaining morphological parameters of the retinal vessels were calculated according to the following formulas: WT=(RAOD-RALD)/2;WLR=(RAOD‐RALD)/RALD; WCSA=3.14×(RAOD2-RALD2)/4.
Statistical AnalysisSPSS 26.0 statistical software was used for all analyses.The Chi-square test was used for comparing general classification variables, which are described as the frequency.Continuous variables are represented as the mean±standard deviation, and the independent samplettest was used for comparison.The independent-samplettest was performed to assess the differences in vascular parameters between the two groups.The correlation between RNFL thickness, ⅤFⅠ, MD and vascular parameters was evaluated by the Pearson correlation test.α=0.05 was used as the test level,and the difference was considered statistically significant whenP<0.05.
RESULTS
Comparison of General DataThere was no significantdifference in sex distribution between the POAG group and the control group (Chi-square testP>0.05).The results of the independent samplettest showed that there was no significant difference between the POAG group and the control group in terms of age, refractive status (spherical lens), AL and BMI(P>0.05), but there was a significant difference in ⅠOP (P<0.05;Table 1).There was no significant difference in the numbers of current smokers, quitted smokers or patients with hypertension,diabetes and other cardiovascular diseases between the POAG group and the control group (P>0.05; Table 1).
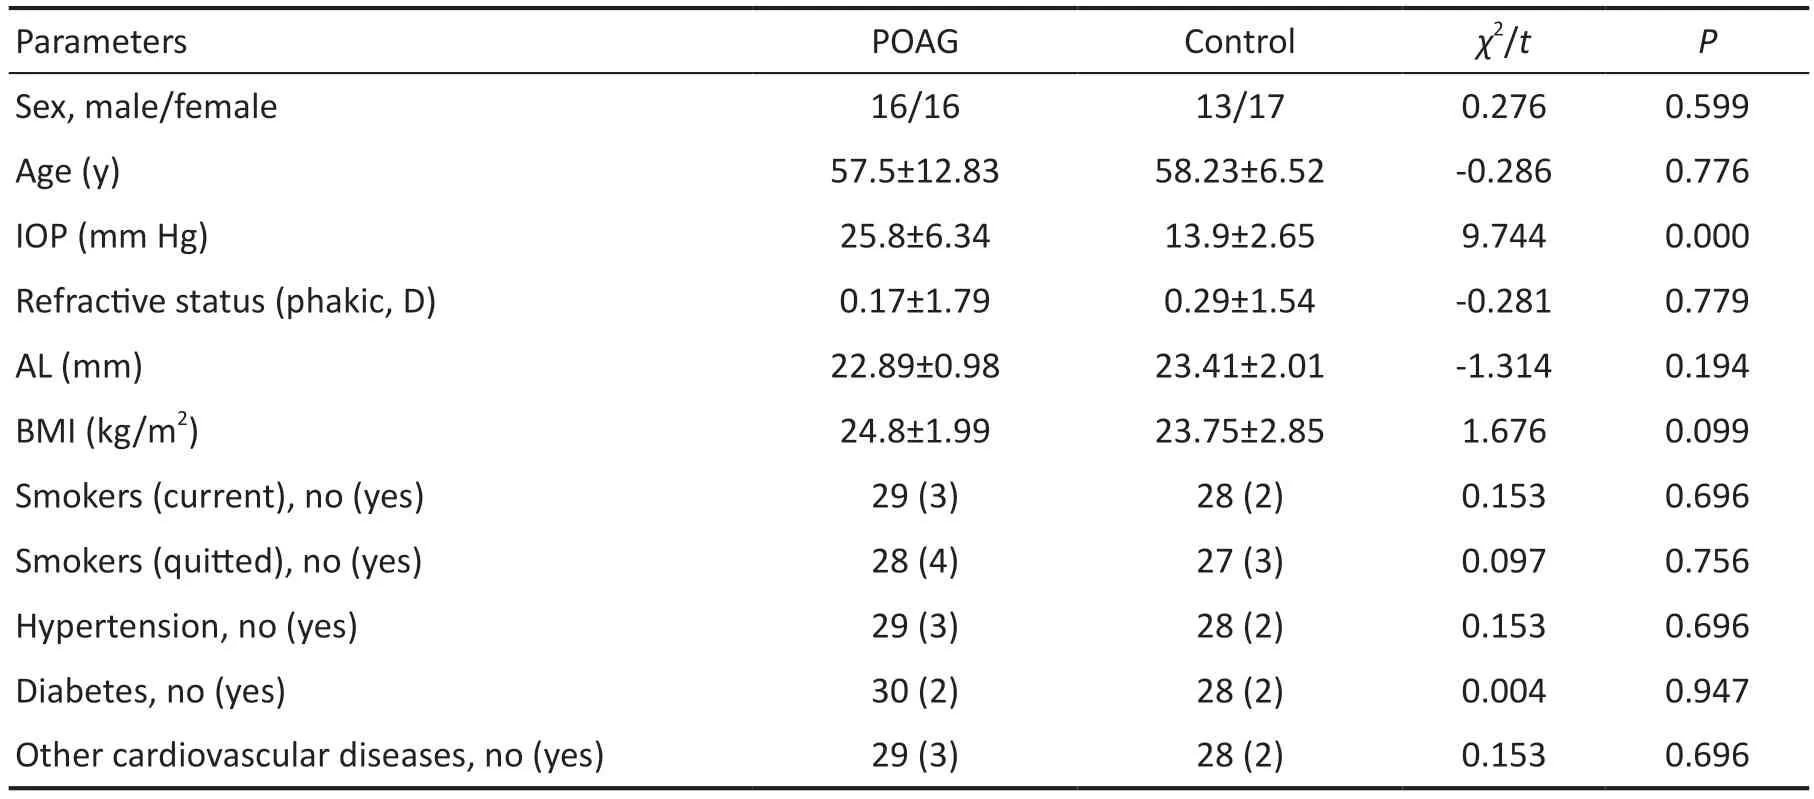
Table 1 Clinical baseline characteristics of the POAG group and the control group
Comparison of Retinal Arterioles and Venules Between the POAG and Control Groups
Comparison of supratemporal retinal arteriolesThe RAOD, RALD, WSCA of the supratemporal arteriole in the POAG group were 124.22±12.42 µm, 96.09±11.09 µm, and 4762.02±913.51 µm2, while those in the control group were 138.32±10.73 µm, 108.53±9.89 µm, and 5785.75±1148.28 µm2,respectively; the differences in these variables between the groups were significant (t=-4.768,P=0.000;t=-4.647,P=0.000;t=-3.897,P=0.000).The WT in the POAG group (14.06±1.82 µm)was smaller than that in the control group (14.9±2.63 µm), but the difference was not significant (t=-1.437,P=0.157).There was no significant difference in the WLR between the two groups (t=1.836,P=0.071; Table 2).
Comparison of infratemporal retinal arteriolesThe RAOD, RALD, WSCA of the infratemporal arteriole in POAG group were 125.01±15.55 µm, 96.27±13.29 µm, and 4925.56±1302.88 µm2, while those in the control group were 141.57±10.77 µm, 110.83±10.99 µm, 6087.78±1061.55 µm2,respectively; the differences between the groups in these parameters were significant (t=-4.689,P=0.000;t=-4.514,P=0.000;t=-3.698,P=0.000).The WT in the POAG group(14.37±2.56 µm) was smaller than that in the control group(15.37±2.43 µm), but the difference was not significant (t=-1.520,P=0.134).There was no significant difference in the WLR between the two groups (t=1.765,P=0.083; Table 3).
Comparison of retinal venules between the POAG group and the control groupThe results of the independent samplet‐test showed that there were no significant differences between the POAG group and the control group in terms of the supratemporal or infratemporal RⅤOD, RⅤLD, WT, WLR or WSCA (P>0.05; Tables 4 and 5).
Correlation Analysis of Retinal Arteriole Parameters with RNFL Thickness, VFI and MD in the POAG Group
Supratemporal retinal arteriolesThere was a significant,positive correlation between the ⅤFⅠ and the supratemporal RALD (P=0.037,r=0.370); none of the other variables were correlated with the ⅤFⅠ.The MD was positively correlated with the supratemporal RALD (P=0.049,r=0.351), while no correlations were observed for the other parameters.There was no correlation between RNFL thickness and RAOD, RALD,WT, WLR, or WSCA (Table 6).
Infratemporal retinal arterioleThere was a significant,positive correlation between the RNFL thickness and the infratemporal RAOD and RALD (P=0.039,r=0.392;P=0.027,r=0.418), but no correlations were observed with the other variables.ⅤFⅠ and MD were not correlated with RAOD,RALD, WT, WLR, or WSCA (Table 7).
DISCUSSION
At present, technologies for measuring the caliber of the retinal blood vessels include retinal blood vessel analysis[18], ultrawide field scanning laser ophthalmoscopy[19]and SD-OCT[20].Some technologies are software based, such as ⅤAMPⅠRE (Ⅴessel Assessment and Measurement Platform for Images of the Retina), ⅠⅤAN (Ⅰnteractive Ⅴessel ANalyzer), and Adaptive Optics images_Detect_Artery™[21-23].When measuring the retinal vascular system, the super high resolution of adaptive optics (AO) images makes them an ideal reference target.A recent prospective study found that measurement of the diameter of the retinal venule using the ⅠⅤAN and ⅤAMPⅠRE annotation tools was more accurate than the measurement of the diameter of the retinal arteriole with respect to the standard set by AO images[24].This may be due to the smaller changes in the venous cardiac cycle and the thinner vascular wall of the venule.There is a good correlation between SD-OCT and AO measurements, but AO can more accurately distinguish the vascular wall and blood column of the retinal arteriole[25].However, the measurement of retinal venule parameters by the above methods is not comprehensive enough.Therefore,we introduced the FWHM algorithm based on SD-OCT measurements to accurately obtain retinal vascular data under pathological conditions, such as hypertension and diabetes.The FWHM algorithm is based on the gray values in the image,which are often used for edge recognition and segmentation of CT and MRI images[17].This algorithm can determine the boundary of blood vessels and other tissues quickly and stably and is not overly sensitive to noise and adjacent tissues[26].And our previous research shows that compared with manual measurement, the FWHM method can significantly reduce the error of repeated measurement and improve the accuracy of vascular measurement[16].

Table 2 Comparison of supratemporal retinal arteriole parameters between the POAG group and the control group mean±SD

Table 3 Comparison of infratemporal retinal arteriole parameters between the POAG group and the control group mean±SD

Table 4 Comparison of supratemporal retinal vein parameters between the POAG group and the control group mean±SD

Table 5 Comparison of infratemporal retinal vein parameters between the POAG group and the control group mean±SD
This study found that the RALD, RAOD and WSCA in the POAG group were significantly smaller than those in the normal group, while the thickness of the vascular wall was not appreciably different, consistent with the findings of previous studies.The Blue Mountains and Beijing Eye Studies alsoconfirmed that the retinal arteriole lumen in glaucoma patients is significantly narrowed[11-12].The relationship between retinal arteriole stenosis and POAG has been recognized, but the specific underlying mechanism remains to be clarified.One conjecture is based on the decrease in arteriovenous oxygen saturation in POAG patients.It is speculated that the retinal oxygen demand is reduced due to the loss of glaucomatous retinal nerve tissue, and the increase in tissue oxygen content leads to arteriolar contraction[27].This phenomenon is more obvious in patients with advanced glaucoma[28].However,retinal oxygen demand is the product of arteriovenous oxygen saturation differences and retinal blood flow, so changes in retinal blood flow should also be taken into account.Some studies found that the retinal blood flow in POAG patients was significantly lower than that of healthy people through Doppler OCT, which further confirmed the change in oxygen demand in POAG[29].Changes in ocular blood flow and unstable oxygen supply will increase oxygen free radicals and oxidative stress in the intercellular space, alter the normal functioning of ganglion cells and induce an autoimmune response from glial cells, thus leading to glaucoma progression[30].This is similar to the mechanism of arteriole stenosis in patients with retinitis pigmentosa; the death of photoreceptors leads to a reduction in oxygen demand in the outer retina and tissue hyperoxia[31].Another explanation is related to the decrease in retinal vascular reactivity in POAG.A large number of studies have shown that the response of POAG retinal vessels to repeated flashes of light is reduced, indicating that retinal vascular regulation and neurovascular coupling are impaired[32-34].These changes may play a role by inducing the downstream hypoxia response pathway, leading to an increase in oxygen free radicals and oxygen exposure of the nerve fiber layer around the optic papilla[35].The results for WT were the same as those measured by AO, and the changes were not statistically significant[14].This indicates that vasospasm may be related to POAG.

Table 6 Correlation analysis between parameters of the supratemporal retinal arteriole and RNFL, VFI, and MD in the POAG group
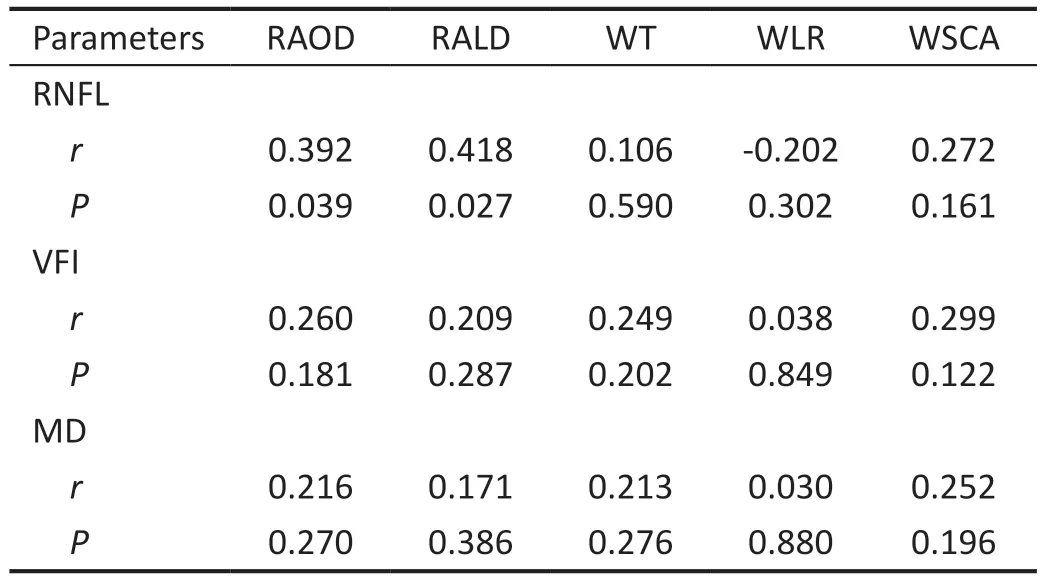
Table 7 Correlation analysis between parameters of the infratemporal retinal arteriole and RNFL, VFI, and MD in the POAG group
Another finding of this study is that there was no difference in the venular parameters between POAG patients and the normal group.However, the diameter of the retinal arteriole decreased significantly, indicating that the pressure in the retinal vessel and outflow resistance increased[36].This may reflect the relationship between glaucoma and the increased frequency of retinal vein occlusion.A Meta-analysis statistically summarized 15 eligible studies and clearly indicated that POAG is an important risk factor for the development of retinal vein occlusion, especially central retinal vein occlusion[37].Optic disc hemorrhage is common in POAG patients and it is recognized as a sign of small vein occlusion[38].Therefore,it is speculated that POAG, retinal vein occlusion and optic disc hemorrhage may have a common pathogenesis.However,unlike this study, the Singapore Malay Eye Study and Blue Mountains Eye Study reported a significant correlation between changes in the retinal venule diameter and POAG[11,39].The findings of the Beijing Eye Study are similar to those of this study[12].At present, the causes of the differences observed across the studies are not clear, but race and region may play a role.
This study also found that the RALD and RAOD of the infratemporal retinal arteriole were positively correlated with RNFL thickness.Progressive thinning of the macular ganglion cell inner plexiform layer is correlated with progressive thinning of the peripapillary RNFL[40].Arteriolar stenosis has been shown to be caused by the death of ganglion cells,supporting the hypothesis that arteriolar stenosis and RNFL thinning are correlated.Relatedly, investigators have found that lower macular and papillary vascular densities were associated with progressive RNFL loss in patients with mild to moderate POAG[41].It can be speculated that whether the blood supply is sufficient is closely related to the rate of RNFL thinning.
This study found that the RALD of the supratemporal retinal arteriole was positively correlated with the ⅤFⅠ and MD.MD is the degree of decrease in average visual sensitivity caused by various factors, while the ⅤFⅠ represents the visual field index;the smaller the two values are, the more serious the visual field damage.However, our study did not differentiate among different sites of visual field defects.Some studies have shown that arterioles in half visual fields with a larger visual field defect are narrower than those in the other half of the visual field; that is, there is a strong correlation between the reduction in the diameter of the small arterioles around the optic papilla and the size of the visual field defect[42].Additionally, a study involving optical coherence tomography angiography scanning demonstrated that faster loss of vascular density during initial follow‐up was associated with faster loss of the visual field[43].This reflects the ischemic basis of glaucoma damage and the relationship between vascular parameters and glaucoma visual function.
Limitations and StrengthsThis study has several limitations.First, our sample size is very small, especially compared with other large sample epidemiological studies.Second,the method is not fully automated, and the operation is complex, inefficient, and error prone.Third, because some retinal vessels are too close to the surface of the retina, it is difficult to distinguish the upper wall and tissue of the vessels,which leads to an increase in the measured outer diameter and thickness of the vessels.Fourth, our study is a crosssectional study, which cannot reflect the long-term changes in blood vessels in POAG patients nor allow determination of the causal relationship between retinal arteriole stenosis and glaucoma progression.After an average follow-up of 6.5y, the Rotterdam Eye Study authors concluded that the baseline retinal vessel diameter was not a risk factor affecting the occurrence and development of POAG[13].In contrast,the Blue Mountains Eye Study found that retinal arteriolar stenosis is associated with the long-term risk of POAG and produced data supporting the role of early changes in vascular parameters in the pathogenesis of POAG[44].Therefore, further longitudinal research is necessary.A strength of our study is that we precisely measured the parameters of the retinal arteriole and venule in and observed that arteriolar stenosis,arteriolar wall and venule are not affected.We also analyzed the retinal arteriole and venule above and below the temporal region, which may better represent the small arterioles and venules around the optic papilla.Another advantage is that we linked the structural changes in blood vessels with changes in visual function, which may provide additional insights into the progression of POAG.Deep learning technology has been widely used in ophthalmic images, and is expected to further improve the recognition efficiency of this method[45-46].In conclusion, the RALD, RAOD, and WSCA of the supratemporal and infratemporal retinal arterioles in POAG patients decreased, but the arteriolar wall thickness did not change.To the best of our knowledge, this is the first study to measure the inner diameter and wall thickness of the retinal venule, but we found no changes with respect to the control group.The findings of this study may prompt exploration of the structural changes that occur in the retinal vessels in the pathogenesis of POAG and provide a basis for further study.
ACKNOWLEDGEMENTS
Foundations:Supported byZhejiang Province Public Welfare Technology Application Research Project (No.LGF22H120017);Shenzhen Fund for Guangdong Provincial High-level Clinical Key Specialists (No.SZGSP014); Sanming Project of Medicine in Shenzhen (No.SZSM202011015); Shenzhen Fundamental Research Program (No.JCYJ20220818103207015).
Conflicts of Interest:Wang JP,None;Yu MT,None;Xu BL,None;Hua JP,None;Jiang LG,None;Wang JT,None;Yang WH,None;Tong YH,None.
 International Journal of Ophthalmology2023年5期
- International Journal of Ophthalmology的其它文章
- ldentification and functional analyses of a novel FOXL2 pathogenic variant causing blepharophimosis, ptosis,and epicanthus inversus syndrome
- Protective effects of ferulic acid against ionizing radiation-induced oxidative damage in rat lens through activating Nrf2 signal pathway
- Novel homozygous ADAMTS17 missense variant in Weill-Marchesani syndrome
- Cost analysis of childhood glaucoma surgeries using the US Medicaire allowable costs
- Predicting the prognosis of primary orbital lymphoma by clinical characteristics and imaging features
- Guidelines from an expert panel for the management of diabetic macular edema in the Malaysian population