高定向排列熔喷非织造材料 H-O-M 柔软性评价
秦子轩 张恒 李晗 翟倩 赵珂 甘益 杨自强 甄琪


摘要:为了准确评价高定向排列熔喷非织造材料柔软性能,提高其在多个领域的应用潜力。利用Handle-O- Meter(H-O-M)柔软性测试法获得样品不同纤维排列方向的力值-位移曲线,对曲线进行分析后得到关于样品力学特性特征值,并建立柔软得分计算公式,获得样品H-O-M柔软性评价得分。结果表明:样品纵横向柔软性得分具有明显差异,柔软性得分最大差值为37.971,说明纤维排列对样品柔软性能影响较大。最后,将样品的H- O-M柔软性评价得分结果与Phabr-Ometer柔软测试得分和主观评价得分进行比较分析,说明三种柔软性测试方法结果规律性一致,也期望该方法为高定向排列熔喷非织造材料的柔软性评价提供新的思路。
关键词:高定向排列;熔喷非织造材料;柔软性评价;H-O-M测试;柔软得分
中图分类号:TS177 文献标志码:A 文章编号:2097-2911-(2023)02-0012-11
H-O-M Softness Evaluation of Highly OrientedAligned Melt Blown Nonwovens
QIN Zixuan1,ZHANG Heng1*,LI Han1,ZHAI Qian1,ZHAO Ke1,GAN Yi2,YANG Ziqiang2,ZHEN Qi3
(1. School of Textile, Zhongyuan University of Technology, Zhengzhou 451191, China;2. Henan Yixiang Health TechnologyCo., Ltd, Zhengzhou 452373, China;3. School of Clothing, Zhongyuan University of Technology,Zhengzhou 451193, China)
Abstract:Objective:The evaluation of softness in nonwovens can be categorized into subjective and objective methods. Subjective evaluation methods can be influenced by various factors such as the experimental design, the subjective judgment of the evaluators, and the testing environment, leading to potential deviation in the final results. whereas objective evaluation methods, such as the fabric softness tester, provide quantitative indices for the softness of textile materials. However, for nonwovens, the arrangement of fibers in the longitudinal and transverse directions can significantly impact the material's softness, thereby necessitating the development of a suitable softness evaluation method that can take this characteristic into consideration.
Method:The Handle-O-Meter (H-O-M) is a nonwovens softness testing device designed to measure the force required to push a sample through a test seam after making line contact with the sample in the direction of the fiber arrangement. This test provides a force-displacement curve that reflects the mechanical properties of the material itself. By analyzing and calculating the force- displacement curves obtained from the H- O- M nonwovens softness testing device, it is possible to evaluate the softness of the samples.
Results:Figure 4(a) demonstrates that as the die temperature increases, the force-displacement curve of the sample material in both the longitudinal and transverse directions gradually decreases, with the peak P. In the transverse direction, P ranges from a maximum value of 5.319 N to a minimum value of 2.113 N, resulting in softness scores ranging from 57.599 to 31.467. Similarly, in the longitudinal direction, P ranges from a maximum of 2.955 N to a minimum of 0.536 N, resulting in softness scores ranging from 88.068 to 66.105. These results indicate that increasing the die temperature improves the softness of the material. Figure 4(b) presents the test results of samples subjected to different hot air pressures. It can be observed that increasing the hot air pressure effectively enhances the softness of the material. In the transverse direction, the force- displacement curve reaches a maximum P value of 11.322 N and a minimum of 2.904 N, resulting in softness scores ranging from 31.133 to 69.032. In the longitudinal direction, the force-displacement curve reaches a maximum P value of 2.251 N and a minimum of 0.252 N, resulting in softness scores ranging from 69.104 to 85.068. These findings highlight that the softness score in both directions can be improved. Figure 5 demonstrates that the difference in softness scores between Phabr- Ometer and H- O- M softness evaluationmethods is smaller than the difference in H-O-M scores. This discrepancy is attributed to the testing principles of the two methods. Phabr-Ometer testing utilizes a moving rod to feed the sample into a circular hole on the test disc, while H-O-M softness evaluation employs a test cutter head to feed the sample into the test slit. Although the circular hole mimics the sensation of grasping the material by hand, it does not account for the impact of the longitudinal and transverse fiber orientation distribution on the material's softness.
Conclusion:The Handle-O-Meter (H-O-M) softness testing device was utilized to obtain the longitudinal and transverse force-displacement curves of the samples. By identifying the eigenvalues in the sample curves and determining the weight percentages of the eigenvalues using principal component analysis, an equation for evaluating the softness scores of melt blown nonwovens was established. The findings demonstrated that both the increase of die head temperature and the increase of hot air pressure resulted in a reduction in fiber diameter in the material and enhanced the material's softness property. Furthermore, the H- O- M softness evaluation method was able to measure nonwovens with highly oriented fibers and obtain longitudinal and transverse softness scores for the materials. Notably, the longitudinal and transverse softness scores of the samples exhibited distinct differences, with the maximum difference in softness scores being 37.971. This indicates that fiber arrangement significantly influences the softness properties of the samples. Lastly, the results of the H-O- M softness evaluation scores of the samples were compared and analyzed with the Phabr-Ometer softness test scores and subjective evaluation scores. The comparison revealed consistent regularity among the results of the three softness test methods, providing a fresh perspective for evaluating the softness of non-woven materials with highly oriented alignments.
Key words: highlyorientedalignment;meltblown nonwovens;softnessevaluation;H-O-M testing;softness scores
引言
熔喷非织造材料作为一种具有纤维比表面积大、孔隙率高和蓬松度好的超细纤维材料[1-3],在医疗防护、个人卫生以及清洁擦拭产品等领域应用广泛[4-6]。为进一步开发熔喷非织造材料在日常生活中的应用潜力,满足更多应用场景,柔软性成了评价非织造材料的一项重要指标。非织造材料的柔软性通常是指人手对其进行接触时,材料自身给人所反馈的一种生理上感受[7-8]。非织造材料的柔软性主要与力学性能有关,包含材料的弯曲、压缩和表面平滑度等[9]。
目前,对于非织造材料的柔软度评价主要分为主观评价法和客观评价法[10]。主观评价法主要是通过测试人员对样品直接接触后,给出关于样品的柔软性评价,但其结果易受到人员主观性和测试环境等因素的影响。因此,利用柔软度测试仪器从客观上对材料进行柔软性评价,并给出量化结果,对材料柔软性评价具有十分重要意义。有许多学者利用Phabr-Ometer手感风格测试系统[11]、KES-F 织物风格测试系统[12]和 Han- dle-O-Meter(H-O-M)柔软性测试法[13]对织物柔软性评价展开研究,发现织物柔软性能与其物理指标具有十分密切关系。而熔喷非织材料相较于传统织物,其纤维排列取向度高,纵横向排列差异大[14],需要对材料不同方向柔软性能进行评价。H-O-M柔软性测试法能够区分非织材料不同方向力学性能,但材料的柔软性能是由测量的最大阻抗力值来表示[15-16],不能提供更加准确的评价得分,具有一定局限性。
基于此,针对熔喷非织材料具有的纤维高取向特性,采用Handle-O-Meter (H-O-M)柔软性测试装置获取样品纵、横向力值-位移曲线。通过对样品曲线中进行特征值定义,并利用主成分分析法确定样品的综合柔软度值,建立了评价熔喷非织造材料柔软性得分公式。最后,将该柔软得分与其他非织造材料评价方法获得的结果进行验证,证明基于 H-O-M 的熔喷非织造材料柔软性评价具有准确性,也为熔喷非织造材料柔软性评价提供一种新的思路。
1实验部分
1.1试样准备
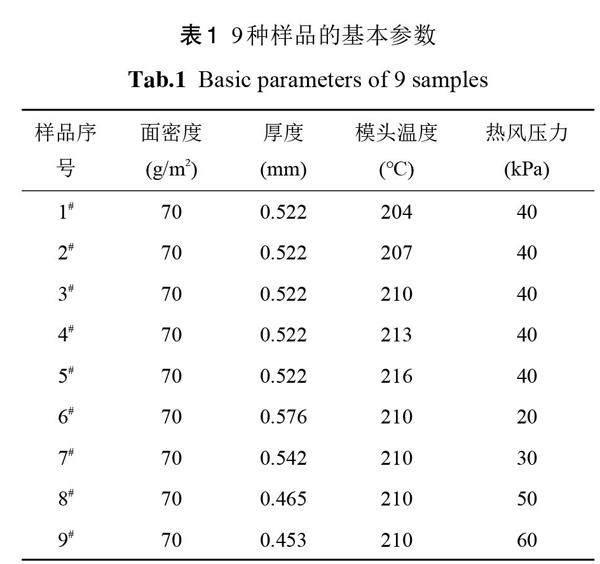
将聚乳酸(PLA)、聚己内酯(PCL)与乙撑双硬脂酸酰胺(EBS)共混后熔喷,改变不同工艺(模头温度与热风压力)制备了 PLA/PCL@EBS 熔喷超细纤维材料。样品制备时采用的不同模头温度有204℃、207℃、210℃、213℃和216℃ , 不同热风压力包括20 kPa、30 kPa、40kPa、50 kPa和60 kPa 。表1归纳了9种样品的基本性能参数。
1.2测试装置
H-O-M柔软测试装置是由力与位移传感装置及柔软度测试模块组成,其控制原理及装置实物图如图1所示。测试开始时,将样品按照纤维排列方向放置在测试底座,电脑软件输入测量参数用以控制测试装置的移动速度,位移距离等;力与位移传感装置在测试刀头与样品进行接触后,接收测试获得的力值位移数据。此外,柔软度测试模块主要是由测试底座和能够镶嵌底座上的不同宽度测试缝组成。
1.3测试过程
H-O-M柔软评价方法主要分为样品测试与得分计算两部分。图2(a)是H-O-M柔软性评价测试机理示意图,测试部分主要是将测试样品按照不同的纤维取向放置在测试台上,然后由测试刀头下压将样品通过测试缝。样品在受外力条件下发生一系列形变,获得样品的力值-位移曲线反映出其弯曲、压缩、摩擦等指标。而得分计算则主要是依据样品在形变过程中受力情况,如图2(b)所示,对测试获得的力值-位移曲线进行分段计算,通过对曲线中不同区间进行分析与特征值定义,最终采用公式计算获得样品的柔软性评价得分。
为了确保测试结果的准确性,从待测试样品中随机选取3块100 mm×150 mm 的矩形样品。同时,调整样品台以保持水平。在测试过程中,选择合适实验参数可以获得样品更加准确的力值-位移曲线,调整测试刀头与测试底座间距离,使得测试刀头与测试底座水平距离为10 cm 。经过测试刀头初始位置校准后,在系统中设定测试刀头能向下运动的最大距离为30 cm 。在运动行程结束后,测试刀头将返回到初始位置。刀头移动速度可设置为150mm/min 。为了得到更加准确的测量结果,选择适当的测试缝宽度。测试缝宽度的选择要确保在样品随着运动压板向下运动的过程中,样品两侧能够充分接触测试缝两边。将宽度为6.5 mm的测试缝嵌扣在测试底座凹槽中,同时要确保在测试刀头下压过程中,经过测试缝中间位置。将样品平铺在样品台上,样品纵向(沿着机器输出方向)与测试缝中心线垂直,将重量为100 g的压力板放在样品上。然后,在操作系统中启动测试刀头向下运动,直到测试刀头到达最低位置,再缓慢向上返回到起始位置。完成一次样品测试后,系统会生成样品在测试过程获得的力值-位移曲线。通过对该曲线的分析计算,得到样品的纵向柔软性评价得分。
最后,为了获得符合该样品的柔软性测试结果,分别对3块相同类型的样品进行上述测试。取3次柔软性评价得分平均值,即得到该样品纵向柔软度得分。进行样品横向(沿着样品幅宽方向)柔软度测试。重复上述纵向测试中的操作,将样品平铺在样品台上,使样品的横向与测试缝的中心线垂直。然后重复后续操作,可以得到样品横向柔软性评价得分。
2基于H-O-M测试的柔软评价得分计算
2.1力值-位移曲线分析
通过采用H-O-M柔软性测试获得样品力值-位移曲线如图3(a)所示,曲线中包含了样品在测试过程中力学性能变化,图3(b-f)确定了样品在测试中受力情况进行的特征值区间。根据样品受到压力后的运动过程,将力值-位移曲线分为5个部分进行分析。
第1段:压缩阶段,在力值-位移曲线图中初始力值为0,表示测试刀头刚好接触样品。当测试刀头对样品进行压缩时,样品受到压力,其内部纤维之间的间隙被压缩,导致样品厚度逐渐减小。此时,厚度成为影响测试刀头向下的阻力,也在力值-位移曲线中显示出来。在该阶段,样品厚度是影响该段曲线三角区面积的主要因素。对于同种材质的样品,三角区面积越大,说明材料厚度越大。
第2段:弯曲阶段,随着测试刀头不断向下,样品自身硬度发挥作用,同时,样品两侧与测试缝边缘接触时会产生摩擦力,类似人手抓握时的情况。然而,主要作用是样品自身的硬挺度。在该阶段,样品受到压力后发生弯曲形变,该段的力值-位移曲线主要反映出样品的刚度,曲线的面积值能够表示样品的柔软度。
第3段:随着测试刀头向下位移增加,材料发生形变后的内应力逐渐消耗,到达顶点时,内应力已经完全耗尽,纤维出现类似“断了”的状态。随后的下压过程中,材料本身的强力不再起作用,该段曲线的面积可以表现材料的韧性。
第4段:为样品表面摩擦力起主要作用的阶段。在这一阶段中,样品在测试刀头的作用下,由于样品自身应力已经耗尽,样品外部在缝两侧弯曲悬挂。两侧对缝的摩擦力受到重力影响,其作用的曲线能够显示在力值-位移曲线上。
第5段:在继续下压过程中,样品逐渐向下弯折,最后与测试缝处于近似垂直状态,此时材料表面性能在运动过程中起到主要作用,力值-位移曲线中显示的力值大小可以反映出样品表面的摩擦力。因此,第5段曲线面积的大小可以反映样品表面摩擦力的大小,面积越大,即样品表面的摩擦力功越大,样品表面越粗糙。随着位移增加逐渐趋于平缓,说明此时样品反映出的力值主要来自样品表面两侧与测试缝接触的摩擦力。经过H-O-M柔软性测试获得的力值-位移曲线可以对样品的力学性能进行分析,从而更好地理解样品的柔性能。
2.2柔软性评价得分
2.2.1特征值
为了具体定量表示样品柔软性评价得分,需要根据获取的力值-位移曲线各阶段特征,进一步分析样品自身力学性能。测试时样品随着测试压刀位移变化能够体现出其压缩、韧性以及表面摩擦等性能,这一过程类似于人手抓握样品时的状态,以此来对样品柔软性进行评价。
在样品形变时的压缩阶段,即该段曲线面积积分,定义为压缩功(Wa);在样品继续向下位移而发生了弯曲,该段曲线的积分面积定义为弯曲功( Wb);而在韧性阶段,该段曲线的积分面积定义为拉伸功(Wc),此时,曲线中还会出现峰值(P),即在样品测试中出现的最大力值,也就是力值-位移曲线中峰值点所对应的力值;当力值-位移曲线峰值过后,样品中纤维依旧存在部分内应力用来抵抗形变,这部分消耗的内应力做功用(Wd)表示;力值-位移曲线的第5段积分面积定义为摩擦力功(We),能够表示样品表面摩擦性能。确定特征值,一方面是为了对力值-位移曲线中,样品不同形变阶段做出分析,另一方面是为了建立完善的计算公式获得样品柔软性评价得分。
2.2.2特征值权重
柔软性评价得分公式是基于样品的力值-位移曲线分析后确定特征值,再通过特征值按照不同权重加和后获得样品的柔软度值。公式中7个特征值的权重(A1- A7)采用主成分分析法确定。主成分分析法是一种多因素统计方法,能够将众多因素中的多个相关指标转化为新的相互独立且反映对象性质的综合指标[17]。通过该方法能够有效的建立新的指标间不同联系,同时也能获得相关特征值之间的权重百分比系数。表2中显示了通过对20组样品纵横向力值-位移曲线分析计算后获得每个样品特征值。将这些特征值指标通过 SPSS数据统计分析系统进行处理,对样本数据进行KMO和巴特利特检验[18],其中 KMO值为0.749,大于0.6,说明该样本数据比较适合采用主成分分析法。
表3是数据处理后获得的成分矩阵,表4是总方差解释。通过表4可以看出,前三个权重累计贡献百分比分别为78.303%、96.134%以及99.511%,说明选取样本特征值数据中的主成分能够对样品柔软度值起到有效评价。通过方差贡献率中的百分比可以计算获得6个主成分的权重百分比值,归一化处理后其结果如表5所示。表5中数据作为各主成分分配权重系数,能够建立关于样品综合柔软度评价的数值计算公式,见式(1)。
S1=0.14Wa+0.19Wb+0.17Wc+0.17Wd+0.16We +0.17P (1)
式中,S1表示样品综合柔软度数值。
2.2.3柔软性评价得分
在对样品力值-位移曲线特征值与权重分析后,通过公式(1)来计算样品柔软度值(S1)。基于 H-O-M系统的测试原理,力值结果越小意味着样品对抗形变能力越弱,柔软性能越好。因此,使用公式(1)可以直观地反映出样品柔软性。为了更加精准获取某一特定领域非织造材料柔韧性能评价,引入与待测样品同一类型且主观评价上柔软性能优异的材料,通过 H-O-M 测试装置测试并计算获得柔软度值,将其设定为柔软度值参考样(S1参考样)。因此每个测试样品与参考样品之间会存在一个数值上的差异,数值越大则表明,测试样品与参考样品在柔软性能方便差异较大,则测试样品的柔软性能较差。采用公式2能够明确量化表示这一数值差异,获得样品的百分制柔软度得分(S),得分越高,说明样品柔软性能越好。
S=100-[S1测试样–S1参照样]÷S1参照样×100 (2)
式中,S为样品的柔软度得分。
3结果验证与分析
3.1 H-O-M柔软评价得分
图4表示不同模头温度不同热风压力PLA/ PCL@EBS 熔喷超细纤维材料的 H-O-M 柔软性评价结果。图4(a)中可以看出,随着模头温度升高,样品材料纵横向测试获得力值-位移曲线中峰值P逐渐减小,横向时,P最大为5.319 N,最小值为2.113 N,最高柔软得分为57.599,最低柔软得分为31.467;纵向时,P最大为2.955 N,最小值为0.536 N,最高柔软得分为88.068,最低柔软得分为66.105。这是由于升高模头温度有利于提高共混物熔体流动性,促进聚合物大分子链段运动,减小分子间作用力,有利于减小纤维直径,提高材料柔软性能[19]。图4(b)表示不同热风压力样品的测试结果。可以看出,热风压力增大,材料柔软性能得到有效提升。横向时,力值-位移曲线中r值最大为11.322 N,最小为2.904 N,柔软得分最小为31.133,最大为69.032;纵向时,力值-位移曲线中r值最大为2.251 N,最小为0.252 N,柔软得分最小为69.104,最大为85.068。这是因为,热风压力增大,能够使熔体经喷丝孔喷出后获得充分拉伸变细,材料中纤维直径变小,柔软性变好[20]。此外,从柔软得分结果中也不难看出,纵横向柔软得分具有显著差异,这与熔喷超细纤维材料的纤维取向分布有关。横向放置时,材料中纤维排列方向与测试刀头垂直,此时纤维自身强力抵抗外力形变,测试获得力值较大;纵向放置时材料中纤维排列方向与测试刀头平行,此时纤维之间缠结力成为了形变阻力,则测试获得力值较小。
利用H-O-M柔软性评价不同模头温度与不同热风压力熔喷超细纤维材料,柔软得分结果表明,模头温度与热风压力提高,都会改善材料柔软性能。同时,受到材料中纤维取向的影响,材料纵横向柔软得分结果差异性显著。
3.2 Phabr-Ometer柔软评价得分
采用Phabr-Ometer测试不同样品的柔软性结果如图5所示。图5(a)是不同模头温度下样品的Phabr-Omete柔软得分,其中得分最大值为82.33,最小值为66.31;图5(b)表示不同热风压力的柔软得分,得分最大为81.3,得分最小为68.19。Phabr-Omete柔软得分说明模头温度与热风压力提高能够增加材料柔软性能,这一规律与采用H- O-M 柔软性评价相同。但是,可以看出不同Phabr-Ometer柔软得分差异性较小,不同模头温度与热风压力得分最大值与最小值相差分别为16.02和13.11。而H-O-M柔软性评价得分中,不同模头温度横向得分差值为26.132,纵向得分差值为21.963;不同热风压力横向得分差值为37.899,纵向得分差值为15.964。这种结果是因为这两种方法测试原理的不同导致,Phabr- Omete测试时,样品由移动杆送入测试盘中心的圆孔,H-O-M柔软性评价则是测试刀头将样品送入测试缝中测试。圆孔尽管可以满足人手抓握材料时的状态,但是不能规避非织造材料纵横向纤维取向排列对材料柔软性的影响,因此采用H- O-M柔软性评价针对非织造材料进行柔软性能测试是十分必要的。
3.3主观性柔软评价得分
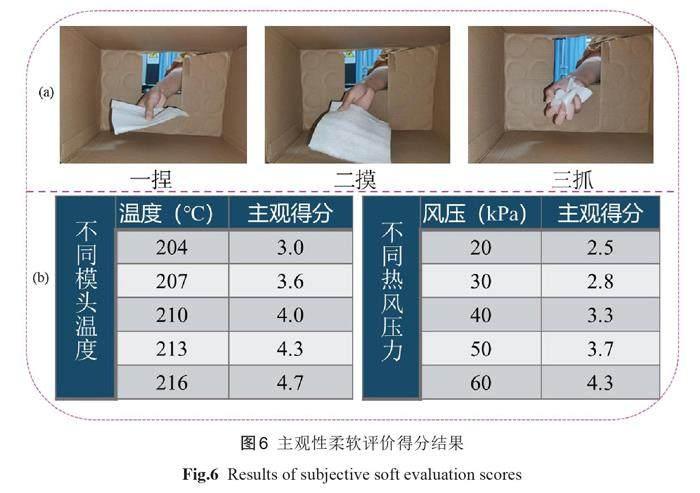
图6是对样品材料进行主观评价场景示意图以及评价得分结果。选择10名具有非织造专业知识的志愿者通过“一捏、二摸、三抓”的步骤(图6(a))对样品进行主观评价。为了减少主观性对评价结果的影响,将人与样品的接触在箱体中进行,随机给志愿者提供一个样品(记录员提前记好样品序号),经过上述三个动作后给出样品的主观评价得分。得分采用0-5分,0分表示样品很硬;1.0分表示样品硬;2.0分表示样品较硬;3.0表示样品较柔软;4.0表示样品柔软;5.0表示样品很柔软。主观评价得分结果如图6(b)所示,能够看出志愿者对于不同模头温度与不同热风压力的评分结果规律与H-O-M柔软性评价得分规律一致,这也说明H-O-M柔软性评价结果的正确性得到了验证。
4结论
本文基于 H-O-M 柔软性评价测试装置,获得不同熔喷工艺样品的力值-位移曲线,并通过对曲线分析,确定特征值与权重百分比,利用柔软度计算公式得到样品柔软性评价得分,得出以下结论:
(1)升高模头温度和增大热风压力都会减小材料中的纤维直径,提升材料柔软性能。
(2)H-O-M柔软性能评价方法能够测量高定向熔喷排列纤维的非织材料,并获得材料纵横向柔软性得分。
(3)通过将H-O-M柔软性得分与法宝仪、主观评价得分进行比较,能够证明基于 H-O-M 的柔软性评价得分具有准确性。同时,该方法也为高定向熔喷非织造材料柔软性评价提供了新的启发。
参考文献:
[1]XU Y, ZHANG X, TENG D, et al. Multi-layered micro/nanofibrous nonwovens for functional face mask filter[J]. Nano research, 2022, 15(8):7549-7558.
[2]XU Y, ZHANG X, HAO X, et al. Micro/nanofi- brous nonwovens with high filtration performance and radiative heat dissipation property for person- al protective face mask[J]. Chemical Engineering Journal, 2021, 423(11):130175.
[3]ZHANG S, DONG H, HE R, et al. Hydro electro-active Cu/Zn coated cotton fiber nonwovens forantibacterial and antiviral applications[J]. Interna- tional Journal of Biological Macromolecules, 2022, 207(5):100-109.
[4]安琪,付译鋆,张瑜,等.医用防护服用非织造材料的研究进展[J].纺织学报, 2020, 41(8):188-196.
AN Qi, FU Yijun, ZHANG Yu, et al. Research progress of nonwovens for medical protective gar- ment [J]. Journal of Textiles Rsearch, 2020, 41(8):188-196.
[5]LIU C, DAI Z, HE B, et al. The effect of tempera- ture and humidity on the filtration performance ofelectret melt- blown nonwovens[J]. Materials, 2020, 13(21):4774.
[6]朱斐超,张宇静,张强,等.聚乳酸基生物可降解熔喷非织造材料的研究进展与展望[J].纺织学报, 2022, 43(1):49-57.
ZHU Feichao, ZHANG Yujing, ZHANG Qiang, et al. Research progress and prospect on biodegrad- able polylactic acid-based melt-blown nonwovens [J]. Journal of Textiles Rsearch, 2022, 43(1):49-57.
[7]ZHEN Q, ZHANG H,SUN H W, et al. Tailoring the softness performance of polyethylene/polypro- pylene micro ‐ nanofibrous fabrics for skin contacts [J]. Journal of Applied Polymer Science, 2022, 139(4):51530.
[8]孙岑文捷,倪军,张昭华,等.针织运动服的通风设计与热湿舒适性评价[J].纺织学报, 2020, 41(11):122-127+135.
SUN Cenwenjie, NI Jun, ZHANG Shaohua, et al. Ventilation design and thermal-wet comfort evalu- ation of knitted sportswear[J]. Journal of Applied Polymer Science, 2020,41(11):122-127+135.
[9]陈光林,敖利民,钱程.医疗卫生用非织造材料柔软性测试方法分析[J].产业用纺织品, 2019, 37(9):40-44.
CEHN Guanglin, AO Limin, QIAN Cheng. Analy- sis on testing methods for softness of medical and health hygiene nonwovens[J]. Technical Textiles, 2019,37(9):40-44.
[10]张兵,李年华,许冬梅,等.织物柔软度测试评价的研究进展[J].合成纤维, 2022, 51(2):17-21+26.
ZHANG Bing, LI Nianhua, XU Dongmei et al. Research progress on fabric softness test evalua- tion[J]. Synthetic Fiber in China, 2022, 51(2):17-21+26.
[11]SUN H W, ZHANG H, ZHEN Q, et al. Large- scale preparation of polylactic acid/polyethylene glycol micro/nanofiber fabrics with aligned fi- bers via a post- drafting melt blown process[J].Journal of Polymer Research, 2022, 29(8):319.
[12]AKG?L E, KIZILKAYA AYDO?AN E, SINA-NO?LU C. Investigation of different denim fab- rics with fabric touch tester and sensory evalua- tion[J]. Journal of Natural Fibers, 2022, 19(13):5551-5565.
[13]ZHANG H, ZHEN Q, CAO Y, et al. Soft, strong, and breathable polylactic acid/polyethylene gly- col microfibrous membranes with a fluffy align- ment structure for skin contactor[J]. Textile Re- search Journal, 2023:00405175231173156.
[14]RITTENHOUSE J, WIJERATNE R, ORLER E B, et al. Effect of areal density and fiber orienta- tion on the deformation of thermomechanical bonds in a nonwoven fabric[J]. Polymer Engi- neering& Science, 2019, 59(2):311-322.
[15]KO Y C, PARK J Y, MELANI L, et al. Principles of developing physical test methods for dispos- able consumer products[J]. Nordic Pulp & Paper Research Journal, 2019, 34(1):75-87.
[16]SUDHAKAR R, RENJINI G. Evaluation and prediction of fused fabric composites properties – A review[J]. Journal of Industrial Textiles, 2022, 51(3_suppl):3536S-3574S.
[17]HASAN B M S, ABDULAZEEZ A M. A review of principal component analysis algorithm for di- mensionality reduction[J]. Journal of Soft Com- puting and Data Mining, 2021, 2(1):20-30.
[18]GEWERS F L, FERREIRA G R, ARRUDA H F D, et al. Principal component analysis: A natural approach to data exploration[J]. ACM Comput- ing Surveys (CSUR), 2021, 54(4):1-34.
[19]KARA Y, MOLN?R K. A review of processing strategies to generate melt-blown nano/microfi- ber mats for high-efficiency filtration applications [J]. Journal of Industrial Textiles, 2022, 51(1_suppl):137S-180S.
[20]FANG H, ZHANG L, CHEN A, et al. Improve- ment of mechanical property for PLA/TPU blend by adding PLA-TPU copolymers prepared via in situ ring- opening polymerization[J]. Polymers, 2022, 14(8):1530.
(责任编辑:周莉)

