Hydraulic and volume change behaviors of compacted highly expansive soil under cyclic wetting and drying
Mohamed Farid Abbas ,Abdullah Ali Shaker ,Mosleh A.Al-Shamrani
a Civil Engineering Department,College of Engineering,Prince Sattam bin Abdulaziz University,Al Kharj,Saudi Arabia
b Soil Mechanics and Geotechnical Engineering Research Institute,Housing and Building National Research Center (HBRC),Giza,Egypt
c Bugshan Research Chair in Expansive Soils,Civil Engineering Department,College of Engineering,King Saud University,Riyadh,Saudi Arabia
Keywords:Expansive soils Hydraulic conductivity Volume change potential Cyclic wetting and drying (CWD)Swell pressure
ABSTRACT The wide engineered application of compacted expansive soils necessitates understanding their behavior under field conditions.The results of this study demonstrate how seasonal climatic variation and stress and boundary conditions individually or collectively influence the hydraulic and volume change behavior of compacted highly expansive soils.The cyclic wetting and drying (CWD) process was applied for two boundary conditions,i.e.constant stress (CS) and constant volume (CV),and for a wide range of axial stress states.The adopted CWD process affected the hydraulic and volume change behaviors of expansive soils,with the first cycle of wetting and drying being the most effective.The CWD process under CS conditions resulted in shrinkage accumulation and reduction in saturated hydraulic conductivity (ksat).On the other hand,CWD under CV conditions caused a reduction of swell pressure while has almost no impact on ksat.An elastic response to CWD was achieved after the third cycle for saturated hydraulic conductivity(ksat),the third to fourth cycle for the volume change potential under the CV conditions,and the fourth to fifth cycle for the volume change potential under the CS conditions.Finally,both swell pressure(σs)and saturated hydraulic conductivity(ksat)are not fundamental parameters of the expansive soil but rather depend on stress,boundary and wetting conditions.
1.Introduction
Expansive soils refer to soils that tend to undergo volume change(increase or decrease)when subjected to varying moisture conditions.Expansive soils either naturally exist over wide areas worldwide or could be utilized in different engineering projects as a compacted material,such as backfill material,subgrades,earth dam cores (Fattah et al.,2010;Bardanis and Grifiza,2016),landfill liner(Dafalla et al.,2015),engineered clay barrier (Delage et al.,2010;Vilarrasa et al.,2016),and buffer materials for radioactive waste disposal systems (Delage et al.,2010;Nowamooz and Masrouri,2012;Sellin and Leupin,2014;Nowamooz et al.,2016).The most significant characteristics that may affect such projects are the hydraulic behavior and volume change.Hydraulic behavior is the key for several projects,while volume changes of expansive soils may engender structural destructions that manifest itself in the form of minor cracking,which are very common,to irreparable deformation or damage in structural elements.Moreover,these soil formations might be subjected in the field to varying applied stress(light vs.heavy),boundary conditions (CS vs.CV),and wetting conditions (seasonal climatic and environmental variation).However,in engineering practice,examining the hydraulic and volume change behaviors of expansive soils is commonly considered under defined applied conditions.
The behavior of expansive soils considering climatic change and environmental conditions (i.e.under cycles of wetting and drying(W/D)) has been the subject of intensive investigations during the last five decades (e.g.Chen,1965;Popescu,1980;Allam and Sridharan,1981;Chen and Ma,1987;Osipov et al.,1987;Subba Rao and Satyadas,1987;Hanafy,1991;Basma et al.,1994,1995,1996;Day,1994;Al-Homoud et al.,1995;Rao et al.,2000;Tripathy et al.,2002;Wheeler et al.,2003;Alonso et al.,2005;Zhang et al.,2006;Airò Farulla et al.,2007,2010;Guney et al.,2007;Krisdani et al.,2008;Nowamooz and Masrouri,2008,2010;Mishra et al.,2008;Sajedi et al.,2008;Doostmohammadi et al.,2009;Nowamooz et al.,2009;Tawfiq and Nalbantoglu,2009;Tripathy and Subba Rao,2009;Zemenu et al.,2009;Baille et al.,2010;Yazdandoust and Yasrobi,2010;Benchouk et al.,2013;Estabragh et al.,2013,2015a,b,2016;Umezaki and Kawamura,2013;Akcanca and Aytekin,2014;Wang and Wei,2015;Wu et al.,2016;Rosenbalm and Zapata,2017;Dong et al.,2019;Azizi et al.,2020;Julina and Thyagaraj,2020;Ma et al.,2020;Qi et al.,2021;Thyagaraj and Julina,2021;Wen et al.,2021).Table 1 lists the previous researches that had dealt with cyclic wetting and drying (CWD) for expansive soils with their objectives and test conditions.
The volume change potential under CWD shows divergent behavioral responses.Some studies have reported cumulative swell strain (Day,1994;Sajedi et al.,2008;Nowamooz and Masrouri,2009;Zemenu et al.,2009;Estabragh et al.,2013,2015b).Others have observed fatigue in swell behavior (i.e.shrinkage accumulation) (Chen,1965;Chen and Ma,1987;Subba Rao and Satyadas,1987;Dif and Bluemel,1991;Al-Homoud et al.,1995;Wheeler et al.,2003;Alonso et al.,2005;Zhang et al.,2006;Airò Farulla et al.,2007,2010;Nowamooz and Masrouri,2008;Yazdandoust and Yasrobi,2010;Dafalla et al.,2019).This behavior was clarified as an incessant rearrangement of soil particles,leading to a less active microstructure.A third group of researchers observed both swell and shrinkage accumulation at the close of the CWD process(Day,1994;Basma et al.,1996;Guney et al.,2007;Tawfiq and Nalbantoglu,2009;Rosenbalm and Zapata,2017).Most researchers reported that swell accumulation reduces and shrinkage accumulation increases with the increase in applied stress.
Previous studies have shown that the percentage of clay particles,amount of expansive minerals,type of soil,initial placement condition,soil fabric,stress level applied,and stress history are the prime factors governing the volume change behavior.However,the behavior of swell or shrinkage accumulation at the close of the CWD process is attributed to the drying degree reached during the drying paths(i.e.partial or full drying or the suction level applied)(Day,1994;Basma et al.,1996;Guney et al.,2007;Tawfiq and Nalbantoglu,2009;Rosenbalm and Zapata,2017).Others ascribed this behavior predominantly to the stress level applied and stress history of the soil(Sharma and Wheeler,2000;Alonso et al.,2005;Airò Farulla et al.,2010;Wang and Wei,2015;Rosenbalm and Zapata,2017).Nowamooz and Masrouri (2010) examined the effect of stress history(i.e.loose vs.dense samples)and observed that loose samples showed significant shrinkage whereas dense ones produced swell accumulation during CWD cycles.
Another form for volume change potential is the swell pressure(σs)estimated based on constant volume method(ASTM D4546-03,2003),which reflects the soil’s susceptibility to volume change under a CV condition that might exist in the field.Accordingly,some researchers have examined the impact of CWD on swell pressure (σs) and reported a reduction of σswith repeated W/D cycles as a sign of fatigue (Al-Homoud et al.,1995;Guney et al.,2007;Rosenbalm and Zapata,2017;Yazdandoust and Yasrobi,2010),except Doostmohammadi et al.(2007,2009) who stated an increase of σsof mudstone with repeated W/D cycles.All of those researchers exhibited an equilibrium state after a significant W/D cycle.
It is evident that most studies have examined the volume change behavior under CWD considering small applied stress(Day,1994;Estabragh et al.,2013,2015b;Dong et al.,2019).However,expansive soils in the field are subjected to other stresses than the token stress examined.Considering that,others have examined such behavior for different applied stresses(Dif and Bluemel,1991;Alonso et al.,2005;Zhang et al.,2006;Airò Farulla et al.,2007,2010;Doostmohammadi et al.,2009;Rosenbalm and Zapata,2017;Dafalla et al.,2019).Nevertheless,the stress ranges for all investigations were less than the swell pressure(σs),i.e.showing only the initial swell potential,except for Nowamooz and Masrouri(2010),who performed one test exhibiting the collapse potential during the first cycle of wetting.Expansive soils in deep repositories are subjected to the initial collapse potential,and its response under CWD should be examined.
Saturated hydraulic conductivity (ksat) is a key parameter for projects of landfill liners,engineered clay barriers,and radioactive waste disposal systems.For most soils,it has been considered as a constant that is measured experimentally.However,this assumption is invalid for deformable soil (i.e.clays,particularly expansive ones).Many researchers exhibited that saturated hydraulic conductivity (ksat) relays predominantly on soil porosity,and various correlations were proposed between the saturated hydraulic conductivity(ksat)and void ratio(e)(Huang et al.,1998;Romero et al.,1999;Watabe et al.,2000;Leroueil et al.,2002;Sridharan and Nagaraj,2005;Deng et al.,2011;Abbas et al.,2021).However,few studies have examined the impact of successive seasonal variation (i.e.CWD) on such behavior despite its importance in controlling the efficiency of such a system.
Most studies reported an increase in saturated hydraulic conductivity (ksat) with consecutive W/D cycles and attributed that to the developed cracks that function as preferential flow paths(Shear et al.,1992;Albrecht and Benson,2001;Akcanca and Aytekin,2014;Louati et al.,2015;Azizi et al.,2020).Day(1997)reported the same observation for the initial cycles,but upon continued rewetting,the expansiveness of clay assists in the healing completion of these desiccation cracks,consequently reducing hydraulic conductivity.Albrecht and Benson (2001) demonstrated the impact of applied surcharge on crack healing,i.e.on saturated hydraulic conductivity(ksat)upon CWD.Azizi et al.(2020)observed an increase inksatfor silty material(low activity soil)after W/D cycles,and this is related to the increase in macroporosity owing to fracturing and breakage of the clay peds.
Louati et al.(2018) reported both an increase and a decrease in saturated hydraulic conductivity (ksat) and ascribed such observation to the initial placement of samples.The drying process for densely compacted specimens creates microcracks,whereas the opposite is observed for loosely compacted clay,where drying decreases the pores,reducingksat.Day (1998) attributed the discrepancy between researchers’ observations to the type of clay mineral prevailing,which influences the ability of soil cracks caused by CWD to heal themselves upon wetting.Lin and Benson(2000),Dafalla et al.(2019) and Julina and Thyagaraj (2020) reported a marginal variation ofksatupon CWD.Albrecht and Benson(2001) and Dafalla et al.(2019) reported a reduction inksatwith applied surcharge,and Albrecht and Benson(2001)attributed that to the fact that an increase in applied surcharge helps in closing the desiccation cracks.
In summary,saturated hydraulic conductivity (ksat) variation upon successive W/D cycles depends on the soil type(clay mineral prevailing),placement condition (moisture content and dry density),and level of surcharge applied.It is noteworthy that Ito and Azam (2020) suggested that a full evaluation of expansive soil behavior necessitates concurrent measurement of moisture retention,swell-shrink,and hydraulic conductivity curves.
In the present research,the hydraulic conductivity and volume change behaviors of a compacted expansive soil were studied experimentally under CWD for a wide range of stress states and different applied boundary conditions.These conditions simulate,to a great extent,the seasonal climatic variation for various stress and boundary states that may prevail in the field,aiming for more economical and rational design procedures in practice.Moreover,objectives of this study aim to fill the gaps of previous researches that investigated some of expansive soil’s characteristics under CWD process for limited stress and boundary states.The objectives and test conditions of current research are provided,alongside with previous researches,in Table 1 to stand on the importance of present study.
2.Materials used and sample preparation
The expansive soil used in current study was obtained from the western shoreline of the Arabian Gulf,specifically from Qatif city(eastern province of Saudi Arabia,Fig.1).Disturbed samples were obtained from open test pits excavated to a depth of 2.5-4 m below the ground surface.On the basis of the particle size distribution of the tested soil,it consists of 1% fine sand,32% silt,and 67% clay.Table 2 summarizes the soil characterization results of Qatif clay.The X-ray diffraction technique was used to perform the mineralogical characterization of Qatif clay and montmorillonite clay was identified (Fig.2).This is consistent with documented reviews for Qatif expansive clay,revealing that the soil is highly expansive because of its high smectite mineral content(Azam et al.,1998;Al-Shayea,2001;Azam,2003;Elkady et al.,2015;Shaker and Elkady,2015,2016;Abbas,2016).Abduljauwad (1994) documented that the percentage of montmorillonite mineral in Qatif clay is 52%.A highly expansive soil was selected in this study because of itsprobable use as a natural alternative to bentonite in the engineered projects.
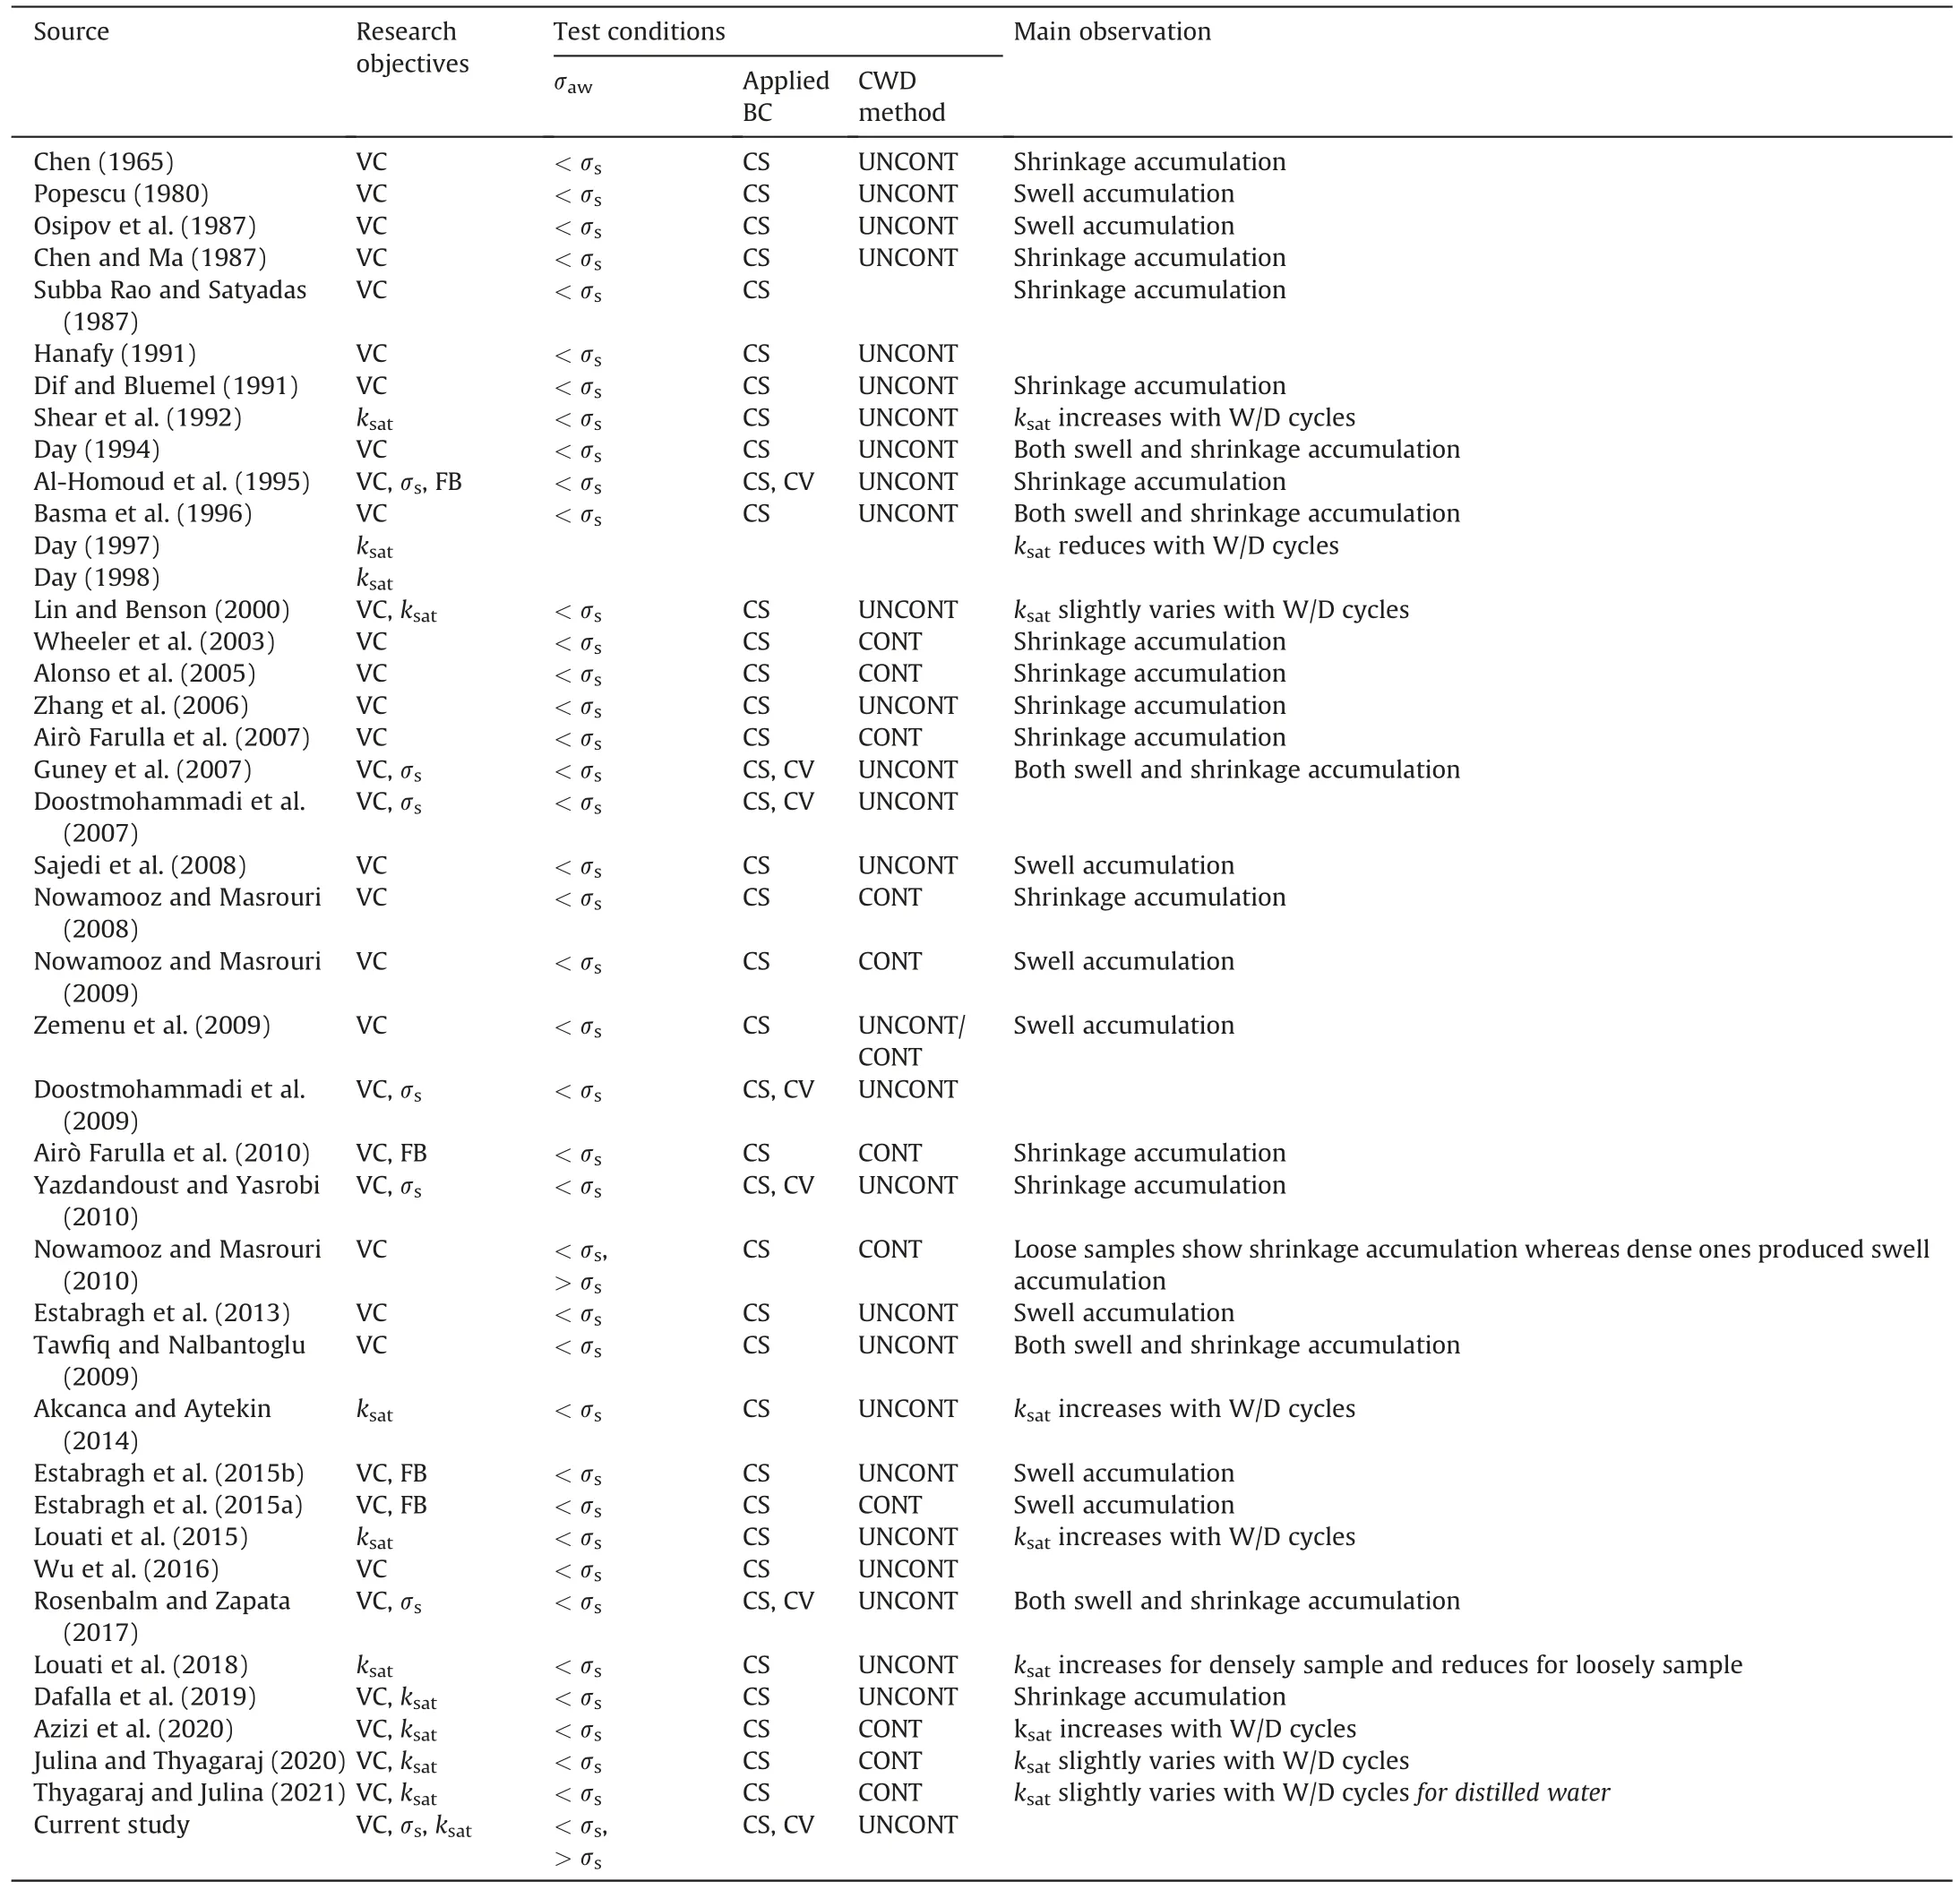
Table 1 List of researches concerned with CWD for expansive soils with their objectives,test conditions and main observations.
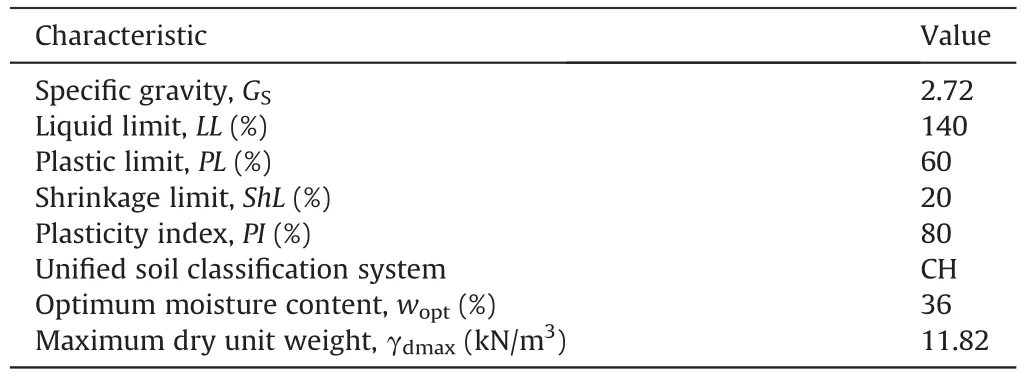
Table 2 Summary of soil characterization data for Qatif clay.
Compacted samples were employed in this testing program to simulate the engineered applications and minimize heterogeneity in the tested samples.Disturbed samples collected from field were dried in air,crushed,and screened through sieve No.40 to produce soil powder that contains all its gradients.This powder was mixed with a target moisture content (wc) of 32%,and stored in air-tight plastic bags inside humid desiccators for at least 48 h to warrant a uniform moisture content distribution.After the homogenization period,the soil was statically compacted in an oedometer ring(with a height and an internal diameter of 20 mm and 50 mm,respectively)to the target dry unit weight(γd)of 11.67 kN/m3.It is noteworthy that the target dry unit weight (γd) and moisture content(wc)were selected to be dry-of-optimum in order to have a pronounced volume change during wetting.The internal ring wall was first lubricated with silicone lubricant to exclude the side friction impact,permitting free lateral shrinkage around the surface side area of the tested sample during the drying process and avoiding favored flow along this side area that might alter the determination of saturated hydraulic conductivity (ksat).The placement condition of the tested samples(γdandwc)was selected as 4% dry-of-optimum moisture content as acquired from the standard compaction test(ASTM D698,2000).To identify the initial suction condition of the tested specimens,triplicate specimens were prepared at the placement condition,and the average value of as-compacted suction was 3.4 MPa as obtained using a chilledmirror dew point meter device (WP4C).
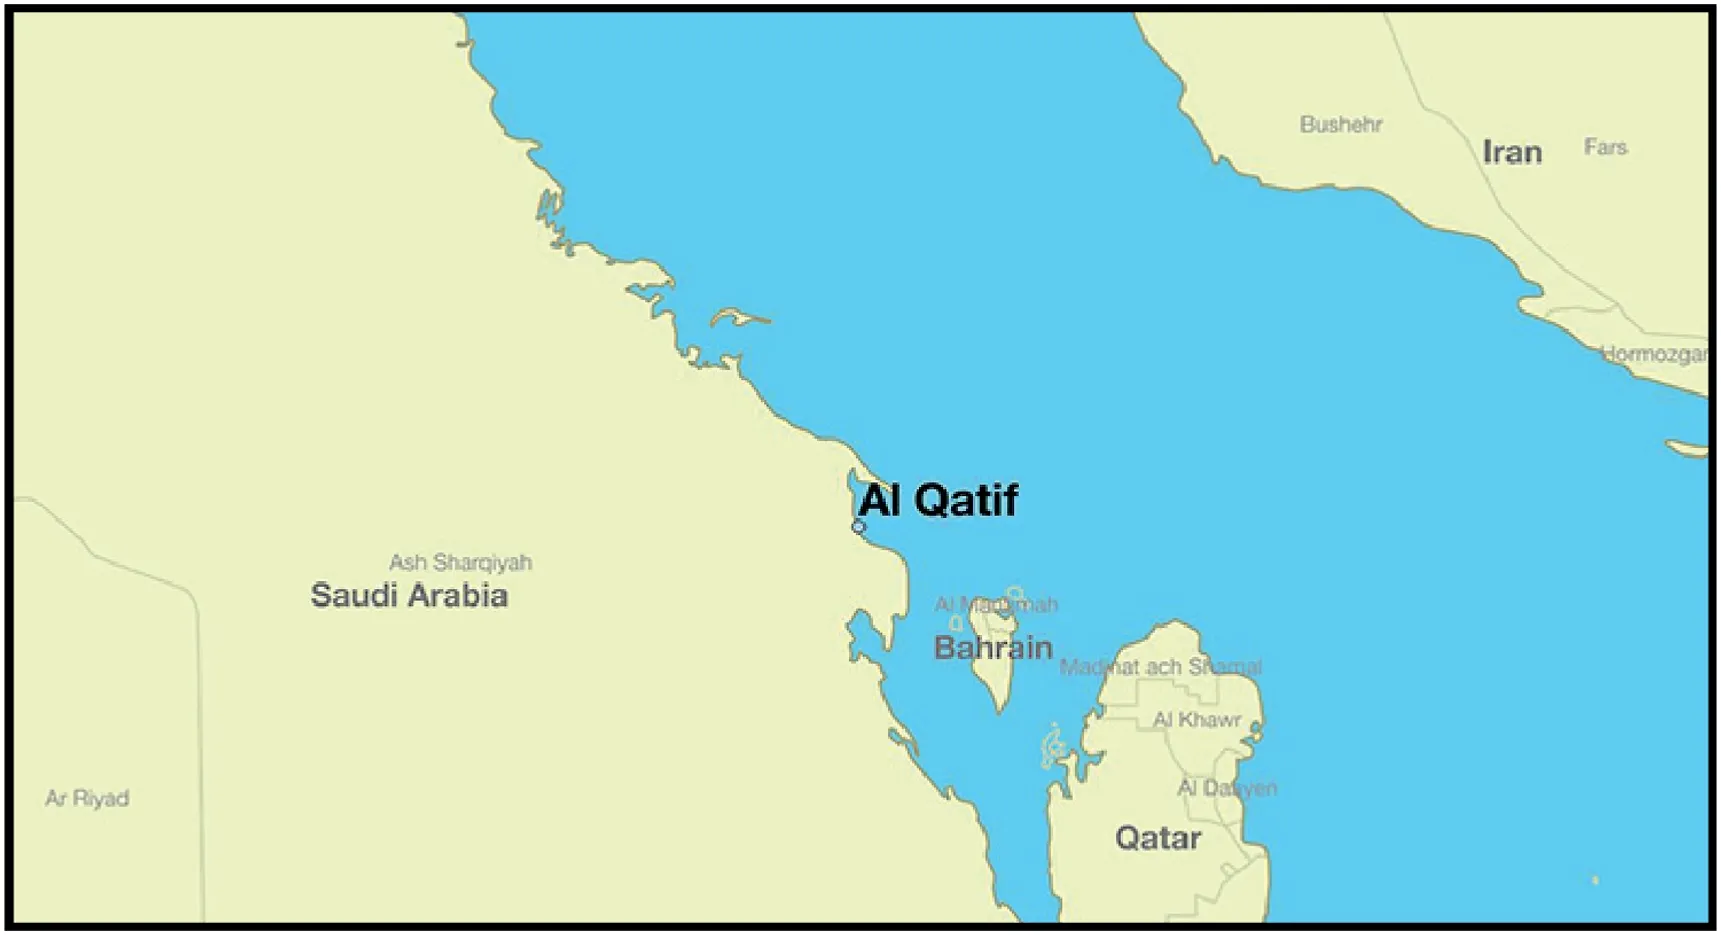
Fig.1.General layout location of the sampling area.
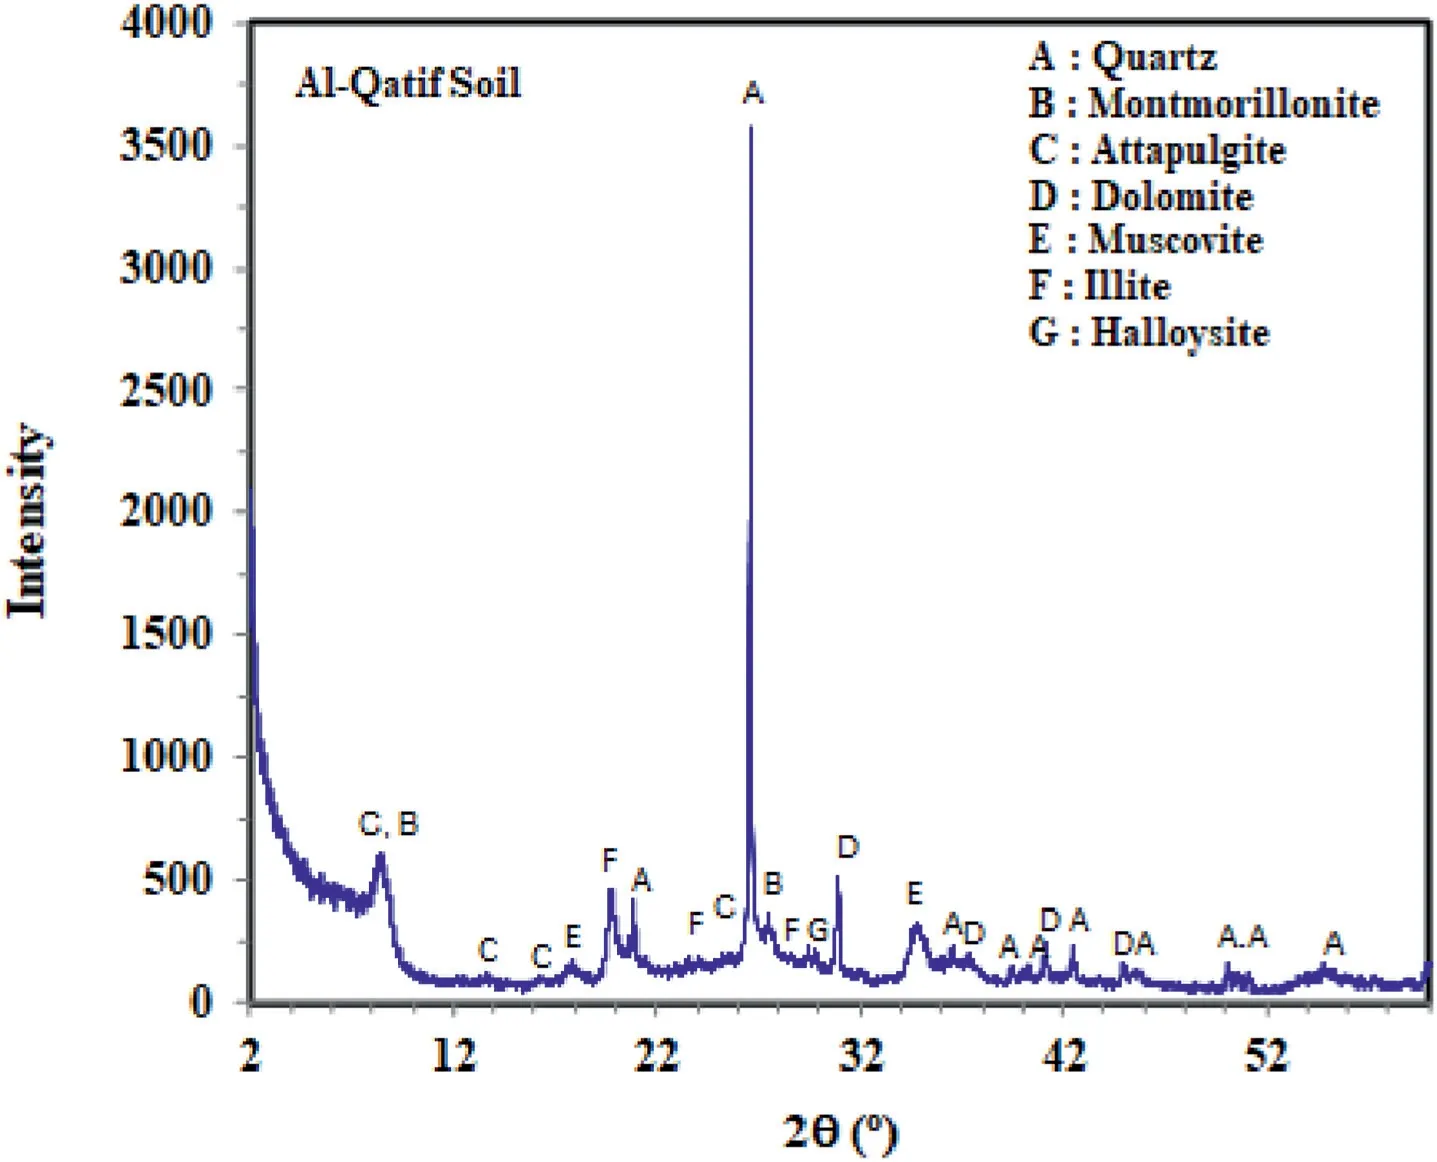
Fig.2.X-ray diffraction analysis for Qatif clay.
3.Testing procedures
CWD operations can be grouped into uncontrolled and controlled techniques.In uncontrolled techniques,alternate soaking and drying processes were employed.Controlled CWD processes were achieved by adopting suction control.Krisdani et al.(2008) concluded that drying rates do not significantly affect the results obtained from and Rosenbalm and Zapata (2017) agreed with this conclusion.Besides that,Airò Farulla et al.(2010)reported that the applied suction increment marginally influences the final total vertical displacement,and consequently,CWD can be executed in a single step.
On the basis of the recommendations from previous studies and to reduce the testing time,the authors executed the CWD process by implementing air circulation (an uncontrolled W/D technique)in oedometer testing,as described in the section dealing with the equipment.The CWD sequence is started first by the wetting stage,as is the case of most studies,except Allam and Sridharan(1981).To establish the ultimate suction applied to the samples by the drying cycles termination,the suction of different representative samples was evaluated using a WP4C device with an estimated values ranging between 200 MPa and 250 MPa.
This experimental program is divided into two oedometer series,i.e.constant stress(CS)and constant volume(CV).These series simulate the two main possible field boundary conditions,and each series included several tests varying according to the applied axial wetting stress (σaw).To cover the gap in the literature where investigating the impact of CWD on hydromechanical behavior has only been for samples exhibiting swell potential during the first wetting stage,the axial wetting stress(σaw)applied in this research extended from 25 kPa to 1000 kPa.This broad domain of stress states is considered to examine the behavior of the examined soil under diverse swelling and collapsing conditions.Fig.3a and b schematically depicts the stress/wetting paths followed in CS and CV series,respectively.
Oedometer testing was performed following ASTM D2435-04(2004) and ASTM D4546-03 (2003) to inspect the volume change potential and adopt permeability testing.However,the difference between the CS and CV series is the boundary condition applied during repetitive cycles.The CS series followed method B of ASTM D4546-03(2003)(σawmaintained constant),whereas the CV series adopted method C in the same standard(sample height maintained constant).After subjecting each sample to the target axial wetting stress (σaw),successive W/D cycles were initiated.Each test was subjected to six W/D cycles in which each cycle consisted of the wetting stage,followed by the permeability stage,and the cycle concluded at a drying stage.Every oedometer stage was initiated after the preceding stage reached an equilibrium state.The equilibrium state was considered achieved in both CS and CV series when there was nearly no variation detected with time (over a period of 12 h)for axial strain(εa)and axial stress(σa),respectively.Note that the axial stress (σa) acquired at the wetting equilibrium state is defined as swell pressure (σs),as obtained under the CV condition.The permeability tests were executed using the falling head technique implemented in oedometer testing,as described subsequently.
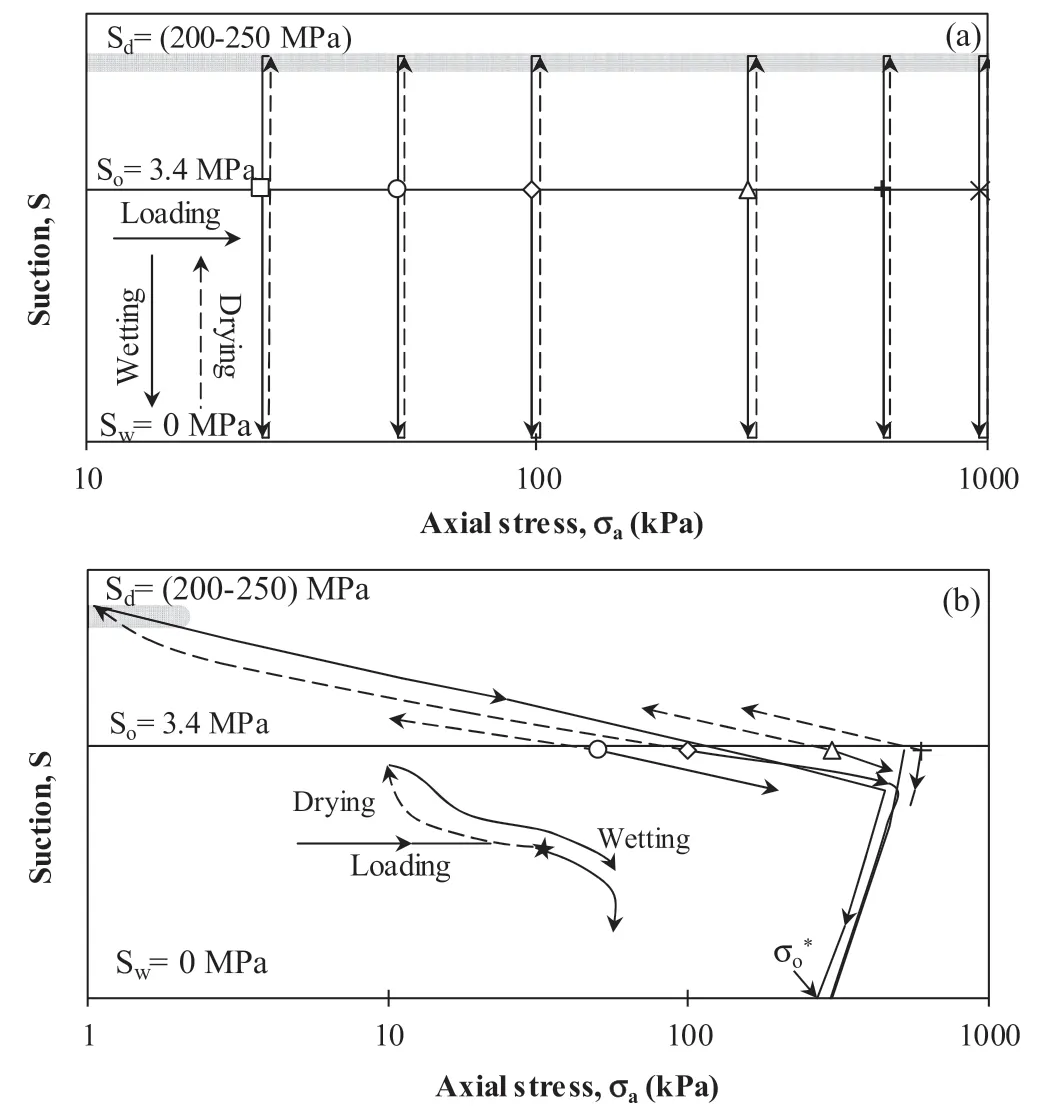
Fig.3.Implemented stress paths in the study.
It should be mentioned here that the axial strain attained at the close of the wetting stage(axial wetting strain,εaw)is equal to the volumetric strain because of the full recovery of the samples’initial diameter (ring diameter) based on experimental evidence,as will be described later.However,the case is not true during neither the drying stage because of lateral shrinkage nor the early part of the wetting stage owing to the partial diameter recovery.
Continuous monitoring of the sample’s diameter is impossible during the oedometer test.A vernier caliper could be used to execute the diameter measurement at the close of the drying stage after dismantling the tested samples from oedometer setup.After several attempts of measuring the sample’s diameter at the close of the drying stage using vernier caliper,the measurement could lead to estimation errors of either volume change potential or saturated hydraulic conductivity (ksat).These errors could be ascribed to several individual or collective causes such as structure hysteresis because of the unloading of applied stress,sample crumbling during dismantling and diameter measurement,and hence a probable loss of small crumbles,loss of initial sample’s orientation at reassembling.Moreover,Julina and Thyagaraj (2019) reported that vernier caliper measurements underestimate volumetric deformation as they do not capture the volume of the cracks developed within the soil specimen.Consequently,in present study,the authors relied on the axial strain instead of volumetric strains where they chose to avoid the causes of errors that might arise from diameter measurement,which could alter the main study objectives,upon adding a secondary and inaccurate measurement.
Tables 3 and 4 summarize the tests,including test reference(ID)and testing conditions.Each test ID represents the boundary condition applied,target axial stress(σa),and number of cycles applied.For instance,CS_100_2nd refers to the second cycle of an oedometer test examined under constant axial stress of 100 kPa.
4.Equipment
Oedometer testing was implemented in conventional oedometer cells with a stainless steel fixed ring type.The fixed ring type cells can implement the falling head permeability test,giving the advantage of readily applying axial stress (σa) and accurate continuous record of axial deformation (Δha),leading to a more accurate assessment of void ratio(e).To measure axial deformation,the oedometer cells were fitted with a linear variable differential transformer,with an accuracy of 0.001 mm.The loading device used for the CS series was a front-loading machine that is capable of applying dead loads to tested specimens.A stress/strain-controlled loading machine,having a load cell with an accuracy of 1 N to measure the applied axial force,was used for executing CV series.Both transducers were connected to a data logger to continuously record the data.
Fig.4 depicts the oedometer cell setup involving modification to execute permeability tests in addition to applying the CWD process as well as the state of installed valves during testing stages.The wetting process was adopted by conventional soaking.The water flow direction,during permeability testing,was from the lower base (with a variable water head) to the upper side of the sample(with a constant water head) to avoid any air entrapment.The initial hydraulic head applied was approximately 48 cm and testing was stopped once four successive measures of hydraulic conductivity reached the same value (±3%).The drying process was adopted by air circulation,under low pressure,above and below the sample edges,with all valves opened and running the source of low air pressure (Fig.4).
5.Experimental results
Tables 3 and 4 summarize the main test results of constant stress and constant volume series,respectively.Hereinafter,theresults of both testing groups for the first wetting stage and the subsequent W/D cycles are presented.

Table 3 Summary of test conditions and results of CS series.

Table 4 Summary of test conditions and results of CV series.
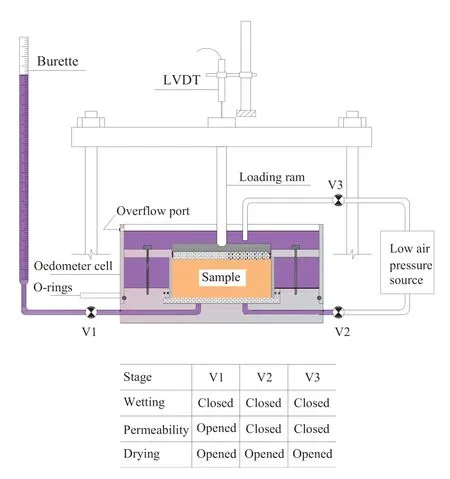
Fig.4.Setup of the oedometer cell with the falling head permeability test and CWD process.
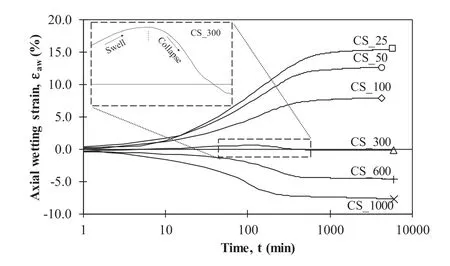
Fig.5.Evolution of axial wetting strain during the first wetting stage under CS conditions.
Initially,the volume change potential for the first wetting stage under the examined stress and boundary conditions (CS and CV series) is depicted.For the CS series,the volume change potential during wetting is in the form of a variation of strain states (either swell or collapse)as depicted in Fig.5 for developing axial wetting strain (εaw)versus time(t).Three trends for εaw-trelations(swell,swell-collapse,and collapse) were detected depending on the applied axial wetting stress (σaw).Particularly,swell potential was observed for samples CS_25,CS_50 and CS_100,whereas collapse potential was observed for samples CS_600 and CS_1000.Sample CS_300 exhibited the swell behavior in the initial duration of the test,tailed by a collapse.On the other hand,the volume change potential under CV conditions was experienced in pattern of stress state variation,as in Fig.6 for the evolution of axial stress(σa)with time (t) for the examined axial wetting stresses (σaw).The axial stress values of samples CV_50,CV_100 and CV _300 increased to reach a peak,followed by axial stress reduction to reach an equilibrium state.A reduction in the axial stress state was detected from the start of the wetting stage for sample CV_600.
The volume change potential of samples subjected to CWD under CS conditions is presented in the form of equilibrium axial strain(εae),defined as the percentage of the axial deformation (Δha),at equilibrium during either wetting or drying,to the initial height of the sample before the first wetting(hi).Fig.7 presents the variation trend of the equilibrium axial strain(εae)for consecutive W/D cycles.
Fig.8 illustrates the variations of wetting potential under CV condition,with consecutive W/D cycles,defined as the equilibrium axial stress at a fully wetting state representing the swell pressure(σs),as defined in method C of ASTM D4546-03 (2003).
Saturated hydraulic conductivity (ksat) was estimated based on the falling head method.A reduction in estimated values occurred with time,or in other words,with a reduction in the applied hydraulic gradient (i).Fig.9 shows a typical trend of decreasing saturated hydraulic conductivity(ksat)with a reduction in hydraulic gradient (i).Even though the permeability test was initiated after completing the wetting stage (hence reaching an almost constant height of the sample),saturated hydraulic conductivity (ksat)reduced gradually to reach a residual value at a specific hydraulic gradient,termed in this paper as the equilibrium hydraulic gradient(ieq).This reduction is due to the continuous swell of aggregate into the macrovoids which in turn causes resistance to the movement of water.This correlates with Day(1997)’s observations.Fig.10 shows a general trend of increasing equilibrium hydraulic gradient (ieq)with increasing applied axial stress (σa) for all W/D cycles.This is because of the inhibition of swell potential with increasing axial wetting stress (σaw),reaching an equilibrium state of saturated hydraulic conductivity (ksat) at an early stage of the falling head permeability test.
Figs.7 and 8,as well as Tables 3 and 4,show the deviation of saturated hydraulic conductivity (ksat) with an advance in W/D cycles under CS and CV conditions,respectively.
6.Discussion
This section discusses the experimental program results and demonstrates the impact of the CWD process,applied stress and boundary conditions on the hydraulic and volume change behaviors of compacted highly expansive soil.
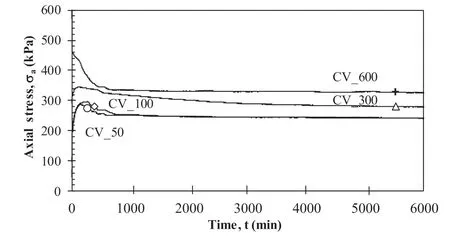
Fig.6.Evolution of axial stress during the first wetting stage under CV conditions.
6.1.Interpretation of VC behavior during first wetting stage based on the yield curve concept
With the development of computer-based numerical methods,numerous models have been suggested to characterize the behavior of expansive soils.Gens and Alonso (1992) were the pioneers to describe the elastoplastic behavior of expansive soils(as a conceptual basis),followed by Alonso et al.(1999) (as a full mathematical formulation) by considering two levels of structure(microstructure and macrostructure),referred to as the Barcelona expansive model (BExM).The core of this model is the yield curve that separates the elastic behavior from the plastic behavior and is postulated to uniquely represent both wetting and stress-induced yield points.Gens and Alonso (1992) and Alonso et al.(1999,2005) suggested to describe the yield locus for oedometer tests in either axial stress vs.suction(σa-s)or mean stress vs.suction(p-s)plane by the load-collapse (LC) curve (Fig.11).Another issue regarding the LC curve is its enlargement associated with plastic hardening as a result of subjecting the specimen to stress more than the stress history that it has endured either in form of load or suction.
The BExM(Alonso et al.,1999)defined two yield lines in the σa-sorp-splane (Fig.11),i.e.suction increase(SI)and suction decrease(SD),which are parallel to the neutral line (NL),separating the microstructural swell zone from the microstructural shrinkage zone.The SI and SD yield lines represent the start of macrostructural plastic strain because of microstructural shrinkage and swell,respectively(Fig.11).The plastic macrostructural strain provides unidirectional coupling because the LC curve shifts when either SI or SD is triggered,whereas the stimulation of LC curve affects neither SI nor SD.
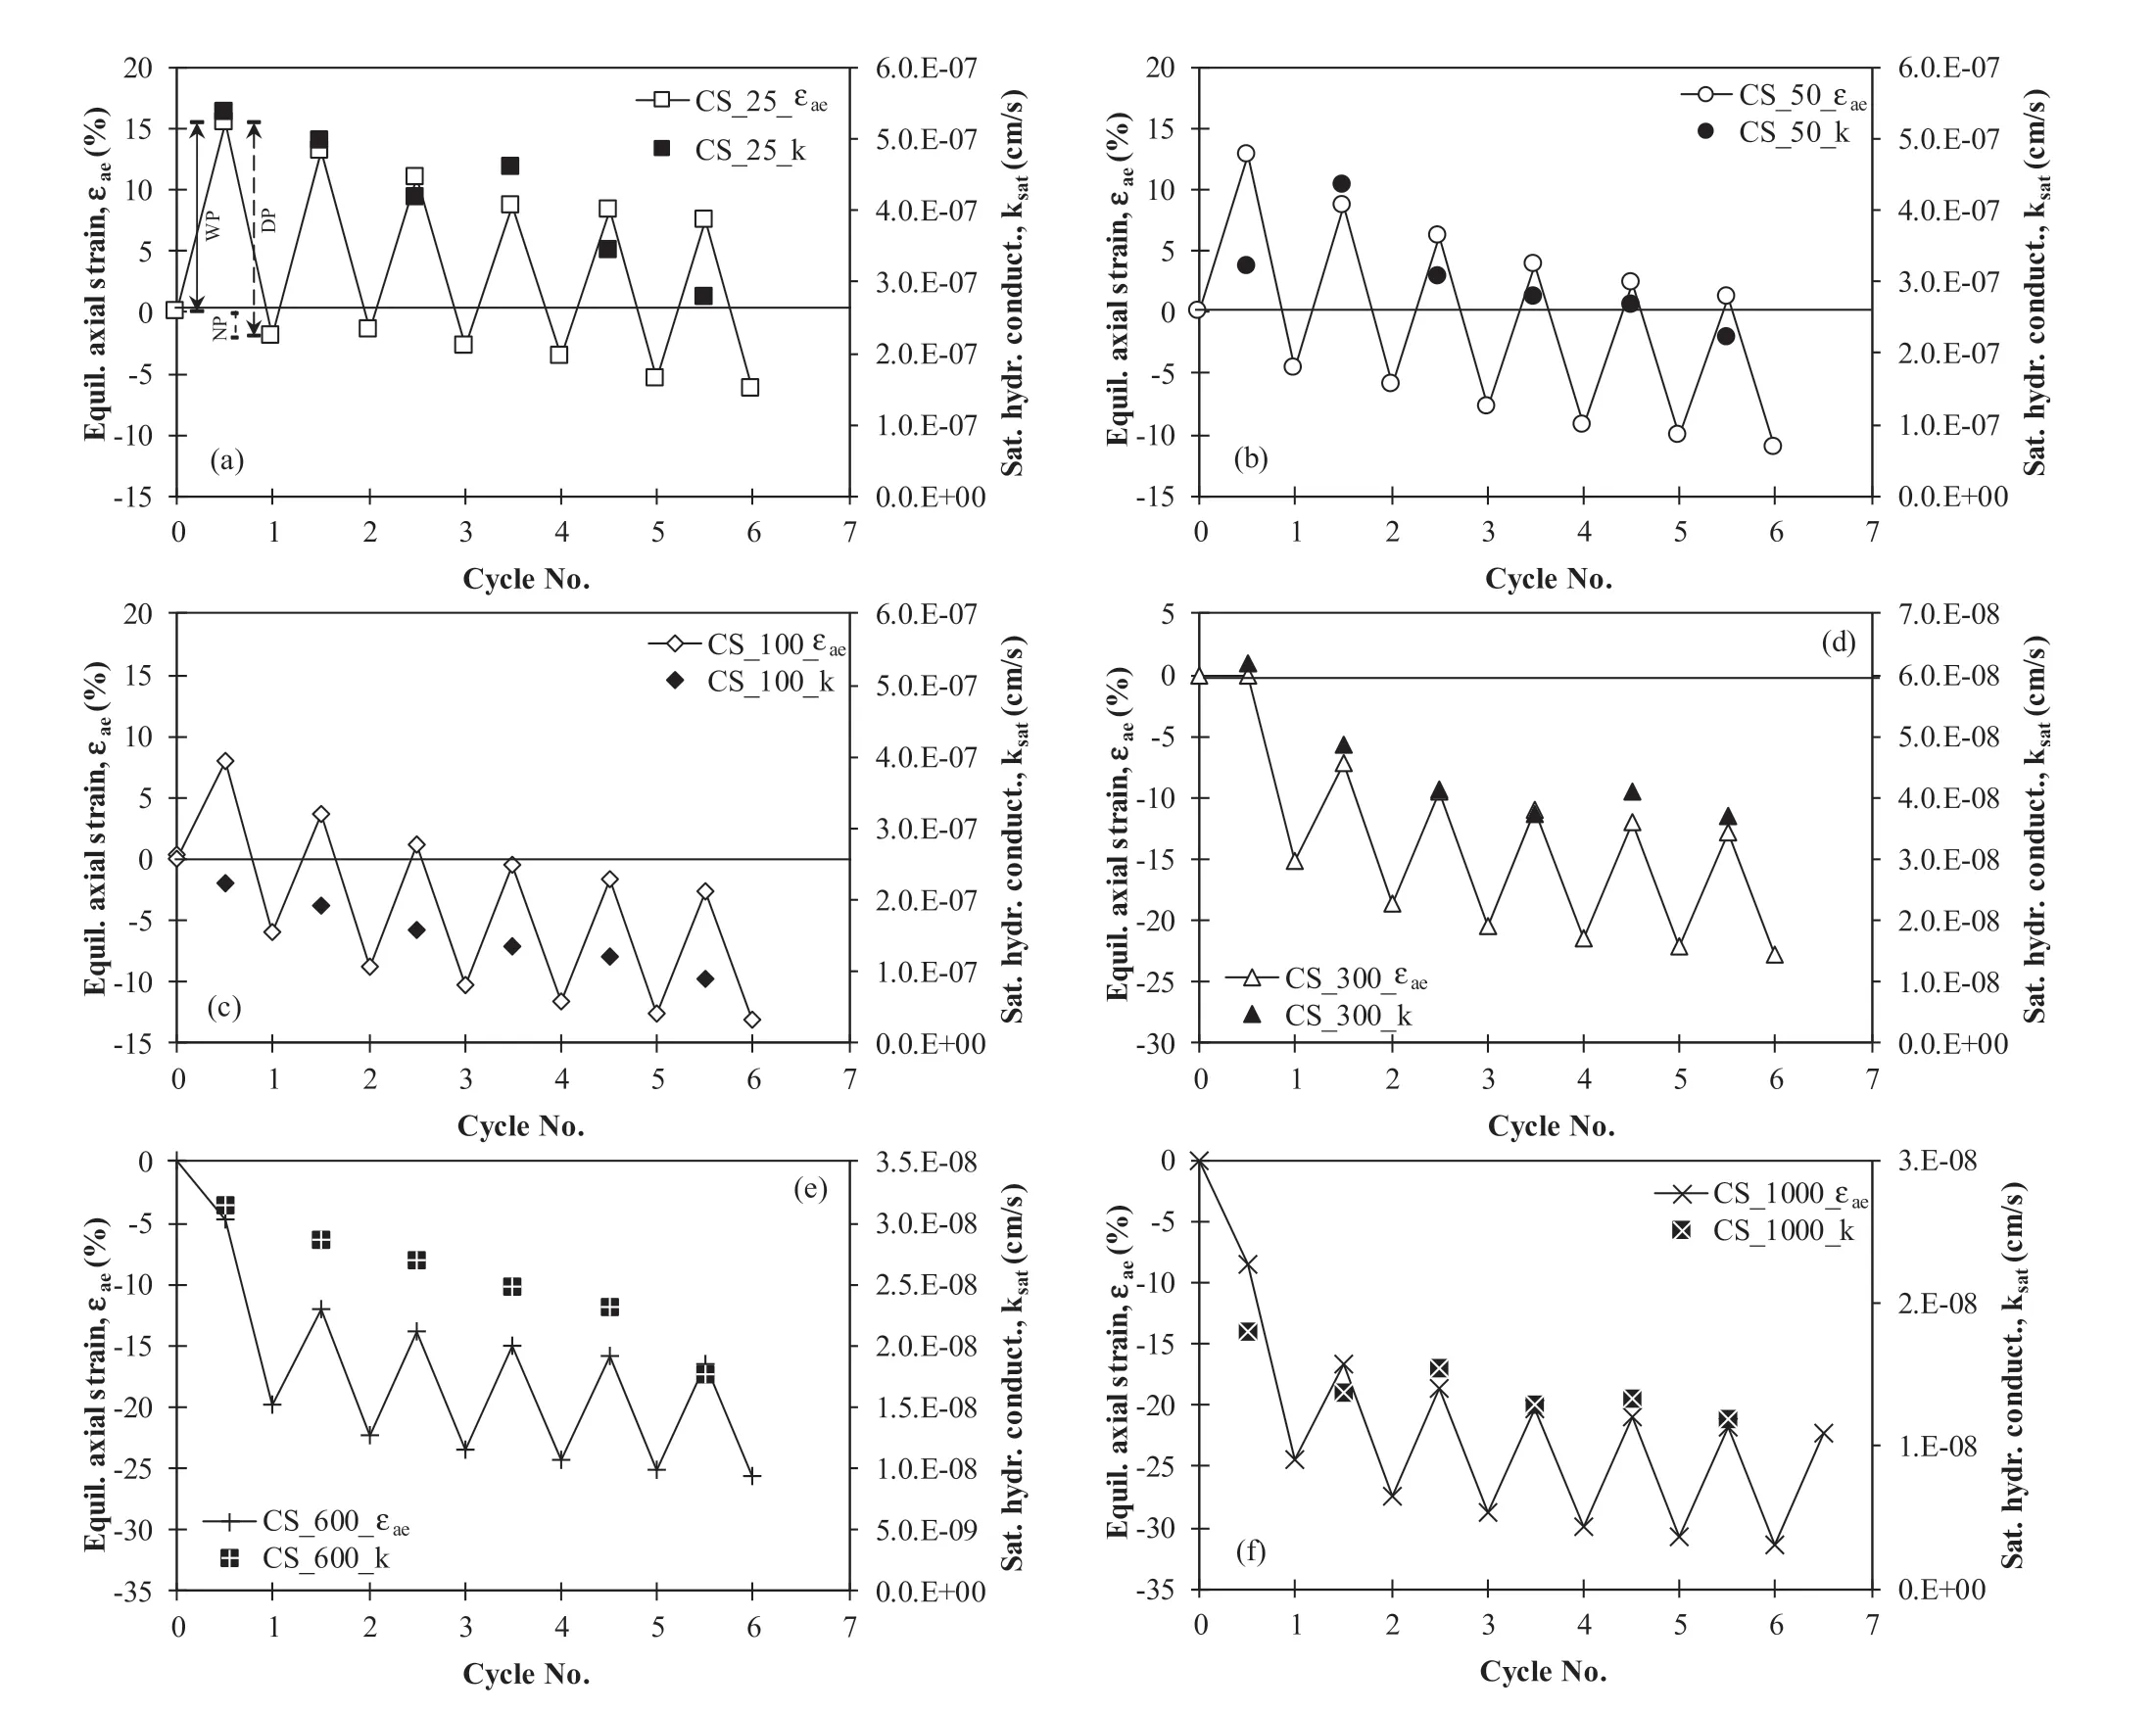
Fig.7.Impact of CWD on volume change potential and saturated hydraulic conductivity under CS conditions.
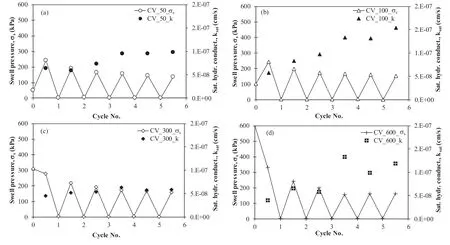
Fig.8.Impact of CWD on swell pressure and saturated hydraulic conductivity under CV conditions.
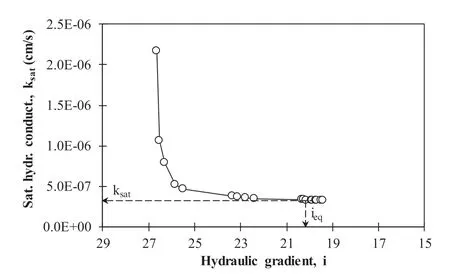
Fig.9.Typical trend for variation of saturated hydraulic conductivity with applied hydraulic gradient.
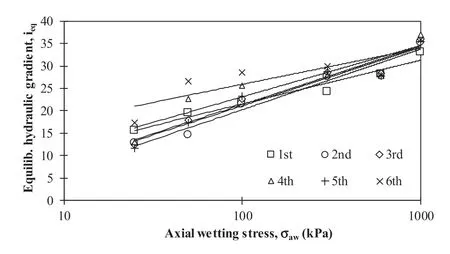
Fig.10.Dependence of equilibrium hydraulic gradient on applied axial stress.
The observed behavior in Section 6.1 could be explained by the yield curve concept established within the BExM.Fig.12 shows the LC curve boundaries for the tested soil that define the swell and collapse zones.Two yield points at zero suction (σo*) and ascompacted suction (σo) define the LC curve boundaries.The yield stress at zero suction (σo*) was obtained as the axial stress at equilibrium state attained at the close of wetting under CV condition for specimen subjected to wetting under small applied stress(237 kPa as obtained from test CV_50).However,the yield stress at as-compacted suction (σo) was evaluated as 500 kPa,based on Casagrande’s method,as obtained from the dry loading curve of the test labelled “CS_1000".
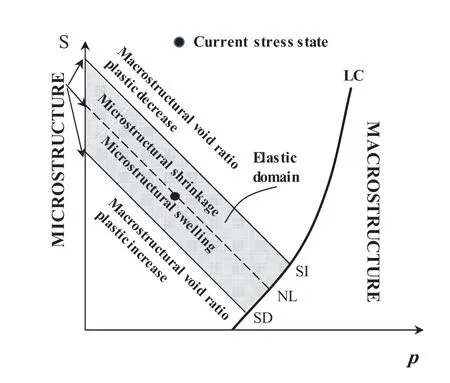
Fig.11.Graphical summary of the double structure elastoplastic model for expansive soils(Alonso et al.,1999).SI-suction increase,SD-suction decrease,NL-neutral line.
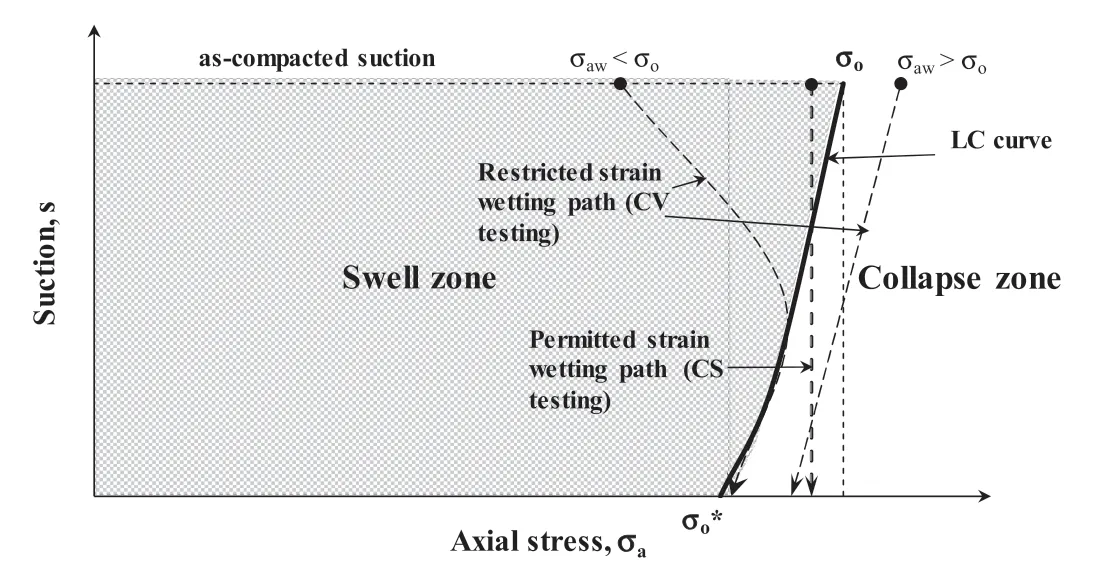
Fig.12.LC curve boundaries for the tested soil.
Based on LC concept (Fig.12),the wetting paths for samples under CS conditions that were less than the yield stress at zero suction(σo*=237 kPa)experienced swell behavior,whereas those under CS conditions that exceeded the yield stress at as-compacted suction (σo=500 kPa) underwent collapse behavior.The swellcollapse behavior was detected for wetting paths of samples under CS ranging between 237 kPa and 500 kPa.Regarding wetting under CV conditions,samples wetted under stresses that were less than the yield stress at as-compacted suction(σo=500 kPa)tended to swell,revealing as an increase in axial stress,up to an ultimate value to compensate for the swell strain caused by suction reduction,after which the yield state was initiated.From the yield point on,the sample tended to collapse,displaying as a reduction in the axial stress up to an equilibrium value at overall saturation to maintain the CV condition.The LC yield surface controlled the peak value (Alonso et al.,1999,2005),and the reduction in axial stress with subsequent wetting approximately followed the yield locus under CV condition (Fig.12).However,collapse behavior was observed from the start of the wetting stage for specimens loaded with stress more than 500 kPa and manifested by a decrease in axial stress(σa)(Fig.12).Loading samples to stress higher than the yield stress at the as-compacted state (σo) resulted in an enlargement of the LC curve,and hence the stress path for wetting under CV conditions followed the enlarged yield locus at CV.
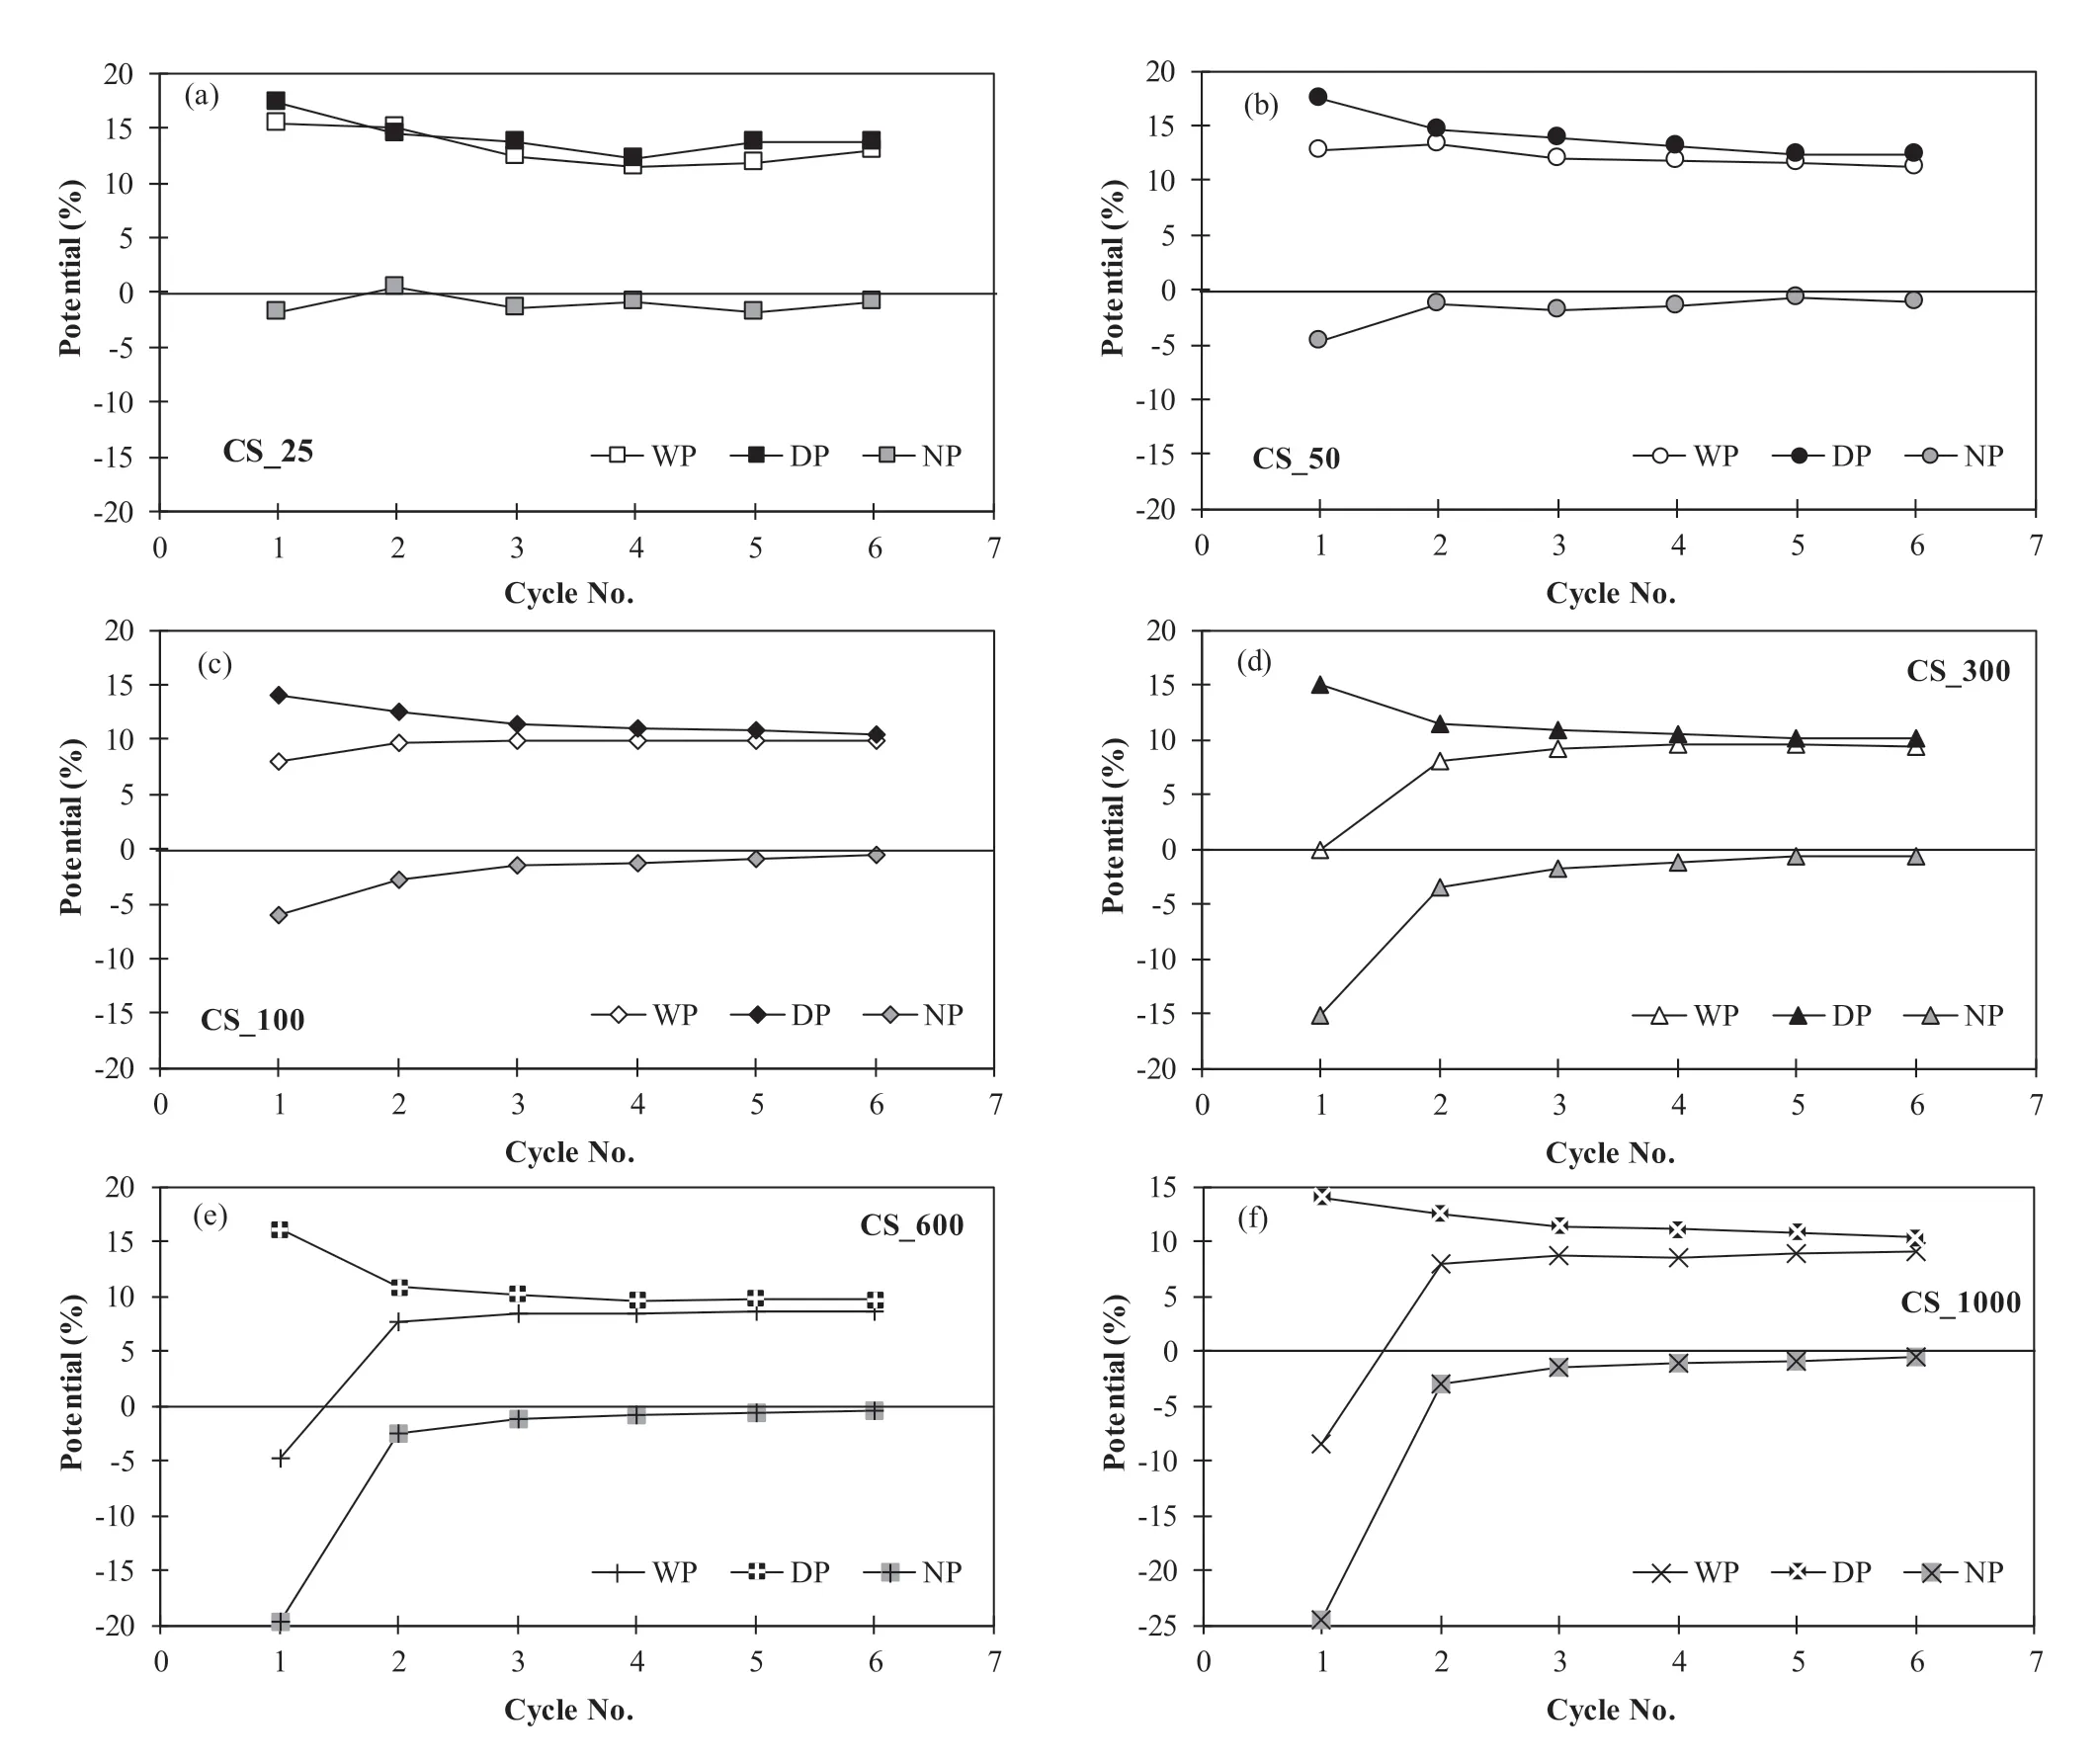
Fig.13.Variations of wetting,drying and net potential with successive W/D cycles.
6.2.Cyclic W/D impact on volume change behavior
An accumulated shrinkage strain is observed for all the tested samples that either experienced swell (Fig.7a-c),swell-collapse(Fig.7d),or collapse (Fig.7e and f) potential during the first wetting stage.This behavior is consistent with reported results (Chen,1965;Chen and Ma,1987;Subba Rao and Satyadas,1987;Dif and Bluemel,1991;Al-Homoud et al.,1995;Wheeler et al.,2003;Alonso et al.,2005;Zhang et al.,2006;Nowamooz and Masrouri,2008;Airò Farulla et al.,2007,2010;Yazdandoust and Yasrobi,2010;Dafalla et al.,2019).The reader should be reminded here that the tested samples were lightly compacted,and hence the observed behavior correlates with the dependence of volume change accumulation on the initial compacted state (Nowamooz and Masrouri,2010).An equilibrium condition (elastic response)is attained for all the tests in the series by repeated CWD.
For clarity,two parameters are defined in Fig.7a,i.e.wetting potential (WP,%) and drying potential (DP,%),and Fig.13 shows their evolution with successive W/D cycles.WP and DP are defined as the change of εaeowing to the wetting and drying process,respectively.The difference between these two parameters at each cycle represents the net axial strain after each cycle(NP,%),i.e.the attained plastic axial strain at the close of each cycle.Fig.13 shows that the DP exceeds the WP at each cycle,and hence an accumulated shrinkage is detected.Moreover,the DP reduces while the WP increases with repeated W/D cycles because of the plastic shrinkage deduced in the preceding cycle.Samples that experienced collapse during initial wetting exhibited similar DP values.Furthermore,an elastic volume change response to CWD (i.e.equilibrium condition) is detected after reaching the equilibrium cycle,ranging from the fourth to the fifth cycle.The equilibrium cycle reduces (i.e.the elastic state appears more rapidly) as the axial wetting stress(σaw)increases.Finally,the first cycle produced the greatest variation in swell potential and functions as a preconditioning cycle that effectively reassemble the soil fabric toward the equilibrium state,correlating with the findings presented by Rosenbalm and Zapata (2017).
Fig.14 shows the evolution of the WP-σafunction with consecutive W/D cycles.The WP-σafunction of the tested samples experienced less response to the applied stress with the developing W/D cycles,with the first and second cycles being the most effective,and the WP-σafunction reached a constant from the fourth cycle.
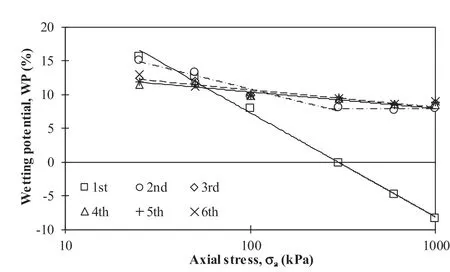
Fig.14.WP vs.applied axial stress trends for applied W/D cycles.
Fig.15 shows the evolution of axial strain (εa) during rewetting in successive wetting stages,for samples experiencing volume change potential other than swell at the first wetting stage,under CS conditions.This is evidence of the enlargement of the yield curve with repeated W/D(Alonso et al.,1999,2005).Only swell potential that experienced as an increase in axial strain (εa) is observed during successive wetting cycles for samples CS_300,CS_600 and CS_1000,inferring an enlargement in the yield curve because of drying tested samples to suction higher than its as-compacted state.
With respect to the impact of CWD on the volume change behavior under CV conditions,a decrease in swell pressure (σs) is observed with successive W/D cycles up to an equilibrium cycle ranging from the third to the fourth cycle(Fig.8).Furthermore,the reduction in swell pressure (σs) after the first and second cycles is notably more than that for successive cycles,which means that the clay structure in these cycles was changed more than the following cycles.Comparatively,these observations are consistent with those reported by Basma et al.(1996)and are ascribed to the reduction of water absorption capability.
6.3.Cyclic W/D impact on hydraulic conductivity
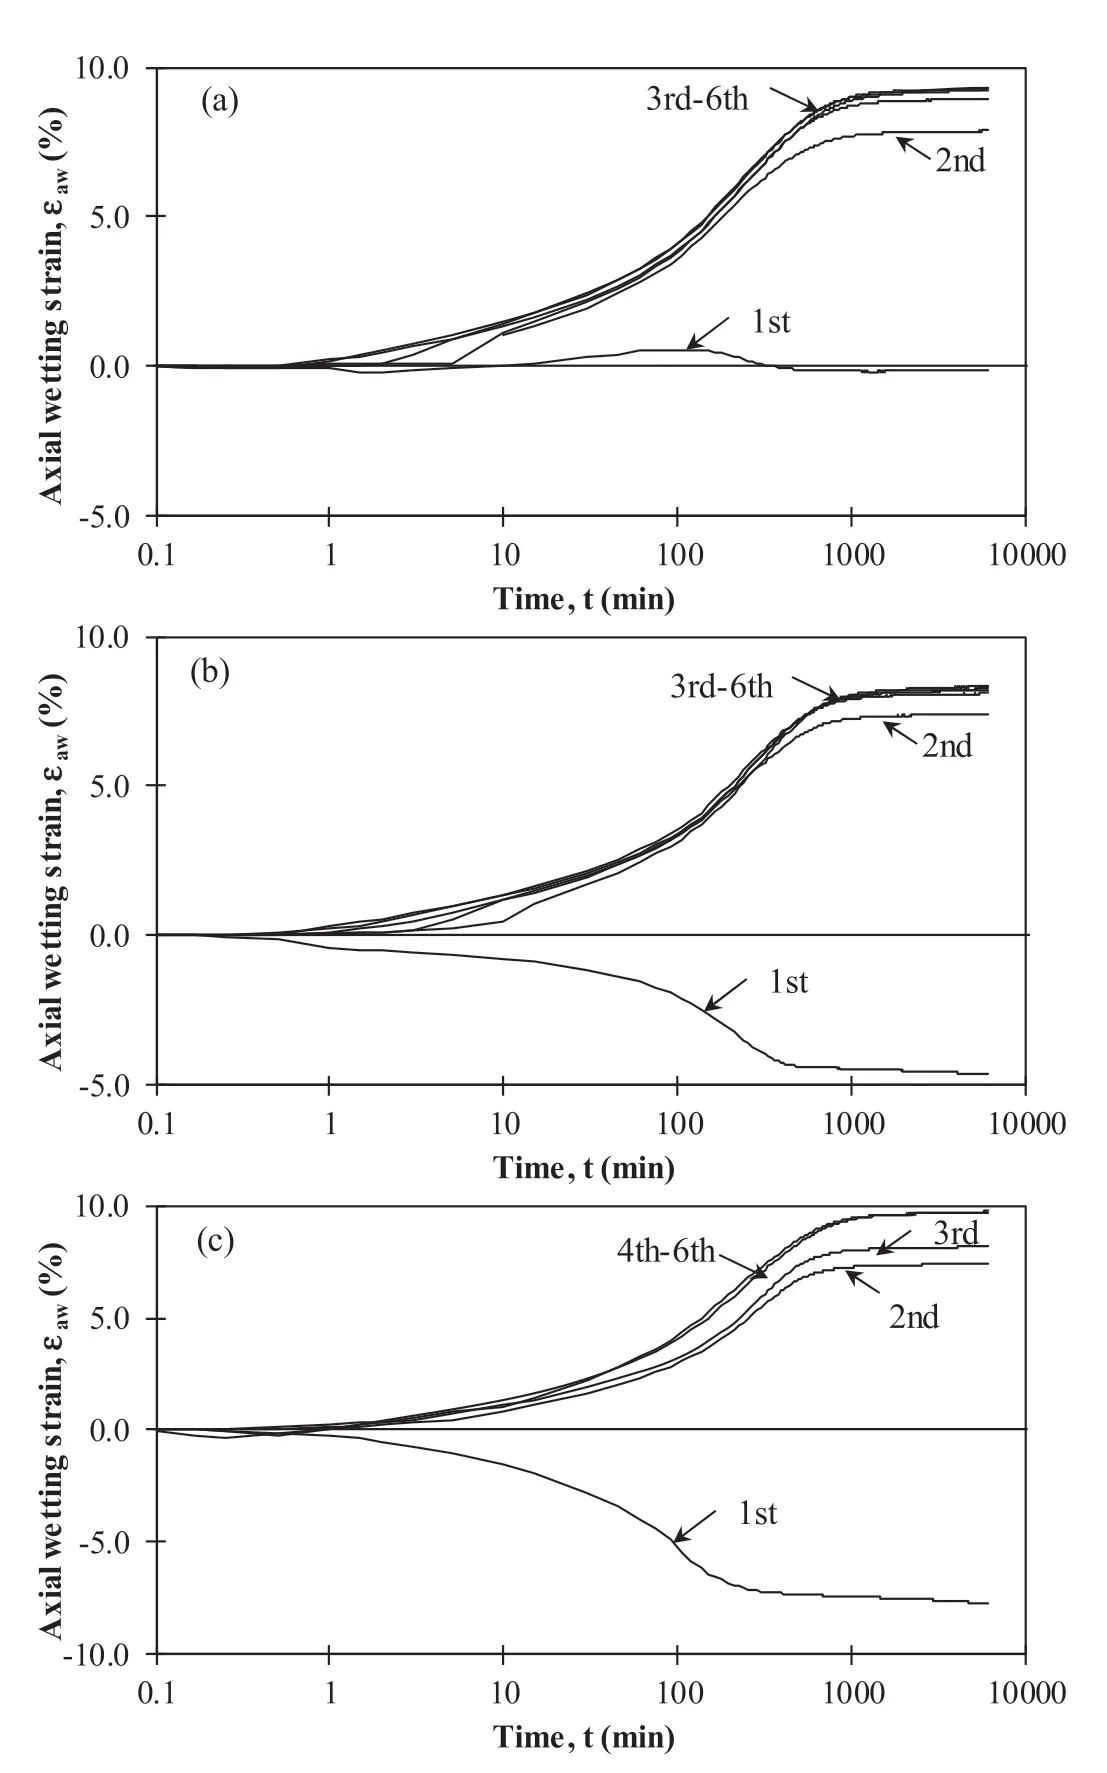
Fig.15.Evolution of axial wetting strain during wetting stages under CS conditions of(a) 300 kPa,(b) 600 kPa,and (c) 1000 kPa.
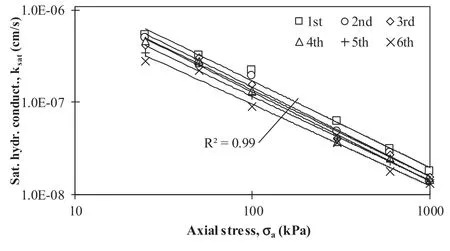
Fig.16.Saturated hydraulic conductivity vs.applied axial stress(ksat-σa)functions for considered wetting cycles under CS conditions.
A general reduction trend in saturated hydraulic conductivity(ksat) with successive W/D cycles is observed from Fig.7 for all stress states.This is attributed to a high proportion of montmorillonite clay in the tested soil,and hence a full healing of cracks developed during drying,besides the shrinkage accumulation observed during repeated W/D cycles,resulting in decrease of void ratio (e).This is contrary to the findings of Shear et al.(1992),Albrecht and Benson (2001),Akcanca and Aytekin (2014),Louati et al.(2015) and Azizi et al.(2020) who reported an increase in saturated hydraulic conductivity(ksat)with successive W/D cycles,which could be linked to the partial recovery of drying cracks.It is noteworthy that the decrease in saturated hydraulic conductivity(ksat) upon CWD is evidence of the full recovery of the samples’initial diameters at the close of the rewetting stages (Day,1994).Concerning the CV series (Fig.8 and Table 4),an almost constant value of saturated hydraulic conductivity (ksat) is observed during consecutive W/D cycles,which can be attributed to the constant height maintained,and hence a constant void ratio(e)of the tested samples at the close of the wetting cycles.
Table 3 and Fig.16 show that the saturated hydraulic conductivity (ksat) is inversely correlated to the axial wetting stress(σaw),with an observed effect of CWD on the trends.The inverse relationships were evaluated for all cycles and the reduction of saturated hydraulic conductivity (ksat) at the same axial wetting stress(σaw),with an accumulative number of W/D cycles deduced,generally,the decrease in saturated hydraulic conductivity (ksat)with a decrease in void ratio(e).In this regard,saturated hydraulic conductivity (ksat) is preferably depicted as a function of the void ratio (e) in Fig.17,with one relation correlating the saturated hydraulic conductivity (ksat) and void ratio (e) for each applied cycle.The plotted results of saturated hydraulic conductivity (ksat) estimated under CV conditions are below the trend obtained from the CS series.For an identical void ratio (e),the saturated hydraulic conductivity (ksat) obtained under CV is less than that measured under CS.Reduction of saturated hydraulic conductivity (ksat) can be attributed to the invasion of macrofabric by swell of microstructure.This agrees with the interpretation of Loiseau et al.(2002) and Cui et al.(2008) that wetting under CV condition reduced the volume of macro-pore family in the soil,thus decreasing the soil permeability.Both the void ratio (e) and the boundary and wetting conditions applied are the principal variables affecting saturated hydraulic conductivity(ksat).By compiling the results of all cycles of the CS series in one graph,Fig.18 shows that only the first and second cycles have a distinct trend,whereas all subsequent cycles can be compiled in one trend.Accordingly,subjecting compacted layers in the field to two W/D cycles resulted in acquiring the steady state of saturated hydraulic conductivity(ksat).
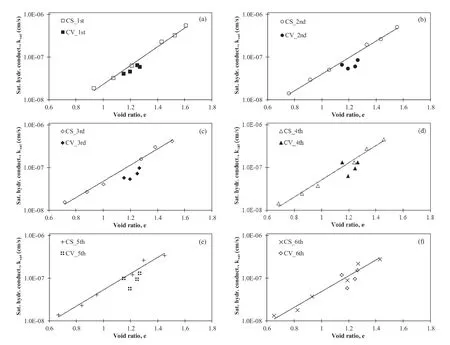
Fig.17.Saturated hydraulic conductivity vs.void ratio (ksat-e) functions for applied wetting cycles under CS and CV conditions.
7.Conclusions
This study focused on evaluating the hydraulic and volume change behaviors of expansive soils considering the probable field stress,boundary,and seasonal climatic variation.CWD processes were applied for two boundary conditions,i.e.CS and CV,and variant axial stress states.Based on the results of this study,the following conclusions are drawn:
(1) The adopted CWD influenced the hydraulic and volume change behaviors of expansive soils,with the first cycle of W/D being the most influential,effectively reorienting the soil fabric toward the equilibrium state.
(2) The CWD process resulted in swell fatigue,manifesting as either shrinkage accumulation for samples tested under CS conditions or reduction in the axial stress state at full saturation(swell pressure)for wetting under CV conditions.It is attributed to the initial placement condition,specifically for a loosely compacted state.
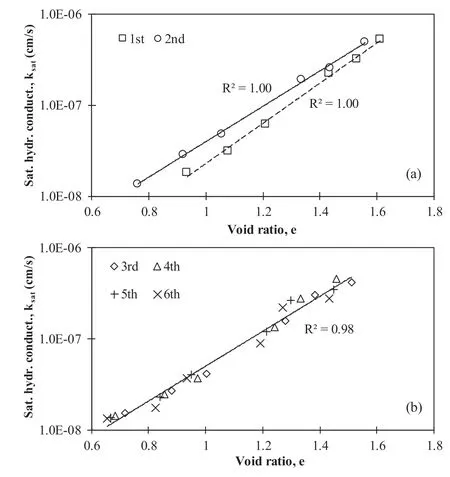
Fig.18.Saturated hydraulic conductivity vs.void ratio (ksat-e) functions for the (a)first and second wetting cycles and (b) third to sixth wetting cycles under CS conditions.
(3) A general trend of reduction in saturated hydraulic conductivity (ksat) with sequential W/D cycles was observed for all stress states applied and was related to the shrinkage accumulation observed during repeated W/D cycles.
(4) A volume change in the elastic state was achieved after the fourth to fifth cycle for CS conditions and the third to fourth cycle for CV conditions,whereas the residual values of saturated hydraulic conductivity(ksat)were reached after the third cycle.
(5) Swell pressure (σs) and saturated hydraulic conductivity(ksat) are not intrinsic parameters of the expansive soil but rather dependent on stress,boundary and wetting conditions.
(6) The applied boundary state slightly affected saturated hydraulic conductivity (ksat).Contrarily,the loading level and the adopted W/D cycles significantly influenced theksatvalue.
Data availability
The data used to support the findings of current study are available from the corresponding author upon request.
Declaration of competing interest
The authors declare that they have no known competing financial interests or personal relationships that could have appeared to influence the work reported in this paper.
Acknowledgments
The authors are grateful to the Deanship of Scientific Research,King Saud University,for funding this research through Vice Deanship of Scientific Research Chairs Program.
List of symbols
γdDry unit weight
wcMoisture content
σaAxial stress
σawAxial wetting stress
σoYield stress at as-compacted suction
σo* Yield stress at saturation
σsSwell pressure
εawAxial wetting strain
εaeEquilibrium axial strain
iHydraulic gradient
eVoid ratio
ieqEquilibrium hydraulic gradient
ksatSaturated hydraulic conductivity
 Journal of Rock Mechanics and Geotechnical Engineering2023年2期
- Journal of Rock Mechanics and Geotechnical Engineering的其它文章
- A multi-purpose prototype test system for mechanical behavior of tunnel supporting structure: Development and application
- Experimental investigations on effects of gas pressure on mechanical behaviors and failure characteristic of coals
- Strength and deformation characteristics of irregular columnar jointed rock mass: A combined experimental and theoretical study
- Spatial distribution and failure mechanism of water-induced landslides in the reservoir areas of Southwest China
- Characteristics of electromagnetic vector field generated from rock fracturing
- Geotechnical investigation of low-plasticity organic soil treated with nano-calcium carbonate
