
Pressure-induced stable structures and physical properties of Sr–Ge system
2023-02-20 13:15:30ShuaiHan韩帅ShuaiDuan段帅YunXianLiu刘云仙ChaoWang王超XinChen陈欣HaiRuiSun孙海瑞andXiaoBingLiu刘晓兵
Chinese Physics B 2023年1期
Shuai Han(韩帅), Shuai Duan(段帅), Yun-Xian Liu(刘云仙),2,†, Chao Wang(王超),2,Xin Chen(陈欣),2, Hai-Rui Sun(孙海瑞),2, and Xiao-Bing Liu(刘晓兵),2,‡
1Laboratory of High Pressure Physics and Material Science,School of Physics and Physical Engineering,Qufu Normal University,Qufu 273165,China
2Advanced Research Institute of Multidisciplinary Sciences,Qufu Normal University,Qufu 273165,China
Keywords: high pressure, first-principle calculation, germanium–strontium compounds, superconductivity,
1. Introduction
The electronic configuration is an essential quality that determines the material function, while the valence election distributions are influenced by the chemical composition and atomic organization. Compounds formed by the group IV elements with electropositive partners of the alkaline-, alkaline earth-, and rare earth metals exhibit a rich variety of binary systems with semiconductors or metals. In these compounds,tetrel atoms can form different motifs due to rather atypical interactions. Such a rich structural diversity naturally brings interesting physical phenomena and properties, which can be used in solar-cells,thermoelectricity,and optoelectronics.[1,2]For example,an excellentZTvalue=1.1 was achieved in the n-type Mg2(Si,Sn)system under ambient condition,and they can be seen as promising thermoelectric materials.[3]Both BaGe2and SrGe2show high optical absorption coefficients(7.5×104cm-1and 7.8×104cm-1athω=1.5 eV),indicating that they are ideal solar cell candidates.[4]
Pressure has become a useful tool to expand the variety of materials, and modify accessible structure patterns with excellent properties. In recent years, novel stoichiometries with superconductivity were studied in compounds constituted by metals and group IV elements associated with the wellknown effect of pressure. Some lanthanide metal germanides with new compositions(LaGe3,LaGe5,ScGe2,YGe2,YGe3,LuGe2, LuGe3) were synthesized under high-pressure and high-temperature conditions (HPHT). They all exhibit superconductivity with critical temperatureTc=1.3 K–7.4 K.[5–11]For alkali and alkaline earth metal germanides,they also show novel compositions and properties.For exapmle,a new BaGe3stoichiometric structure was reported by Castilloet al.,with aTc=6.5 K.[12]Mg–Ge was studied under pressure, in which novelCmcmMg2Ge andP4/mmmMgGe structures are superconductors withTcof 10.3 K and 9.07 K at 5 GPa.[13]Moreover,in these compounds(alkaline metal,alkaline earth metal and rare earth metal germanides), Ge atoms form different motifs, such as Ge2dumbbells, regular triangular Ge3cluster units, Ge4tetrahedron, Ge5square-pyramidal units, edgesharing Ge6rings,Ge6octahedrons,Ge–Ge zigzag chains,and Ge cages. These structural polymorphism features completely lead to different bonding arrangements, and could bring various properties.
Owing to a large electronegativity between Sr and Ge atoms, Sr–Ge system can also have structural diversity and rich properties. As is well known, some compositions (such as Sr2Ge, SrGe2-δ, SrGe2, SrGe3, SrGe6-δ) of Sr–Ge have been studied and synthesized under pressure and show excellent properties.[4,14–18]For instance,I4/mmmSrGe3phase was synthesized at 13 GPa and 1100°C.[14]It showed superconductivity withTc= 6.0 K. SrGe2-δwas obtained at 2 GPa and 900°C, which is a superconductor withTcabout 7.3 K.[15]Furthermore,PnmaSrGe2, a semiconductor with good optical property, was synthesized by the Ar arc-melting technique.[4]However, some problems remain to be further solved: (i) whether the new Sr–Ge compounds are stable at moderate conditions;(ii)the ground-state structures and properties of Sr–Ge system under high pressure; and (iii) the unit of germanium in the Sr–Ge compounds.
In this work, the Sr–Ge binary system under highpressure is systematically studied by using the evolutionary algorithm Universal Structure Predictor: Evolutionary Xtallography(USPEX),which has been successfully used in other systems.[19–23]Six stoichimetric structures (Sr3Ge, Sr2Ge,SrGe,SrGe2,SrGe3,and SrGe4)are predicted. In these compounds, Ge atoms present diverse motifs forming covalent boding. Metallic structures exhibit superconductivity withTcof 0.23 K–8.94 K.SemiconductorPnmaSr2Ge shows a high optical absorption coefficient (α(ω) = 1.05×105cm-1at 1.5 eV).The p-type Sr2Ge and the n-type SrGe2exhibit maximalZTvalues of about 0.82 and 1.55 along theydirection at 500 K,respectively.
2. Computational details
In the present work, we used the evolutionary method USPEX[24–26]to search for the thermodynamically stable candidates of Sr–Ge system under 0 GPa–200 GPa. Structural optimization and calculation of electronic properties were calculated by the Viennaab initiosimulation package(VASP)[27]based on the density functional theory(DFT)framework. The generalized gradient approximation of the Perdew–Burke–Ernzerhof (GGA-PBE)[28]was used to ascertain the exchange correlation functional. And projectoraugmented wave (PAW)[29]with 4s24p2and 4s24p65s2electrons was used as valence electrons for Ge and Sr atoms, respectively. A cutoff energy of 500 eV and ak-point grid spacing of 2π×0.03 ˚A-1were used to ensure a good convergence of enthalpy. Phonon calculations were conducted by exercising a supercell technique[30]through using the finite displacement method as accomplished in the PHONOPY code.[31]The integrated crystal orbital Hamilton populations (-ICOHPs)were calculated by LOBSTER package.[32]The electron localization function(ELF)[33]and Bader charge analysis[34–36]were used to analyze the chemical bonds and the electronic charge transfer. Molecular dynamics (MD) simulations were performed in the fixed particle number, volume, and temperature(NVT)ensemble by using the Nose–Hoover thermostat,lasting 9 ps in time steps of 1.5 fs.[37]Quantum ESPRESSO software was used to calculate the electron–phonon coupling(EPC) parameters and phonon dispersion curves.[38]The kinetic energy cutoff was chosen to be 90 Ry. TheTcwas estimated from Allen–Dynes-modified McMillan[39]formula The absorption coefficientα(ω) was obtained directly from the calculated complex dielectric functionε(ω) =ε1(ω)+iε2(ω)(whereε1is the real part andε2is the imaginary part ofε).[40]Based on a well-converged electronic structure within the dense Monkhorst–Packk-point spacing of 0.05 ˚A-1, the transport properties were calculated by BoltzTraP program.[41]

3. Results and discussion
3.1. Phase stability of Sr–Ge compounds under pressure
To find the stable stichiometric structures,we extensively search for each member of SrxGey(x=1–3,y=1;x=1,y=2–4) with 1–4 formula units at 0 K, and 0, 50, 100, 150,and 200 GPa. Then the formation enthalpy (ΔHf) of Sr–Ge system is provided at corresponding pressure. The ΔHfis calculated according to the following equation:

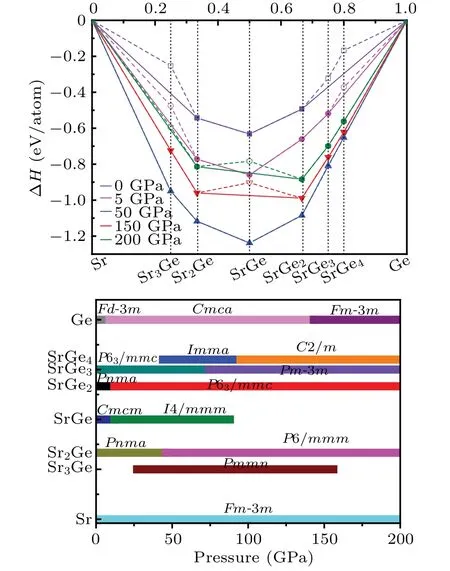
Fig.1. (a) Relative enthalpies of formation per atom with respect to elemental Ge and Sr for predicted Sr–Ge system at 0, 5, 50, 150, and 200 GPa,with stable compounds represented by solid symbols and connected by solid line(convex hull). (b)Pressure–composition phase diagram of stable Sr–Ge system. Fm-3m Sr and Fd-3m,Cmca,Fm-3m Ge are adopted as reference structures.
Because of the formation enthalpies,a convex hull can be created as shown in Fig.1(a). In general, the thermodynamically stable phases are located on the convex hull, which are anticipated to be synthesized experimentally. Whereas the unstable or metastable phases are above the convex hull(dotted line),and will decompose into the pure elements and/or compounds located on the hull. At 0 GPa,only Sr2Ge,SrGe,and SrGe2are located on the convex hull,which are stable against decomposition. And the already knownPnmaSr2Ge,CmcmSrGe, andPnmaSrGe2are reproduced, which manifests the accuracy of our results. As pressure increases up to 5 GPa,besides the above three stoichiometric structures that remain on the hull, SrGe3emerges on the convex hull. At 50 GPa,the whole compositions stay on the hull, indicating that they are thermodynamically stable. At 100 GPa and 150 GPa, except that SrGe decomposes into Sr2Ge and SrGe2,all the other compositions fall on the convex hull. At 200 GPa, there are four compositions (Sr2Ge, SrGe2, SrGe3, and SrGe4) sitting on the hull. The pressure–composition phase diagram of Sr–Ge system is given in Fig.1(b).
3.2. Structures and stabilities of Sr–Ge compounds
Besides the known candidate structures (Fig. S1) which are consistent with our predicted results,[4,14,42,43]some new structures were found as shown in Fig. 2. We see that in Sr3Ge and Sr2Ge(space groupPnma), germanium atoms exist in isolated atomic form, while in other phases Ge atoms present distinct units. For Sr3Ge, an orthorhombicPmmn(Fig.2(a))is predicted, which is stable in a pressure range of 27 GPa–156 GPa. The “isolated” Ge atoms occupy the crystallographic 2bsites, while Sr atoms hold 2aand 4fsites.Figure 2(b) gives the new high-pressure phase ofP6/mmmSr2Ge, it remains stable in 46 GPa–200 GPa, in which the Ge atoms form Ge–Ge.Ge linear chains with the shortest Ge–Ge distance of 2.8374 ˚A. For SrGe stoichiometeric structure,a new phase withI4/mmmsymmetry (Fig. 2(c)) is predicted,where Ge atoms exist in the Ge4square units. And it keeps stable from 12 GPa to 88 GPa. Turning to SrGe2,a high phaseP63/mmc(Fig. 2(d)) is found to be stable in a pressure range from 12 GPa to 200 GPa. It is composed of Sr atoms, Ge3trigonal units and the Ge5hexahedrons, with three types of Ge–Ge distances,namely 2.330,2.448,2.454 ˚A,respectively.TheP63/mmcandPm-3mphases of SrGe3are also given in Figs. 2(e) and 2(f), and they are stable in a pressure range of 3 GPa–74 GPa and 74 GPa–200 GPa, respectively. For the former,it contains Ge3equilateral triangles with a side length of 2.596 ˚A, and each layer of Ge triangles is twisted by 60°,which is similar to the scenarios of BaGe3and EuGe3.[44,45]For the latter, each Ge12cage contains an Sr atom, and the shortest distance between Ge and Ge is 2.630 ˚A. Turning to SrGe4,the predicted orthorhombicImma(Fig.2(g))consists of Ge8rings,Ge atoms and Sr atoms and keeps stable at pressures in a range of 45 GPa–95 GPa. Then it transforms into a monoclinic structure withC2/msymmetry (Fig. 2(h)), in which there are Ge3triangles,Ge6hexagons,Ge and Sr atoms.As seen in the new predicted Sr–Ge compounds,the Ge atoms’arrangement reveals multiple structure evolution behavior with the increase of germanium content, from isolated anions in Sr3Ge, chains in Sr2Ge, square units in SrGe, trigonal units and hexahedrons in SrGe2,cages in SrGe3,and hexagons and Ge8rings in SrGe4. These distinct structural features can result in exotic properties. The detailed structural parameters can be obtained in Table S1.

Fig.2. Crystal structures of Sr–Ge compounds. (a)Pmmn Sr3Ge,(b)P6/mmm Sr2Ge,(c)I4/mmm SrGe,(d)P63/mmc SrGe2,(e)P63/mmc SrGe3,(f)Pm-3mSrGe3,(g)Imma SrGe4,and(h)C2/mSrGe4 with large blue and small red balls representing Sr and Ge atoms,respectively.
In order to determine whether the structure satisfies the dynamic stability condition, the phonon spectra and partial phonon density of states(PHDOS)of these structures are calculated. As shown in Fig.S2,no imaginary phonon frequency exists in the whole Brillouin zone, indicating that the above structures are dynamic stable under stable pressure. In addition, on the basis of PHDOS analysis, the motions of Ge and Sr cover almost all frequency regions, which may be caused by the approximate atomic mass of them.
Moreover, the elastic constantsCijare essential for investigating the mechanical properties. The calculated elastic constantsCijof these Sr–Ge binary structures are listed in Table S3. These values satisfy the Born–Huang criterion,[46,47]indicating that they are all mechanically stable under pressure.
3.3. Electronic properties and chemical bonds of Sr–Ge compounds
In order to understand the electronic properties of Sr–Ge compounds, we calculate the electronic band structures and projected density of states (PDOS). From Fig. S3, we see thatPnmaSr2Ge andPnmaSrGe2are semiconductors,in which the band gaps are located almost in the center of Brillouin zone. While the other structures show metallic behaviors with their valence bands and conduction bands overlap. In the following,we mainly focus on the metallic phases ofP6/mmmSr2Ge(Ge-rich compound),P63/mmcSrGe3,andPm-3mSrGe3(Sr-rich compounds)because of their wide stable pressure ranges and different Ge motifs, as well as two semiconductors ofPnmaSr2Ge andPnmaSrGe2. The electron properties of the other predicted Sr–Ge compounds are given in the supplement materials.

Fig.3. Calculated projected density of states (PDOS) of (a) P6/mmm Sr2Ge, (b) P63/mmc SrGe3, and (c) Pm-3mSrGe3. The electron localization function(ELF)plotted on(d)(–1–1 0)plane of P6/mmm Sr2Ge,(e)(0 0-1)plane of P63/mmc SrGe3,and(f)(0 0-1)plane of Pm-3m SrGe3. (g)Free energy as MD time at temperature of 1000 K and structure snapshots taken after equilibration of P6/mmm Sr2Ge.
The calculated projected densities of states are shown in Fig. 3. ForP6/mmmSr2Ge andP63/mmcSrGe3,Pm-3mSrGe3, the states around the Fermi level are mainly composed of Sr-d and Ge-p orbitals with almost no Sr-s component, demonstrating that the 5s electrons of Sr are nearly transferred to the Ge unites. Then, the electron localization function (ELF) calculations are performed to study the bond nature. Generally, larger ELF values (>0.5) usually correspond to inner shell, lone pair electrons and covalent bonds,whereas the ionic and metallic bonds correspond to small ELF values(<0.5). The ELF calculations show that Ge–Ge bonds are covalent inP6/mmmSr2Ge andP63/mmcSrGe3,Pm-3mSrGe3(Figs. 3(d)–3(f)), while the Sr–Ge bonding is weakly ionic. The calculated projected crystal orbital Hamilton population(pCOHP)are shown in Fig.S6. We see that most of the states below the Fermi level correspond to Ge–Ge bonding,which sustains the existence of Ge–Ge covalent bonds within the Ge units.Bader charge analysis shows that charges transfer from Sr atoms to the Ge atoms as given in Table S2,supporting the above PDOS’s analyzing. In addition, first-principles molecular dynamics(MD)simulations are performed to verify their thermal stability at 600 K and 1000 K by using the NVT ensemble and Nose–Hoover thermostat. The MD time step is 1.5 fs,and we monitor the time evolution of free energy during the MD simulations as shown in Figs. 3(g) and S7. The free energy values reach equilibrium speedily and fluctuate near the equilibrium value with no structural reconstructions,which indicates that theP6/mmmSr2Ge andP63/mmcSrGe3,Pm-3mSrGe3remain stable at these temperatures.
3.4. Superconductivity of Sr–Ge compounds
To explore the possibility of phonon-mediated superconductivity in the predicted phases ofP6/mmmSr2Ge,P63/mmcSrGe3, andPm-3mSrGe3, we calculate the electron–phonon coupling (EPC) parameter (λ), the logarithmic mean phonon frequency (ωlog), the electron density of states at the Fermi level (N(Ef)), and the superconducting critical temperature(Tc). Figure 4(a)gives the calculated values ofλ,ωlog,N(Ef),andTcas a function of pressure forP6/mmmSr2Ge,to investigate the effect of pressure on superconductivity. The result shows that the calculatedTcvalue increases and then decreases with pressure increasing. As seen,the tendency ofλis similar toTcupon compression. Therefore,we think that the variation of theTcvalues with pressure may mainly be due to theλ. As is well known,the“softness”of phonon dispersion can result in strengthening EPC(λ). Then the phonon dispersion curves at different pressures are calculated, and the results are given in Figs.4b–4(e). It is found that theλis mainly form the contribution of low-frequency phonon modes,which is dominated by Sr atoms. In addition, we see that“softness”behavior occurs in low-frequency vibrations alongK →Hdirection from 50 GPa to 150 GPa,and then vanishes at 200 GPa,which leads to the increase/decrease inλwith pressure increasing.

Fig.4. (a)Calculated values of λ, ωlog, N(Ef), and Tc as a function of pressure for P6/mmm Sr2Ge. P6/mmm Sr2Ge phonon dispersion curves at(b)50 GPa,(c)100 GPa,(d)150 GPa,and(e)200 GPa. Red circle on phonon dispersion curve represents the discrete electron–phonon coupling,electro–acoustic coupling parameters,and the size of red circle is proportional to the strength of electron–phonon coupling electro–acoustic coupling.
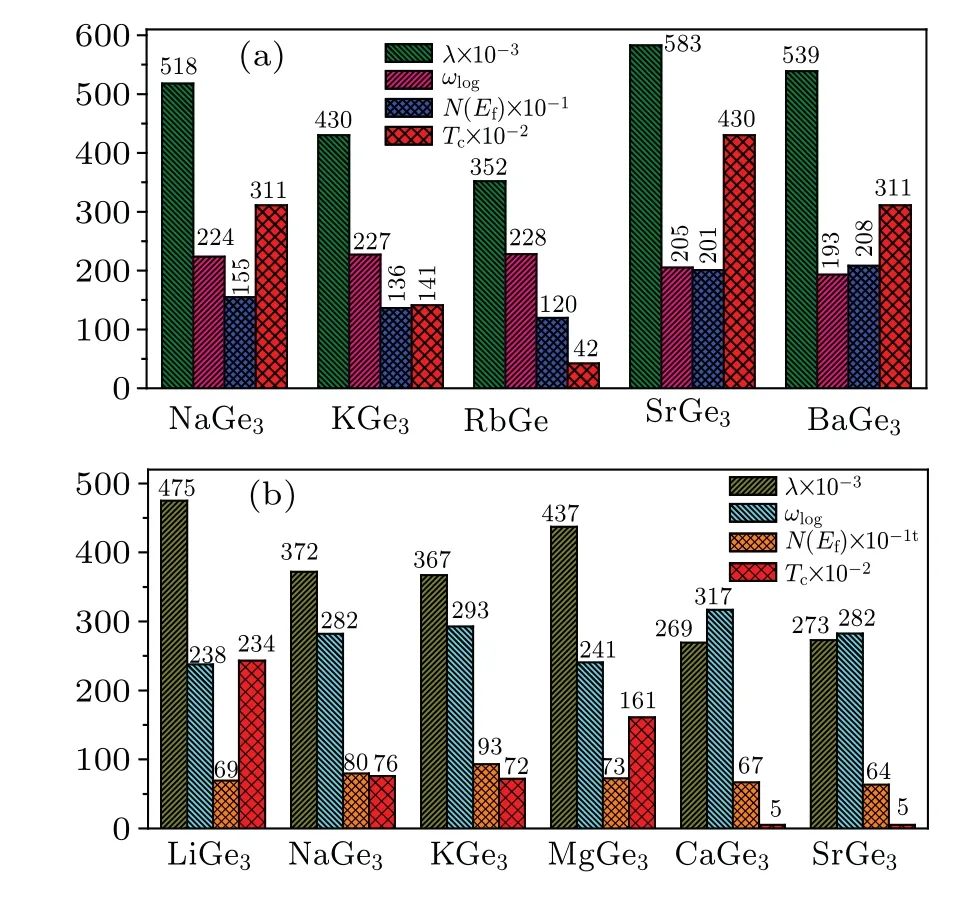
Fig.5. Electron–phonon coupling parameters(λ),logarithmic average phonon frequency(ωlog),electronic density of states at the Fermi level(N(Ef))(states/spin/Ry/unit cell),and superconducting critical temperatures (Tc) for (a) P63/mmc XGe3 (X =Na, K, Rb, Sr, Ba) at 50 GPa and(b)Pm-3m MGe3 (M=Li,Na,K,Mg,Ca,Sr)at 100 GPa.
Based on the fact thatP63/mmcSrGe3appears in other systems(BaGe3and EuGe3), as well as the cages forming inPm-3mSrGe3, we then construct some hypothetical models ofP63/mmc XGe3andPm-3m XGe3,whereXdenotes alkali metal elements and alkaline earth elements. The calculated phonon dispersion curves show thatP63/mmc XGe3(X=Na,K,Rb,Ba)andPm-3m MGe3(M=Li,Na,K,Mg,Ca)remain stable at different pressures (Fig. S8). Moreover, they all exhibit metallic feature(Fig.S9). To investigate their superconductivities, and the values ofλ,ωlog,N(Ef), andTcat different pressures are shown in Fig.5. It can be seen thatP63/mmcSrGe3andPm-3mNaGe3have highest values ofTcof 4.3 K and 2.3 K in theP63/mmc XGe3hypothetical model andPm-3m MGe3hypothetical model,respectively.Moreover,we find that for bothP63/mmc XGe3phase andPm-3m MGe3phase,theTcvalues are mainly influenced by the value ofλ. In other words,the bigger the value ofλ,the higher the temperatureTcis. For other predicted phases of Sr–Ge system, theλ,ωlog,N(Ef),andTcvalues are listed in Table S3.
3.5. Potential optical and thermoelectric application of Pnma Sr2 Ge and Pnma SrGe2
On the basis of the above discussion, we calculate the optical and thermoelectric properties ofPnmaSr2Ge andPnmaSrGe2. The fundamental band gap isEg=0.78 eV for Sr2Ge (Fig. S10) andEg=0.89 eV for SrGe2.[4]Extensive researches have been carried out in the past decades on metal germanides to investigate their optical properties,[4,48]such as SrGe2,BaGe2,Ca2Ge. We calculate the absorption coefficient of Sr2Ge with the help of HSE06 functional. It does not show any sizable anisotropy like some other metal germanides. As shown in Fig. S11, the average polarization-independent absorption ofPnmaSr2Ge isα(ω)=1.05×105cm-1at 1.5 eV.The large absorption coefficient reveals its better optical properties,indicating that thePnmaSr2Ge has a potential application prospect in solar-cells.
Here, we illustrate the calculated band structures and electrical transport coefficients for thePnmaSr2Ge andPnmaSrGe2in Figs. 6 and S12–S14. Interestingly, the SrGe2exhibits a multi-valley conduction band structure near Fermi level, realizes high-valley degeneracy with small energy difference and possess more states for electrons to occupy and contribute to transport, which is of great help in improving thermoelectric performance. Furthermore,we can notice from the calculated partial DOS in Fig. 6 that the coupling between d state of Sr atom and p state of Ge atom in SrGe2is stronger than in Sr2Ge. Therefore, the SrGe2has a much steeper DOS for the bottom of the conduction band(CB)than pristine SrGe2,indicating a higher room-temperature Seebeck coefficient in SrGe2system.

Fig.6. PBE functional calculated band structures and density of states for(a)Pnma Sr2Ge and(b)Pnma SrGe2. (c)and(d)PBE functional calculated Seebeck coefficient and electrical conductivity varying with carrier concentration in the y direction at 300 K for Pnma Sr2Ge and Pnma SrGe2,respectively.
From the electronic structures discussed above,it can be seen from Fig. 6(c) that SrGe2exhibits the highest Seebeck coefficient along theydirection within electron doping, derived from the flat conduction band dispersions and sharp DOS near CBM as shown in Fig. 6(b). A high Seebeck coefficient can reach up to-230 μV/K with the electron doping of 1.03×1020cm-3at 300 K,roughly 4.65 times larger than the counterpart that Sr2Ge has. Forxdirection andzdirection,the Seebeck coefficient of n-type SrGe2is also much larger than that of Sr2Ge,as shown in Figs.S12(a)and S12(b). Moreover,we note that the SrGe2has great electrical conductivity,which is mainly attributed to their favorable electronic band structures,like multi-valley conduction band structures. Combined with the Seebeck coefficients discussed above,our current results indicate that the n-type SrGe2can have better thermoelectric performance than the Sr2Ge, particularly along theydirection.
Based on the electrical transport coefficients discussed above, the thermoelectric performance can be quantitatively estimated from

whereL0(=2.45×10⁻⁸WΩ/K2)is the Lorenz number. The lattice thermal conductivity with respect to scattering timeκL/τ=1014W·m-1·K-1·s-1is used. For the comprehensive analysis,the calculatedZTvalues forPnmaSr2Ge andPnmaSrGe2are shown in Table 1. We note that the n-type SrGe2has the uppermostZTvalue of 0.76 along theydirection at 300 K, distinctly larger than the highest value of 0.17 in ntype Sr2Ge. When temperature increases to 500 K, a higherZTvalue(1.55)can be obtained in n-type SrGe2,roughly 3.37 times larger than the counterpart of Sr2Ge.

Table 1. Optimized ZT values of Pnma Sr2Ge and Pnma SrGe2 at 300 K and 500 K along x,y,and z directions.
4. Conclusions
In summary, we have reported the phase diagram, crystal structure and physical properties in Sr–Ge system at pressures ranging from 0 GPa to 200 GPa. We predict six stable compounds (Sr3Ge, Sr2Ge, SrGe, SrGe2, SrGe3, SrGe4)by first-principles calculations. Our results reveal that multiple Ge units in diverse structures(Ge2,Ge3,Ge4,Ge–Ge...Ge chains,Ge cage,etc.) can be formed by covalent bonds under high pressure conditions. Among them,most of Sr–Ge phases exhibit superconducting behaviors (Tc=0.23 K–8.94 K). A semiconducting structure ofPnmaSr2Ge shows a high optical absorption coefficientα(ω)=1.05×105cm-1at 1.5 eV.Most importantly, the p-type Sr2Ge and the n-type SrGe2exhibit maximalZTvalues of 0.82 and 1.55,respectively,along theydirection at 500 K,implying potential candidates serving as high-performance thermoelectrics.
Acknowledgements
Theoretical calculations were performed in the High Performance Computing Center(HPCC)of Qufu Normal University.
Project supported by the National Natural Science Foundation of China(Grant Nos.52102335,11704220,11804184,11974208, and 11804185) and the Shandong Provincial Natural Science Foundation, China(Grant Nos.ZR2021MA050,ZR2017BA020, ZR2018PA010, ZR2019MA054, and ZR2017BA012).
猜你喜欢
电影文学(2022年16期)2022-09-26 03:38:52
中国民间疗法(2021年2期)2021-05-22 01:58:16
法律史评论(2020年1期)2020-09-11 06:25:02
青苹果·教育研究版(2016年9期)2016-12-23 11:52:36
娃娃乐园·综合智能(2016年23期)2016-11-28 10:58:42
作文评点报·低幼版(2016年31期)2016-05-30 10:48:04
长江丛刊(2015年8期)2015-12-02 02:31:04
Transactions of Nanjing University of Aeronautics and Astronautics(2015年6期)2015-03-21 05:09:17
海南热带海洋学院学报(2014年1期)2014-08-08 13:00:01
Transactions of Nanjing University of Aeronautics and Astronautics(2013年2期)2013-12-02 01:39:40
- Chinese Physics B的其它文章
- LAMOST medium-resolution spectroscopic survey of binarity and exotic star(LAMOST-MRS-B):Observation strategy and target selection
- Vertex centrality of complex networks based on joint nonnegative matrix factorization and graph embedding
- A novel lattice model integrating the cooperative deviation of density and optimal flux under V2X environment
- Effect of a static pedestrian as an exit obstacle on evacuation
- Chiral lateral optical force near plasmonic ring induced by Laguerre–Gaussian beam
- Adsorption dynamics of double-stranded DNA on a graphene oxide surface with both large unoxidized and oxidized regions