Transcriptional regulatory network during axonal regeneration of dorsal root ganglion neurons: laser-capture microdissection and deep sequencing
Li-Li Zhao , Tao Zhang, , Wei-Xiao Huang, , Ting-Ting Guo, Xiao-Song Gu ,
Abstract The key regulators and regeneration-associated genes involved in axonal regeneration of neurons after injury have not been clarified. In high-throughput sequencing, various factors influence the final sequencing results, including the number and size of cells, the depth of sequencing, and the method of cell separation. There is still a lack of research on the detailed molecular expression profile during the regeneration of dorsal root ganglion neuron axon. In this study, we performed laser-capture microdissection coupled with RNA sequencing on dorsal root ganglion neurons at 0, 3, 6, and 12 hours and 1, 3, and 7 days after sciatic nerve crush in rats. We identified three stages after dorsal root ganglion injury: early (3–12 hours), pre-regeneration (1 day), and regeneration (3–7 days). Gene expression patterns and related function enrichment results showed that one module of genes was highly related to axonal regeneration. We verified the up-regulation of activating transcription factor 3 (Atf3), Kruppel like factor 6 (Klf6), AT-rich interaction domain 5A (Arid5a), CAMP responsive element modulator (Crem), and FOS like 1, AP-1 transcription factor Subunit (Fosl1) in dorsal root ganglion neurons after injury. Suppressing these transcription factors (Crem, Arid5a, Fosl1 and Klf6) reduced axonal regrowth in vitro. As the hub transcription factor, Atf3 showed higher expression and activity at the preregeneration and regeneration stages. G protein-coupled estrogen receptor 1 (Gper1), interleukin 12a (Il12a), estrogen receptor 1 (ESR1), and interleukin 6 (IL6) may be upstream factors that trigger the activation of Atf3 during the repair of axon injury in the early stage. Our study presents the detailed molecular expression profile during axonal regeneration of dorsal root ganglion neurons after peripheral nerve injury. These findings may provide reference for the clinical screening of molecular targets for the treatment of peripheral nerve injury.
Key Words: Arid5a; Atf3; Crem; dorsal root ganglion; Fosl1; Klf6; laser-capture microdissection; neuron; smart-seq2; gene expression profile; transcription factor 1Model Animal Research Center and MOE Key Laboratory of Animal Models of Disease, Nanjing University, Nanjing, Jiangsu Province, China; 2Key Laboratory of Neuroregeneration of Jiangsu and Ministry of Education, Co-innovation Center of Neuroregeneration, Nantong University, Nantong, Jiangsu Province, China; 3School of Medicine and Life Sciences, Nanjing University of Chinese Medicine, Nanjing, Jiangsu Province, China
Introduction
Re-innervation has been widely used to treat nerve injury in clinical practice. However, impaired or deficient functional recovery and neuropathic pain after surgery are frequently reported (Saposnik et al., 2011; Tuturov, 2019). Provoking axonal regeneration and functional reconstruction of neurons is the ideal therapeutic strategy for nerve injury. In contrast to the very limited regenerative capability of neurons in the central nervous system (CNS), axonal regrowth and functional recovery occur after injury in the peripheral nervous system (PNS) (Curcio and Bradke, 2018). Studies on axonal regeneration in the PNS revealed that peripheral axotomy initiates a program of changes in gene expression, with the up-regulation of a series of genes termed regenerationassociated genes (RAGs), while cutting CNS axons led to a slight up-regulation or no changes of RAGs in neurons (He and Jin, 2016; Mahar and Cavalli, 2018). To uncover the mechanism of axonal regeneration, RNA sequencing studies of dorsal root ganglion (DRG) neurons after injury have been carried out, including bulk sequencing and single-cell RNA sequencing (scRNA-seq) studies (Li et al., 2015; Renthal et al., 2020; Wang et al., 2021b). scRNAseq, a method used to explore molecular features on the single-cell level, exhibits advantages in exploring cell heterogeneity (Zheng et al., 2017). Different neuron types or subtypes in DRG have been identified, including neurofilament-containing neurons, non-peptidergic nociceptors, peptidergic nociceptors, and c-low-threshold mechanoreceptors (Usoskin et al., 2015; Renthal et al., 2020). However, the number and size of input cells in highthroughput scRNA-seq technology are limited, and few genes are detected with this approach compared with deep sequencing. Additionally, enzyme treatment for cell isolation, which is frequently used for cell isolation in scRNA-seq, induces injury-like and immediate early gene responses (van den Brink et al., 2017). Therefore, depth sequencing with no enzyme treatment of DRG neurons after injury will provide more comprehensive molecular profiling of axonal regeneration.
Laser-capture microdissection coupled with RNA sequencing (LCM-seq), a method coupling laser-capture microdissection and Smart-seq2, allows the exploration of molecular features of specific cell populations (Nichterwitz et al., 2016, 2018). The target sample can be dissociated directly from tissue; enzyme treatment is not required and this approach can obtain positional information on cells. This method has no limits on cell sizes or numbers; one cell to hundreds of cells are acceptable. In addition, Smart-seq2 can detect up to 20,000 genes per sample, a higher amount than that detected by highthroughput sequencing (Wang et al., 2021c).
Here, we applied LCM-seq on DRG neurons following sciatic nerve crush (SNC) at different time points to investigate gene expression during axonal regeneration.
Methods
Animals
A total of 88 Sprague-Dawley rats (specific-pathogen-free level, both sexes, approximately 12 weeks of age, 250–300 g) were obtained from Nantong University Experimental Animal Center (animal license Nos. SCXK [Su] 2014-0001 and SYXK (Su) 2012-0031). Among the total animal group, 42 rats were used for LCM-seq, 28 rats were used for immunostaining, and 18 rats were used forin vitroexperiments.
Rats were anesthetized and underwent SNC as previously described (Zhao and Yi, 2019). After anesthetization by an intraperitoneal injection of complex narcotics (85 mg/kg trichloroacetaldehyde monohydrate [Sigma-Aldrich, St. Louis, MO, USA], 42 mg/kg magnesium sulfate [Sigma-Aldrich], 17 mg/kg sodium pentobarbital [Sigma-Aldrich]), the hind limbs of rats were cut to expose the sciatic nerve. SNC was performed at approximately 1 cm proximal to its division to tibial and common peroneal nerves with forceps for 30 seconds. The muscles and skin were sewn. SNC was performed at both left and right hind limbs. Rats in the control group did not undergo surgery. After surgery, rats were housed three per cage in a temperature (22 ± 0.5°C)- and humidity (50–65%)-controlled environment with a 12-hour light/dark cycle. Food and water were availablead libitum. The 42 rats were randomly divided into seven groups (designated as 0, 3, 6, 12 hours, and 1, 3, and 7 days;n= 6 rats in each group). After surgery, rats underwent anesthesia and decapitation at 3, 6, 12 hours, and 1, 3, and 7 days respectively.
Animal procedures were approved by the Animal Ethics Committee of Nantong University, China (approval No. 20190226-001) on February 26, 2019. The experiments were performed in accordance with the National Institutes of Health guidelines for the Care and Use of Laboratory Animals (8thed; National Research Council, 2011).
Cell separation by LCM
L4–L5 DRGs from rats at 0 hours (no surgery) and injured rats were dissociated on dry ice and immediately covered with optimal cutting temperature compound (Tissue-Tek® O.C.T. Compound, Sakura®, Finetek, Torrance, CA, USA). Slices of DRG tissues (14 µm thick) were stained with Alexa Fluor 488-anti-NeuN (Cat# ab190195; Abcam, Cambridge, UK) for 10 minutes and washed with phosphate-buffered saline twice and diethylpyrocarbonate water once (3 seconds each time) at 4°C. After 10 minutes of drying, LCM was performed using a LCM system (Lecia, Wetzlar, Germany) following the manufacturer’s instructions. Briefly, 3 µL of the lysis solution (Vazyme Biotech Co., Ltd., Nanjing, China) was added to the lid of the centrifuge tube, which was placed under the microscope. Candidate neurons were selected with detectable nuclei (strong green) and boundaries (laurel-green) under a microscope. We used the model of Draw + Cut to draw a circle around the target cell and start cutting. The laser parameters were as follows: power = 40, aperture = 15, speed = 10, specimen balance = 15, and light intensity = 75. After confirming by microscopy that the sample fell into the collection tube (Figure 1A), the tube was removed, centrifuged, and stored at –80°C until RNA extraction.
RNA sequencing and data cleaning
RNA extraction and library construction were carried out using the Discoversc WTA Kit V2 and TruePrepTM DNA Library Prep Kit V2 (Vazyme Biotech Co., Ltd.), respectively, following the manufacturer’s protocols. Briefly, deoxyribonucleoside triphosphate and oligo-dT primers were added to the cell lysate and complementary DNA was pre-amplified using a template switch fashion. Tn5 transposase and adapters were added for the synthesis of the first strand, and library amplification was subsequently performed using N5/N7 and P5/P7 primers. Library quality was assessed on an Agilent 2100 Bioanalyzer (Agilent Technologies, Palo Alto, CA, USA) and sequenced using the Illumina HiSeq X-10 kit (Illumina, Inc., Chicago, IL, USA) by Gene Denovo Biotechnology Co., Ltd. (Guangzhou, China). To achieve high quality clean data, multiple steps were implemented to screen the raw data, including filtering of reads by FASTP (ver. 0.18.0) (Chen et al., 2018), removing ribosomal RNA via Bowtie2 (ver. 2.2.8) (Langmead and Salzberg, 2012), and reference genomic mapping using HISAT2 (Pertea et al., 2016). For each transcription region, a fragment per kilobase of exon model per million mapped fragment value was calculated to quantify expression abundance and variation using the RSEM software.
Cell clustering
Cell clustering was carried out using the t-distributed stochastic neighbor embedding method with the top 30 principal components (Van de Sande et al., 2020). Principal component analysis was performed on the expression matrix to capture the eigenvectors using R programming language. Pseudo-time analysis was performed by Monocle (version 2.6.4) using a matrix of cells and gene expressions (Qiu et al., 2017). Monocle reduced the space down to one with two dimensions and ordered the cells (sigma = 0.001, lambda = NULL, param.gamma = 10, tol = 0.001). Once the cells were ordered, we visualized the trajectory, which has a tree-like structure.
Differential expression analysis
Differentially expressed genes (DEGs) were analyzed by theZ-test (Young and Bhandary, 1998). Genes with a fold-change > 2.0 andP-value < 0.05 were considered as DEGs.
Weighted gene co-expression network analysis (WGCNA)
After filtering genes with low abundance (in more than 95% of samples), low expression (mean fragments per kilobase of exon model per million mapped fragment < 0.5), and low coefficient of variation, the remaining 9857 genes were imported into WGCNA to construct co-expression modules using R programming language (Langfelder and Horvath, 2008). The correlation matrix was raised to power β = 3, and matrix 1-topological overlap measure (TOM) was used as the input of the average hierarchical cluster. Module eigengene (ME) represents the first principal component in each module. Module membership (kME) of each gene was calculated by correlating the gene expression profile with ME. The gene with the highest value of ME was defined as the hub gene within a given module. Time was chosen as the interesting trait, and the correlation between module and trait was performed with Pearson correlation coefficient through R package.
Gene Ontology (GO) enrichment analysis of the genes in each module was carried out using the GO database (http://www.geneontology.org/). Terms were accepted if they hit more than one gene with the threshold ofP-value < 0.05. Genes connecting networks were visualized using the Cytoscape_3.3.0 software (Shannon et al., 2003).
Construction of the regulatory network
Ingenuity pathway analysis online software (http://ingenuity.com/index.html, Ingenuity Systems, Redwood City, CA, USA) was used to construct a regulatory network of neuronal development and transcription factors (TFs). The nodes and edges (line) in the network represent genes and the relationship between the vertices, respectively, containing multiple information (a red node means logFC ≥ 1, a green node indicates logFC ≤ –1, a solid line means a direct relationship, and a dotted line represents an indirect relationship). All relationships were supported by at least one reference stored in the Ingenuity® Knowledge Base (https://digitalinsights.qiagen.com/productsoverview/qiagen-knowledge-base/).
TFs and regulon analysis
Regulon analysis was performed with the SCENIC R package (Aibar et al., 2017). First, genes, including TF genes, were identified via GENIE3. Second, networks were retained if the TF-binding motif was enriched among its targets, while target genes without direct TF-binding motifs were removed. The remaining networks were defined as regulons. The activity of each regulon, reflecting the area under curve value, was calculated using the AUCell package in R programming language. The similarity between regulons was identified using the connection specificity index (Fuxman Bass et al., 2013). Different regulon modules were constructed from hierarchical clustering with Euclidean distance (Suo et al., 2018).
Immunofluorescence staining
L4–L5 DRGs were dissected, and post-fixed with 4% paraformaldehyde for 12 hours at 4°C. Samples were sliced at thickness of 14 µm. After washing with phosphate-buffered saline and blocking with Immunofluorescence Blocking Buffer (Beyotime, Shanghai, China) for 1 hour at approximately 22°C, the slices were incubated with the following primary antibodies overnight at 4°C: mouse anti-ATF3 (1:100; Abcam, Cat# ab58668, RRID: AB_879578), rabbit anti-CREM (1:500; Thermo Fisher Scientific, Waltham, MA, USA, Cat# PA5-102817, RRID: AB_2852207), rabbit anti-FOSL1 (1:1000; Sigma-Aldrich, Cat# AV31377, RRID: AB_1849010), mouse anti-KLF6 (1:200; Santa Cruz Biotechnology, San Diego, CA, USA, Cat# sc-365633, RRID: AB_10841903), rabbit anti-ARID5A (1:200; Sigma-Aldrich, Cat# SAB2100148, RRID: AB_10598838), rabbit anti-NeuN (1:200; Abcam, Cat# ab177487, RRID: AB_2532109), mouse anti-NeuN (1:200; Millipore, Darmstadt, Hessian, Germany, Cat# MAB377, RRID: AB_2298772). After washing in phosphate-buffered saline three times for 10 minutes each, sections were incubated with the following secondary antibodies for 2 hours at 22°C: donkey anti-mouse Alexa Fluor-488 (1:500; Proteintech, Rosemont, IL, USA, Cat# SA00013-5, RRID: AB_2890971), goat anti-rabbit Cy3 (1:500; Proteintech, Cat# SA00009-2, RRID: AB_2890957), donkey anti-rabbit Alexa Fluor-488 (1:500; Thermo Fisher Scientific, Cat# A-21206, RRID: AB_2535792), and goat anti-mouse Cy3 (1:500, Proteintech, Cat# SA00009-1, RRID: AB_2814746). Samples were then washed three for 10 minutes each with phosphate-buffered saline, followed by nucleus staining with Hoechst 33342 (1:2000; Cat# H432; Dojindo, Kumamoto, Japan). Antifade mounting medium (Beyotime) was then used to adhere the cover slips to the microscope slides. The samples were visualized under a TCS SP2 confocal microscope (Leica), and a 20× widefield objective and 60× oil immersion objective were used for image capture. Images were then thresholded, and puncta were quantified using ImageJ (version 1.4.3.67, National Institutes of Health, Bethesda, MD, USA; Schneider et al., 2012).
DRG neuron culture
L4–L5 DRG neuron culture was carried out as previously described (Zhao et al., 2021). Briefly, DRGs were dissociated from the thoracic and lumbar segments of adult Sprague-Dawley rats (n= 18) and transferred to Dulbecco’s modified Eagle’s medium (Corning, Corning, NY, USA). After isolation from the spinal cord, DRGs were digested with 0.1% collagenase type I (Sigma) for 90 minutes and 0.25% trypsin (Thermo Fisher Scientific) for an additional 15 minutes at 37°C. The single-cell suspension was spun for 5 minutes at 900 r/min in 15% bovine serum albumin after triturating three times. The supernatant was removed, and the cells were resuspended and plated in Neurobasal-A medium (Thermo Fisher Scientific) enriched with B27 supplement (2%, Thermo Fisher Scientific), L-Glutamine (1%, Thermo Fisher Scientific), and penicillin-streptomycin (1%, Beyotime). The plates were precoated with poly-L-lysine (Sigma).
DRG neurons were transfected with small interfering RNAs (siRNAs; Ribobio, Guangzhou, China) using Lipofectamine RNAiMAX reverse transfection reagent (Invitrogen) for 12 hours. The sequences of siRNAs are listed in Table 1.

Table 1 |The sequence of siRNAs
Real-time polymerase chain reaction
Total RNA was extracted from cultured DRG neurons 48 hours posttransfection with TRIzol reagent (Invitrogen). Complementary DNA was synthesized using the HiScript III RT SuperMix for qPCR (Vazyme, Nanjing, China) and ChamQ SYBR qPCR Master Mix (Vazyme) was used for real-time polymerase chain reaction (qPCR) on an ABI Step-one system (Applied Biosystems, Foster City, CA, USA). Gene expression was calculated using the comparative 2–ΔΔCtmethod (Livak and Schmittgen, 2001) and normalized to glyceraldehyde-3-phosphate dehydrogenase (Gapdh) expression. The sequences of primers used in this study are listed in Table 2.
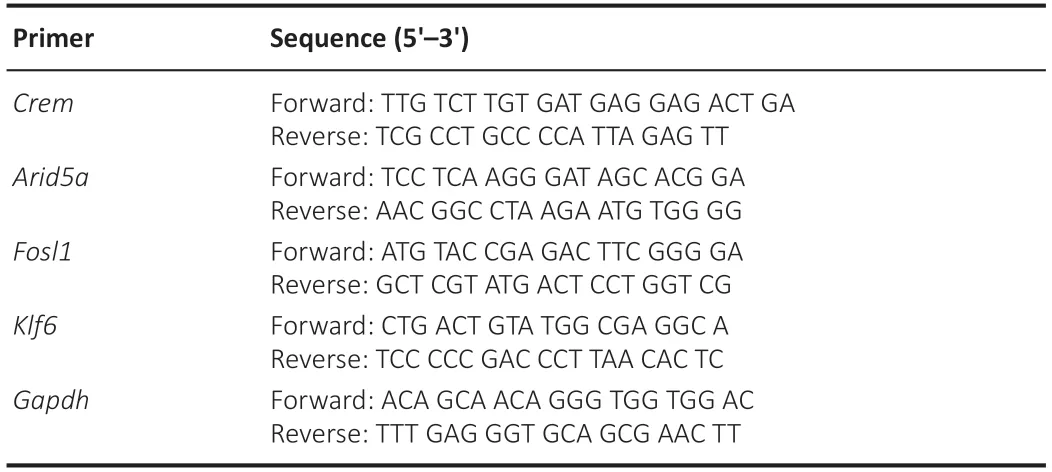
Table 2 |The sequences of primer for real-time polymerase chain reaction
Neurite outgrowth assay
Neurons were transfected with siRNA for 12 hours, and the medium was changed to remove the residual siRNA. After another 60 hours of culture, the neurons were then resuspended in 0.05% trypsin-ethylene diamine tetraacetic acid (Gibco, Grand Island, NY, USA) for 1 minute at 37°C and replanted to the dish. At 16 hours post-replant, cells were fixed with 4% paraformaldehyde for 0.5 hours at 22°C. After washing with phosphate-buffered saline and blocking with Immunofluorescence Blocking Buffer (Beyotime) for 1 hour at approximately 22°C, the cells were subjected to the primary antibodies of mouse anti-Tuj1 (1:500, R & D Systems, Emeryville, CA, USA, Cat# MAB1195, RRID: AB_357520) overnight at 4°C. After washing with phosphate-buffered saline three times for 10 minutes, cells were incubated with donkey antimouse Alexa Fluor-488 (1:500; Proteintech, Rosemont, IL, USA, Cat# SA00013-5, RRID: AB_2890971) for 2 hours at 22°C. After incubation, the cells were washed three times for 10 minutes with phosphate-buffered saline, followed by nucleus staining with Hoechst 33342 (1:2000; Cat# H432; Dojindo). Images were acquired by microscopy (Zeiss, Axio Imager M2m, Carl Zeiss, Oberkochen, Germany). We quantified the total length of newborn neurites (longer than its soma diameter) of each neuron using Neuron J software in ImageJ.
Statistical analysis
No statistical methods were used to predetermine sample sizes; however, our sample sizes were similar to those reported in previous publications (Björklund et al., 2016; Wang et al., 2021a). No animals or data points were excluded from the analysis. For LCM-seq, six rats were required in each group to obtain enough samples. Three independent repetitions were performed for immunofluorescence staining. Data are presented as means ± standard error of the mean (SEM). Statistics were performed using one-way analysis of variance followed by Dunnettpost hoctest by GraphPad Prism software (version 8.0.2; GraphPad Software, San Diego, CA, USA, www.graphpad.com).P< 0.05 was considered as statistically significant.
Results
LCM-seq of DRG neurons after SNC
To explore the mechanism underlying axonal regeneration in the PNS, we performed LCM-seq to investigate gene expression of DRG neurons after SNC in rats (Garrido-Gil et al., 2017). The study workflow is shown in Figure 1B. Positive labeling of neurons and successful collection of samples was confirmed (Figure 1A).
We obtained 102 cells (approximately 20 cells per rat) at 0, 3, 6, and 12 hours and 1, 3, and 7 days after SNC, accounting for a total of 714 cells. The average number of mapped reads was 61 million (ranging from 36 to 143 million) (Figure 1C), the total number of detected genes was 22,045, and the number of detected genes in each neuron was 12,219 (ranging from 6839 to 17,200) (Figure 1D).
To ensure cell purity, we filtered 87 cells with low quality or glial characteristics. We compared the values of fragments per kilobase of transcript per million mapped reads for neuronal markers (Tubb3,Rbfox3,Snap25, andSyp) and glial markers (Mbp,Mpz,Sox10,Gfap,Glul, andFabp7) between the filtered cells (n= 87) and the remaining cells used for analysis (n= 627) (Figure 1E). The slight changes in neuronal markers before or after filtering indicated a similar neuronal feature of each sample, and the expression levels of Schwann cell markers significantly decreased in filtered cells (Mbp:P= 0.00346,Mpz:P= 0.00011,Sox10:P= 0.00017; Figure 1E). While the expression level of satellite cell markers slightly changed, they were lower than those of neuronal markers (Additional Table 1). After filtration, samples from each time point displayed similar neuronal features (Additional Figure 1A–D). These results indicated the success of LCM-seq and confirmed the high quality of the data.
Axonal regeneration is divided into three stages
In our previous study (Li et al., 2015), bulk sequencing of DRGs defined three phases after sciatic nerve transection: the stress-response phase (0–6 hours), pre-regeneration phase (9 hours to 1 day), and regeneration phase (4–14 days). In the present study, dimensionality reduction (t-distributed stochastic neighbor embedding), displaying distance among the cells in different groups, showed three clusters of cells. The top cluster contains half of the cells from 3 and 7 days and the middle cluster mainly included cells from 1 day. The remaining cells in the bottom cluster showed an inconspicuous distribution, which was similar to those cells in the control group (Figure 2A).
Pseudo-time analysis can construct a trajectory of cells during the process of development or disease (Qiu et al., 2017); the branches represent different states of cells, and the trajectory displays the transition between the states. We obtained 11 states in total; there were a limited number of cells in the states 9–11 in the normal group, but cells increased after injury, especially from 12 hours to 7 days (Figure 2B and Additional Figure 1E and F). States 10 and 11 contained approximately half of the cells from 3 and 7 days and displayed regeneration features with high expression levels of Atf3 and Gap43. Cells in state 9 began to increase from 3 hours and mainly came from cells at 3, 6, and 12 hours in the early stage. The genes in state 9 showed opposite expression to those of states 10 and 11, indicating differences of neurons between early and regeneration states (Figure 2B and Additional Figure 1G).
Notably, the number of cells of states 6 and 7 showed a peak at 1 day and decreased to control levels at 7 days (Figure 2B and Additional Figure 1F). This fluctuation of cells consisted exactly of the middle cluster from t-distributed stochastic neighbor embedding. The specific feature of cells from the 1 day group may reflect a transition state between early and regeneration states. Additionally, approximately half of the neurons from 3 and 7 days were unaltered, although they displayed different characteristics. This phenomenon was consistent with previous reports, which may be explained by incomplete injury to all L4–L5 DRG neurons caused by SNC and the heterogeneity between DRGs and neurons (Hu et al., 2016; Renthal et al., 2020).
The changes in the number of DEGs were minimal within 6 hours, gradually increased at 12 hours, and reached the peak at 3 days (Figure 2C). We speculate there may be an elevated level of transcription approximately 1 day after SNC. Previous studies showed that the number of TFs was elevated from 12 hours and the transcriptional alteration in neuronal cell bodies was induced within 24 hours by injury-induced retrograde signaling (Mahar and Cavalli, 2018; Renthal et al., 2020; Lee and Cho, 2021). Moreover, principal component analysis and hierarchical clustering of each group on the basis of genes in the top three principal components revealed apparent differences among early (3–12 hours), pre-regeneration (1 day), and regeneration (3–7 days) stages after SNC (Figure 2D and Additional Figure 1H).

Figure 1|LCM-seq of DRG neurons after injury.
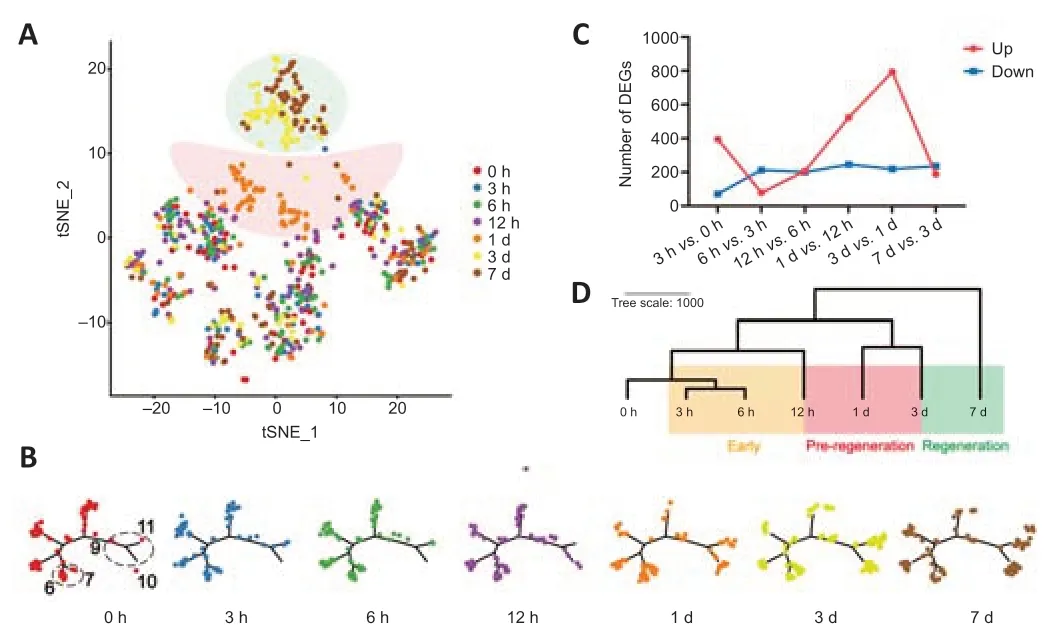
Figure 2|Three different stages during axonal regeneration were defined.
The results from the cell clustering and pseudo-time analyses show that neurons from the 1 day group exhibited an up-regulated number of TFs, indicating this time point represents a pre-regeneration stage for the following RAGs transcription. Therefore, the response of DRG neurons to injury can be divided into three sequential stages: the early, pre-regeneration and regeneration stages (Figure 2D). While these time points and cells were not completely the same as that in our previous study (Li et al., 2015), they shared similar outcomes, which indicated the common features of axonal regeneration after SNC.
The different expression patterns of DRG neurons after injury are identified by WGCNA
WGCNA is a bioinformatics application used to explore the relationships between different gene sets (modules) or between modules and clinical features (Langfelder and Horvath, 2008). To reduce the complexity of the analysis, we examined genes with the top 50% coefficients of variation. A total of 12 distinct modules from 9857 genes were achieved (Figure 3A and Additional Figure 2A, B). The relationships between modules and traits provided a reference for most relevant genes clustered at different time points during axonal regeneration. We identified five modules that were strongly associated with time points: the magenta module (corresponding to 3 hours), green-yellow module (corresponding to 6 hours), green module (corresponding to 12 hours), pink module (corresponding to 1 and 3 days), and black module (corresponding to 7 days) (Figure 3B).
The pink module has a strongly connected gene co-expression network, of whichCacna2d1serves as the hub gene. The MEs also containAtf3,Sema6a, andFlrt3, as well as genes for neuropeptides, such asNpyandAdcyap1, all of which have been reported to encode proteins that regulate synaptogenesis or axonal regeneration (van Kesteren et al., 2011; Nyati et al., 2019; Renthal et al., 2020; Fleitas et al., 2021). The MEs in the black module presents the characteristics of the immune response, includingC1qb/C1qc,Lyz2,Ctss,Fcer1g, andCd74(Additional Table 2). Magenta and green-yellow modules contain several genes related to synapse function, such asGria2,Tbc1d4, andSlitrk1/3in the magenta module and Sorcs3 and Iqsec3 in the green-yellow module. The green module is characterized by genes encoding ion channel and cytokine receptors, such asAtp1b3,Scn9a,Scn10a,Ntrk1,Nfgr, andGpr149(Additional Table 2).
The results of the correlation analysis of the ME with time-dependent changes after injury indicated that most genes in the magenta, green-yellow, and green modules had higher expression levels at the early stage, while the majority of genes in the pink and black modules had higher expression levels at the regeneration stage (Figure 3C). This distinct expression pattern between the early and regeneration stages indicated that 1 day after injury is a turning time point for neurons responding to SNC.
To annotate the function of genes at different time points during the axonal regeneration at a general level, each module was analyzed by GO enrichment analysis. The enriched GO categories of modules in the early stage (magenta, green-yellow, and green) were mainly associated with synapse function maintenance, receptor activity, and ion transport (Figure 3D and Additional Table 3). GO functional analysis of modules in the regeneration stage (pink and black) were enriched for development, transcription, inflammation, response to stimulus, and cell apoptosis/proliferation/migration (Figure 3D and Additional Table 3). These functional enrichments were consistent with previous reports, in which the development and inflammation were activated, while normal synapse function was repressed during axonal regeneration (Li et al., 2015; Chandran et al., 2016; Tedeschi and Bradke, 2017).
Clustering of key genes in the regulation of the axonal regeneration
Among the five modules, the pink module revealed a high correlation with pre-regeneration and regeneration stages. In addition toAtf3, many TF genes that have been linked with axonal regeneration, such asSmad1,Jun, andMyc(Chandran et al., 2016; He and Jin, 2016; Mahar and Cavalli, 2018), were also included in the pink module. Furthermore, conventional RAGs in the axonal regeneration, includingSprr1a,Gadd45a,Stmn4,Syt4, andGal(Yamauchi et al., 2007; Chandran et al., 2016; Jia et al., 2020; Renthal et al., 2020), were enriched in this module (Figure 4A).
The significantly enriched GO categories in the pink module included various features of cellular processes, such as injury detection: response to endogenous stimulus (GO:0009719) and cell surface receptor signaling pathways (GO:0007166); transcriptional regulation: positive regulation of signal transduction (GO:0009967) and regulation of transcription by RNA polymerase II (GO:0006357); and cell response: cell proliferation (GO:0008283), cell death (GO:0008219), and anatomical structure development (GO:0048856) (Figure 4B and Additional Table 3). These results indicate that the pink module is an axonal regeneration-associated module and the genes in this module may play important roles in the regeneration process.
Within the enriched GO terms, we found some neuronal development-related terms: negative regulation of neuron death (GO:1901215), neurogenesis (GO:0022008), and nervous system development (GO:0007399) (labeled in Figure 4B). As the processes underlying development are closely related to regeneration processes, we analyzed the expression and regulation of genes within these three terms with ingenuity pathway analysis. The majority of these neuronal development-associated genes, such asSema6a,Jun, andNpy, had high expression levels at the regeneration stage (1, 3, and 7 days; Figure 4C and Additional Table 4).
Because of the large number of genes and relationships between these genes, we selected some genes with a high fold-change compared with 0 hours to display their interactions (Figure 4C). Within 6 hours after injury, several genes that participated in the immune response were induced, includingIfnlr1,Usp18,Il12A, andAlox15(Dufner et al., 2015; Jin et al., 2016; Hemann et al., 2019; Snodgrass et al., 2021). Additionally, genes related to hypoxia and oxidative stress were also induced, such asMt1andHif3a(Duan, 2016; Kim et al., 2019), indicating that the stress response in the early stage is associated with subsequent transcriptional regulation. After 12 hours of injury, the expression levels ofATF3andIL6were elevated by 10 fold. Several regeneration-associated TFs were induced and most showed high expression levels at 7 days after injury. In the regeneration stage, axon regenerationassociated genes, such asSema6a,Tnik,Htr2b, andGabra5, and cytokine and growth factor genes (Npy,Il6,Il24,Ccl2,Ngf, andVegfd), were elevated. While these genes are associated with neuronal development terms, their dynamic expression after SNC indicates their important functions in axonal regeneration.
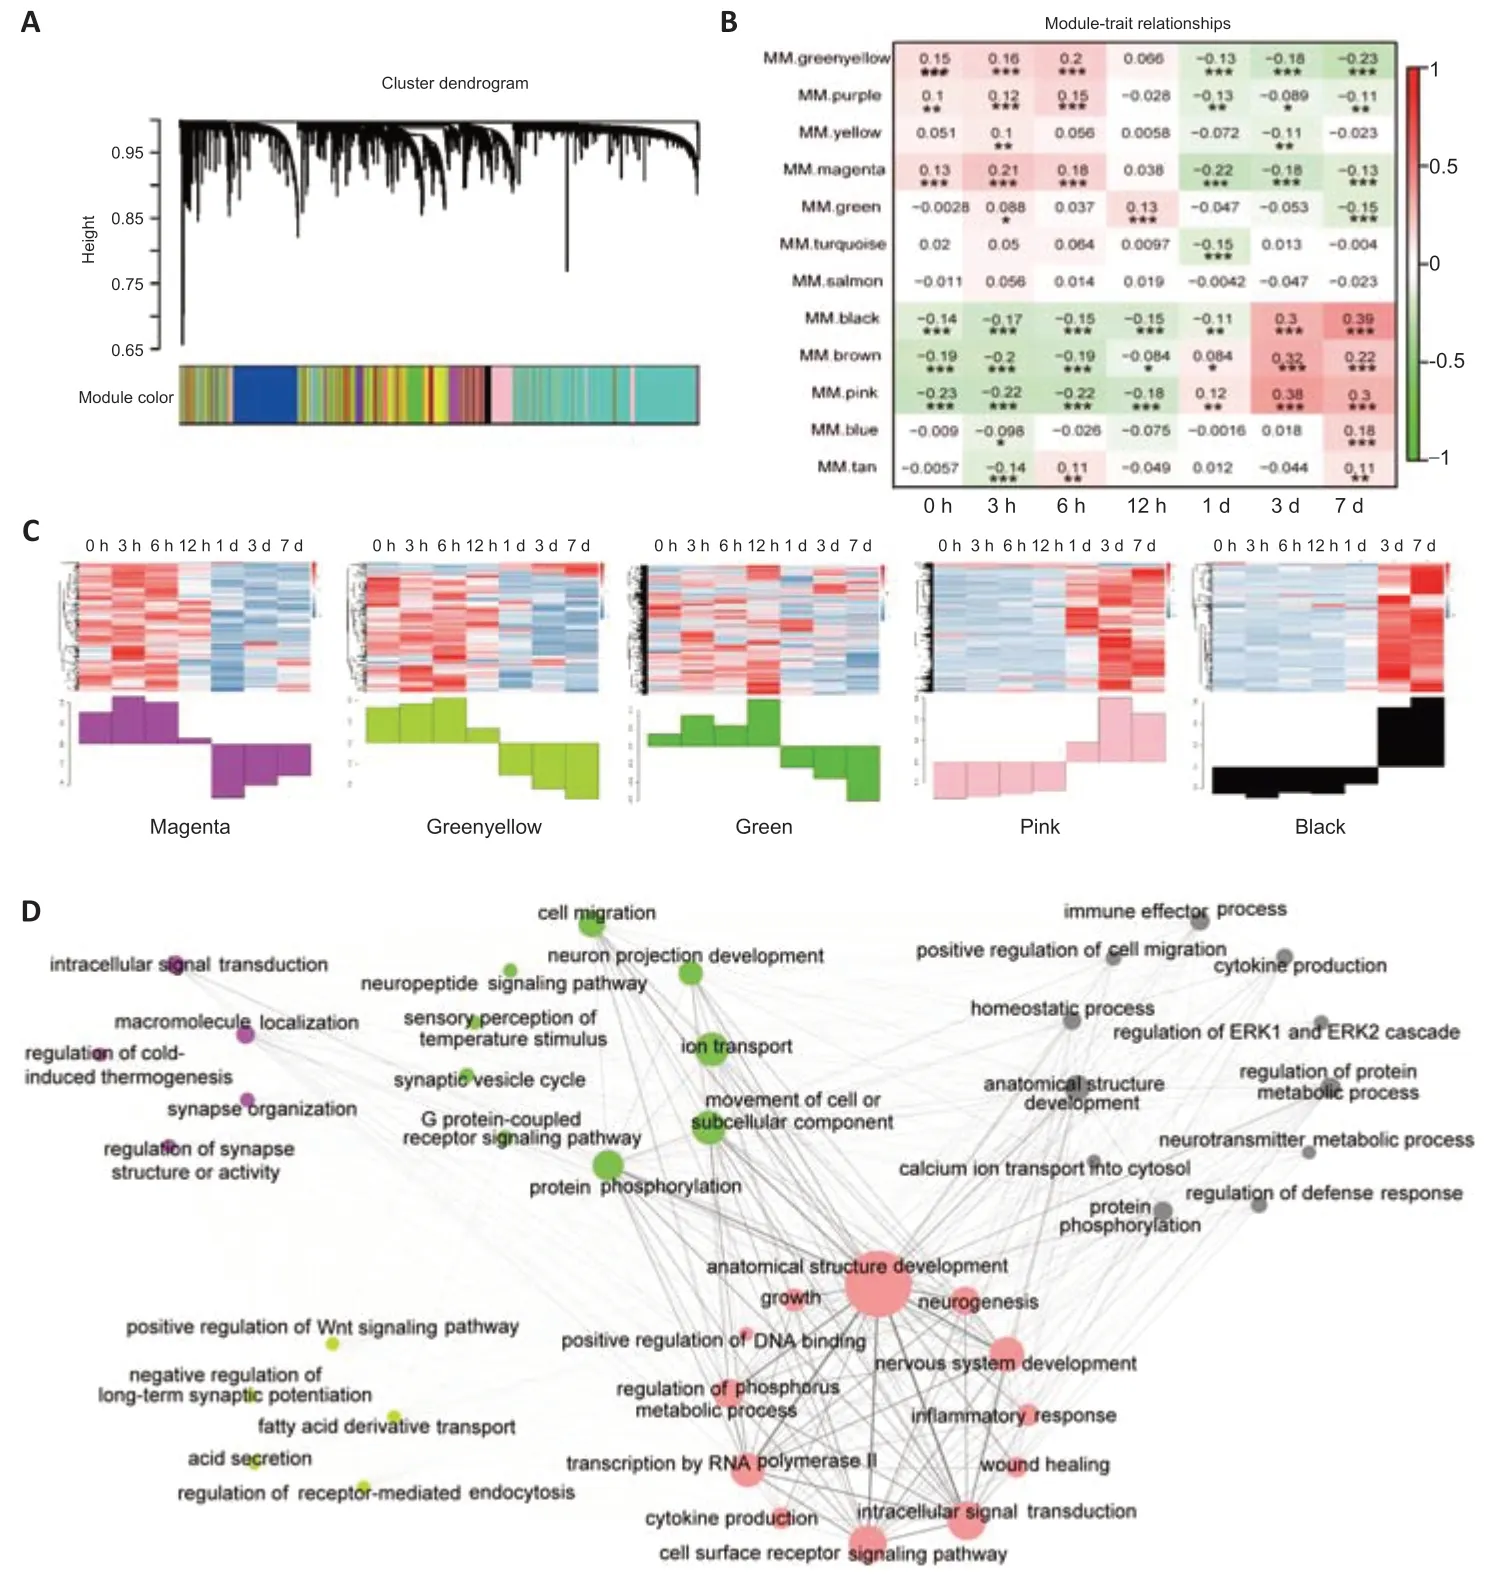
Figure 3|Differentially expressed genes of DRG neurons following injury were identified by WGCNA.
The interaction of TFs during axonal regeneration
Several TFs in the pink module, such asAtf3,Myc,Jun,Smad1, andSox11, were previously reported to participate in the regulation of axonal regeneration (Fagoe et al., 2015; Curcio and Bradke, 2018; Mahar and Cavalli, 2018; Figure 4A and C). We thus examined whether other TFs in the pink module also play important roles in axonal regeneration. There were 69 TFs among the 875 genes in the pink module, of which 67 TFs were up-regulated in the later stages and only 2 TFs (Hmga1andBcl6) were down-regulated. Hmga1 encodes a protein reported to promote the apoptosis of neurons (Li et al., 2020) and Bcl6 encodes a transcription repressor, whose downregulation may attenuate neuronal damage (Wei et al., 2021; Additional Figure 2C–E).
From the connectivity scores of each TF, we ranked the 69 TFs from the highest score (ofAtf3) to the lowest score (ofZfp579) (Figure 5A). Approximately one-third of the TFs have been previously reported to regulate neuronal injury or axonal regeneration, and these were labeled in red. The interaction network between theseTFsshowed a similar outcome;Atf3was identified as the core regulator, andSmad1,Jun,Klf6, andCremwere also in the center of the network (Figure 5B). Among the top 10 TFs, onlyArid5aandZfp367have not been reported to function in axonal regeneration. Additionally, some TFs likeKlf6,Fosl1, andCremhave been found to be associated with neuronal injury in the CNS (Porter et al., 2008; Fernandes et al., 2013; Wang et al., 2018). Their functions in the axonal regeneration in PNS have remained elusive.
In addition to the TFs in this regeneration-related module, we analyzed the activities of all the regulons at each time point by SCENIC R (Aibar et al., 2017). A total of 271 regulons were identified, and their activities are shown by three distinct blocks in Figure 5C. Regulons in block-1 had higher activity in the early stage, whereas regulons in block-2 had higher activity in the regeneration stage. Consistent with the TFs in the pink module, the regulons clustered in block-2 (e.g.,Atf3,Jun,Smad1,Nfil3, andKlf6) exhibited higher activities in regeneration neurons from 1 day after SNC (Figure 5C and Additional Figure 2F). Moreover, the dynamic activities of regulons in block-1 (e.g.,Rfxank,Relb,E2f6) and block-3 (e.g.,Srebf2,E2f3,Foxn2) involving metabolism, immune, and transcription inhibition, reveal the complexity of the axon regeneration process (Additional Figure 2F).
The expression levels and functions of TFs during axonal regeneration
The similarity of regulons on the basis of connection specificity index also displays high relevance between these regulons in block-2 (Additional Figure 3A and B), including regulons ofAtf3,Jun,Sox11,Crem,Klf6,Fosl1andStat3. This similarity not only includes the similar expression pattern of TFs, but also the targets of TFs (Suo et al., 2018). We selectedCrem,Fosl1, andKlf6, which showed high similarity to classical regeneration-associated TFs, for further analysis.
We examined the expression levels ofCrem,Fosl1, andKlf6by immunofluorescence staining (Figure 6). Crem was up-regulated from 12 hours after SNC and localized around the nucleus of DRG neurons (Figure 6A and E). Klf6 was localized in the nucleus of neurons and appeared only at the regeneration stage after injury (Figure 6B and F). While Fosl1 mRNA detected by RNA-seq was up-regulated in the regeneration stage, immunofluorescence staining revealed Fosl1 protein showed little change after SNC (Figure 6C and G). Notably, the function of Arid5a, one of the top TFs, in DRG neurons has not been explored. We found that Arid5a was up-regulated from 12 hours to 7 days and showed a higher expression level at 1 and 3 days, especially in DRG neurons (Figure 6D and H).
To explore the function of the four TFs in axonal regeneration, we transfected siRNAs targeting the TFs in cultured DRG neurons. After confirming effective knockdown by qPCR, we selected two fragments for each TF to perform neurite outgrowth assay (Additional Figure 4A–D). Measurement of the total length of newborn neurites revealed that axonal regrowth was restrained in cells with down-regulatedCrem,Arid5a,Fosl1andKlf6(Figure 7 and Additional Figure 4E–H).
The regulatory network of ATF3 includes upstream and downstream genes
Atf3, the core TF in the axonal regeneration module, has been reported to participate in neuronal injury and axonal regeneration in both the CNS and PNS (Seijffers et al., 2007; Gey et al., 2016; Renthal et al., 2020). Our results showed that both RNA and protein levels of Atf3 were up-regulated at 12 hours after injury (Figure 8A and B). Atf3 activity was also elevated 12 hours after SNC and sustained until 7 days (Figure 8C). Notably, lower activity of the Atf3 regulon was detected in some cells in the regeneration stage, which is consistent with the results of the cell clustering, that some cells were in the unaltered state after SNC (Figures 2A, B and 8D).
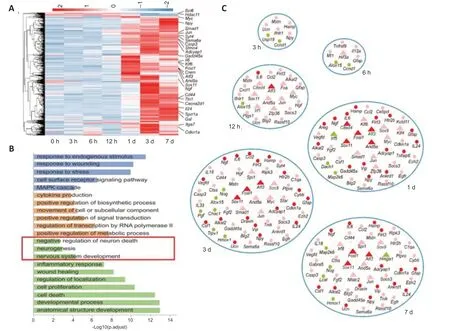
Figure 4|Identification of genes participating in axonal regeneration.
Among the 1139 candidate targets identified during the network construction forAtf3, the expression levels of conventional RAGs (includingSprr1a,Gap43,Sox11, andStmn4) were significantly up-regulated at 3 days compared with controls (Figure 8E and Additional Table 5). Some targets with high FC, such asHamp,Npy,Gal, andVip, have also been reported to regulate axonal regeneration (Tetzlaff et al., 1991; van Kesteren et al., 2011; Kalinski et al., 2015; Gey et al., 2016). The upregulated genes are involved in various cell processes, including development process, cell migration, regulation of signaling, and inflammation response, etc. (Additional Table 6). The multifarious functions of these targets also indirectly reflect the comprehensive roles ofAtf3in axonal regeneration.
The pathways upstream ofAtf3during axonal regeneration have been largely unknown. Ingenuity pathway analysis was thus used to predict the upstream regulators ofAtf3. We identified 559 upstream regulators of Atf3, including cytokines, receptors, chemical drugs, TFs, and miRNAs (Additional Table 7). BecauseAtf3was up-regulated from 12 hours after injury, we intersected the predicted regulators with the DEGs from the group of 3, 6, and 12 hours to identify potential early mediators ofAtf3induction.
After 3 hours of injury, the expression level ofGper1, which has been reported to induce activation of multiple TFs (Jiang et al., 2019), was significantly upregulated. After 6 hours, the down-regulated levels ofEsr1andS100a9were consistent with the slight reduction ofAtf3expression level. In agreement with the above-mentioned results, genes associated with immune and stress responses (e.g.,Ifnlr1,Il12a, andMt1) were induced at 3 and 6 hours in the early stage (Figure 4C). Many TFs regulateAtf3, some of which are elevated at 12 hours, such asJun,Fos,Myc, andNupr1(Figure 8F). These results indicated the possibility of cooperation between these TFs, which have been reported to synergically promote the regeneration of axon branches of sensory neurons (Fagoe et al., 2015).
Combining the upstream regulators and downstream targets, we constructed the regulatory network ofAtf3during axonal regeneration (Figure 8G). The immune and stress response at the early stage induces the activation of Atf3-centric TF network activation at the pre-regeneration stage, followed by RAG induction at the regeneration stage, which enables neurons to perform axonal regeneration.
In conclusion, the results of the LCM-seq of DRG neurons following SNC helped elucidate some of the mechanisms of axonal regeneration (Figure 9). Our results identified three stages: early stage (3–12 hours), representing the organization of active synapses and receptor activation; the pre-regeneration stage (1 day), involving a high activity of signal transmission and transcription; and the regeneration stage (3–7 days), with neuronal development and immune and inflammation response.
The key signaling molecules, cellular receptors, TFs and effectors are presented in Figure 9. Briefly, in the early stage, the synapse-associated genes exhibited high expression (e.g.,Tbc1d4,Gria2,Slitrk1/3), and stress-response genes (e.g.,Hamp,Mt1,Hif3a,Il12a,Gper1) was elevated, which is essential to assist nerve injury signaling in the early stage. Subsequently, ion transport (e.g.,Scn10a,Gpr149,Atp1b3) and the regeneration-related TF network (e.g.,Atf3,Jun,Fos,Crem,Klf6,Sox11,Arid5a,Fosl1/2) were induced in the pre-regeneration stage, in which active transcriptional regulation begins. In the regeneration stage, large amounts of RAGs were up-regulated to realize axonal regeneration (e.g.,Gap43,Sprr1a,Stmn4,Npy,Il6,Gal,Adcyap1), and high activity of immune and inflammation response (e.g.,C1qb/c,Ctss,Cd74,Ccl2) and neuropathic pain (e.g.,Cacna2d1,Gal,Csf1) were induced (Figure 9).
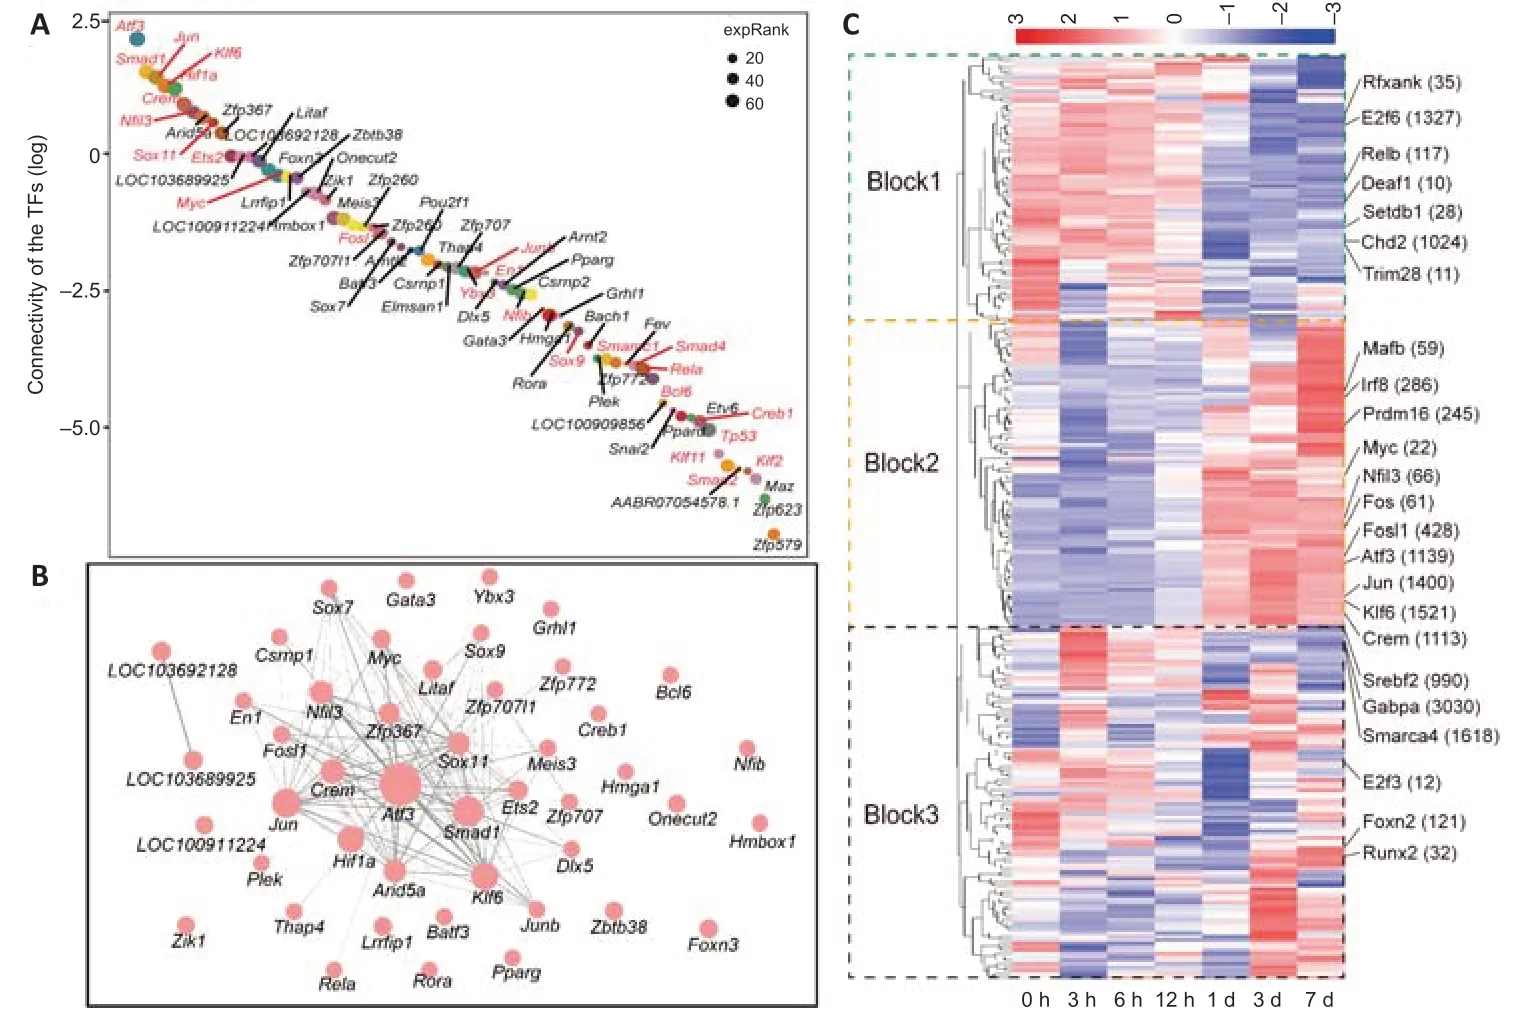
Figure 5|TFs in the axonal regeneration-related module.
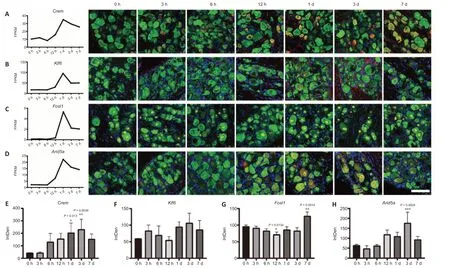
Figure 6|The up-regulations of TFs in DRGs after SNC.

Figure 7|Restricted neurite outgrowth in cultured DRG neurons with down-regulated TFs.

Figure 8|Regulatory network of Atf3.
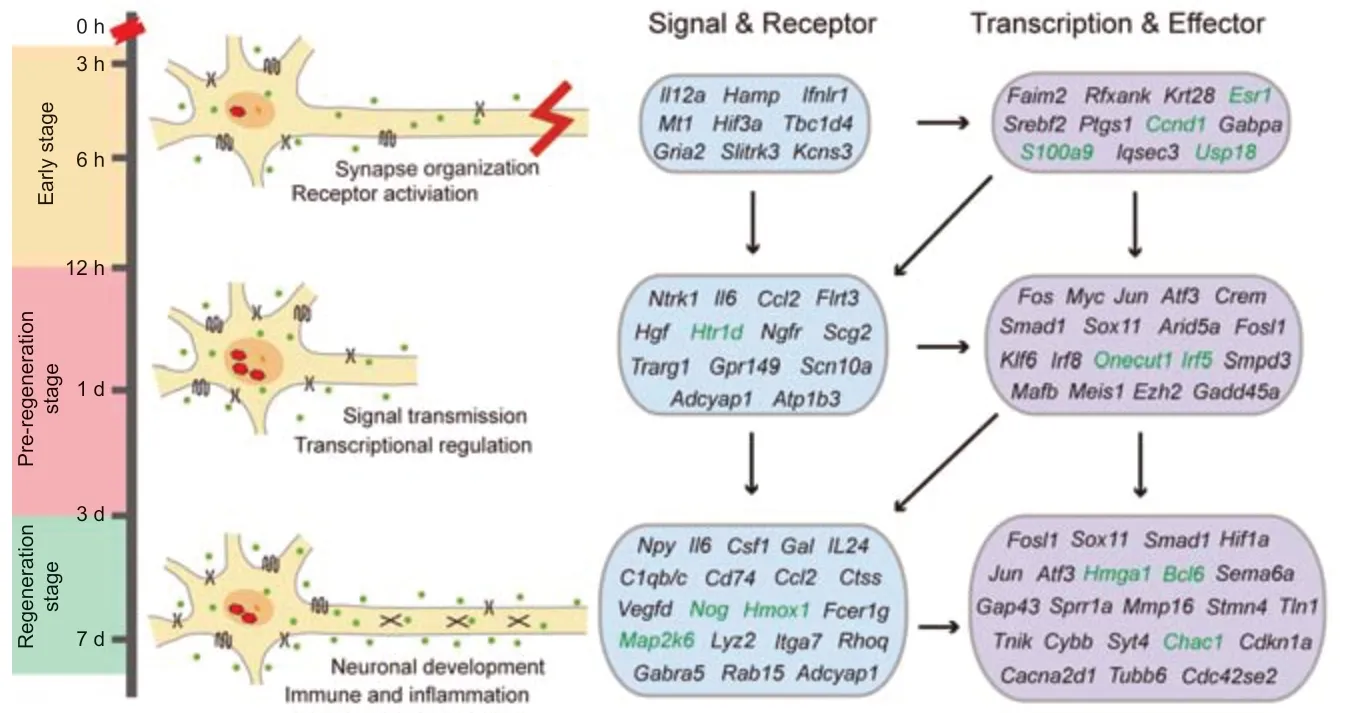
Figure 9|The molecular regulatory mechanisms of DRG neurons following axonal injury.
Discussion
Compared with neurons in the CNS that exhibit limited regeneration, neurons in the PNS are able to undergo axonal regrowth and achieve partly functional reconstruction after nerve injury (He and Jin, 2016; Mahar and Cavalli, 2018; Fawcett, 2020; Lemaitre and Court, 2021; Cintron-Colon et al., 2022). To explore the mechanism underlying these processes, several studies of DRG neurons have been carried out following sciatic nerve injury (Chandran et al., 2016; Weng et al., 2017). The development of LCM-seq has provided the opportunity for molecular profiling of specific neurons (Nichterwitz et al., 2016, 2018). In this study, we performed LCM-seq of L4–L5 DRG neurons after SNC, which has been verified to induce a large number of genes that participate in injury response and axonal regeneration (Vogelaar et al., 2004). Following SNC, a total of 712 samples from a control group (0 hours) and six groups at various time points after injury (3, 6, 12 hours, 1, 3, and 7 days) were harvested by LCM and RNA sequencing was performed with Smart-seq2.
Recent studies found that a new cluster appeared after injury in PNS, which displayed injury state by upregulating several RAGs (e.g.,Atf3,Sox11, andSprr1a) (Nyati et al., 2019; Renthal et al., 2020; Wang et al., 2021b). We also found a regeneration state (states 10 and 11), which includes nearly half of the neurons from 3 and 7 days post-crush. The two states exhibited higher expression of classical regeneration markers (Atf3andGap43), indicating that these neurons were undergoing transcriptional re-programming and axon re-building. In addition, half of the neurons from 3 and 7 days after injury displayed similar states to neurons of the normal group, indicating they were unaffected by the incomplete injury by SNC. Transection of the sciatic nerve can lead to damage of most axons (90–95%), while crush can lead to damage of half of the axons (50%) (Renthal et al., 2020).
Notably, the number of cells in states 6 and 7 showed a fluctuation, with an increase at 1 day and reduction to normal level at 7 days. This phenomenon was consistent with a recent report showing that one of the three injuryinduced clusters only appeared 1 day after injury and later transformed to another cluster. It is possible that active ion transmission and second messenger response by the retrograde injury signals may slow down after the transcriptional network induction in the regeneration stage (Chandran et al., 2016; Lee and Cho, 2021). Pre-regeneration stage as a bridge received the axonal stimulation from the early stage and initial soma response, prepared for the comprehensive molecular transcription and translation for regeneration.
The expression of RAGs requires transcriptional activation, which involves axonal regeneration-related TFs, likeAtf3,Egr1,Jun,Myc,Smad1, andStat3(Moore and Goldberg, 2011; Chandran et al., 2016). In this study, we used WGCNA to identify an axonal regeneration-related TF network, which contains most of these TFs.Atf3, the hub TF in this network, displays high expression and activity in the pre-regeneration and regeneration stages. Through the regulation of various downstream targets, Atf3 participates in multiple cell processes, including axonal regeneration (viaGap43,Sprr1a,Gal, andNpy) (Gey et al., 2016; Renthal et al., 2020), cell proliferation/differentiation/migration (Cdkn1a,Serpine1, andCasp3), metabolic process (Arg1,Ucn, andAdcyap1), signaling (Csrp3,Htr2a, andVip), and immune system process (Il6,Csf1, andCcrl2). Successful axonal regeneration cannot be achieved without these cell processes, which underscores the importance of Atf3.
In addition to Atf3, other TFs like Klf6 and Fosl1 have been reported to promote axon growth of retinal ganglion cells in the CNS (Porter et al., 2008; Fernandes et al., 2013; Steketee et al., 2014). Injury of these cells can induce up-regulation of Crem (Xu et al., 2014). We also verified the up-regulation of Crem, Klf6, and Fosl1 in DRG neurons after injury. Arid5a was reported to participate in immune response by interacting with Il-6 or Stat3 (Nyati et al., 2019), which also have a positive influence on axonal regeneration (Leibinger et al., 2021; Wareham et al., 2021). LCM-seq showed that after SNC, Arid5a was significantly up-regulated in DRG neurons, and the highest expression of both RNA and protein levels appeared at 1 and 3 days. After suppressingCrem,Arid5a,Fosl1, andKlf6, axon regrowth was restrainedin vitro. There is a possibility that these TFs may cooperate in regulating axonal regeneration, given their similar expression pattern and function. Further experiments are needed to verify this possibility.
To trigger the transcriptional network, elevation of Gper1 at 3 hours after SNC has been reported to induce cAMP and activation of the TF network, includingAtf3,Egr1, andFos(Pandey et al., 2009). The up-regulated cytokines or receptors likeIl12a,Ifnlr1, andIl6in the early stage also induceAtf3activation (Filén et al., 2010). Once these inducers are activated in the early stage, the TF network is triggered in the pre-regeneration stage. In this network, Atf3 increases by 10-fold at 12 hours after SNC. Together with other TFs like Fos, Jun, and Myc, a Atf3-centric network forms and regeneration-associated genes are induced, leading the neurons to transform to the regeneration state.
The results of LCM-seq in this study reveals gene expression and molecular regulation of axonal regeneration of DRG neurons, which includes the early stage (3–12 hours), pre-regeneration stage (1 day), and regeneration stage (3–7 days) following SNC. During the pre-regeneration and regeneration stages, activation of the Atf3-centric transcriptional network (includingJun,Fos,Crem, andArid5a) causes induction of genes involved in axonal regeneration, immune response, and neuropathic pain. Our study provides more details of axonal regeneration and provides potential molecular targets for nerve injury therapy. However, the regulatory network of immune response and neuropathic pain in these three stages remains to be explored. Identification of regulators involved in the immune response to axonal regeneration and/or neuropathic response will be critical. The candidate upstream regulators of Atf3 in this study also need further verification.
Author contributions:Study conception and design, manuscript draft: LLZ, XSG; experiment implementation: LLZ, TZ, WXH, TTG; data analysis: LLZ, TZ, WXH. All authors have read and approved the final version of the manuscript.
Conflicts of interest:The authors declare that they have no conflict of interest.
Data availability statement:Raw and processed data generated in this study are available in the Genome Sequence Archive (https://ngdc.cncb.ac.cn/gsa/) with an accession number (CRA006945). R scripts are available from the corresponding author upon reasonable request.
Open access statement:This is an open access journal, and articles are distributed under the terms of the Creative Commons AttributionNonCommercial-ShareAlike 4.0 License, which allows others to remix, tweak, and build upon the work non-commercially, as long as appropriate credit is given and the new creations are licensed under the identical terms.
Open peer reviewer:Katherine L. Marshall, Johns Hopkins University School of Medicine Neurology, USA.
Additional files:
Additional Figure 1:Three different stages were defined during the axonal regeneration
Additional Figure 2:Multiple genes and regulons were responded to sciatic nerve injury.
Additional Figure 3:The regeneration-associated regulon module and the GO enrichment of Atf3 targets.
Additional Figure 4:Suppressing TFs respectively reduce the axon regrowth of cultured DRG neurons.
Additional Table 1:The expression of neuronal, Schwann cell and Satellite cell markers.
Additional Table 2:The gene expression in different module.
Additional Table 3:The GO enrichment of different module.
Additional Table 4:The expression of neuronal development-associated genes.
Additional Table 5:The fold change of predicted targets of Atf3 between 0 hours and 3 days after injury.
Additional Table 6:The GO enrichment of targets of Atf3.
Additional Table 7:The predicted up-stream regulators of Atf3.
Additional file 1:Open peer review report 1.
- 中国神经再生研究(英文版)的其它文章
- Corrigendum
- Extracellular vesicles as a potential therapeutic for agerelated macular degeneration
- Survival of rat sciatic nerve segments preserved in storage solutions ex vivo assessed by novel electrophysiological and morphological criteria
- Fasting produces antidepressant-like effects via activating mammalian target of rapamycin complex 1 signaling pathway in ovariectomized mice
- Suppressing high mobility group box-1 release alleviates morphine tolerance via the adenosine 5'-monophosphate-activated protein kinase/heme oxygenase-1 pathway
- 5-Hydroxytryptamine: a potential therapeutic target in amyotrophic lateral sclerosis

