5-Hydroxytryptamine: a potential therapeutic target in amyotrophic lateral sclerosis
Shi-Shi Jiang , Meng-Ni Gong , Wei Rao , Wen Chai Wen-Zhi Chen Xiong Zhang , Hong-Bing Nie , Ren-Shi Xu
Abstract Previous studies have indicated that the pathogenesis of amyotrophic lateral sclerosis (ALS) is closely linked to 5-hydroxytryptamine (5-HT). To investigate this further, we administered 5-HT receptor antagonists to SOD1*G93A transgenic (ALS mouse model) and wide-type mice. This involved intraperitoneal injections of either granisetron, piboserod, or ritanserin, which inhibit the 5-HT3, 5-HT4, and 5-HT2 receptors, respectively. The transgenic mice were found to have fewer 5-HT-positive cells in the spinal cord compared with wide-type mice. We found that the administration of granisetron reduced the body weight of the transgenic mice, while piboserod and ritanserin worsened the motor functioning, as assessed using a hanging wire test. However, none of the 5-HT receptor antagonists affected the disease progression. We analyzed the distribution and/or expression of TAR DNA binding protein 43 (TDP-43) and superoxide dismutase 1 G93A (SOD1-G93A), which form abnormal aggregates in ALS. We found that the expression of these proteins increased following the administration of all three 5-HT receptor antagonists. In addition, the disease-related mislocalization of TDP-43 to the cytoplasm increased markedly for all three drugs. In certain anatomical regions, the 5-HT receptor antagonists also led to a marked increase in the number of astrocytes and microglia and a decrease in the number of neurons. These results indicate that 5-HT deficiency may play a role in the pathogenesis of amyotrophic lateral sclerosis by inducing the abnormal expression and/or distribution of TDP-43 and SOD1-G93A and by activating glial cells. 5-HT could therefore be a potential therapeutic target for amyotrophic lateral sclerosis.
Key Words: 5-hydroxytryptamine; amyotrophic lateral sclerosis; astrocytes; granisetron; microglia; neuron; piboserod; ritanserin; SOD1-G93A; TAR DNA-binding protein 43
Introduction
Amyotrophic lateral sclerosis (ALS) is one of the most common neurodegenerative diseases that leads to motor neuron (MN) death in the central nervous system (Rodrigues Lima-Junior et al., 2021; Xu and Yuan, 2021; Liu et al., 2022). ALS mainly damages the anterior horn of the spinal cord, the brainstem motor nuclei, and the corticospinal MNs (Ricci et al., 2018). ALS is characterized by the degeneration of both upper and lower MNs, which leads to progressive muscle atrophy and weakness. The onset of ALS is often restricted to a particular location, such as a limb or the pharyngolarynx (Cleveland and Rothstein, 2001; Bradley, 2009). The ALS gradually progresses to systemic muscle atrophy, dysphagia, and finally respiratory failure, which causes death (Kiernan et al., 2011; Zarei et al., 2015), and the majority of patients do not survive more than 3–5 years after symptom onset. However, both the etiology and the pathogenesis of ALS are still unclear (Petrov et al., 2017; Sawada, 2017).
5-Hydroxytryptamine (5-HT) is an indolamine neurotransmitter, which has been implicated in ALS. It is normally abundant in both the cerebral cortex and the spinal cord (Young, 2007). Within the central nervous system, 5-HT has been shown to be involved in the regulation of appetite, sleep, pain, anxiety, and depression, as well as affecting the physiological processes involved in aggressive behavior, learning, memory, body temperature regulation, and sexual behavior (Lehnert and Wurtman, 1993). 5-HT primarily acts by binding to 5-HT receptors, which are located on the cell membranes of neurons and other types of cells. There are seven different 5-HT receptor subtypes (5-HT1–7; McCorvy and Roth, 2015). These receptors are often targeted by drugs, including antidepressants, antipsychotics, anorectics, antiemetics, gastric motility drugs, and antimigraine drugs (Leonard, 1996).A number of studies have indicated that 5-HTergic neurons degenerate in ALS (Sandyk, 2006; Dentel et al., 2013; El Oussini et al., 2017). It has also been shown that the 5-HT precursor, 5-hydroxytryptophan, postpones the neuromuscular damage in a mouse model of ALS (SOD1*G93A transgenic mice; Turner et al., 2003). Patients with ALS have also been found to have decreased levels of platelet 5-HT, and this has been shown to affect the survival rate (Dupuis et al., 2010). These studies all indicate that the pathogenesis of ALS could involve 5-HT (Turner et al., 2003; Dupuis et al., 2010; Dentel et al., 2013); however, the effects and mechanisms of 5-HT in ALS are currently unclear. In this study, we selected three 5-HT receptor antagonists to study the effects of 5-HT on ALS progression and to identify potential therapeutic targets: ritanserin (5-HT2 receptor antagonist; Mayer, 2003), granisetron (5-HT3 receptor antagonist; Duggan and Curran, 2009), and piboserod (5-HT4 receptor antagonist; Darblade et al., 2005).
In the majority of patients with ALS, there is an aggregation of abnormal proteins in the MN cytoplasm, such as abnormal superoxide dismutase 1 (SOD1) and TAR DNA-binding protein 43 (TDP-43); this is one of the characteristic pathological changes in ALS (Droppelmann et al., 2019). The gene encoding SOD1 was the first gene to be related to the pathogenesis of ALS (Rosen et al., 1993). One of the SOD1 gene mutations is the G93A mutation, which is used in the main mouse model of ALS (Kirby et al., 2022). This SOD1*G93A mouse model can simulate the onset and progression of ALS much better than other animal models, such as the SOD1-G37R (Wong et al., 1995) and SOD1-G85R (Bruijn et al., 1997) transgenic (TG) mice. SOD1*G93A mice display the different disease stages (pre-onset, onset, and progression stages) that occur in ALS (Gurney, 1997); this is not seen so clearly in the other mouse models. The SOD1*G93A mice also exhibit selective and progressive MN lesions, as in ALS. This mouse model is therefore used extensively to study the pathogenesis of ALS and to investigate potential treatment targetsin vivo(Gurney et al., 1994; Henriques et al., 2010; Morrice et al., 2018).
The TDP-43 protein, which aggregates in the MN cytoplasm in ALS, is encoded by the TAR DNA-binding protein gene. This protein is a highly conserved DNA and RNA binding protein, and there is evidence that it is involved in the splicing, transport, and stabilization of mRNA (Arai et al., 2006; Buratti and Baralle, 2010). TDP-43 is mainly expressed within the nuclei of neurons; however, in patients with ALS, most of the TDP-43 is found in the cytoplasm where it forms abnormal aggregates (Sephton et al., 2010). There is evidence that TDP-43, like SOD1-G93A, plays an important role in the pathogenesis of ALS. We therefore chose to analyze both TDP-43 and SOD1-G93A following the administration of 5-HT receptor antagonists in our study.
Previous work on ALS patients has shown that activated astrocytes are distributed around regions where there are degenerated upper or lower MNs (Nagy et al., 1994; O’Reilly et al., 1995). These reactive astrocytes can induce MN death, and they play a key role in the ALS pathology (Pehar et al., 2017). Studies using a SOD1 mouse model of ALS have shown that microglia also have neurotoxic effects, which can lead to both the onset and progression of the disease (Beers et al., 2006; Boillée et al., 2006). In line with this, microglia activation has been shown to be a universal feature of ALS, and there is significantly increased activation in mouse models of familial ALS (Lall and Baloh, 2017). In this study, we therefore observed and analyzed the effects of our three 5-HT receptor antagonists on astrocytes and microglia, as well as neurons, in TG mice.
Our study was designed to analyze 5-HT changes in the spinal cord of a TG mouse model of ALS, and to explore the potential mechanisms by which 5-HT affects the pathology. For this, we focused on three 5-HT receptor antagonists: granisetron, piboserod, and ritanserin.
Methods
Animals
C57BL/6 TG mice were produced by breeding male (at the age of 50–120 days) SOD1*G93A TG mice (Jackson Laboratory, Bar Harbor, ME, USA; Strain# 004435, RRID: IMSR_JAX:004435) with female (at the age of 50–180 days) C57BL/6 wild-type (WT) mice (Jackson Laboratory; Strain# 000664, RRID: IMSR_JAX:000664) in Jiangxi Provincial People’s Hospital. Genomic DNA was isolated from the mouse tails and used to determine whether each mouse was TG. A muscle biopsy was conducted to examine the gastrocnemius muscle in atrophic limbs. Hematoxylin-eosin staining was used to detect pathological changes in the muscle through a light microscope (Nikon, Tokyo, Japan). This determined the extent of the limb muscle paralysis (Zhou et al., 2015) and whether the disease was at the pre-onset, onset, or progressive stage. The effects of the three 5-HT receptor antagonists were also examined and how these affected the onset and progression of the disease in the mouse model (Gurney et al., 1994; Henriques et al., 2010). The experiments were all authorized and approved by the Ethics Committee for Animal Care and Use of Jiangxi Provincial People’s Hospital (ACUEC No. 2019-11-02, approved on November 2, 2019).
Animal grouping and drug administration
The male TG mice were randomly divided into three experimental groups and one control group, with a total of six mice per group. The experimental groups were administered one of the three 5-HT receptor antagonists: granisetron, piboserod, or ritanserin; the control group was administered dimethyl sulfoxide (DMSO, vehicle). Male age-matched WT mice were also randomly divided into four groups, as above, again with a total of six mice per group. This experimental design enabled comparison of the different interventions with appropriate controls.
From the age of 70 days, mice in the granisetron/piboserod/ritanserin groups were intraperitoneally injected each day with either granisetron (Selleck Chemicals, Houston, TX, USA; 1 mg/kg of body weight), piboserod (MedChem Express, Monmouth Junction, NJ, USA; 0.5 mg/kg of body weight), or ritanserin (Sigma-Aldrich, St. Louis, MO, USA; 1 mg/kg of body weight). The injections were carried out at the same time each day for a total of 60 days. The drugs were all dissolved in DMSO (0.1%, 10 mM, Sigma-Aldrich) and then diluted with 0.9% normal saline prior to injection, in accordance with the manufacturer’s instructions. The mice in the control groups were intraperitoneally injected with 0.1% DMSO in 0.9% normal saline (the same volume as for the experimental groups) at the same time each day for a total of 60 days. From the age of 70 days, the mice were evaluated every three days, at the same time of day, to determine the body weight, performance on a hanging wire test, and neurological functioning scores (ALS Therapy Development Institute, ALSTDI). This was continued until the neurological functioning score was 4 (corresponding to severe paralysis of all limbs), at which point the mice were sacrificed. Spinal cord specimens were then obtained and analyzed using immunofluorescence staining and Western blotting (Figure 1).

Figure 1|Flowchart of experimental procedures.
Body weight measurement
The mouse body weight was measured using an electronic balance (Wante Weighing Instrument Co., Ltd., Hangzhou, China) every 3 days from the age of 70 days. This measurement was obtained between 10:00 and 12:00 to avoid diurnal changes (Li et al., 2015). The measurements were obtained for all six mice in each group. The body weight was a percentage of the first measured value.
Hanging wire test
Limb grasping ability was assessed using a hanging wire test. For this test, each mouse was placed on top of the wired housing-cage lid, which was then quickly inverted. The time from lid inversion to the mouse falling was measured. This was repeated three times for each mouse, with a maximum of 90 seconds for each trial; the longest hanging time was recorded for each mouse (Weydt et al., 2003). This test was repeated for each mouse every 3 days from the age of 70 days. All six mice in each group were tested.
Neurological functioning scale
Neurological functioning was assessed for each mouse every 3 days from the age of 70 days (for all six mice in each group). This determined the degree of disease progression on a scale of 0–4, using a method developed by ALSTDI (Scott et al., 2008; Li et al., 2015). A score of 0 was given when a mouse, suspended by the tail, extended its hind limbs away from lateral midline and maintained this position for at least 2 seconds for each test repetition (two or three repetitions); a score of 1 was given when a mouse, suspended by the tail, the hind limbs exhibited collapsed or partially collapsed towards the lateral midline, or if there was hind-limb trembling; a score of 2 was given when a mouse walked a distance of 12 inches and its toes curled down at least twice or it dragged any part of its hind limbs along the bottom of the cage; a score of 3 was given when the hind limbs could not be used to move forward, and there was rigid paralysis or minimal joint movement in the hind limbs; a score of 4 was given when a mouse couldn’t turn over by itself within 30 seconds when placed on its side (both right and left sides). The ALSTDI scores 0–3 were considered to be analogous to ALS pre-onset (score 0), onset (score 1), and progression (scores 2–3). An ALSTDI score of 4 indicated severe limb paralysis in the TG mouse, which was then close to death. The day on which this score was obtained was therefore taken as the time to death and used to calculate the survival time.
Immunofluorescence staining
Five mice from each group were anesthetized using an intramuscular injection of pentobarbital sodium (4 mg/kg; New Asiatic Pharmaceutical, Shanghai, China) in the hind limbs, and perfused with 4% paraformaldehyde. The cervical or lumbar spinal cord was removed, immersed in 4% paraformaldehyde buffer overnight, incubated in 20% pH 7.5 sucrose phosphate buffer saline at 4°C for 5 days, and then embedded using optimal cutting temperature compound (Sakura Finetek Japan Co. Ltd., Tokyo, Japan). The spinal cord was sectioned into 12 µm-thick transverse slices using a cryostat (Leica, Wetzlar, Germany). Each section was permeabilized using 0.2% Triton X-100, rehydrated in phosphate-buffered saline, blocked using 10% goat serum in phosphatebuffered saline, and incubated overnight at 4°C with the following primary antibodies: goat anti-serotonin (1:100, Abcam, Cambridge, UK, Cat# ab66047, RRID: AB_1142794), rabbit anti-TDP-43 (1:200, Proteintech, Wuhan, China, Cat# 80002-1-RR, RRID: AB_2882934), rabbit anti-glial fibrillary acidic protein (GFAP; 1:800, Proteintech, Cat# 16825-1-AP, RRID: AB_2109646), rabbit anti-ionized calcium binding adapter molecule 1 (IBA1; 1:300, WAKO, Tokyo, Japan, Cat# 019-19741, RRID: AB_839504), and mouse anti-NeuN (1:400, Abcam, Cat# ab104224, RRID: AB_10711040). This was followed by incubation at room temperature for 2 hours with the following secondary antibodies: donkey polyclonal antibody anti-goat IgG-rhodamine tetramethylisothiocyanate (TRITC; 1:200, Abcam, Cat# ab6522, RRID: AB_955502), Cy3-conjugated AffiniPure goat anti-rabbit IgG (H+L; 1:200, ProteinTech, Cat# SA00009-2, RRID: AB_2890957), donkey pAb anti-rabbit IgG-fluorescein isothiocyanate (FITC; 1:400, Abcam, Cat# ab6798, RRID: AB_955323), and CoraLite488-donkey anti-mouse IgG (H+L; 1:400, ProteinTech, Cat# SA00013-5, RRID: AB_2890971). The sections were then incubated with 4′,6-diamidino-2-phenylindole (Abcam, Cat# ab104139) for 10 minutes. The stained sections were observed, and photos were taken, using a Nikon E800 fluorescent microscope equipped with a digital camera (Diagnostic Instruments, Sterling Heights, MI, USA). The average number of cells exhibiting immunofluorescence staining was determined for 10 sections per mouse.
Western blot assay
Five mice from each group were perfused with 20 mL of normal saline following anesthetization. The spinal cord was then isolated and homogenized at 4°C using 1× radioimmunoprecipitation assay lysis buffer (1% Nonidet P-40, 0.1% sodium dodecyl sulphate, 50 mM Tris-HCl, 12 mM sodium deoxycolate, 150 mM sodium chloride, pH 7.2) along with a protease inhibitor solution (Beyotime, Shanghai, China). The lysate solution was then centrifuged at 12,000 ×gfor 10 minutes at 4°C. The protein concentration in the supernatant was measured using a BioRad protein assay kit (BioRad, Hercules, CA, USA). Equal amounts of protein (20 µg) were added to wells containing 10% sodium dodecyl sulphate-polyacrylamide gel, and electrophoresis was carried out. Following this, the gel was transferred onto nitrocellulose membranes (Millipore, Bedford, MA, USA). These were blocked using 5% skimmed milk for 1 hour at room temperature on a shaker, and then incubated overnight at 4°C with the following primary antibodies: rabbit anti-TDP-43 (1:1000, Proteintech, Cat# 80002-1-RR, RRID: AB_2882934), mouse anti-misfolded human SOD1 clone C4F6 (1:1000, MediMabs, Montreal, Quebec, Canada, Cat# MM-0070-2-P, RRID: AB_10015296), and mouse anti-β-actin (1:1000, ZSGB-Bio, Beijing, China, Cat# TA-09, RRID: AB_2636897). The membranes were then incubated at room temperature for 1 hour with secondary antibodies conjugated to horseradish peroxidase: goat anti-rabbit IgG (H&L; 1:2000, KPL, Gaithersburg, MD, USA, Cat# 611-1302, RRID: AB_219720) and anti-mouse IgG (H&L) secondary antibodies (1:2000, Beyotime, Cat# A0216, RRID: AB_2860575). Protein bands were exposed using an EasySee Western blot kit (Uelandy, Suzhou, China), and ImageJ software (1.8.0 version, National Institutes of Health, Bethesda, MD, USA) was used to measure the optical density. The relative protein expression was determined using the band density obtained from WT mice administered DMSO (vehicle) alone.
Statistical analysis
For each measure, the mean ± standard deviation (SD) was calculated. The body weight and hanging wire test data were analyzed using two-way analysis of variance withpost hocBonferroni tests. The ALSTDI neurological functioning data were analyzed using Kaplan-Meier survival analysis. The other data were analyzed using unpaired Student’st-tests or one-way analysis of variance followed bypost hocBonferroni tests.Pvalues < 0.05 were regarded as statistically significant.
The analyses for the body weight, hanging wire test, and Kaplan-Meier survival were conducted using GraphPad Prism (version 9.0.0 for Windows, GraphPad Software, La Jolla, CA, USA, www.graphpad.com). The relative fluorescent intensities for the immunofluorescence staining were determined using Image-Pro Plus software (version 6.0, Media Cybernetics, Silver Springs, MD, USA).
Results
Expression of 5-HT in the cervical spinal cord in the ALS mouse model
5-HT immunopositivity was observed in the cervical spinal cord of both WT and TG mice using immunofluorescence staining (Figure 2A). The percentage of 5-HT-positive cells in this region was significantly lower in the TG mice than in the WT mice (P= 0.0011; Figure 2B).
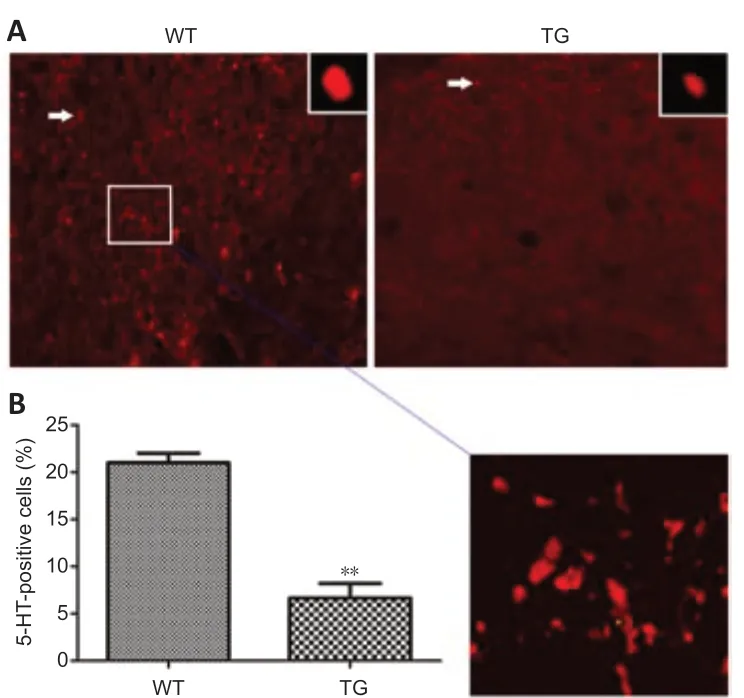
Figure 2|The expression of 5-HT in both SOD1*G93A TG and WT mice.
Effects of granisetron on disease onset, progression, and survival time in the ALS mouse model
The body weight of the TG mice administered granisetron was significantly lower than in the TG mice administered DMSO (vehicle) alone at the ages of 106 (P= 0.0004), 109 (P= 0.0002), 112 (P= 0.0023), 115 (P= 0.0012), 118 (P= 0.0089), and 121 days (P= 0.0098; Figure 3A). In contrast, for the WT mice, granisetron did not significantly affect the body weight (Figure 3A). The hanging wire test results showed that there were no significant differences between the TG mice administered granisetron and those administered DMSO alone (P> 0.05; Figure 3B). Further analyses examined the time it took to reach ALSTDI scores of 1–4; it was found that these did not differ significantly between the granisetron- and vehicle-treated TG mice (P> 0.05; Figure 3C–F). These results indicate that granisetron does not accelerate the disease onset and progression or shorten the survival time of the TG mice.
Effects of piboserod on disease onset, progression, and survival time in the ALS mouse model
Piboserod did not affect the body weight of either the WT or the TG mice (P> 0.05; Figure 4A). The hanging wire test results showed that the TG mice administered piboserod had a significantly shorter hanging time than the vehicle-treated TG mice from the age of 97 days up until 127 days: 97 days (P= 0.000011), 100 days (P= 0.000030), 103 days (P= 0.000033), 106 days (P= 0.000014), 109 days (P= 0.0000016), 112 days (P= 0.0000025), 115 days (P= 0.0000016), 118 days (P= 0.000000034), 121 days (P= 0.000054), 124 days (P= 0.0001), and 127 days (P= 0.0108; Figure 4B). The time taken to reach ALSTDI scale scores of 1–4 did not differ significantly between the piboserod- and vehicle-treated TG mice (P> 0.05; Figure 4C–F). These results indicate that piboserod does not accelerate the disease progression or shorten the survival time of the TG mice.
Effects of ritanserin on disease onset, progression, and survival time in the ALS mouse model
The effects of ritanserin were assessed in the WT and TG mice by analyzing the body weight, hanging wire test performance, and ALSTDI scale scores. It was found that ritanserin did not affect the body weight of the WT or TG mice (P> 0.05; Figure 5A). The hanging wire test time was significantly shorter for the TG mice administered ritanserin compared with the vehicle-treated TG mice at the age of 121 days (P= 0.0320; Figure 5B). However, the time taken to reach ALSTDI scale scores of 1–4 did not differ significantly between the ritanserin- and vehicle-treated TG mice (P> 0.05; Figure 5C–F). These results indicate that ritanserin does not accelerate the disease progression or shorten the survival time of the TG mice.
Granisetron, piboserod, and ritanserin increase the expression of TDP-43 and SOD1-G93A in the spinal cord of WT and TG mice
TDP-43 and SOD1-G93A were measured using Western blotting for both the WT and TG mice. The expression of both proteins was found to be higher in the TG mice than in the WT mice. It was also found that the expression of these proteins was significantly higher in the TG mice administered a 5-HT receptor antagonist compared with the vehicle-treated TG mice (granisetron:P= 0.0011,P= 0.0051, Figure 6A and D; piboserod:P= 0.0060,P= 0.0016, Figure 6B, and E; ritanserin:P= 0.0024,P= 0.0027, Figure 6C, and F). Granisetron was found to have the most pronounced effect on TDP-43 protein expression (Figure 6A), while piboserod had the most pronounced effect on SOD1-G93A expression (Figure 6E). Altogether, these data indicate that granisetron, piboserod, and ritanserin promote the expression of TDP-43 and SOD1-G93A.
Granisetron, piboserod, and ritanserin increase the number of TDP-43-positive cells in the spinal cord of WT and TG mice
Immunofluorescence staining was used to determine the number of TDP-43-positive cells in the spinal cord. In line with the Western blot results, it was found that the number of TDP-43-positive cells was higher in the TG mice than in the WT mice (P= 0.0002; Figure 7A and B). In addition, the TG mice in the 5-HT receptor antagonist groups had significantly higher numbers of TDP-43-positive cells compared with the vehicle-treated TG mice: granisetron (P= 0.0009; Figure 7A, and B), piboserod (P= 0.0142; Figure 7C and D), and ritanserin (P= 0.0139; Figure 7E and F). These results therefore support the finding that granisetron, piboserod, and ritanserin promote the expression of TDP-43.
Granisetron, piboserod, and ritanserin increase the cytoplasmic aggregation of TDP-43 in the spinal cord of TG mice
The immunofluorescence staining images were analyzed to determine the subcellular localization of TDP-43. It was found that the percentage of cells with TDP-43 in the cytoplasm was significantly higher in the TG mice compared with the WT mice (P= 0.0001; Figure 8A); this percentage was also significantly higher in the TG mice administered granisetron (P= 0.0003; Figure 8B), piboserod (P= 0.0087; Figure 8C), or ritanserin (P= 0.0130; Figure 8D) compared with the vehicle-treated TG mice. In contrast, the percentage of cells with TDP-43 in the nucleus was significantly lower in the TG mice administered granisetron (P= 0.0003; Figure 8E), piboserod (P= 0.0087; Figure 8F), or ritanserin (P= 0.0130; Figure 8G) compared with the vehicletreated TG mice. Together, these findings indicate that granisetron, piboserod, and ritanserin accelerate the abnormal distribution of TDP-43.
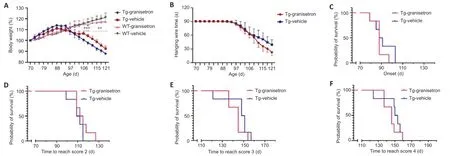
Figure 3|Effect of granisetron on the body weight, hanging wire test performance, and ALSTDI scores of SOD1*G93A TG and WT mice.
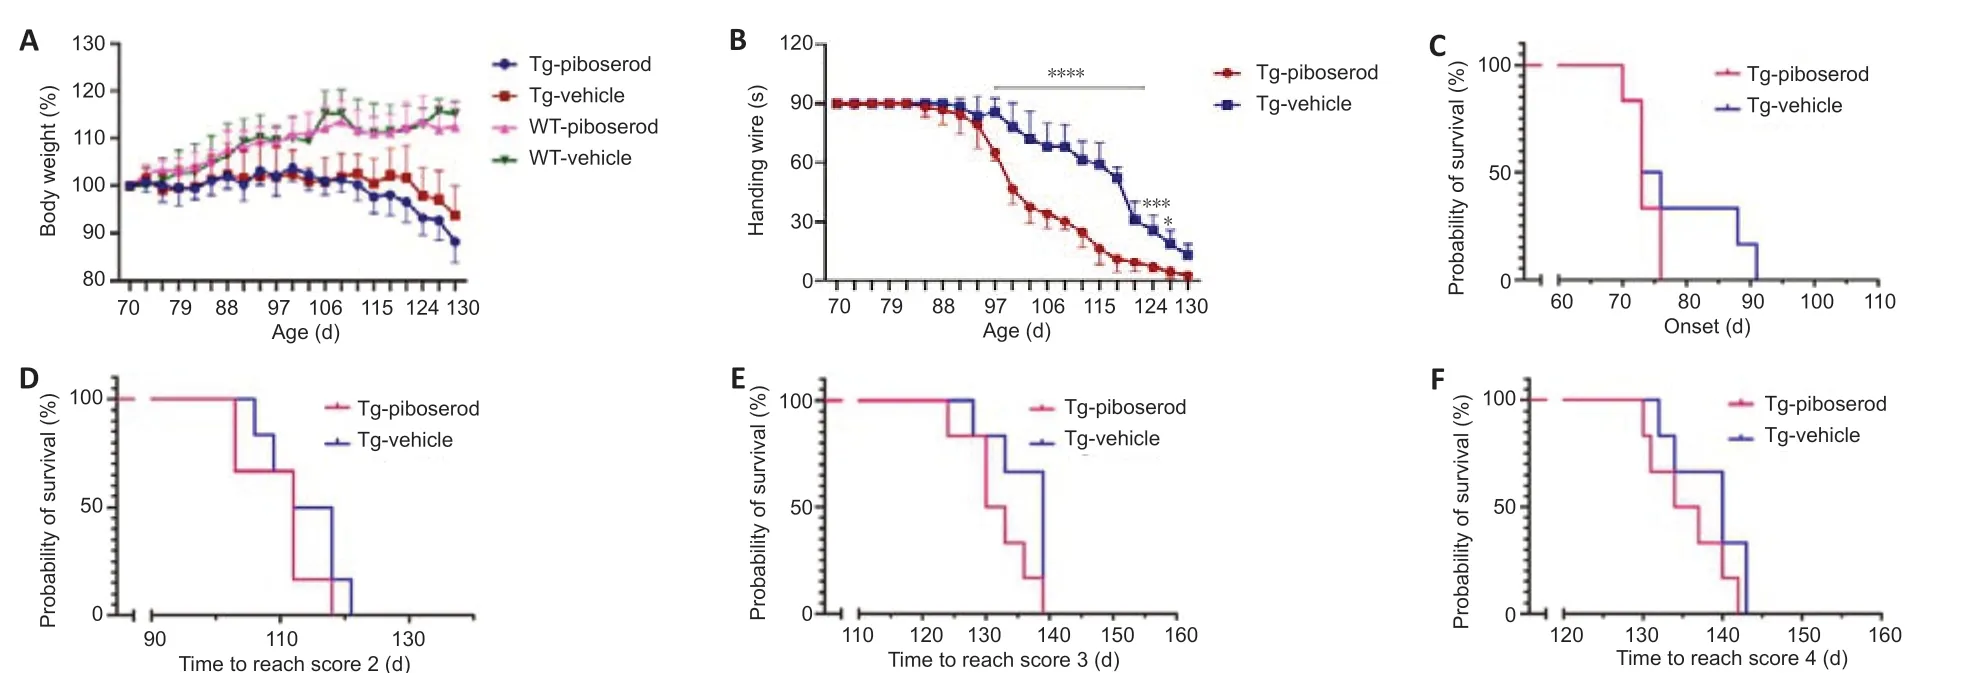
Figure 4|Effect of piboserod on the body weight, hanging wire test performance, and ALSTDI scores of SOD1*G93A TG and WT mice.

Figure 5|Effect of ritanserin on the body weight, hanging wire test performance, and ALSTDI scores of SOD1*G93A TG and WT mice.
Effects of granisetron on the astrocytes, microglia, and neurons in the TG mouse spinal cord
We examined the effects of granisetron on the spinal cord astrocytes (marked by GFAP), microglia (marked by IBA1), and neurons (marked by NeuN). We observed that the TG mice had more astrocytes in the anterior horn (AH), posterior horn (PH), and central canal (CC) compared with the WT mice (Figure 9A). The administration of granisetron was not found to affect the proliferation of astrocytes (GFAP fluorescent intensity) in the AH of the TG mice (P> 0.05; Figure 9B); however, there were more astrocytes in both the PH (P= 0.0010; Figure 9C) and the CC (P= 0.0012; Figure 9D) of the granisetron-treated TG mice. We found that the TG mice also had higher numbers of microglia in the AH, PH, and CC compared with the WT mice (Figure 9E). Granisetron was not found to affect the proliferation of microglia (IBA1 fluorescent intensity) in the AH or the PH (bothP> 0.05; Figure 9F and G) of the TG mice (compared with the vehicle-treated TG mice), but there was a significant increase in the number of microglia in the CC (P= 0.0016; Figure 9H). We found that there were fewer neurons in the AH, PH, and CC of the TG mice compared with the WT mice (Figure 9I). Granisetron was found to lower the number of neurons in both the AH (P= 0.0018; Figure 9J) and the CC (P= 0.0003; Figure 9L) of the TG mice compared with the vehicle-treated TG mice. However, there was no significant effect on the number of neurons in the PH (P> 0.05; Figure 9K). These results show that the administration of granisetron to TG mice led to an increase in the numbers of astrocytes and microglia, and a decrease in the number of neurons, in specific anatomical regions.
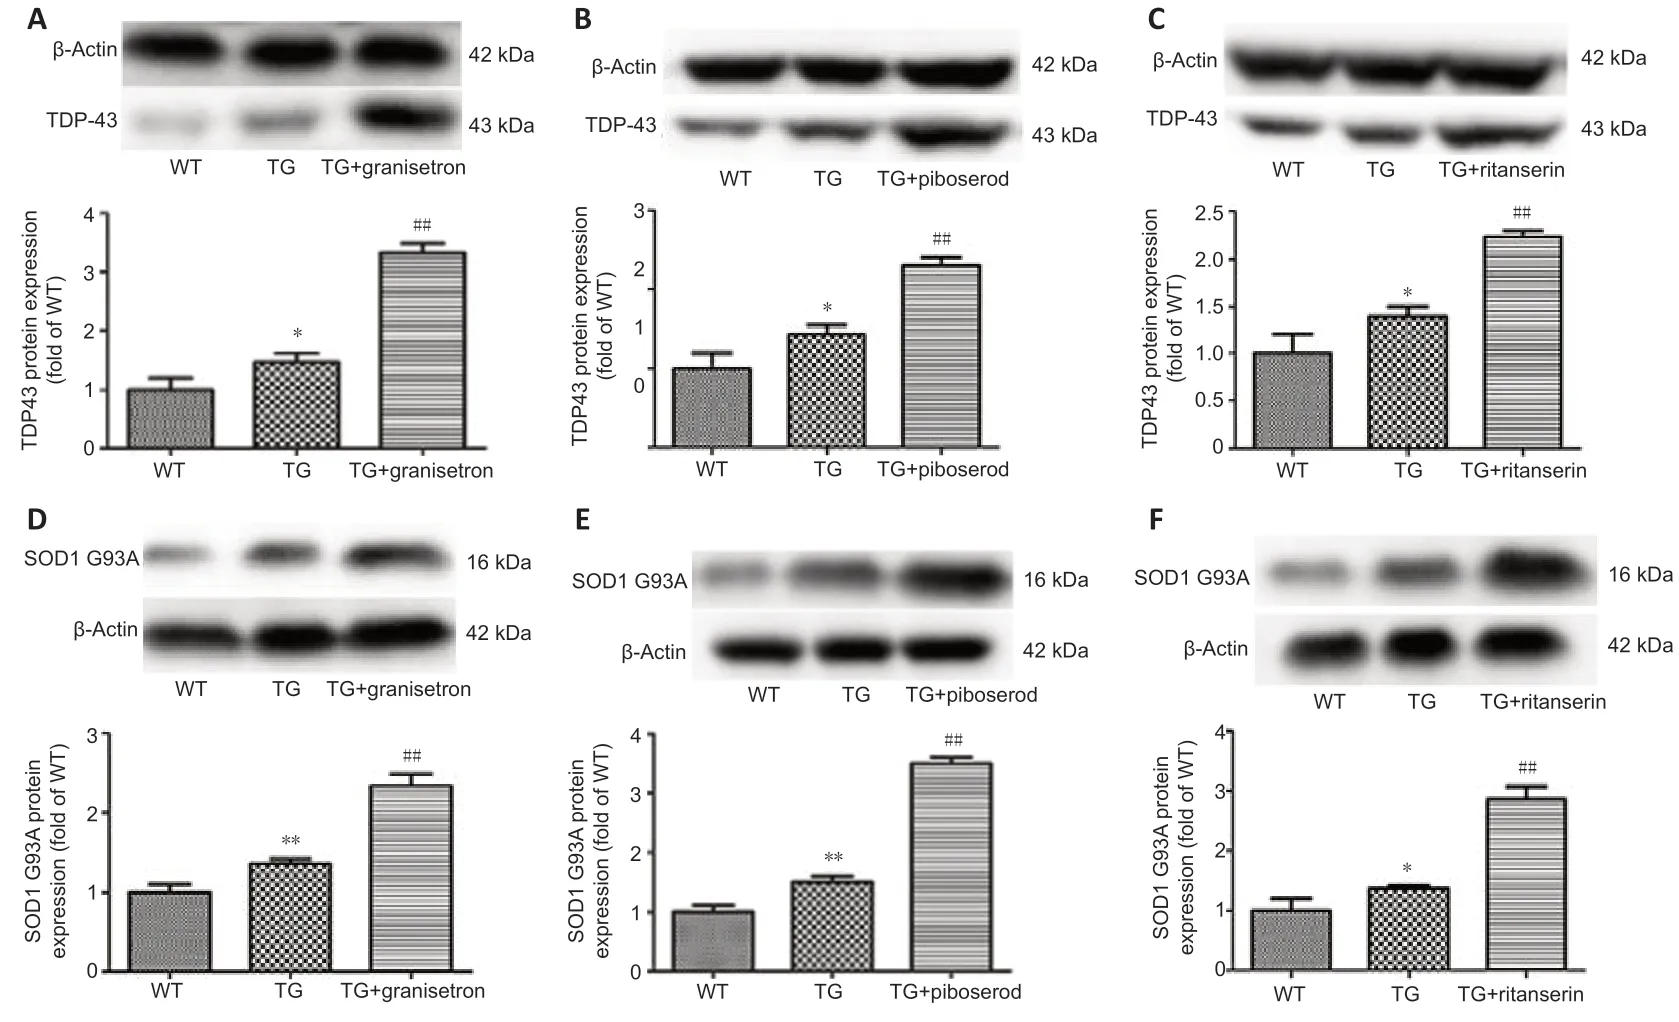
Figure 6|Effects of granisetron, piboserod, and ritanserin on the expression of TDP-43 and SOD1-G93A in SOD1*G93A TG and WT mice, detected using Western blotting.
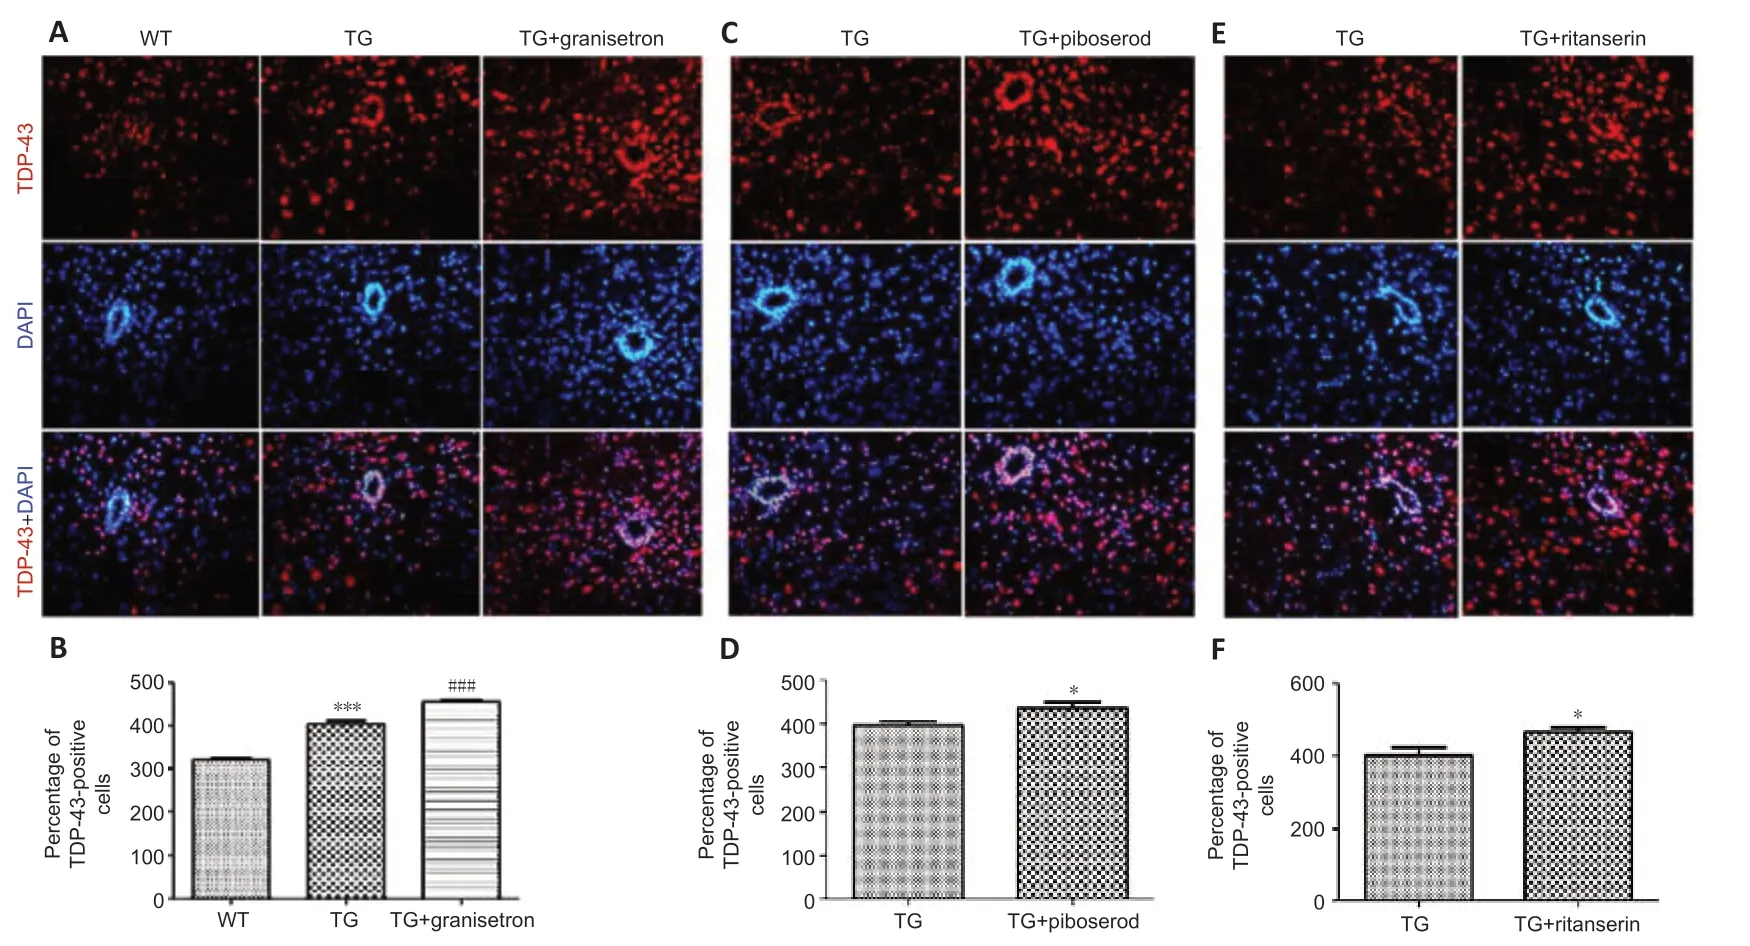
Figure 7|Effects of granisetron, piboserod, and ritanserin on the number of TDP-43-positive cells in the cervical segment of spinal cord in SOD1*G93A TG and WT mice.
Effects of piboserod on the astrocytes, microglia, and neurons in the TG mouse spinal cord
We examined the effects of piboserod on the astrocytes, microglia, and neurons in the spinal cord. We found that the number of astrocytes was higher in the AH, PH, and CC of the TG mice compared with the WT mice (Figure 10A). Piboserod did not significantly affect the astrocyte proliferation in the AH of the TG mice (P> 0.05; Figure 10B), but there was a significantly higher number of astrocytes in both the PH (P= 0.0004; Figure 10C) and the CC (P= 0.0005; Figure 10D). Higher number of microglia were also found in the AH, PH, and CC of the TG mice compared with the WT mice (Figure 10E). The TG mice administered piboserod were found to have more microglia in both the AH and the CC compared with the vehicle-treated TG mice (AH:P= 0.0011; CC:P= 0.0002; Figure 10F and H), but there was no significant difference in the PH (P> 0.05; Figure 10G). We found that there were fewer neurons in the AH, PH, and CC of the TG mice compared with the WT mice (Figure 10I). The administration of piboserod to the TG mice lowered the number of neurons in the AH (P= 0.0014; Figure 10J), PH (P= 0.0307; Figure 10K), and CC (P= 0.0007; Figure 10L), compared with the vehicle-treated TG mice. These results show that TG mice treated with piboserod had more astrocytes and microglia, and fewer neurons, in specific anatomical regions.
Effects of ritanserin on the astrocytes, microglia, and neurons in the TG mouse spinal cord
We examined the effects of ritanserin on the astrocytes, microglia, and neurons in the spinal cord. Our data showed that the TG mice had more astrocytes in the AH, PH, and CC compared with the WT mice (Figure 11A). Ritanserin did not significantly affect the number of astrocytes in the AH of the TG mice (P> 0.05; Figure 11B), but more astrocytes were found in the PH (P= 0.0001; Figure 11C) and the CC (P= 0.0001; Figure 11D) following the intervention. The TG mice also had more microglia in the AH, PH, and CC compared with the WT mice (Figure 11E). Ritanserin led to a significant increase in the number of microglia in the AH of the TG mice compared with the vehicle-treated TG mice (P= 0.0002; Figure 11F), but there was no significant difference in the PH or the CC (P> 0.05; Figure 11G and H). We found that the TG mice had fewer neurons in the AH, PH, and CC compared with the WT mice (Figure 11I). Ritanserin led to significantly lower number of neurons in the AH (P= 0.0152; Figure 11J), PH (P= 0.0075; Figure 11K), and CC (P= 0.0216; Figure 11L) of the TG mice compared with the vehicle-treated TG mice. These results show that the administration of ritanserin to TG mice increased the number of astrocytes and microglia, and decreased the number of neurons, in specific anatomical regions.

Figure 8|Effects of granisetron, piboserod, and ritanserin on the subcellular localization of TDP-43 in SOD1*G93A TG and WT mice.

Figure 9|Effects of granisetron on the astrocytes, microglia, and neurons of SOD1*G93A TG and WT mice.

Figure 10|Effects of piboserod on the astrocytes, microglia, and neurons of SOD1*G93A TG and WT mice.
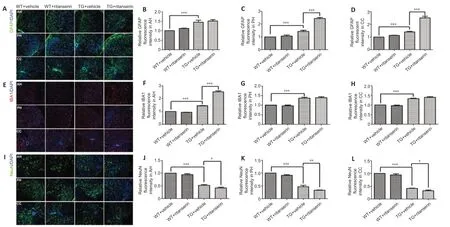
Figure 11|Effects of ritanserin on the astrocytes, microglia, and neurons of SOD1*G93A TG and WT mice.
Discussion
ALS is a devastating neurodegenerative disease that progresses rapidly. It causes serious harm to human health and afflicts both families and society. Neither the etiology nor the pathogeneses of ALS are currently understood (Holecek and Rokyta, 2018; Niccolai et al., 2021). However, previous studies have reported that 5-HT has some effects on ALS (Dupuis et al., 2010; Dentel et al., 2013). We carried out this study to further explore the potential relationship between 5-HT and ALS. This involved administering 5-HT receptor antagonists to TG mice (ALS mouse model) and WT mice. We found that 5-HT expression in the spinal cord was significantly lower in TG mice that had been through the different disease stages, as in ALS. We examined the effects of three different 5-HT receptor antagonists: ritanserin, granisetron, and piboserod. These were found to worsen the body weight loss or motor dysfunction in the TG mice, and they promoted the abnormal distribution and/or expression of TDP-43 and SOD1-G93A, which have been implicated in the pathogenesis of ALS. We also found that the 5-HT receptor antagonists significantly increased the number of astrocytes and microglia, and decreased the number of neurons, in specific anatomical regions of the TG mice (Additional Table 1). These results indicate that 5-HT antagonists can worsen the disease in a mouse model of ALS. We therefore speculate that 5-HT may play a protective role in ALS, and that this could be a potential therapeutic target.
A previous study showed that serotonergic neurons degenerate in ALS patients. This was also found in the nervous tissue of an ALS mouse model with human SOD1-G86R (Dentel et al., 2013). The results of our study are in line with these findings, as we found a 5-HT decrease in the TG mice (ALS mouse model), which may result from the degeneration of serotonergic neurons. Specifically, by using immunofluorescence staining, we showed that the expression of 5-HT was significantly reduced in the spinal cord of our TG mice. This 5-HT reduction could potentially trigger a mechanism that aggravates the disease. These findings indicate that pharmacological interventions for ALS could aim to increase the levels of 5-HT (Holecek and Rokyta, 2018).The neurotransmitter 5-HT, secreted by serotonergic neurons, is known to exert different functional effects by binding to different 5-HT receptor subtypes (Maeda et al., 1989). To investigate these effects in ALS, we administered several different 5-HT receptor antagonists, which target different receptor subtypes. We chose the 5-HT2 receptor antagonist, ritanserin; the 5-HT3 receptor antagonist, granisetron; and the 5-HT4 receptor antagonist, piboserod. We found that granisetron reduced the body weight of the TG mice, without significantly affecting the muscle strength or atrophy. In contrast, ritanserin and piboserod both weakened the muscles, but had no effect on body weight or muscle atrophy. In a previous study, it was found that 5-HT deficiency in SOD1-G86R mice led to a melanocortin deficiency, which affected the body weight (Vercruysse et al., 2016). Based on our results, we speculate that this weight loss in ALS mouse models may be caused by a 5-HT deficiency that affects the 5-HT3 receptors.
An important feature of the MN lesions in ALS is the mislocalization of TDP-43 from the MN nucleus to the cytoplasm where it forms abnormal aggregates (Suk and Rousseaux, 2020; Tziortzouda et al., 2021). The protein SOD1 is also abnormally distributed and/or structurally altered in ALS, and this has been found to increase the neural damage caused by oxidative stress (An et al., 2014; Zhang et al., 2019). Our study showed that the mislocalization of TDP-43 to the cytoplasm significantly increased following the administration of granisetron, piboserod, or ritanserin in TG mice, with granisetron having the strongest effect. In addition, the expression of the pathogenic protein SOD1-G93A increased, with piboserod having the most marked effect. Based on these results, we speculate that the SOD1-G93A protein aggregation in ALS might largely relate to reduced 5-HT4 receptor activation, while the cytoplasmic aggregation of TDP-43 might largely relate to reduced 5-HT3 receptor activation. Nevertheless, all three 5-HT receptor antagonists in our study increased the abnormal expression and distribution of SOD1-G93A and TDP-43 in the neurons of TG mice, thus worsening the abnormal protein aggregation.
Both astrocyte- and microglia-mediated neuroinflammation play a key role in ALS pathology (Liu and Wang, 2017). In our study, we found that ritanserin and granisetron mainly affected the number of astrocytes and had less effect on the microglia, while piboserod mainly affected the microglia with less effect on the astrocytes. This finding may relate to differences in the distribution of the three receptor subtypes (5-HT2, 5-HT3, and 5-HT4) on astrocytes and microglia. Our study also showed that both ritanserin and piboserod significantly reduced the number of neurons in the AH, PH, and CC of the spinal cord in TG mice, while granisetron reduced the number of neurons in the AH and CC, but not the PH. Based on these results, we speculate that 5-HT deficiency may damage neurons through astrocyte- and microglia-mediated neuroinflammation. Our findings indicate that the 5-HT2 (Mayer, 2003) and 5-HT3 receptors (Duggan and Curran, 2009) mainly modulate the activation of astrocytes, while the 5-HT4 receptor (Darblade et al., 2005) mainly affects microglia activation. These receptors could therefore be potential targets for pharmacological interventions designed to treat ALS, as their increased activation may limit the number of astrocytes and microglia, thus potentially reducing neuronal damage.
This study has some limitations. Firstly, we were unable to fully investigate the role of 5-HT in ALS, because we targeted just three of the seven 5-HT receptor subtypes. In addition, the drug dosage used was determined based on that used clinically; multiple doses were not tested. Also, off-target effects and potential alternative mechanisms were not examined. Another limitation is that our immunofluorescence and Western blot data only looked at whether there were greater or lesser the relative amounts of TDP43 and SOD1. This therefore limited our analysis of the effects of the 5-HT receptor antagonists on the disease pathology and progression. A further limitation is that the relative differences in the protein levels for the drug interventions were only indirectly related to performance on the hanging wire test. Also, we did not systematically examine the different forms and distributions of the protein aggregates, hyperubiquitination, hyperphosphorylation, or the cytoplasmic vs. nuclear localization of TD-P43 and SOD1 in both the normal and pathological states. Finally, we did not address the mechanisms underlying how granisetron, piboserod, and ritanserin were able to increase the expression of SOD1 and TDP43. To the best of our knowledge, this is currently unknown, but identifying the mechanisms involved would increase the value of our findings. Our study would also be improved if both male and female mice were included; here, we only studied male mice in order to avoid effects of sex hormones on the results.
In conclusion, our results indicate that 5-HT affects the pathology of ALS by acting on the 5-HT2, 5-HT3, and 5-HT4 receptors. By using three different 5-HT receptor antagonists in this study, we provide evidence that 5-HT reduces the production of abnormal SOD1-G93A and TDP-43 proteins in ALS, and prevents the activation of astrocytes and microglia through the 5-HT2, 5-HT3, and 5-HT4 receptors. Our study also indicates that 5-HT deficiency in ALS may lead to MN death and induce the abnormal expression and/or distribution of TDP-43 and SOD1-G93A. It may also activate both astrocytes and microglia via the 5-HT2, 5-HT3, and 5-HT4 receptors. 5-HT could therefore be a potential therapeutic target for ALS.
Acknowledgments:We were grateful to Prof. Dong-Yuan Yao (Neurology Institute of Jiangxi Province and Jiangxi Provincial People’s Hospital) for proofreading the manuscript.
Author contributions:Study design: SSJ, MNG, XZ, HBN, RSX; experiment implementation: SSJ, MNG, WC, WR, WZC; data collection and analysis: SSJ, MNG, WC, WR, WZC; manuscript draft: SSJ, MNG, WC, WR, RSX. All authors have read and approved the final version of the manuscript.
Conflicts of interest:The authors declare no competing financial interests.
Data availability statement:All relevant data are within the paper and its Additional files.
Open access statement:This is an open access journal, and articles are distributed under the terms of the Creative Commons AttributionNonCommercial-ShareAlike 4.0 License, which allows others to remix, tweak, and build upon the work non-commercially, as long as appropriate credit is given and the new creations are licensed under the identical terms.
Open peer reviewer:Suzanne Scarlata, Worcester Polytechnic Institute, USA.
Additional file:
Additional Table 1:The effects of granisetron, piboserod, and ritanserin on the SOD1*G93A transgenic mice.
- 中国神经再生研究(英文版)的其它文章
- Corrigendum
- Extracellular vesicles as a potential therapeutic for agerelated macular degeneration
- Survival of rat sciatic nerve segments preserved in storage solutions ex vivo assessed by novel electrophysiological and morphological criteria
- Fasting produces antidepressant-like effects via activating mammalian target of rapamycin complex 1 signaling pathway in ovariectomized mice
- Suppressing high mobility group box-1 release alleviates morphine tolerance via the adenosine 5'-monophosphate-activated protein kinase/heme oxygenase-1 pathway
- Transcriptional regulatory network during axonal regeneration of dorsal root ganglion neurons: laser-capture microdissection and deep sequencing

