Single-nuclei RNA sequencing uncovers heterogenous transcriptional signatures in Parkinson’s disease associated with nuclear receptor-related factor 1 defect
Piniel Alphayo Kambey , Wen-Ya Liu Jiao Wu Bakwatanisa Bosco, Iqra Nadeem Kouminin Kanwore Dian-Shuai Gao
Abstract Previous studies have found that deficiency in nuclear receptor-related factor 1 (Nurr1), which participates in the development, differentiation, survival, and degeneration of dopaminergic neurons, is associated with Parkinson’s disease, but the mechanism of action is perplexing. Here, we first ascertained the repercussion of knocking down Nurr1 by performing liquid chromatography coupled with tandem mass spectrometry. We found that 231 genes were highly expressed in dopaminergic neurons with Nurr1 deficiency, 14 of which were linked to the Parkinson’s disease pathway based on Kyoto Encyclopedia of Genes and Genomes analysis. To better understand how Nurr1 deficiency autonomously invokes the decline of dopaminergic neurons and elicits Parkinson’s disease symptoms, we performed single-nuclei RNA sequencing in a Nurr1 LV-shRNA mouse model. The results revealed cellular heterogeneity in the substantia nigra and a number of activated genes, the preponderance of which encode components of the major histocompatibility II complex. Cd74, H2-Ab1, H2-Aa, H2-Eb1, Lyz2, Mrc1, Slc6a3, Slc47a1, Ms4a4b, and Ptprc2 were the top 10 differentially expressed genes. Immunofluorescence staining showed that, after Nurr1 knockdown, the number of CD74-immunoreactive cells in mouse brain tissue was markedly increased. In addition, Cd74 expression was increased in a mouse model of Parkinson’s disease induced by treatment with 6-hydroxydopamine. Taken together, our results suggest that Nurr1 deficiency results in an increase in Cd74 expression, thereby leading to the destruction of dopaminergic neurons. These findings provide a potential therapeutic target for the treatment of Parkinson’s disease.
Key Words: 6-hydroxydopamine; dopaminergic neurons; dopamine transporter; nuclear receptor-related factor 1; Parkinson’s disease; proteomics analysis; Seurat clustering; single-nuclei RNA sequencing; substantia nigra; tyrosine hydroxylase
Introduction
Ten out of 107 individuals with hereditary Parkinson’s disease (PD) were reported to have two mutations in exon 1 of the nuclear receptor-related factor 1 (Nurr1) gene (Le et al., 2003).Nurr1(also referred to asNr4a2) is a member of the nuclear receptor superfamily and belongs to theNr4asubgroup.Nur77(Nr4a1) andNor1(Nr4a3) are the other two members of theNr4asubgroup, and their functions appear to differ markedly from that ofNurr1(Maxwell and Muscat, 2006; Chen et al., 2020b). Multiple studies have shown thatNurr1is required for the formation, division, preservation, and longevity of midbrain dopaminergic neurons, which are most impaired in the brains of individuals with PD (Kadkhodaei et al., 2009; Decressac et al., 2013; Rodríguez-Traver et al., 2016).
Nurr1appears to function as a transcriptional factor in the synthesis of classical markers of dopaminergic neurons, including tyrosine hydroxylase (TH), dopamine transporter (DAT), aromatic amino acid decarboxylase (AADC), and vesicular monoamine transporter (VMAT) (Jankovic et al., 2005; Kadkhodaei et al., 2009; Dong et al., 2016). The age-related decrease inNurr1expression in midbrain dopaminergic neurons has attracted researchers’ attention because it could explain the increased morbidity of PD in the elderly (Chu et al., 2002). Furthermore,Nurr1immunoreactivity is considerably lower in the substantia nigra of individuals who suffer from PD compared with healthy individuals (Balu et al., 2008). Multiple studies have shown thatNurr1is expressed at lower levels in postmortem brain samples (Chu et al., 2006) and peripheral blood samples (Liu et al., 2012; Lou and Liao, 2012; Montarolo et al., 2016; Ruiz-Sánchez et al., 2017; Li et al., 2018; Yang et al., 2019) from patients with PD. In line with these clinical findings, genetic ablation ofNurr1in mice results in a complete loss of dopaminergic neurons in the substantia nigra and ventral tegmental region, potentially leading to the death of newborn mice (Zetterström et al., 1997). Several dopaminergic neuron markers that are critical for the neurons of the nigrostriatal trajectory, such as TH, DAT, and AADC, are absent inNurr1-deficient animals (Chu et al., 2006; Kadkhodaei et al., 2009). Moreover, heterozygousNurr1-deficient animals exhibit greater vulnerability to the toxins 6-hydroxydopamine (6-OHDA) and 1-methyl-4-phenyl-1,2,3,6-tetrahydropyridine (Le et al., 1999).Nurr1conditional knockout mice mimic the early symptoms of PD, displaying a series of neuropathological changes such as a decrease in the number of striatal dopaminergic neurons and motor impairment, suggesting that they could be a useful model for studying PD (Kadkhodaei et al., 2013).
With recent technological advancements, single-cell/-nuclei RNA sequencing has emerged as a revolutionary technology that, in addition to cellular characterization (Papalexi and Satija, 2018; Abdelgawad et al., 2021) within specific microenvironments (Tikhonova et al., 2019; Gong et al., 2021), is critical in determining disease mechanisms (Chen et al., 2020c; Kim et al., 2021) as well as in drug discovery (Wu et al., 2017; Chen et al., 2020a) and drug repurposing (Xu et al., 2021). Here, we employed single-nuclei RNA sequencing to investigate howNurr1deficiency alone leads to dopaminergic neuron degeneration in PD.
Methods
Cell culture and Nurr1_shRNA lentiviral transient transfection
The immortalized dopaminergic MES23.5 cell line (RRID: CVCL_J351, Chinese Academy of Sciences, Shanghai, China), authenticated by short tandem repeat loci, was maintained at a density of 5 × 10⁴cells/mL in 25 cm2dishes (Corning, Acton, MA, USA) pre-coated with 25 mg/mL poly-D-lysine. In an incubator with 5% CO2at 37°C, cells were grown in Dulbecco’s modified Eagle medium/Nutrient Mixture F-12 (DMEM/F12) containing 10% fetal bovine serum (Atlas, Fort Collins, CO, USA) and 1% penicillin (Invitrogen, Carlsbad, CA, USA). Cells were grown to a minimum of 80% confluency before being passaged and were passaged 10 to 15 times to reach full maturity before being used in subsequent experiments. The mature cells were plated at a density of 5 × 10⁴cells/cm2on poly-L-lysine-coated six-well plates 24 hours before lentiviral transient transfection and then switched to serum-free DMEM/F12 (Gibco, Shanghai, China) overnight. Lipofectamine 2000 (Invitrogen) was used to carry out the transfections following the manufacturer’s instructions. Three different plasmids (LV-Nr4a2-mus-526, LV-Nr4a2-mus-667, and LV-Nr4a2-mus-787) (Genepharma, Suzhou, China) were used, and the one with the greatest knockdown effect was used for further experiments. Additional file 1 explains how the transfection was conducted; for the sake of simplicity, only the most effective knockdown plasmid (Genepharma) is shown. Briefly, after cells were grown in a six-well plate, they were fasted overnight by switching to serum-free DMEM/F12 (2 mL in each well). Subsequently, the lentivirus (50 µL) was added to every 1 mL of serum-free medium, according to the respective groups. This was followed by an immediate addition of lipofectamine (5 µL). The proportion of cells that exhibited green fluorescence as detected by a fluorescence microscope (BX51, Olympus, Tokyo, Japan) 72 hours after transfection was 90%. To screen for successfully transfected cells, the transfection mixture was removed and replaced with a fresh complete medium containing 8 µg/mL puromycin (ThermoFisher Scientific, Shanghai, China). Transfected cells were subsequently grown in puromycin-containing medium to maintain the plasmid.
Quantitative polymerase chain reaction
Briefly, each dish of cells was washed with phosphate-buffered saline (PBS, Dalian Meilun Biotechnology, Dalian, China), and 1 mL of TRIzol was added (Ambion-Life Science Technologies, Shanghai, China). Then, quantitative polymerase chain reaction was performed as we described previously (Kambey et al., 2021b; Additional file 1). The primers used wereNR4A2forward: 5′-GTG TTC AGG CGC AGT ATG G-3′, reverse: 5′-TGT ATT CTC CCG AAG AGT GGT AA-3′, and β-actin forward: 5′-ACG GCC AGG TCA TCA CTA TTG-3′, reverse: 5′-CAA GAA GGA AGG CTG GAA AAG A-3′.
Mass spectrometry
Immunoprecipitation
To determine the effects ofNurr1knockdown on neuron proteomics, we cultured MES23.5 cells and then divided them into two groups (Nurr1LV_shRNA andNurr1LV_Scramble), with three replicates each. Samples were gathered, and protein extraction was carried out as described earlier (Kaboord and Perr, 2008). Because the level ofNurr1enrichment in dopaminergic neurons appeared to be modest, we opted to undertake immunoprecipitation using magnetic beads (Medchemexpress, Shanghai, China) prior to performing tandem mass spectrometry (MS). Total protein was isolated from the samples and immunoprecipitated with aNurr1antibody (rabbit, 1:200, Abcam, Shanghai, China, Cat# ab41917, RRID: AB_776887) before trypsin digestion and processing for label-free quantification tandem MS, which are described in detail below.
Trypsin digestion
After washing the samples repeatedly with 200 µL of 1× PBS and centrifuging them at 12,000 ×gfor 10 minutes at 4°C, the supernatant was discarded. The samples were then resuspended in 100 µL of 50 mM NH4HCO3(Tianjin Chengyuan Chemical, Tianjin, China). Disulfide bonds were reduced by adding dithiothreitol (Chongqing Borning Chemical & Industrial, Chongqing, China) to a final concentration of 10 mM, and the mixture was incubated at 56°C for 1 hour. Iodoacetamide solution (Sigma, Shanghai, China) was added to final concentration of 50 mM, and the reaction was allowed to proceed for 40 minutes. Trypsin (Sigma, Shanghai, China) was added to the protein substrate at a mass ratio of 1:100, and the reaction was allowed to proceed at 37°C for 4 hours. Then, trypsin was added once more at a mass ratio of 1:100, and the mixture was digested for 16 hours at 37°C. The peptide was desalted using a self-filling desalting column after enzymatic digestion and dried in a vacuum centrifuge concentrator at 45°C. After dissolving the peptides in sample solution containing 0.1% formic acid and 2% acetonitrile (Sigma, Shanghai, China), the mixture was centrifuged at 4°C for 10 minutes with a full oscillating vortex at 13,200 ×g. The supernatants were then transferred to fresh sample tubes for MS analysis.
Label-free liquid chromatography coupled with tandem MS (LC-MS/MS)
High-pH reverse performance liquid chromatography was used to separate the peptides on an Agilent 300 Extend C18 column (Agilent Technologies, Santa Clara, CA, USA) with a particle size of 5 µm, an internal diameter of 4.6 mm, and a length of 250 mm. The process involved the following steps: At a pH value of 9, the peptide gradient ranged from 8% to 32% acetonitrile. Sixty components were separated over 60 minutes; the peptides were then concatenated into 14 components, which were dehydrated using a vacuum dryer to prepare for the following steps. After being dispersed in 0.1% formic acid (solvent A), the tryptic peptides were deposited directly onto a precolumn phase and then separated using a reversed-phase analytical column (Acclaim PepMap RSLC, Thermofisher Scientific, Waltham, MA, USA). The gradient consisted of a 26-minute increase from 6% to 23% solvent B (0.1% formic acid in 98% acetonitrile, Thermofisher Scientific, Waltham, MA, USA), an 8-minute increase from 23% to 35%, a 3-minute climb to 80%, and a final 3-minute hold at 80% (on an EASY-nLC 1000 ultra-performance liquid chromatography system at a constant flow rate of 500 nL/min). The peptides were subjected to nanospray ionization followed by ultra-performance liquid chromatography tandem mass spectrometry (MS/MS) using an internetconnected Q ExactiveTM Plus (Thermofisher Scientific, Waltham, MA, USA). The electrospray voltage used was 2.0 kV. For a comprehensive scan, the m/z range used was 350 to 1800, and whole peptides were identified at a resolution of 70,000 using an Orbitrap mass spectrometer (Thermofisher Scientific, Waltham, MA, USA). After the peptides were selected for MS/MS with a normalized collision energy value of 28, the fragments were identified by the Orbitrap spectrometer at a resolution of 17,500. A data-dependent approach in which one MS scan was followed by 20 MS/MS scans with 15.0-second dynamic exclusion was used. Automatic gain control was set at 5E4, and 100 m/z was assigned to the fixed initial mass.
LC-MS/MS data analysis
The MaxQuant search engine v1.5.2.8 (Max Planck Institute, Berlin, Germany) was used to process and analyze the data. The UniProt database (UniProt Consortium, 2021; Wang et al., 2021) was combined with a reverse decoy database to analyze the tandem MS/MS spectra. The other parameters were set and the final analysis was performed as described previously (Yu et al., 2021). The Clue gene ontology (ClueGO) plug-in for Cytoscape (Cytoscape Consortium, San Diego, CA, USA) was used to identify differentially expressed genes that may be associated with PD.
Animals
Owing to hormonal influences and the low body weight of female mice (Fillingim and Ness, 2000; Craft et al., 2004; Mogil and Chanda, 2005), only male mice were used in this study. Sixty-five C57BL/6J male mice aged 8 weeks, weighing 25–30 g, were supplied by the Animal Center of Xuzhou Medical University (license No. SYXK [Su] 2020-0048). For the first phase of the animal experiments, mice were divided into two groups:Nurr1knockdown (Nurr1LV_shRNA,n= 30) and control (Nurr1LV_Scramble,n= 20). In the second phase of the animal experiments (n= 15),Nurr1LV_shRNA was injected into the left side of the striatum (0.5 mm anterior- posterior, 1.5 mm lateral, 3.5 mm ventral to the dural surface), whileNurr1LV_Scramble was injected into the right side as the control (same brain coordinates). Animals (five mice in each cage) were provided with consistent meals and free access to water and maintained under a 12/12-hour light/dark cycle with controlled temperature (15–28°C), and humidity (40–65%) conditions. Animals were treated in accordance with the rules set by the Ethical Committee for the Use of Research Animals of Xuzhou Medical University (approval No. L20210226270, June 16, 2021). All experiments were designed and reported according to the Animal Research: Reporting ofIn VivoExperiments (ARRIVE) guidelines (Percie du Sert et al., 2020).
Stereotaxic injection of Nurr1 LV_shRNA
Nurr1LV_shRNA viral stock comprising 1 × 10⁶infectious viral units in a 200 µL volume was supplied by Santa Cruz Biotechnology (Dallas, TX, USA). These lentiviral particles, intended for use in gene silencing, were delivered as transduction-ready viral particles. The particles contained three to five expression constructs comprising a target-specific 19–25 nucleotide sequences plus hairpin yielding an shRNA designed to silence gene expression. Additional Figure 1 shows how theNurr1_shRNA plasmid was produced. After general anesthesia was induced by intraperitoneal injection of 45 mg/kg sodium pentobarbital (Sigma, St. Louis, MO, USA), mice were positioned within a stereotaxic apparatus (RWD, San Diego, CA, USA), and the bite bar was adjusted to a distance of 0 mm. After exposing the skull, a highspeed dental drill was used to create the burr hole. Twenty animals were injected with 7 µL ofNurr1LV_shRNA in the left striatum (0.5 mm anterior- posterior, 1.5 mm lateral, 3.5 mm ventral to the dural surface (Earls et al., 2019). The control group (20 mice) received 7 µL ofNurr1LV_Scramble (Santa Cruz Biotechnology, Dallas, TX, USA). The injection was delivered over 4 minutes using a Hamilton micro syringe with a capacity of 10 µL. The needle was then left in place for an additional 4 minutes, as described in a prior study (Aoi et al., 2000). TH immunoreactivity was used to confirm the degeneration of dopamine neurons after 4 weeks. To validate the activated genes after single nuclei-RNA sequencing, a second phase of lentiviral infusion (Nurr1LV_shRNA andNurr1LV_Scramble,n= 10) was performed, with the contralateral striatum used as a control.
Validation of activated genes identified by single-nuclei RNA sequencing in the PD mouse model
We established a PD mouse model as we described previously (Kambey et al., 2021b). In brief, 6-OHDA (Medchemexpress) was prepared (5 µg in 1 µL of 0.9% normal saline containing 0.2% ascorbic acid). Then, 2 µL of 6-OHDA was injected into the left striatum, and 2 µL of normal saline was injected into the right striatum of the same mouse to serve as a control (n= 15). The same brain coordinates were used for each injection, as described in more detail above. Four weeks later, quantitative polymerase chain reaction (qPCR) was performed. Briefly, the midbrain was extracted on ice and rapidly homogenized in 1 mL of TRIzol. The subsequent steps are shown in Additional file 1. The delta-delta Ct technique was used to analyze the results, and glyceraldehyde-3-phosphate dehydrogenase (Gapdh) mRNA was used as an internal reference. The following primers were used as:Gapdh, forward: 5′-CGG GGT CCC AGC TTA GGT TC-3′, reverse: 5′-GCC CAA TAC GGC CAA ATC CG-3′; Cd74, forward: 5′-AGT GCG ACG AGA ACG GTA AC-3′, reverse: 5′-CGT TGG GGA ACA CAC ACC A-3′.
Behavioral testing
Open field test
In the first week after stereotaxic surgery, six mice died (five from theNurr1knockdown group and one from the control group). The remaining animals (n= 34) were separated into two groups (controlversusexperimental) prior to performing the behavioral tests. To assess locomotion (in the mice that only received lentiviral infusion, in phase one of the animal experiments), the open field test was performed 4 weeks post-stereotaxic surgery. Locomotion analysis is one of the most well-established tests in rodents and is also the most standardized method for measuring motor function (Schwarting et al., 1993; Zhang et al., 2020). It can be carried out in an open or closed field. Mice were placed in the center of a 50 cm × 50 cm enclosure with 50 cm-high walls and given 10 minutes to explore. The center section was lit at 300 lx, and the amount of time spent in the central zone over 30 minutes was recorded. Having all four paws in the middle area was classified as entry into the central zone. The ANY-maze video-tracking system (Muromachi Kikai, Tokyo, Japan) was used to digitally record and analyze the animals’ behavior.
Elevated body swing test
Three weeks after lentiviral infusion/stereotaxic surgery (only for phase one of the animal experiments), the elevated body swing test was performed for both groups (Nurr1knockdown and control). The same test was repeated in the fourth and fifth weeks. The elevated body swing test is also referred to as the tail suspension test (Can et al., 2012), especially in studies conducted in mice to investigate antidepressants, in which immobility time rather than swing path direction is assessed. The same mice that were assessed in the open field test were subjected to the elevated body swing test. The elevated body swing test was carried out according to Borlongan & Sanberg’s original description (Borlongan and Sanberg, 1995) with minimal modifications. Each mouse was placed in a transparent cage measuring 36 cm × 19.5 cm × 18.5 cm and permitted to choose a comfortable position with all four of its paws on the ground. It was then elevated to around 10 cm from the bottom of the cage by the tip of the tail, and the direction of the first body swing was recorded. A body swing was defined as bending the upper body away from the vertical axis by more than 10° to either side. The animal was then replaced on the ground and allowed to adjust its position in preparation for the subsequent swing test. Each mouse was re-suspended once it was clearly balanced and showed no predilection for one side or the other. The test was carried out 20 times for each animal. If the animal did not start swinging, the base of its tail was gently tapped to encourage it to do so. To prevent affecting the direction of swings, the assessor alternated the hand used to pick up the mouse and where he stood in relation to the testing cage. Additionally, the test was carried out in an area that was free of any objects that could influence swing direction. The fraction of swings toward the right side was calculated. The number of initial head or upper body turns contralateral to the lesioned side was determined and standardized over 20 consecutive trials as follows: percentage of contralateral recovery = [1 – (lateral turning in 20 trials – 10)/10] × 100 (Borlongan and Sanberg, 1995; Henderson et al., 1999; Chang et al., 2003).
Western blot assay
Four weeks post-lentiviral infusion, western blotting was performed for dopaminergic neuron markers. First, 300 µL of a lysis buffer cocktail comprising radioimmunoprecipitation assay buffer (Medchemexpress) and phenylmethanesulfonyl fluoride inhibitor (Medchemexpress) in a 100:1 ratio was prepared and added to ice-cold cells or midbrain samples. The samples were homogenized for 30 minutes with vortexing every 5 minutes. The homogenates were then centrifuged at 4°C at 14,000 ×gfor 30 minutes. The supernatants were transferred to fresh 0.5 mL tubes and maintained on ice, and the pellets were discarded. A bicinchoninic acid kit (Medchemexpress) was used to determine the protein concentrations of the samples following the manufacturer’s instructions. The optical densities of the protein standards and samples were calculated. The protein concentrations of the samples were standardized using radioimmunoprecipitation assay buffer, and the samples were then boiled in loading buffer (a reducing agent) at 100°C for 10 minutes. Next, 20-µg protein samples were subjected to electrophoresis on a 10% polyacrylamide gel at a constant voltage of 80 V while the proteins migrated through the stacking gel, at which point the voltage was increased to 100 or 120 V for separation of the protein bands. The proteins were then electrotransferred (100 V, 1 hour) to nitrocellulose membranes. The membranes for 2 hours in Tris-buffered saline before incubation with primary antibodies to TH (rabbit, 1:500, Proteintech, Shanghai, China, Cat# 25859-1-AP, RRID: AB_2716568), DAT (mouse, 1:500, Novus Biologicals, Shanghai, China, Cat# H00006531-A01, RRID:AB_670572), glial cell linederived neurotrophic factor (GDNF) (rabbit, 1:1000, Abcam, Cat# ab18956, RRID:AB_2111379),Nurr1/NR4A2 (rabbit, 1:500, Proteintech, Cat# 10975-2-AP, RRID:AB_2153760), and β-actin (mouse, 1:2000, Santa Cruz Biotechnology, Shanghai, China, Cat# sc-47778 HRP, RRID:AB_2714189) overnight at 4°C. The membranes were then incubated for 6 hours at room temperature (25–32°C) and subsequently probed with appropriate secondary antibodies (goat anti-rabbit IgG H&L (HRP), 1:200, Abcam, Cat# ab6721, RRID: AB_955447, and goat anti-mouse IgG H&L (HRP), 1:200, Abcam, Cat# ab6789, RRID: AB_955439). Following the blotting process, the membranes were examined using a scanner (LI-COR Biotechnology, Lincoln, NE, USA) and an image analyzer (LI-COR Biotechnology, Lincoln, Nebraska, USA). The optical density of bands relative to β-actin bands was analyzed with ImageJ software (v1.52a, National Institute of Health, Bethesda, MD, USA) (Schneider et al., 2012).
Immunohistochemistry
Four weeks post-lentiviral infusion, immunohistochemistry was conducted as we described previously (Kambey et al., 2021b). The detailed protocol is provided in Additional file 1.
Immunofluorescence staining
Four weeks post-lentiviral infusion, immunofluorescence staining was performed. Following pentobarbital (45 mg/kg) anesthesia and cardiac perfusion (with 100 mL of PBS followed by 150 mL of cold 4% paraformaldehyde), the brains were harvested and post-fixed in 4% paraformaldehyde for an additional day before being cryoprotected in a solution of 20% (for 24 hours) and 30% (for 24 hours) sucrose in 0.1 M phosphate buffer at 4°C. Coronal brain sections (including the substantia nigra and other midbrain areas) were made at a thickness of 16 µm and air-dried overnight. The sections were then blocked for 2 hours at room temperature with 0.1% Triton X-100 and 10% normal goat serum diluted in 0.1 M phosphate buffer. TH andNurr1were detected by incubating sections with TH antibody (rabbit, 1:500, Proteintech, Cat# 25859-1-AP, RRID: AB_2716568 or mouse, 1:400, Santa Cruz Biotechnology, Dallas, TX, USA, Cat# SC-25269, RRID: AB_628422), andNurr1/NR4A2 polyclonal antibody (rabbit, 1:500, Proteintech, Cat# 10975-2-AP, RRID: AB_2153760) overnight at 4°C. After being thoroughly washed, the stained sections were incubated for 6 hours at room temperature with Alexa Fluor 488-conjugated AffiniPure goat anti-rabbit IgG (1:200, Jackson ImmunoResearch, Carlsbad, CA, USA, Cat# 111-545-003, RRID: AB_2338046). For double labeling for TH and CD74 orNurr1and CD74, midbrain sections were incubated overnight at 4°C with antibodies to TH (1:500) and CD74 (mouse, 1:500, Proteintech, Cat# 66390-1-Ig, RRID: AB_2881766) orNurr1(1:500) and CD74 (1:500). The slices were then probed for 6 hours at room temperature with Alexa Fluor 488-conjugated AffiniPure goat anti-rabbit IgG (1:200, Jackson ImmunoResearch Carlsbad, CA, USA, Cat# 111-545-003, RRID: AB_2338046) and Alexa Fluor 594-conjugated AffiniPure goat anti-mouse IgG (1:200, Jackson ImmunoResearch Carlsbad, CA, USA, Cat# 128-585-003, RRID: AB_2783778). 4′,6-Diamidino-2-phenylindole (DAPI) nuclear counterstain was applied for 15 minutes. The slides were mounted and examined under a fluorescence microscope. The immunoreactivity relative to the counterstain (DAPI) was assessed and reported.
Single-nuclei RNA sequencing
Nuclear isolation
Four weeks post-lentiviral infusion, the midbrain was harvested from five mice in each group for nuclear isolation. Nuclei were isolated using a slightly revised 10× Genomics® protocol (10× Genomics, Shanghai, China). Briefly, cold lysis buffer containing 10 mM Tris-HCl, 10 mM sodium chloride, 3 mM MgCl2and 0.1% Nonidet P40 (10× Genomics, Shanghai, China) was used to break up the tissues. Then, the suspension was filtered and centrifuged, and the supernatant was discarded. The pellets containing the nuclei were washed in “nuclei wash and resuspension buffer” containing 1× PBS, 1% bovine serum albumin, and 0.2 U/µL RNase inhibitor (10× Genomics, Shanghai, China), then filtered and centrifuged a second time. To isolate the nuclei, the pellets were first suspended in DAPI solution for 10 minutes. Then, a FACS Diva Cell Sorter (BD Biosciences, San Jose, CA, USA) was used to isolate single nuclei that were positive for DAPI.
Library generation and sequencing
A Chromium Next GEM Single Cell 3’ Kit v3.1 (10× Genomics, Pleasanton, CA, USA) was used to construct complementary DNA libraries from isolated nuclei. An Agilent 2100 Bioanalyzer System (Agilent Technologies) was used to assess complementary DNA quality, and sequencing was performed on an Illumina NovaSeq 6000-S2 apparatus (Illumina, San Diego, CA, USA).
Transcript quantification, filtration, and processing
To produce FASTQ files from the raw base call outputs, the mkfastq pipeline in Cell Ranger (10× Genomics, Pleasanton, USA) was used. Cell Ranger count pipeline v.3.0 (10× Genomics, Pleasanton, USA) was used to build a genebarcode unique molecular identifier (UMI) count matrix for each sample. We only included genes in the analysis that had at least one UMI count, and cells with fewer than 400 genes or with a mitochondrial UMI count greater than 10% were excluded. Ribosomal and mitochondrial genes were excluded. The processed UMI feature-barcode matrices constructed with Cell Ranger v2.3.4 (10× Genomics, Pleasanton, USA) were analyzed with the Seurat package using R software (Robert Gentleman and Ross Ihaka, Boston, MA, USA) (Satija et al., 2015; Hao et al., 2021).
Normalization, sample integration, and cell clustering
Samples were standardized using the “LogNormalize” technique (Booeshaghi and Pachter, 2021; Seth et al., 2022) to reduce cell-specific biases prior to downstream analyses. To perform multi-sample data integration, we used the weighted-nearest neighbor approach (Hao et al., 2021). This is the Satija task force’s most recent single-cell sequencing data integration technique for combining numerous single-cell samples. Using the Louvain algorithm, the normalized data were aggregated. UMAP (Uniform Manifold Approximation and Projection), a new fluid learning technique for dimensional reduction that consists of theoretical frameworks based on Riemann geometry and algebraic topology, was used to depict the cell clustering results. Using Seurat’s FindAllMarkers tool (https://www.rdocumentation.org/packages/Seurat/versions/4.0.5/topics/FindAllMarkers), we identified marker genes for each cluster.
SingleR (https://www.bioconductor.org/packages/release/bioc/html/SingleR.html), which is a novel computational technique for unbiased single-cell ribonucleic acid sequencing (scRNA-seq) cell type recognition that uses reference transcriptome datasets of pure cell types to determine the cell from which each individual cell originated, was used to annotate cell types (Mabbott et al., 2013; Grün et al., 2016; La Manno et al., 2016; Aran et al., 2019). Even when automatic cell annotation is employed, it is frequently necessary to perform manual annotation due to the inconsistencies that exist in the marker datasets and single-cell atlases that automated techniques rely on (Clarke et al., 2021). Thus, we supplemented the automated annotation with known cell markers based on the Labome (Tanapat, 2013), CellMarker (Zhang et al., 2019), and PanglaoDB (Franzén et al., 2019) databases.
Differential gene expression
A negative binomial test with a false discovery rate adjustedP-value of < 0.05 was performed in Seurat 4.0 (Rahul Satija, Lower Manhattan, NY, USA) to identify genes with a log fold enrichment of 0.25 that were found in at least 25% of the cluster’s cells. Briefly, the following parameters were taken into account: the proportion of genes expressed in the cell population, pct.1 or pct.2 > 0.25; expression multiple, avg log2FC > 0.25; andPval adj < 0.01, where pct.1 or pct.2 denotes the percentage of cells in which the gene was found in the first or second group, respectively. In this study, theNurr1LV_shRNA group and control group clusters were determined by differential marker gene expression analysis (FindAllMarkersfeature in Seurat), and differentially expressed genes between each cluster were then identified.
Functional analysis
Using Singleseqgset (https://github.com/arc85/singleseqgset) in Seurat, the differentially expressed genes were analyzed for gene ontology (GO) enrichment, Kyoto Encyclopedia of Genes and Genomes (KEGG) enrichment, and Reactome enrichment. The stratified GO layout was visualized with directed acyclic graphs (Aranguren et al., 2007; Textor et al., 2016). Singleseqgset is a package used to perform scRNA-seq data gene set enrichment analysis by applying a fundamental underlying statistics to calculate the enrichment of gene sets of interest across clusters (Zou et al., 2021).
Statistical analysis
Although sample sizes were not predetermined using statistical methods, our sample sizes are comparable to those reported in earlier publications (Zhang et al., 2022; Zhou et al., 2022). The analysis did not omit any animals or data points, and the assessors were not aware of the group assignments. GraphPad Prism version 9.0.0 for Windows (GraphPad Software, San Diego, CA, USA, www.graphpad.com) was employed for statistical analysis. Tukey’s multiple comparisons test preceded by one-way analysis of variance was used to compare multiple groups, whereas Student’st-test was used for comparisons between two groups. The data are presented as the mean ± standard deviation (SD).P< 0.05 was deemed statistically significant.
Results
Nurr1 knockdown reduces TH expression
TH is a well-known dopaminergic neuron marker (Mendez et al., 2005; Tian et al., 2008). To determine whetherNurr1is necessary for dopaminergic neuron survival, TH expression was analyzed afterNurr1knockdown. First, we sought to identify the plasmid that conferred the greatest level of knockdown. MES23.5 cells were transiently transfected with the three plasmids using LipofectamineTM2000. Fluorescence was evident after 72 hours, indicating that the transfection was successful. Additional file 1 explains how the transfection was conducted. For the sake of simplicity, only the most effective knockdown plasmid is shown. The knockdown efficiency of the plasmids was also determined by qPCR, which showed that LV-Nr4a2-mus-526 conferred the greatest level of knockdown (Figure 1A and B). The western blot results indicated thatNurr1expression was significantly lower in cells transfected with LV-Nr4a2-mus-526 compared with the control (P= 0.0487,t= 4.366,df= 2; Figure 1C and D). TH expression was markedly lower inNurr1knockdown cells compared with control cells (P= 0.0021,t= 21.95,df= 2; Figure 1E and F).
LC-MS/MS reveals up-regulated genes linked with PD
To identify changes in protein expression associated withNurr1knockdown and to determine whether these changes are associated with PD, labelfree quantitative LC-MS/MS proteomics analysis was carried out. A log2-transformed fold change (log2FC) of 1 or –1 and a false discovery rate value of 0.05 were used to define differentially expressed proteins. We found that 231 genes were upregulated, but no genes were downregulated, inNurr1knockdown cells compared with the control group (Additional Table 1). Using ClueGO, a Cytoscape plug-in that generates functionally structured GO category networks by combining GO terms with Kyoto Encyclopedia of Genes and Genomes (KEGG) pathways, we identified 14 differentially expressed genes (Ndufa9,Ndufa4,Ndufa2,Psmd12,Gnai3,Tubb4b,Sdhb,Psma6,Psmc3,Ndufs3,Uqcrfs1,Vdac1,Ndufv1, andSlc25a4) that were linked to the PD pathway (Figure 2). The majority of these genes are involved in key biological processes (Additional Figure 2).
Pathological effects of Nurr1 knockdown in a mouse model
Next, we first performedin vivobehavioral analyses to determine whetherNurr1knockdown recapitulates behavioral features of PD. The results indicated that there was a marked difference between theNurr1knockdown and control groups in the open field test. Unlike the control group, theNurr1knockdown group showed a significant difference between the number of clockwise and anticlockwise rotations (P= 0.0041,t= 3.287,df= 18; Figure 3A and B). In addition, animals in theNurr1knockdown group crossed the line fewer times than animals in the control group (P= 0.0006,t= 4.140,df= 18; Figure 3A and C). The elevated body swing test demonstrated a significantly lower degree of contralateral turning recovery in theNurr1knockdown group compared with the control group (P= 0.0001,t= 22.31,df= 12; Figure 3D).The methods used to assess TH andNurr1immunoreactivity in the striatum and perform double labeling of TH andNurr1in the substantia nigra are described in Additional file 1. The immunofluorescence staining results showed a noticeable decrease inNurr1+and TH+neurons in the substantia nigra, as indicated in Figure 4A and B, respectively, suggesting thatNurr1knockdown leads to dopaminergic neurons degeneration.
The decline in dopaminergic neuron numbers was assessed by western blotting of midbrain samples using dopaminergic neuron markers (TH and DAT). GDNF expression was also ascertained because it is regulated byNurr1(Decressac et al., 2012). In comparison to the control group, there was a significant reduction in the expression of these proteins in theNurr1knockdown group [TH (P= 0.0275,t= 3.392,df= 4), DAT (P= 0.0059,t= 5.336,df= 4),Nurr1(P= 0.0344,t= 3.153,df= 4), GDNF (P= 0.0119,t= 4.373,df= 4)] (Figure 5A–E).
Cellular heterogeneity in the substantia nigra following Nurr1 knockdown
To better understand how theNurr1deficiency alone causes a decline in dopaminergic neuron numbers and elicits PD-like symptoms, we performed single-nuclei RNA sequencing. We first established an animal model of PD by stereotactically injecting shRNA lentiviral particles into the left striatum. Four weeks later, dopamine neuron degeneration and Parkinsonism were confirmed by behavioral testing, western blotting, and immunohistochemistry. Midbrain samples were collected as we described earlier (Kambey et al., 2021b). Samples from five mice from the control group and five mice from theNurr1LV-shRNA group were enzymatically digested into singlecell suspensions before being sequenced individually on the 10× Genomics platform. Only genes that had at least one UMI count detected in at least one cell were included in the subsequent analysis. Cells that had fewer than 400 genes or more than 10% mitochondrial unique molecular identifier counts were excluded. After filtering the cells using the lowest and highest thresholds for nUMI, nGene, and mitochondrial RNA genes, 16,093 and 15,260 cells were obtained for the control andNurr1LV-shRNA groups, respectively. Similar results were obtained by comparing nUMI, nGene, and mitochondrial mRNA percentages (pMito) (Additional Figure 3). Batch effects among the samples were noticed and corrected. To normalize expression levels, we used the “LogNormalize” tool of the “Normalization” function, and we decreased variables by principal component analysis to reduce the dimensions of the analysis. Figure 6A shows the total number of cells in each cluster. Figure 6B depicts the distribution of cells on UMAP in each group. We used the Seurat feature of integrating data analyses from multiple conditions to categorize the cell types in all of the samples; that is, by using UMAP’s dimensionality reduction algorithm in conjunction with unsupervised cell clustering (Figure 6C). On the basis of the independently expressed unique transcriptional patterns, 22 cell clusters were identified using the Seurat clustering tool (Figure 6C). Differential gene expression was assessed for each cluster using the Wilcox algorithm to identify marker genes (Figure 6D). The 22 clusters were annotated into six clusters-dopaminergic neurons, GABAergic neurons, glutamatergic neurons, microglia, oligodendrocytes, and astrocytes-using SingleR supplemented with manual annotation. SingleR is a cutting-edge computational technique for impartial cell type detection in scRNA-seq that uses baseline transcriptomic datasets of pure cell types to separately identify the cell of origin of each individual cell (Aran et al., 2019; Figure 6E and F).

Figure 1|Nurr1 knockdown reduces TH expression.
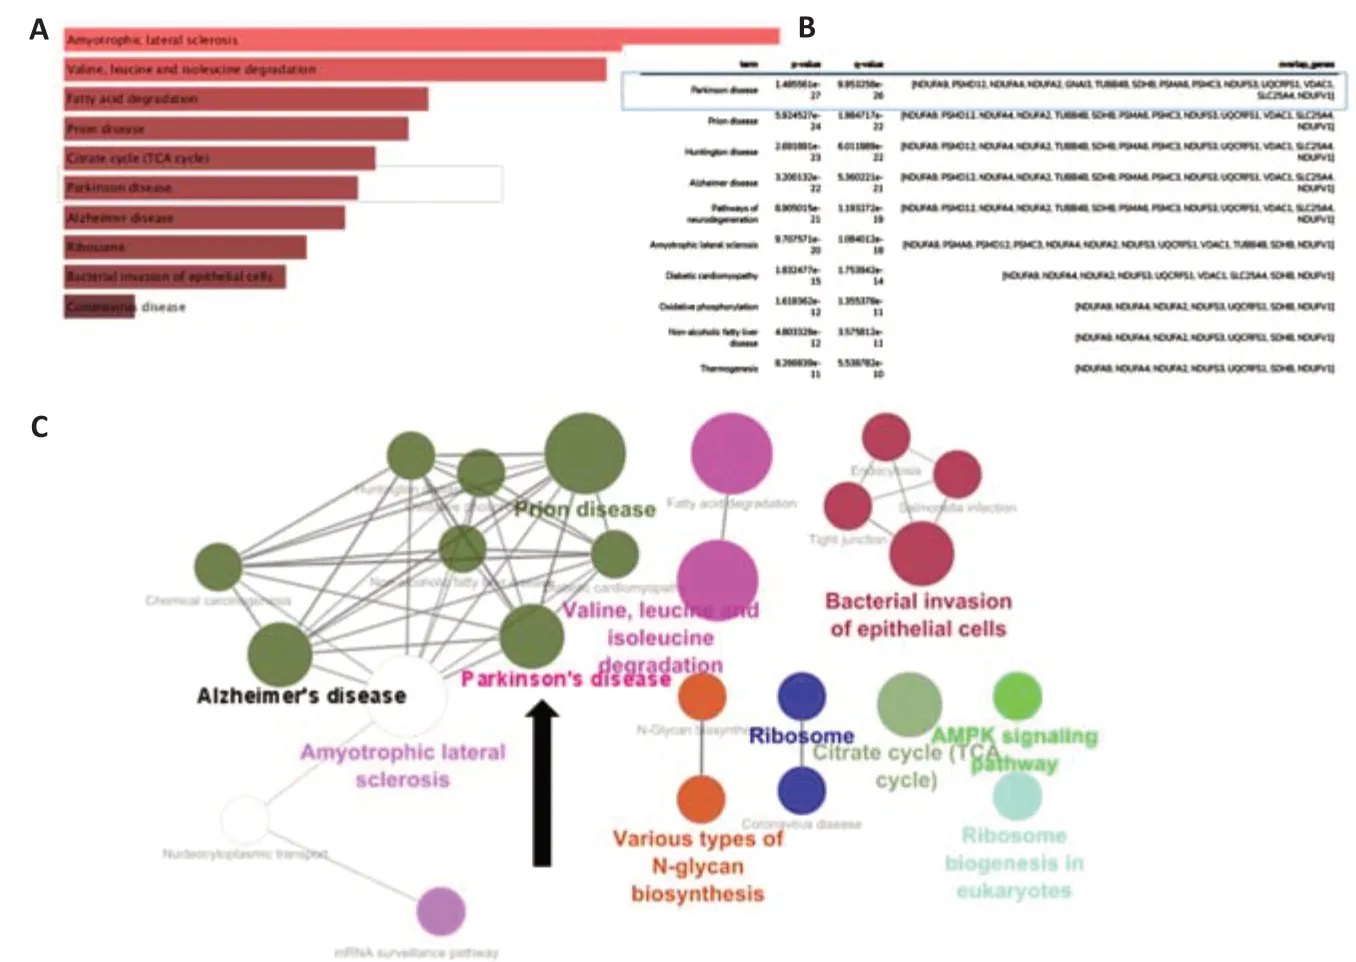
Figure 2|Immunoprecipitation followed by label-free quantitative LC-MS/MS proteomics analysis identified upregulated genes linked with Parkinson’s disease.

Figure 3|Behavioral analysis revealed marked alteration of locomotion and contralateral turning in Nurr1 knockdown mice relative to the control group.
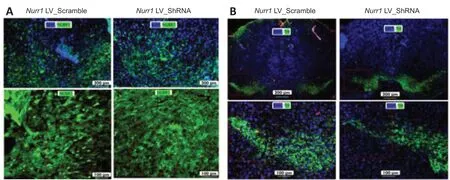
Figure 4|Nurr1 (A) and tyrosine hydroxylase (B) immunoreactivity.

Figure 5|Western blot assay reveals a decline in dopaminergic neuron marker expression in the Nurr1 knockdown group compared with the control group.
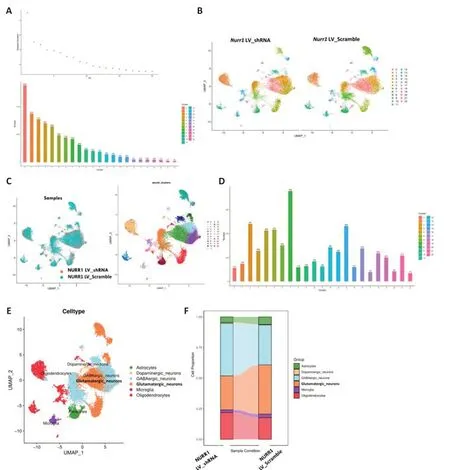
Figure 6|Cellular heterogeneity in the substantia nigra following silencing of the transcription factor Nurr1.
Single-nuclei RNA sequencing identified genes that are activated in the context of Nurr1 knockdown, the majority of which encode components of major histocompatibility II complex, suggesting a mechanistic basis for the role of Nurr1 deficiency in PD
Next, we sought to identify markers that were highly expressed across all clusters. Genes enriched in each cluster were identified using the Seurat package “FindAllMarkers” (Additional Table 2). Our analysis identified a number of genes previously not known to be associated with PD, the majority of which encode components of major histocompatibility complex II and were expressed at high levels inNurr1LV-shRNA samples.Cd74,H2-Ab1,H2-Aa,H2-Eb1,Lyz2,Mrc1,Slc47a1,Ms4a4b, andPtprc2were found in the oligodendrocyte cluster, and Slc6a3 was found in the dopaminergic neuron cluster. Table 1 shows the top 20 differentially expressed marker genes. A violin plot depicts the expression of these marker genes throughout the 22 cell clusters (Figure 7A and B). Figure 7C depicts the expression of these marker genes in several cell clusters using a UMAP approach. Among the top 10 genes, four interacting nodes were detected utilizing the “STRING” tool (Figure 7D). The majority of these genes are associated with the major histocompatibility complex II and encode proteins involved in antigen processing and presentation. According to SingleR analysis, which was augmented with manual cell annotation in Seurat, all of the top 10 markers identified for all of the clusters were overexpressed in the oligodendrocyte cluster (Table 1). For each of the five most significantly differentially expressed marker genes, we created a heatmap showing the levels of gene expression (Figure 7E). When pathway annotations were examined, the most significantly enriched pathway among all expressed marker genes was antigen processing and presentation (Figure 7F and Additional Table 3). Other pathways included cell adhesion molecules, allograft rejection, graft-versus-host disease, and many others. On the Gene Ontology Directed Acyclic Graph, most of the nodes are related to antigen processing and presentation (Figure 7G). GO biological process annotation of all marker genes found that the majority of the genes are involved in peptide antigen processing and presentation, antigen processing and presentation, and immune system processes, among other aspects (Additional Table 4).
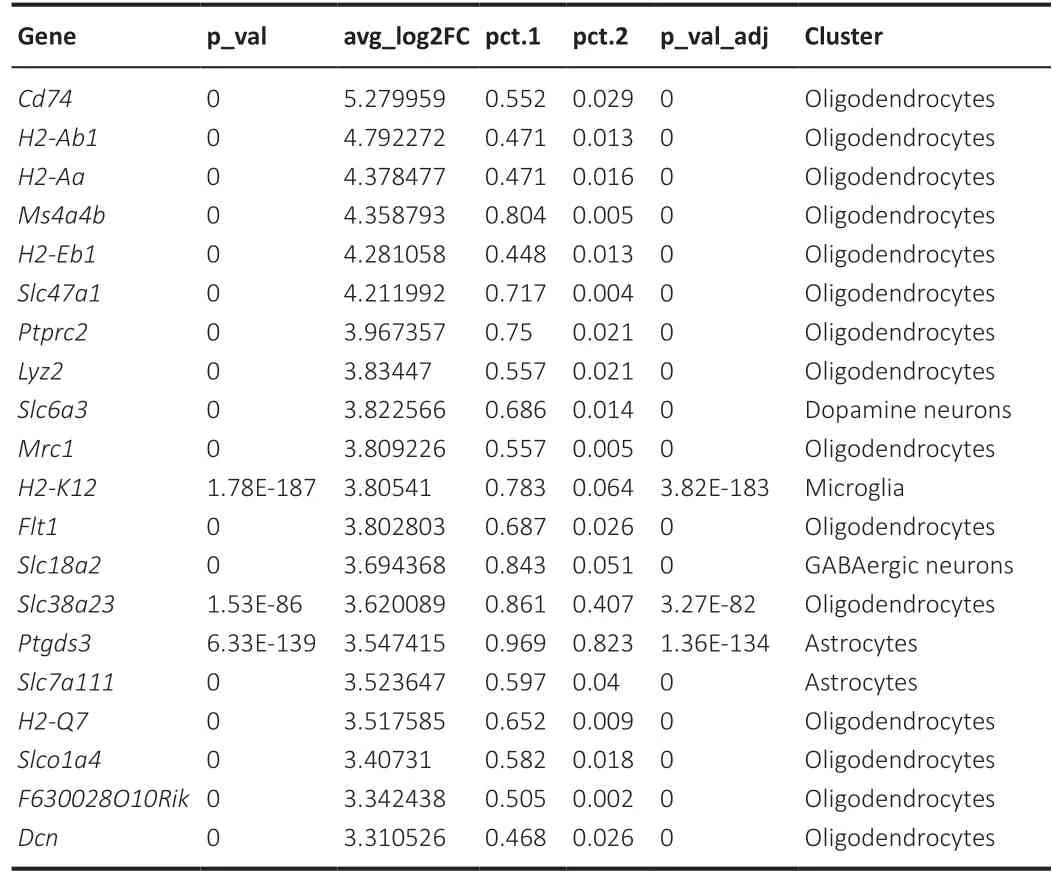
Table 1 |The top 20 differentially expressed marker genes
CD74 expression is elevated in Nurr1 knockdown mice
To ascertain whether CD74 expression is altered inNurr1knockdown mouse cells, we performed double immunofluorescence staining. This experiment was performed as part of the second phase of the study in whichNurr1LV_shRNA was injected into the left striatum of the mouse brain, while the right striatum was injected withNurr1LV_Scramble as a control (n= 10). Dual immunofluorescence analysis indicated that the elevated CD74 expression observed in theNurr1knockdown group relative to the control group corresponds to dopaminergic neuron degeneration, as indicated by a decrease in TH and Nurr1 immunoreactive neurons (Figure 8).
Cd74 expression is increased in a 6-OHDA-induced mouse model of PD
To confirm the above results in a PD mouse model, mouse brains were injected 6-OHDA for 4 weeks, after which the midbrain was removed and processed. Cd74 expression in the midbrain tissues was then assessed by qPCR. In comparison to the control side, which received injections of normal saline, there was a 1-fold increase in Cd74 mRNA expression in the tissues exposed to 6-OHDA (P= 0.0141,t= 2.871,df= 12; Figure 9).
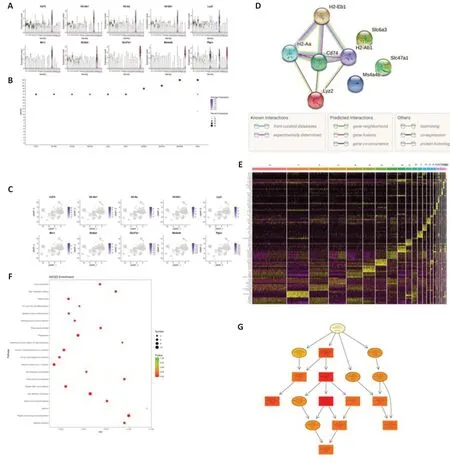
Figure 7|Single-nuclei RNA sequencing revealed activation of genes encoding components of major histocompatibility II complex, suggesting a possible mechanism for Nurr1 deficiency-related defects in Parkinson’s disease.
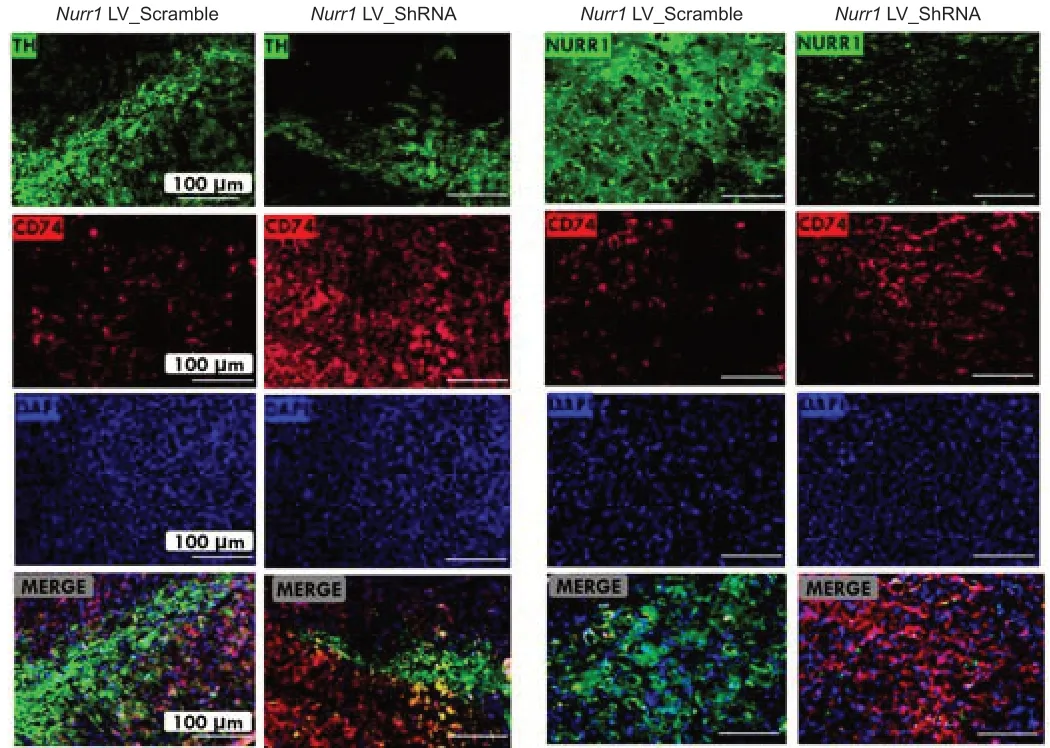
Figure 8|Dual immunofluorescence analysis of CD74 expression in the substantia nigra of a Nurr1 knockdown mouse model (n = 5).
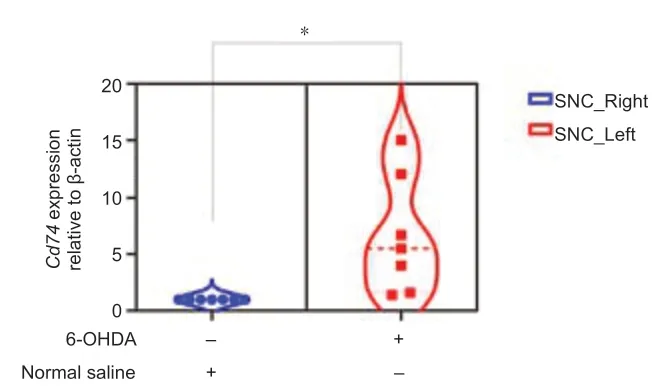
Figure 9|Elevated Cd74 mRNA expression in the substantia nigra of a 6-OHDAinduced model of Parkinson’s disease model as compared to the control side.
Discussion
A remarkable number of patients who have been diagnosed with PD exhibit decreased expression of the transcription factor Nurr1 (Chu et al., 2006; Liu et al., 2012; Li et al., 2018; Kambey et al., 2021a). The decrease in dopaminergic neurons manifested by diminished TH and dopamine transporter expression afterNurr1knockdown is consistent with findings from other studies, including studies in humans (Le et al., 1999, 2008; Chu et al., 2002, 2006). However, how doesNurr1knockdown affect dopaminergic neurons as well as non-neuronal cells? The first possibility is thatNurr1is expressed in nonneuronal cell types and thatNurr1mRNA is activated in macrophages by inflammatory stimuli such as lipopolysaccharide (Barish et al., 2005; Pei et al., 2005).Nurr1is expressed by a substantial number of glial cells, including Müller cells, the most common type of glial cell in the retina (Kubrusly et al., 2008). Another possibility could involve exosomes. Exosomes are extracellularvesicles produced by cells on a regular basis, with events such as cellular stress, cell signaling, and injury, influencing their release (Mathivanan et al., 2010). Meng et al. (2020) observed transfer of α-synuclein (α-syn) from neurons to astrocytes via exosomes, with consequent detrimental effects on astrocytes. They first investigated if exosomes generated from methamphetamine (METH)-treated neurons contain abnormal α-syn. Exosomes produced by METH-treated cells were found to carry pathogenic α-syn in both animal and cell line coculture models. Moreover, α-syn accumulation and inflammatory reactions were induced in primary cultured astrocytes by the presence of METH-exosomes in the medium. METH or α-syn decreasedNurr1expression and increased inflammatory cytokine levels in primary cultured astrocytes (Chen et al., 2020b; Meng et al., 2020). This may imply that the effects ofNurr1knockdown could be transferred from neuronal cells to glial cells via exosomes.
The discovery of genes responsible for PD fostered optimism that they could be used to develop new therapies (Sardi et al., 2018). Unfortunately, the journey from defective gene to new treatment option is often challenging because not all genes code for proteins, and the function of the encoded protein is not always fully understood. One strategy for addressing these issues is to infer the functional impact of gene variants by evaluating the proteins encoded by certain PD-associated genes. Proteomics approaches are being used to comprehend disease mechanisms and uncover biomarkers of disease (Chapman et al., 2014; Bracht et al., 2015). When it comes to studying potential disease-associated proteins, proteomics-based techniques deliver results that are objective, high-throughput, and quantitative (Cristea et al., 2004; Savage, 2015). In our study, we found elevated levels of genes encoding proteins that are associated with the PD pathway. This is in concordance with previously published studies. As an example, a substrate-specific proteomics study of PD showed that parkin, an E3 ubiquitin ligase implicated in PD, targets outer mitochondrial membrane proteins (Li and Cookson, 2019). In more recent work, IP followed by label-free quantitative MS linked leucinerich repeat kinase 2 to the wingless/integrated (WNT) signaling pathway (Salašová et al., 2017; Pellegrini et al., 2018). Similarly, proteomics analysis has provided new insights into Alzheimer’s disease etiology, allowing the identification of candidate biomarkers for future diagnostic and therapeutic approaches (Zhang et al., 2018).
Inflammatory responses are a significant component of all central nervous system (CNS) diseases, particularly neurodegenerative disorders. Using singlenuclei RNA technology, our discovery elucidated the previously unknown mechanism by whichNurr1knockdown causes dopaminergic neuron death in PD. We identified several upregulated (activated) genes, the majority of which encode components of major histocompatibility complex II; the top 10 upregulated genes wereCd74,H2-Ab1,H2-Aa,H2-Eb1,lyz2,Mrc1,Slc6a3,Slc47a1,Ms4a4b, andPtprc2. Unlike nonspecific neuroinflammatory agents like lipopolysaccharide (LPS),Nurr1deficiency is mechanistically linked to PD. A recent study that combined single-cell RNA sequencing with multicolor flow cytometry to profile microglia in the brains of mice injected with LPS found distinct profiles of activated microglia under inflammatory conditions that differ greatly from the proinflammatory profiles associated with neurodegenerative disease (Sousa et al., 2018). During PD progression, the brain’s resident macrophages become morphologically activated (Perry, 2012). Neuronal degeneration, whether induced by acute tissue injury or by a neurodegenerative condition that progresses over time, is correlated with activation of microglia, the resident macrophages in the brain. The microglia have been dubbed “pathology sensors” because they are extremely sensitive to all types of brain injury (Kreutzberg, 1996). When the brain is injured or affected by disease, microglia alter their morphology and begin to upregulate or express de novo a number of myeloid antigens (Perry, 2012). An important and intriguing aspect of our findings is that the highly activated genes were expressed in oligodendrocyte clusters. This is consistent with recent results from Errea and Rodriguez-Oroz (2021), lending validity to our findings. They published a human single-nuclei transcriptome atlas of the substantia nigra and discovered a strong link between PD susceptibility and oligodendrocytespecific gene regulation, implying that oligodendrocytes may play a causative role in PD (Errea and Rodriguez-Oroz, 2021). The role of Cd74 in the brain ailments has recently been explored and verified using scRNA-seq techniques that compared healthy brains and brains compromised by autoimmune disorders, neurodegeneration, or ischemia (Gosselin et al., 2017; Jordão et al., 2019). Moreover, Cd74 upregulation was recently observed in macrophages in the context of disease (Jordão et al., 2019). Our results regarding Cd74 expression in theNurr1knockdown model and an increase in Cd74 mRNA expression in a 6-OHDA-induced PD mouse model warrant further investigation.
To justify the relevance of major histocompatibility II-related genes in PD and other neurodegenerative disorders, Harms et al. (2013) used anin vivomouse model produced by viral overexpression of α-syn as well asin vitrosystems to investigate the role of the MHCII complex in α-syn-driven neuroinflammation and neurodegeneration. In an α-syn-induced rat model of PD, T cell infiltration and MHCII overexpression in microglia lead to accelerated neuronal degeneration (Subbarayan et al., 2020). Genetic studies have linked SNPs in the HLA-DR gene to sporadic late-onset PD (Hamza et al., 2010). Myriad studies have reported a link between PD and single-nucleotide polymorphisms in the MHC class II gene (Wissemann et al., 2013; Zhu et al., 2015; Chang et al., 2020), and mutation of the MHC class II gene results in similar symptoms to Alzheimer’s disease (Mattiace et al., 1990; Perlmutter et al., 1992). These studies suggest that the MCH II pathway is critical to neuroinflammation in PD.
A limitation of this study is that we did not target specific glial cells when exploring the mechanism by whichNurr1knockdown affects dopaminergic neurons.Nurr1affects dopaminergic neurons through glial cells (microglia, astrocytes, oligodendrocytes) (Jakaria et al., 2019; Oh et al., 2020). The use of cre and lox mice targeting specific cells, for exampleNurr1Cd11b-cre(deletion ofNurr1in microglia),Nurr1Oligo2-cre(deletion ofNurr1in oligodendrocytes), orNurr1Gfap-cre(deletion ofNurr1in astrocytes), would have probably provided a different picture of the effect ofNurr1deficiency on dopaminergic neurons. In conclusion, our findings demonstrate the mechanism forNurr1-deficiencybased disruption of dopaminergic neurons in PD and provide a potential target for future drug development.
Author contributions:In liaison with DSG, PAK serves as the investigative leader responsible for the development of study concepts and designs, experimental work, data analysis, and paper writing. WYL and JW contributed to data collection and analysis, BB contributed to the bio-informatics analysis. IQ and KK contributed to the write-up and proofread the final draft. The final manuscript was read and approved by all authors.
Conflicts of interest:The authors assert that they do not have any competing interests.
Data availability statement:All relevant data are within the paper and its Additional files.
Open access statement:This is an open access journal, and articles are distributed under the terms of the Creative Commons AttributionNonCommercial-ShareAlike 4.0 License, which allows others to remix, tweak, and build upon the work non-commercially, as long as appropriate credit is given and the new creations are licensed under the identical terms.
Open peer reviewer:Sergiu Groppa, University of Mainz, Germany.
Additional files:Additional file 1:Detailed in vitro, quantitative polymerase chain reaction, and immunohistochemistry experiments.
Additional file 2: Open peer review report 1.
Additional Figure 1: The mechanism on how the shRNA plasmid gene silencers were produced.
Additional Figure 2: The gene ontology of mass spectrometry (LC-MS/MS) results.
Additional Figure 3: Distribution of basic cell information in each sample before and after cell filtration.
Additional Table 1:Differentially expressed proteins on the label-free liquid chromatography coupled with tandem mass spectrometry (LC-MS/MS).
Additional Table 2:“FindAllMarkers” genes enrichment.
Additional Table 3:Pathway’s annotation.
Additional Table 4:The Gene Ontology biological process annotation function of all marker genes.
- 中国神经再生研究(英文版)的其它文章
- Mesenchymal stem cells, extracellular vesicles, and transcranial magnetic stimulation for ferroptosis after spinal cord injury
- Inducing prion protein shedding as a neuroprotective and regenerative approach in pathological conditions of the brain: from theory to facts
- Use of mesenchymal stem cell therapy in COVID-19 related strokes
- Brain organoids are new tool for drug screening of neurological diseases
- Emerging roles of astrocytes in blood-brain barrier disruption upon amyloid-beta insults in Alzheimer’s disease
- External anal sphincter electromyography in multiple system atrophy: implications for diagnosis, clinical correlations, and novel insights into prognosis

