
CFD-DEM modelling of suffusion in multi-layer soils with different fines contents and impermeable zones
2023-02-06 06:57PeiWANGYingGETuoWANGQiweiLIUShunxiangSONG
Pei WANG, Ying GE, Tuo WANG, Qi-wei LIU, Shun-xiang SONG
Research Article
CFD-DEM modelling of suffusion in multi-layer soils with different fines contents and impermeable zones

1Department of Civil and Environmental Engineering, The Hong Kong Polytechnic University, Kowloon, Hong Kong, China2College of Civil Engineering, Hunan University, Changsha 410082, China
Suffusion in broadly graded granular soils is caused by fluid flow and is a typical cause of geo-hazards. Previous studies of it have mainly focused on suffusion in homogeneous soil specimens. In this study, the coupled discrete element method (DEM) and computational fluid dynamics (CFD) approach is adopted to model suffusion in multi-layered soils with different fines contents, and soils with one or more impermeable zones. The parameters of the CFD-DEM model are first calibrated with the classic Ergun test and a good match with experiment is obtained. Then suffusion in multi-layered soils with different fines contents and impermeable zones is simulated and discussed. The simulation results show that, for soils with multiple layers, the cumulative eroded mass is mainly determined by the fines content of the bottom layer. In general, the higher the fines content of the bottom soil layer, the higher the cumulative eroded mass. In addition, suffusion is more severe if the fines content of the layer above is decreased. Impermeable zones inside soil specimens can increase the flow velocity around those zones, facilitating the migration of fine particles and intensifying suffusion.
Suffusion; Layered soils; Flow boundary; Impermeable zones; Computational fluid dynamics-discrete element method (CFD-DEM)
1 Introduction
Suffusion refers to the process in which fine particles are washed away and coarse particles remain in the soil. It often appears in widely graded or gap-graded soils subjected to the impact of fluid flow (Xiong et al., 2021b). The loss of fine particles may lead to a degradation in soil strength and increase the risk of geo-hazards such as landslide and debris flow. Suffusion has been considered as the major reason for half of all dam failures across the world since the 1900s (Foster et al., 2000; Yang et al., 2020). On the other hand, the migrated fine particles may cause clogging among skeleton soil particles, which reduces soil permeability and increases pore pressure, and imposes instability risks on surrounding structures (Yang et al., 2019b; Liu et al., 2021; Qian et al., 2021b). A better understanding of the factors influencing suffusion is key for geotechnical engineers for predicting and evaluating the serviceability and stability of structures.
In previous studies, extensive experiments have been conducted to study internal instability and critical hydraulic gradients for suffusion in soils. Different types of tests have been used, including crumb test (Emerson, 1967), jet erosion test (Hanson and Hunt, 2007), flume tests (Lyle and Smerdon, 1965; Ghebreiyessus et al., 1994), pinhole test (Sherard et al., 1976), and hole erosion test (Reddi et al., 2000). These experiments provide valuable data on the effects on fines contents and on hydraulic gradients for internal erosion in soils (Wan and Fell, 2004; Kakuturu and Reddi, 2006; Indraratna et al., 2011; Moffat et al., 2011). Considering its significant effect on the mechanical behavior of soils, various analytical models for quantifying the suffusion potential of gap-graded soil have been proposed (Kenney and Lau, 1985; Horikoshi and Takahashi, 2015; Yang et al., 2019a). Wen et al. (2021) investigated dynamic response of bilayered saturated porous media based on fractional thermoelastic theory.
In recent years, as the development of numerical simulation method (Bao et al., 2020; Jin et al., 2021; Yin et al., 2021), the coupled computational fluid dynamics-discrete element method (CFD-DEM) app roach has been widely used to investigate suffusion in soils from a microscopic perspective (Liu et al., 2020). For example, the effect of flow direction, fines content, confining pressure, and particle generation method have all been successfully analyzed through the CFD-DEM approach (Hu et al., 2020; Xiong et al., 2021b). Recently, Xie et al. (2021a) developed a smo othed volume distribution model (SVDM) to solve the fluid-particle interactions. In their study, the grid size approaches to, or is smaller than the particle diameter, which can accurately describe the liquid flow around particles. Cheng et al. (2018) proposed a semi-resolved CFD-DEM model for seepage-induced fine particle migration in gap-graded soils where the large particle is resolved by a resolved CFD-DEM method and the small particle is resolved by the conventional CFD-DEM method. Xiong et al. (2021a) investigated the effect of particle shape on suffusion by CFD-DEM modeling. Qian et al. (2021b) investigated the effect of particle angularity on suffusion of gap-graded soil using coupled CFD-DEM. Xie et al. (2021b) conducted a study of segregation and mixing characteristics under a bi-disperse solid-liquid fluidised bed by coupling CFD-DEM. Compared to models based on continuum mechanics (Yang et al., 2019a; Xie et al., 2020; Qian et al., 2021a), the advantage of this method lies in its ability to directly observe the migration of fine particles, to apply various boundary conditions, and to obtain and interpret the results of simulations easily (Wang T et al., 2022). To date, studies mainly focus on suffusion in homogeneous soil specimens with cubic or cylindrical shapes, without considering the heterogeneity of soils and complex boundary conditions. However, homogeneous soils are rare in real engineering practice, and suffusion in soils with heterogeneity may cause severe engineering problems, such as dewatering in excavation (Lyu et al., 2021), recharge during construction (Shen et al., 2021), groundwater inrush in tunnelling (Liu et al., 2018), and slurry diffusion in tunnelling (Liu et al., 2021a, 2021b), which have been unfortunately ignored in previous studies. In addition, the sediment layer often contains impermeable materials such as rocks, which may increase local flow velocity and generate severe erosion zones in their vicinity. At present, studies on these problems are not sufficient.
To fill the gap between current research and engineering practices on suffusion, this study will investigate the suffusion process in layered soils with complex boundary conditions, i.e., soil specimens with diff erent fines contents along the flow direction, with partially permeable boundary, and with impermeable zones. The study results reveal the influences of multi-layered soils with different fines contents and impermeable zones on the evolution of suffusion.
2 Benchmark of CFD-DEM coupling algorithm
Numerical simulations in this study are condu cted with PFC3D (Itasca, 2015) for the DEM part and OpenFOAM for the CFD part. PFC3D is one of the widely used commercial codes to investigate the beha vior of granular materials at different scales (Yin et al., 2020; Wang P et al., 2022), with the ability of coupling with other CFD solvers using TCP sockets. OpenFOAM is a widely used CFD software, which is able to model fluids by finite volume method (Jasak et al., 2007). The coupling between the two TCP sockets is to exchange the interaction forces between the particles and the fluid. The DEM software first solves the particle system and provides the porosity of CFD elements to OpenFOAM. The drag force, viscous force, and pressure gradient force will be averaged for each cell and then used for CFD computation. In each CFD step, the flow velocity and pressure are updated. The updated interaction forces acting on each particle are calculated in DEM software for the next loop of simulation. A detailed description of the coupling process can be found in (Hu et al., 2019). The governing equations are introduced as follows.
2.1 Governing equations
In the CFD-DEM coupling, the basic Navier-Stokes equations are modified to consider the interaction between particles and fluid:
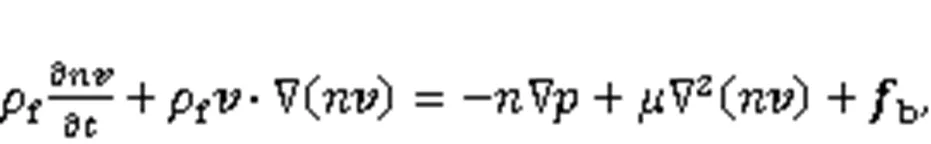
wherefis the density of the fluid,is the fluid pressure,is the dynamic viscosity of the fluid,is the flow velocity,is the porosity,is time, andbis the drag force per unit volume applied by the particles to the fluid in each fluid element.
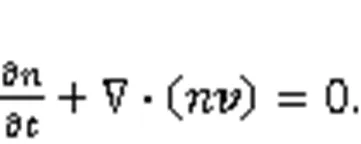
The equation is closed with a continuity equation that considers the porosity effect (Eq. (2)).
The magnitude of the drag force applied to a single particle was obtained by di Felice (1994) as follows:

The drag coefficient is defined as:
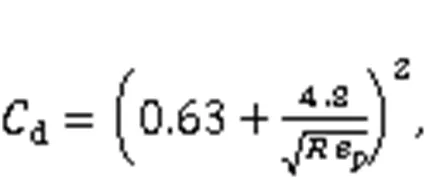
wherepis the particle Reynolds number, defined as:
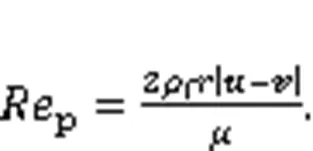
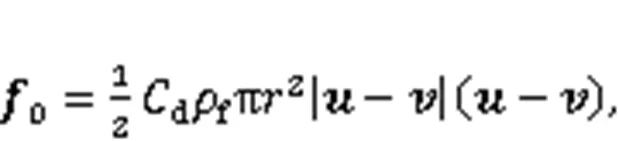
The drag force is defined as:
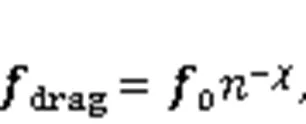
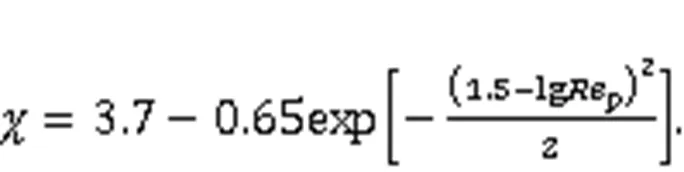
where the-χterm is an empirical factor to account for the local porosity. The empirical coefficientis defined as:
The particle-fluid interaction force includes a drag force and a pressure gradient force:
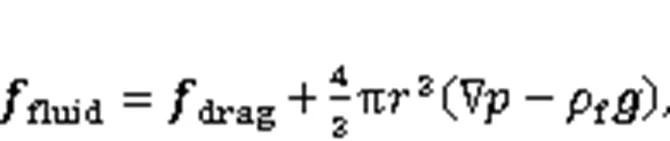
whereis the acceleration due to gravityThe pressure gradient term accounts for buoyancy if the hydrostatic gradient is part of the fluid pressure field. Sometimes the hydrostatic pressure gradient is omitted for numerical stability and the buoyancy forces are added explicitly. The body force per unit volume exerted on the fluid is:
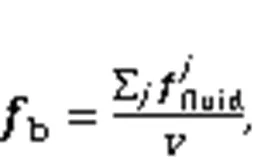
whereis the volume of the fluid element and the sum is over the particles which overlap the fluid element, andis the particles number in the fluid element.
The unresolved CFD-DEM method is widely used to solve fluid-particle coupling problems. The advantage of the method lies in its high computational efficiency and robustness. The use of the method in the field of suffusion has been verified in several studies, showing its ability to simulate the process of suffusion (Liu et al., 2020). The method requires a coarse mesh and generally the mesh size is more than three times the particle diameter. The main disadvantage of the method is that it cannot capture the fluid flow around the particle but, for suffusion analysis, this is less important when compared to other characteristics such as eroded mass and flow channel. Therefore, the method is adopted for this study.
2.2 Drop test
To validate the robustness of the CFD-DEM method, three drop tests are conducted and the results are compared with theoretical solutions (Eqs. (10) and (11)) (Zhao et al., 2014). In these tests, particles with radii of 0.0010, 0.0015, and 0.0020 m are set to drop from the top of a water-filled container with dimensions 0.3 m×0.3 m×0.6 m (Fig. 1a). Because of the resistance of the fluid, the particles will eventually fall at a terminal velocity relative to the fluid. The terminal velocity of the particles will be compared with the theoretical values to verify the accuracy of CFD-DEM method used in the study.
The parameters of particles and fluid are shown in Table 1, and are also used in the following simulations in the study. The linear contact model is employed to simulate the interaction between particles, which provides linear elastic behaviors in the normal and shear directions at the contact. The particle density and friction coefficient are 2500 kg/m3and 0.3, respectively, which are consistent with the characteristics of conventional sand. The normal stiffness controls the overlap between particles, and a value of 1.5×10⁶ensures that the overlap is much smaller than the particle size. A similar friction coefficient was used in previous studies (Yin et al., 2020; Wang P et al., 2022). For a particle at its terminal velocity, the force balance equation is given as
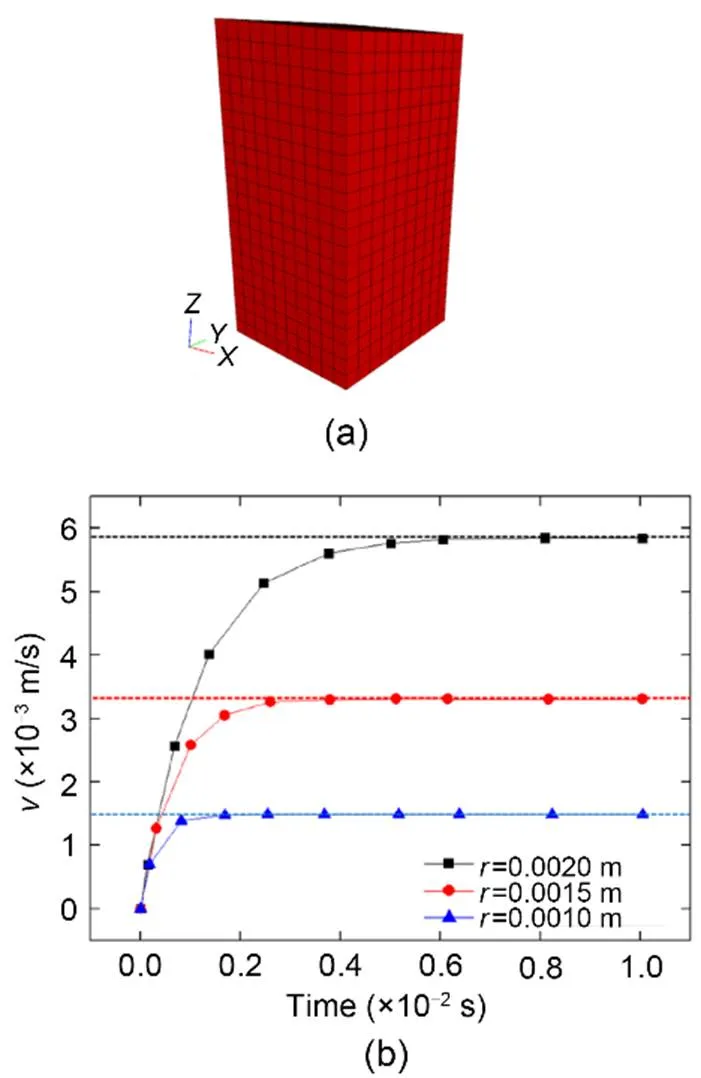
Fig. 1 Schematic diagram of the drop test (a); variation of particle velocities and theoretical values (dashed line) (b)
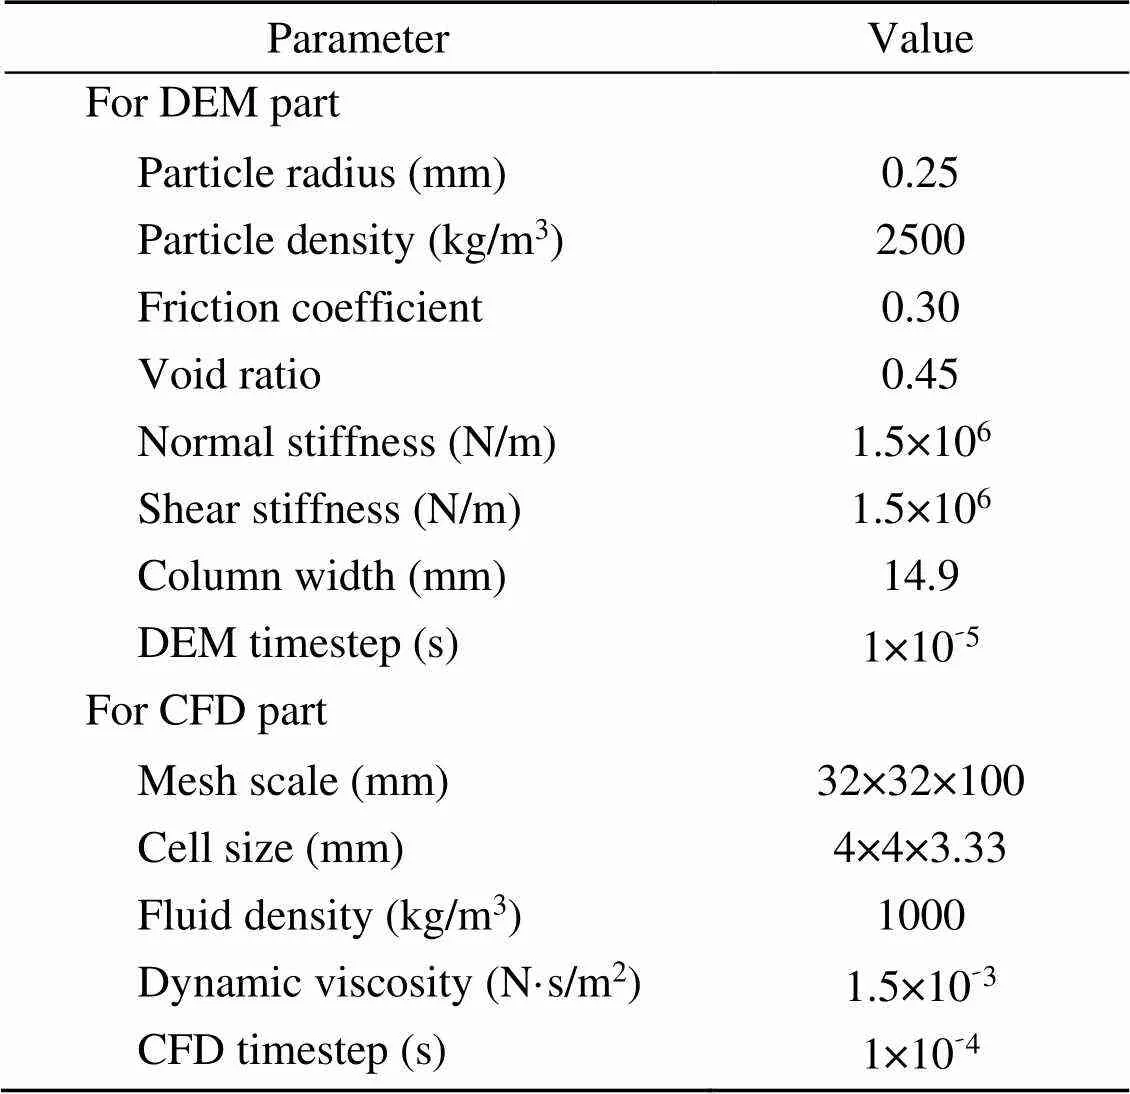
Table 1 Parameters of the test
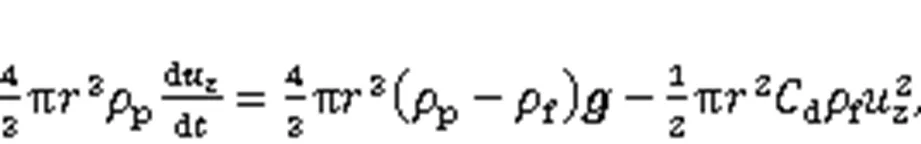
wherezis the relative velocity between the considered particle and the fluid, andpis the density of the particle.
When the fluid is static, the terminal velocity (z) of the spherical particle in the water is:
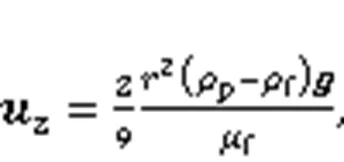
The evolution process of velocities of three particles with different diameters in drop tests is shown in Fig. 1b. The results indicate that a good agreement is observed (Fig. 1b), confirming the accuracy of the coupling method.
2.3 Ergun test

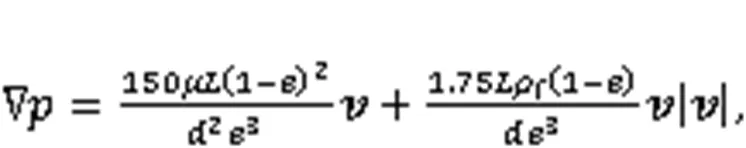
whereis the height of the particle bed,is the particle diameter, andis the void ratio.
The main steps in the Ergun test are as follows:
1. DEM model setup: a box with dimensions of 25.0 mm×25.0 mm×15.6 mm is first created. An assembly of particles with a void ratio of 0.45 and particles with a diameter of 0.5 mm is generated at the bottom of the domain.
2. CFD model generation: a CFD model with dimensions of 32 mm×32 mm×100 mm is generated in OpenFOAM, providing a constant flow velocity at the bottom.
3. Ergun test: different velocities for fluid flow at the bottom are applied and the pressure drops with different velocities are measured.
The CFD-DEM of the Ergun test is shown in Fig. 2. The element size for CFD simulations is around four times the mean particle size in DEM, following the requirement of the coarse grid CFD-DEM approach (Liu et al., 2020). A comparison between the CFD-DEM simulation results and the analytical solution is shown in Fig. 3. It shows a very good match and indicates that the proposed CFD-DEM model can accurately capture the behavior of particles and fluid flow.
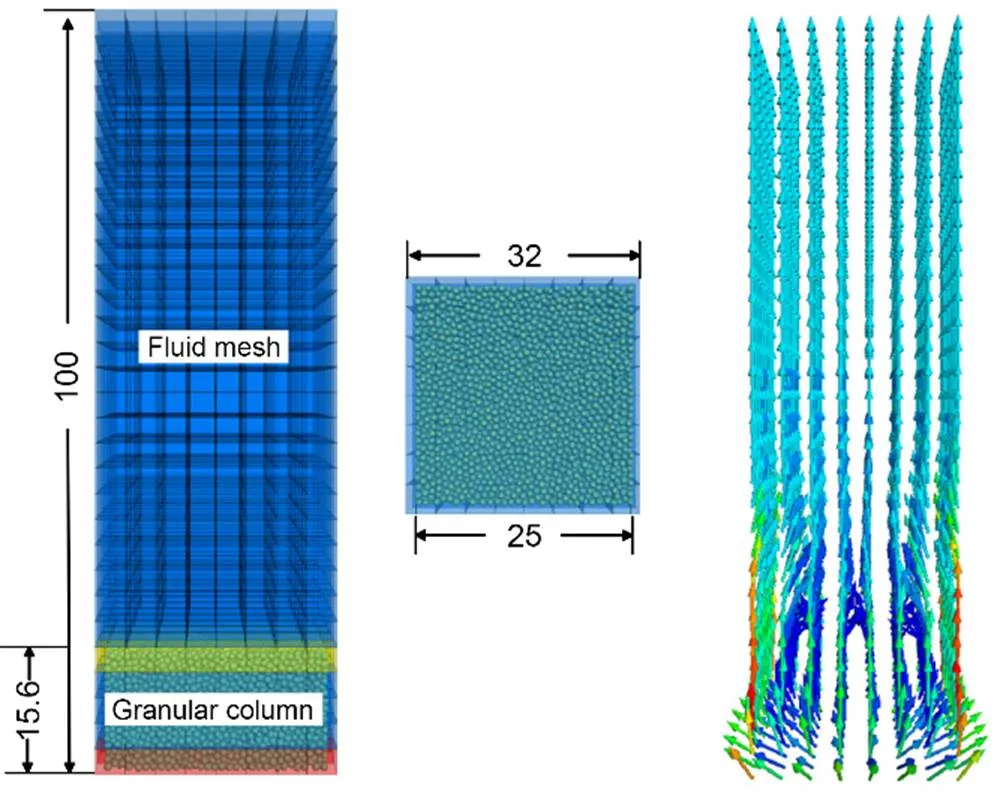
Fig. 2 CFD-DEM model of Ergun test (unit: mm)
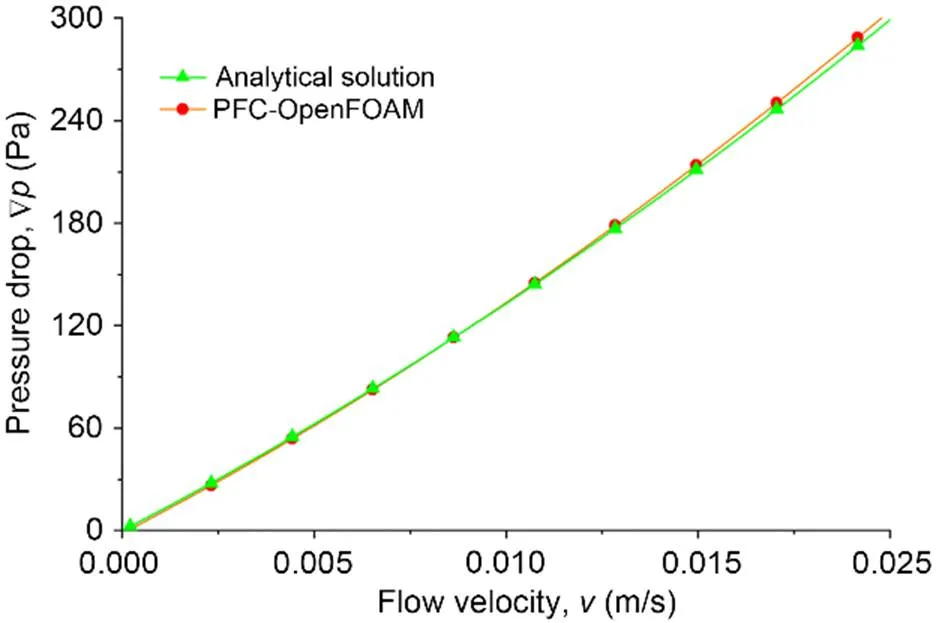
Fig. 3 Comparison between the CFD-DEM simulation results and the analytical solution of the Ergun test
3 Suffusion in multi-layered soil specimens
3.1 CFD-DEM model for multi-layered soils
In actual geotechnical practice, it is more common to see multi-layered soils rather than single-layered ones. It is therefore essential to take the variation in soil properties into consideration in suffusion analysis. One of the most important influencing factors of suffusion is the initial fines content, which is defined as the weight of fine particles over the total weight of soils (Chang and Zhang, 2013). Therefore, the effect of multi-layered soils, characterized as soils with different fines contents in DEM, is investigated in this section.
Two kinds of soils with fines contents (FC) res‑ pectively equal to 15% and 35% are adopted in this study, and their cumulative particle size distributions are shown in Fig. 4. There are six soil specimens with different fine contents along the flow direction, which are named as FC15, FC35, FC15B-FC35T, FC15T-FC35B, FC15TB-FC35M, and FC15M-FC35TB (T, M, and B in the numbering refer to the top, middle, and bottom, respectively), as shown in Fig. 5. The size of the DEM model is 13 mm×13 mm×26 mm, while the CFD domain has a larger dimension of 13 mm×13 mm×52 mm with a grid size of 6.5 mm×6.5 mm×6.5 mm (i.e., 32 elements), so that both the soil specimen and the eroded particles will be included in the CFD domain. The validated parameters in Table 1 are also used for this study. Particles are generated according to the given grain size distribution and initial void ratio within the given size range. During the generation, large particles are generated first to form the skeleton, and then fine particles are randomly generated within the voids among the larger particles. The diameters of coarse and fine particles are respectively 2.0 and 0.5 mm, resulting in a size ratio of 4, which is, according to Kenney and Lau (1985), not stable and is erodible. Depending on the fines content, the number of particles in the six soil specimens ranges from 30652 to 68662. The simulation takes 75 to 180 h on a computer with Intel I7 processor and 128 gigabytes of memory, depending on the total number of particles. After all the particles are generated, the soil specimen is consolidated with an isotropic pressure of 100 kPa, and the consolidation stops when the specimen reaches equilibrium. During the simulation, a constant pressure of 100 kPa is applied at the top of the sample. In the next stage, the wall at the bottom is replaced by a filter wall with square holes of 0.875 mm×0.875 mm on it. The size of holes is larger than that of the fine particles but smaller than that of the coarse ones to make sure that only fine particles will be eroded. Then the DEM model is coupled with the CFD model, and a fixed flow velocity of 0.01 m/s is applied to the top of the CFD model. The outlet hydraulic gradient is set as zero and other boundaries are impermeable with no fluid flux passing through. The coupling calculation lasts 18 s during which fluid from the top flows towards the bottom and imposes a drag force on the particles. During the erosion process, the eroded particles at the bottom are collected, and the particle displacement, velocity, and force chains are recorded.
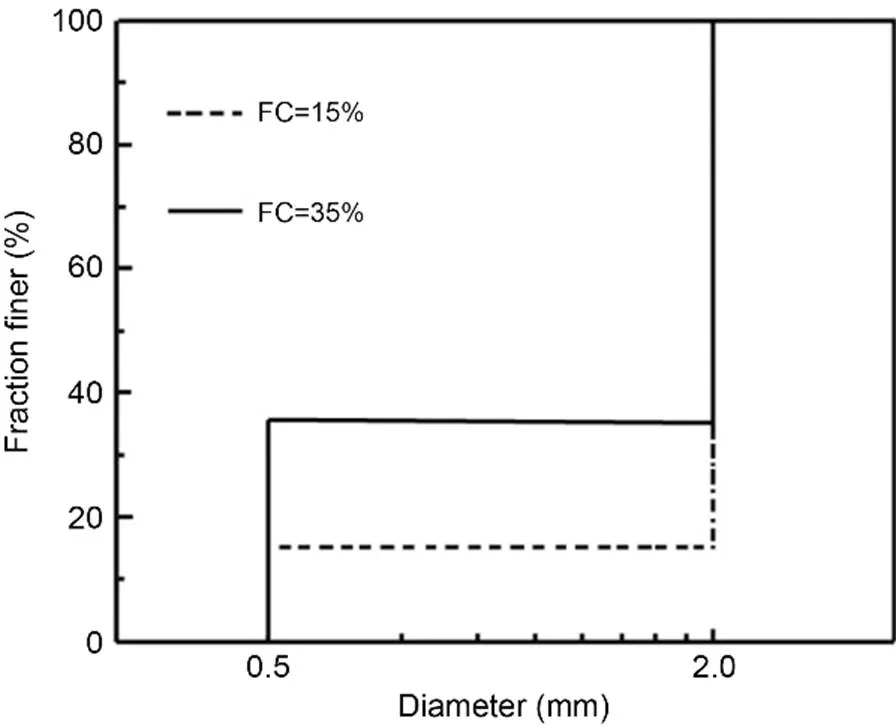
Fig. 4 Initial grain size distribution of soils
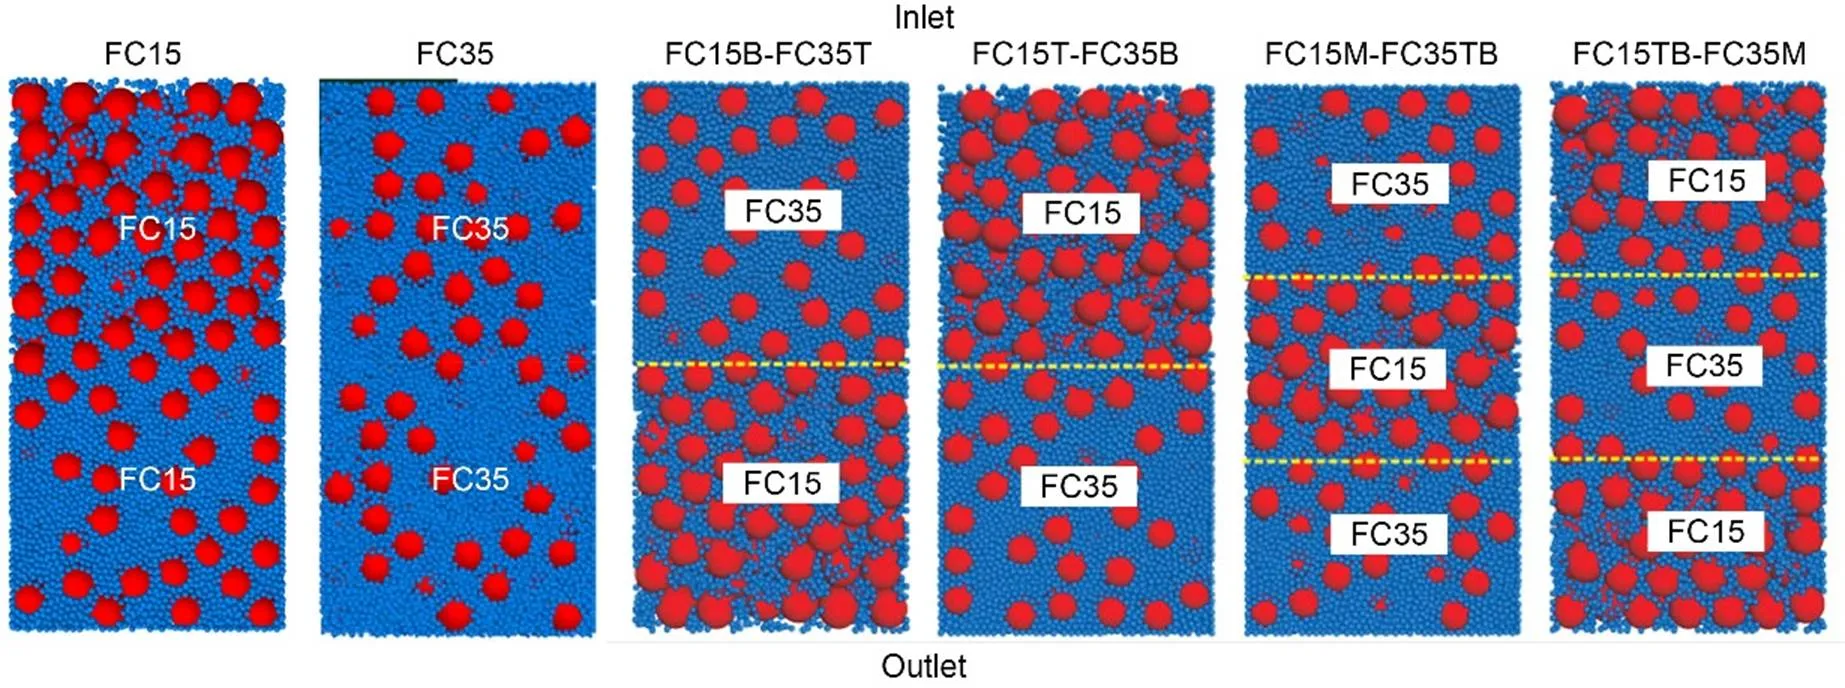
Fig. 5 Multi-layered soil specimens in DEM
3.2 Simulation results
The percentage of cumulative eroded mass (Me), which is defined as the percentage of eroded mass of fine particles mass to the total mass of fine particles before the test, is recorded during the test and is plotted against time in Fig. 6. Fines content in different soil layers does not change the overall evolution trend ofMe, which increases rapidly at the beginning of the test and then becomes stable. However, the total eroded mass is significantly affected by the multi-layered soil conditions. According to Fig. 6, the two-layered soil specimen FC15T-FC35B has the maximum cumulative eroded mass (47.01%), and the FC15B-FC35T yields the lowest (10.07%). In specimen FC15T-FC35B, the bottom of the sample is highly compacted with fine particles, which reduces the porosity and permeability of the specimen. As a result, both the flow velocity and the drag force applied to the fine particles are higher at the bottom, resulting in more eroded fines. The eroded particles are mainly from the bottom part with a fines content of 35%, which produces flow channels for fine particles from upper soils. By contrast, in the specimen FC15B-FC35T, the porosity at the top is higher than that at the bottom, so the fine particles that come with the flow from the top stop at the bottom part due to the decrease of the velocity and drag force. It is also interesting to see that although specimens of FC15M-FC35TB and FC15 have a higher number of fines particles, the cumulative eroded mass is smaller than that from FC15B-FC35T. This observation confirms that soil layers above the bottom layer may prevent suffusion by blocking some flow channels.
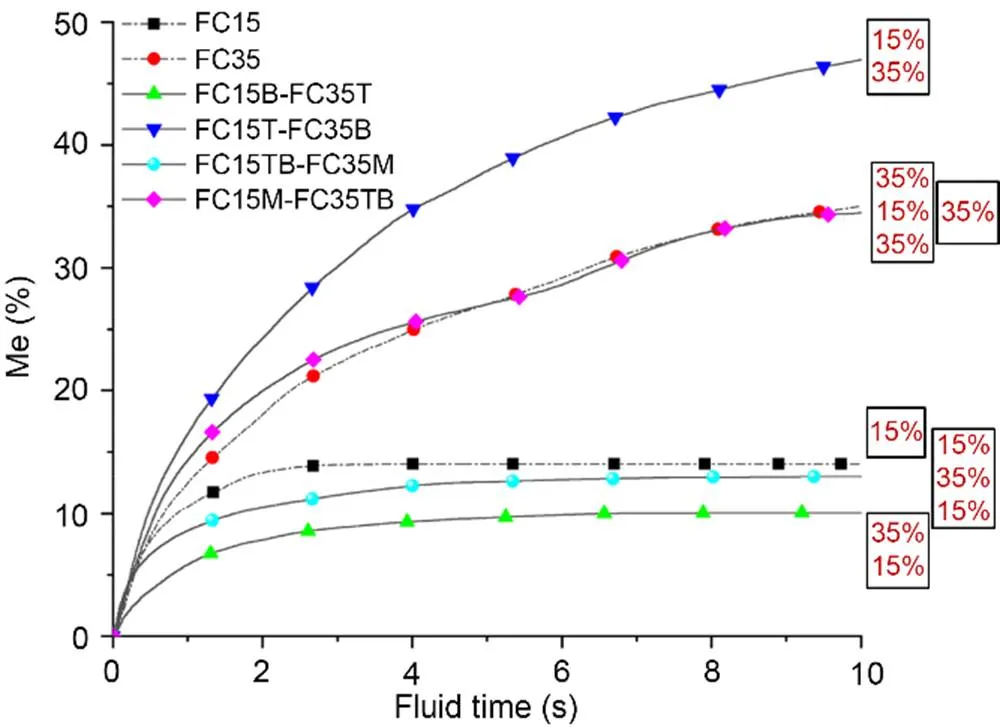
Fig. 6 Cumulative eroded mass over fluid time
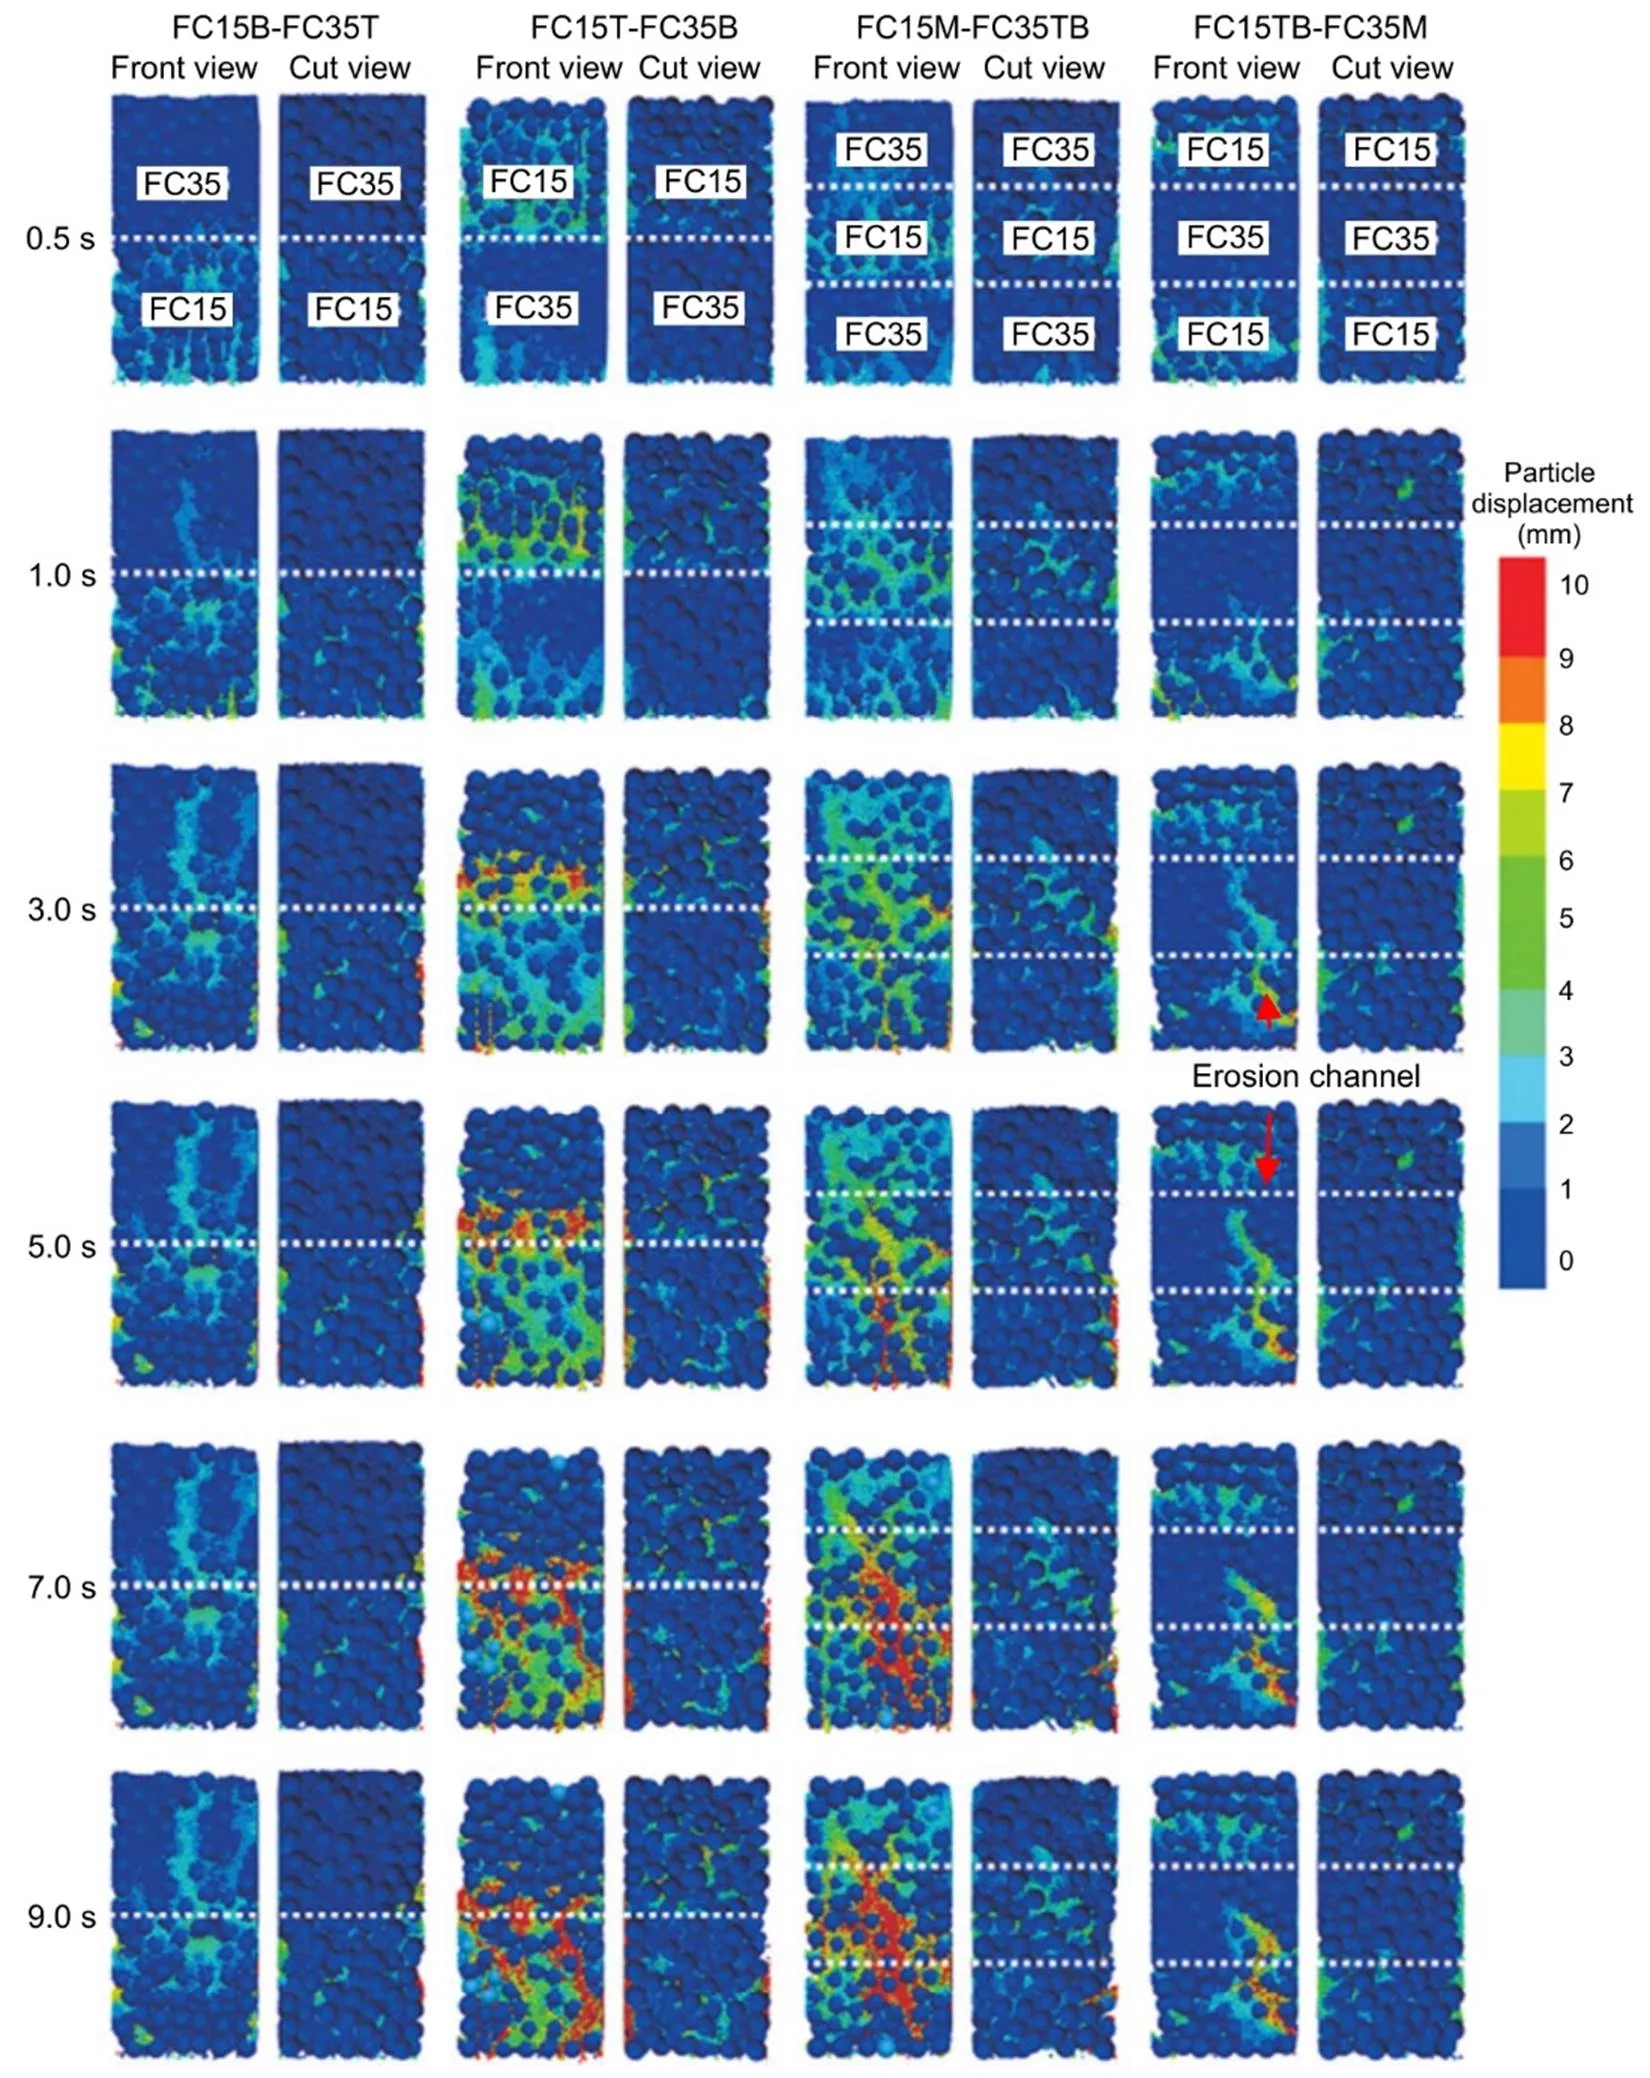
Fig. 7 Evolution of particle displacement in multi-layered soil specimens
In addition, migration of fines particles in soils with 15% fines contents starts earlier than that in soils with 30% fines contents. For example, in both specimens FC15B-FC35T and FC15T-FC35B at=1 s, there is a higher magnitude of particle movement in soils with 15% fines content than that in soils with 30%. Such difference can also be attributed to the stronger constraints in soils with higher fines contents. In the FC15T-FC35B specimen, there are a large number of fines particles with displacements greater than 10 mm in the FC35 area, indicating that many of them are eroded particles from the upper FC15 area. In other words, the upper layer with 15% fines content facilitates suffusion by providing fines particles. For the specimen FC15B-FC35T, fines particles in the FC35 area gradually flow downwards into the lower FC15 area, and then are blocked by the bottom layer. Therefore, it is rare to see fines particles with a displacement greater than 10 mm, and the coarse particle skeleton at the bottom plays a blocking role. Therefore, the particle loss of FC15T-FC35B is significantly greater than that of FC15B-FC35T.
The above-mentioned mechanism is also applicable to specimens with three layers. For the specimen FC15TB-FC35M in Fig. 7, fines particles with displacements greater than 10 mm in the FC15 area at the bottom remain almost unchanged from 3 to 7 s. It indicates that fines particles from the upper part are blocked, and seepage channels are not developed. For FC15M-FC35TB, the number of fines particles with large displacements continues to increase, demonstrating that particles are continuously flowing out and stable flow channels are formed within the specimen. Therefore, in multi-layered soil conditions, soils with 15% fines content at the lower part can prevent the loss of fines particles to some extent, which is consistent with the results in Fig. 6. It can be concluded that the larger the region of soils with 15% fines content in the lower part, the harder it is to lose the fines particles.
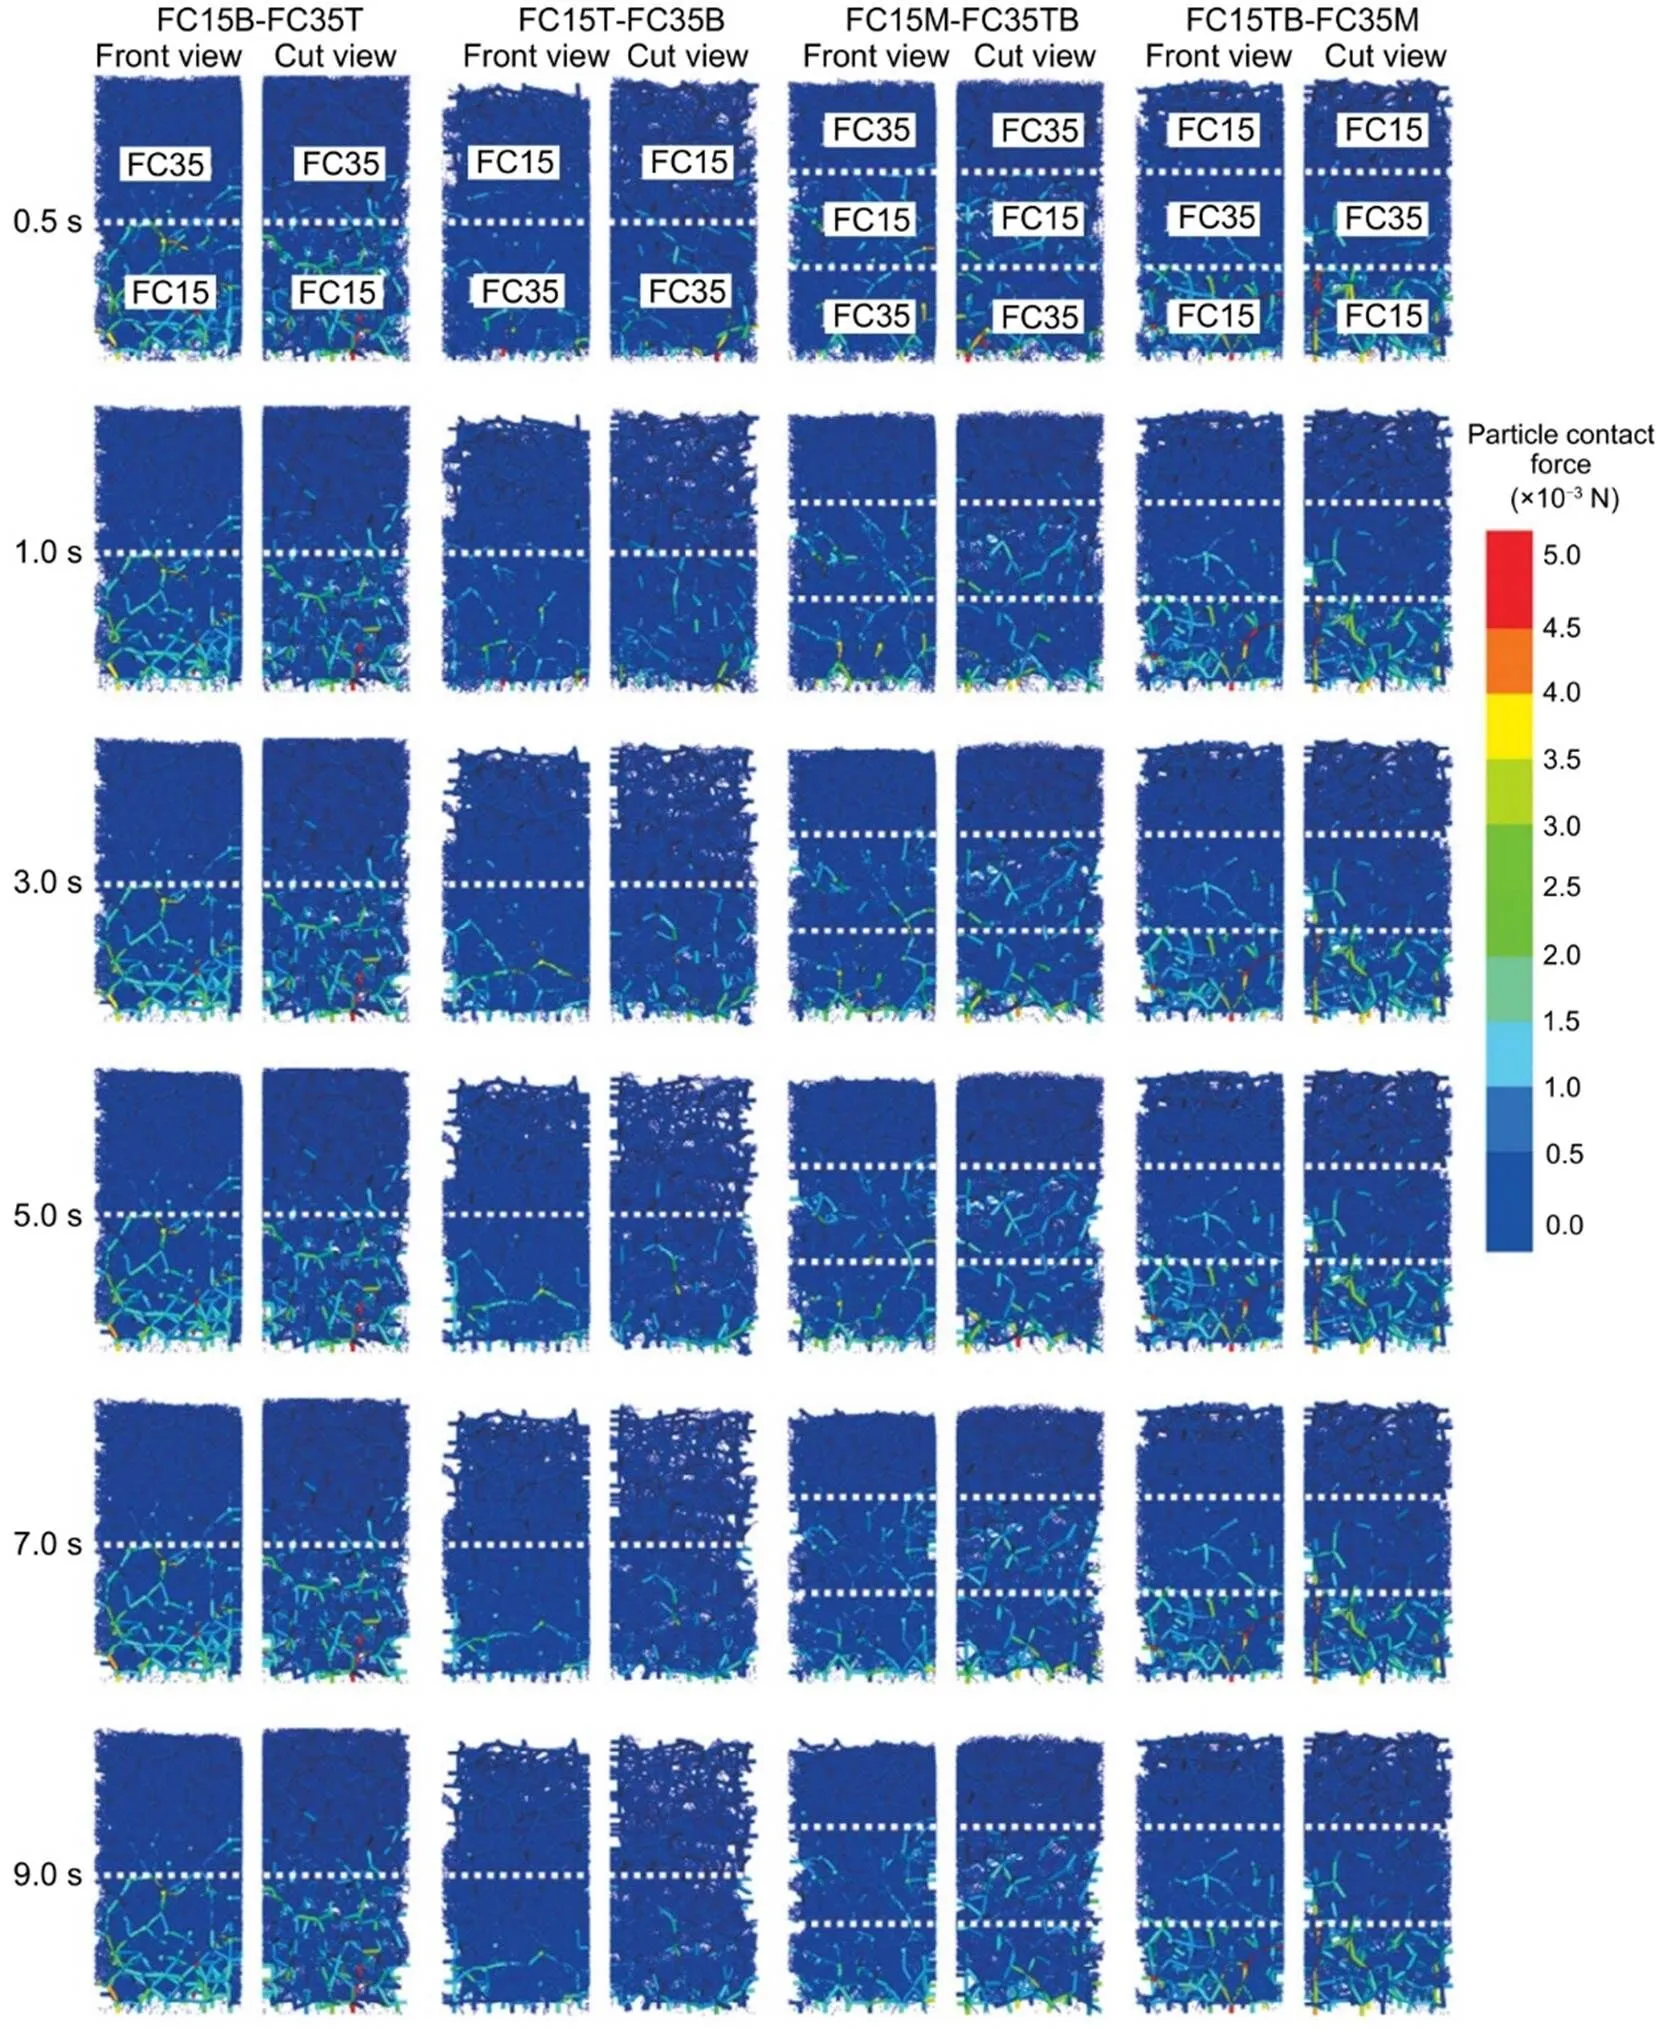
Fig. 8 Evolution of particle contact force in multi-layered soil specimens
The force chains in the specimens at different times are presented in Fig. 8. Due to the combined effects of gravity and fluid flow, strong force chains concentrate at the bottom of the specimens. Because there are more large particles in soils with 15% fines content, force concentration is stronger in FC15 reg ions in the specimens, as shown in Fig. 8. At the microscale, soils with 15% fines content have stable skeletons mainly made of coarse particles, while skeletons in soils with 30% fines content contain a higher percentage of fines particles with highly distributed contact force. Therefore, during the whole suffusion process, both skeletons and force chains in FC15 regions do not show significant changes. On the other hand, because the magnitudes of contact forces are relatively smaller in FC35 regions without forming a stable soil skeleton, fines particles are vulnerable to migration within flow channels. The loss of fines particles leads to continuous changes in soil skeletons within FC35 regions.
4 Suffusion in soil specimens with impermeable zones
4.1 CFD-DEM model for soil specimens with impermeable zones
In previous studies, researchers mainly adopted an idealized flow boundary, i.e., regular-shaped specimens with permeable granular soils. However, in real engineering practice, it is common for soils to contain impermeable zones such as boulders or clay layers with very low permeability, making the suffusion process much more complicated. In addition, there may be partially permeable inlets or outlets in some cases, and those have not been investigated in previous studies. Therefore, in this section, the effects of both partially permeable boundary and impermeable zones on suffusion in soils will be investigated and discussed.
Four specimens with irregular flow conditions were prepared for this study, as shown in Fig. 9. For the first and second specimens, the impermeable zones are located at the bottom and top, respectively. The other two specimens have one or two impermeable zones within the specimens on the left or/and right side, as shown in Fig. 9. The sample preparation method presented in Section 3 is used to generate a DEM specimen without impermeable zones. Then a wall covering half of the top/bottom of the specimen is created, preventing particles as well as flow from passing the inlet/outlet. To generate specimens with impermeable zones on the left or/and right side, particles within the impermeable zones are manually deleted and walls are created at the boundaries of the impermeable zones. Accordingly, the CFD model only covers the region with soils with a fixed flow velocity of 0.01 m/s at the top. All the specimens have a fines content of 35% with the diameters of coarse and fine particles of 2.0 and 0.5 mm, respectively.
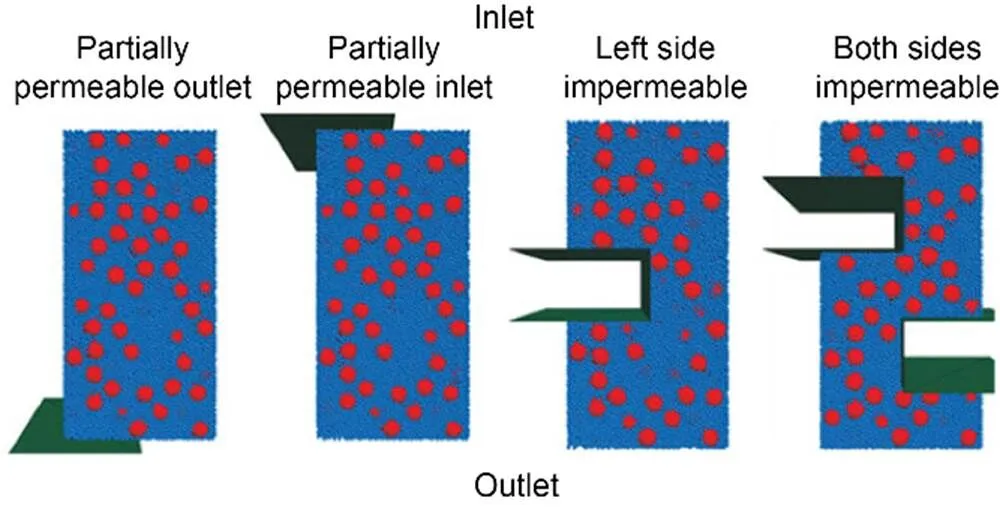
Fig. 9 Specimens with impermeable zones
4.2 Results and discussion
Fig. 10 displays the cumulative eroded mass curve of each case, and shows the effect of partially impermeable boundaries and impermeable zones on suffusion. Due to the high fines content, a high cumulative eroded mass is observed in all the tests. The specimen with a partially permeable inlet has the lowest cumulative eroded mass (25.1%); next it is the specimen with a partially permeable outlet. Due to the decreased inlet area, in the test with a partially permeable inlet, both the volume of fluid flow and the eroded region are much smaller than in the FC35 test. Combined with the decreased drag force applied to the particles, the cumulative eroded mass is significantly decreased. Similarly, for the test with a partially permeable outlet, the eroded region is decreased at the bottom, leading to smaller number of eroded fines particles. The impermeable zones inside specimens play a minor effect on suffusion, as shown in Fig. 10. The specimens with an impermeable zone on the left even yield an increased cumulative eroded mass compared to the FC35 specimen. This increased eroded mass can be attributed to the flow channels on the permeable (right) side, which is caused by the increased flow velocity and leads to severe suffusion. However, with the increase of impermeable zones, continuous flow channels passing through the whole specimen cannot be well developed, resulting in decreased eroded mass.
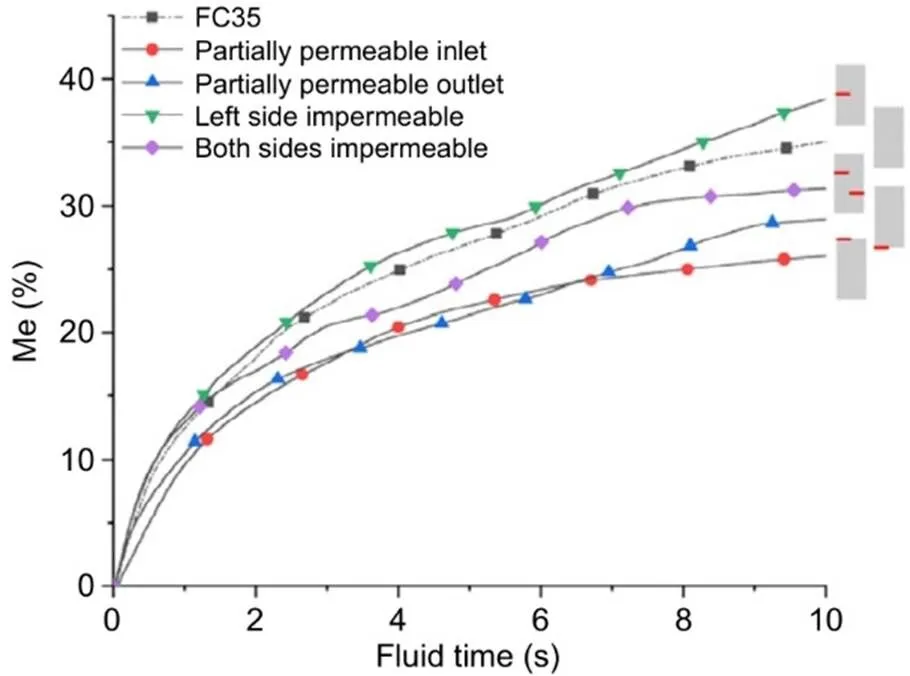
Fig. 10 Cumulative eroded mass over fluid time
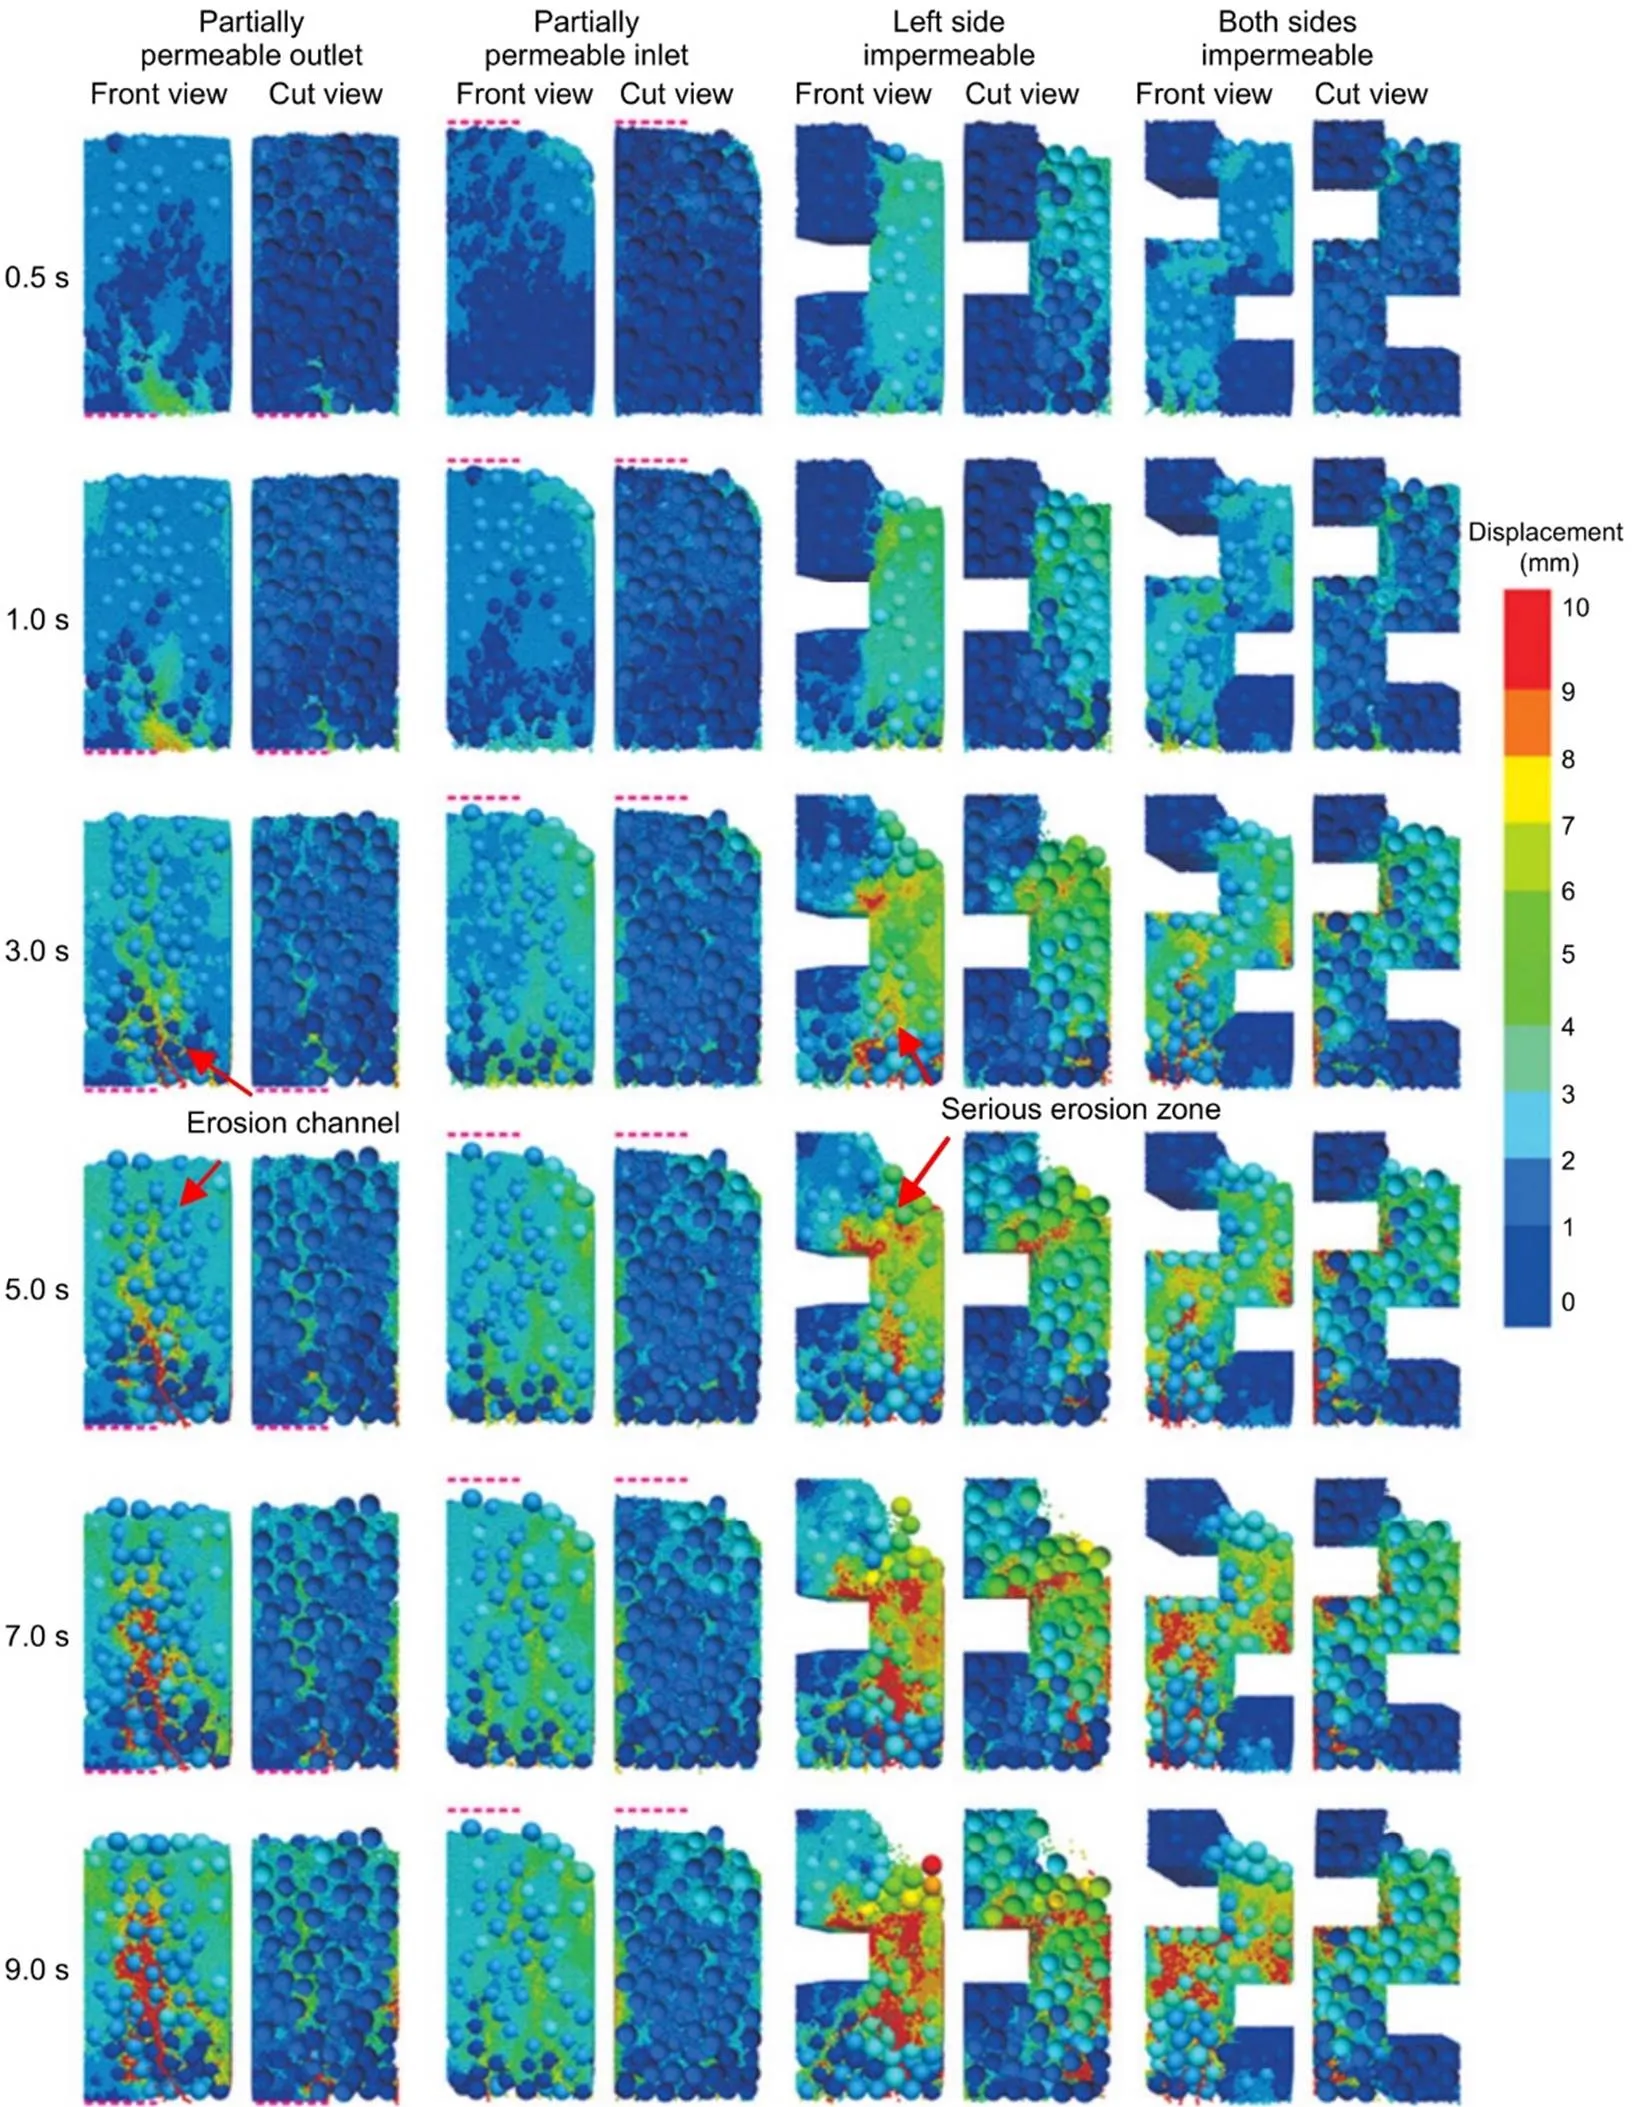
Fig. 11 Evolution of particle displacement in specimens with impermeable zones
The evolution of particle displacement is displayed in Fig. 11. The specimen with partially permeable inlet shows the least amount of particle displacement, and no obvious flow channel is developed. Such observation is consistent with the results in Fig. 10. The specimen with a partially permeable outlet exhibits slightly larger particle displacements than the partially permeable inlet, but particles with large displacement are mainly located at the center of the specimen. As a result, the number of eroded particles is small. In the two specimens with impermeable zones on the left and right, the flow velocity is increased due to a decrease in flow area. Therefore, fines particles are subjected to higher magnitudes of drag forces and more readily migrate with the flow. Particularly, in the specimen with one impermeable zone on the left side, the high velocity flow produces an obvious flow channel on the right side, through which a large number of particles are eroded.
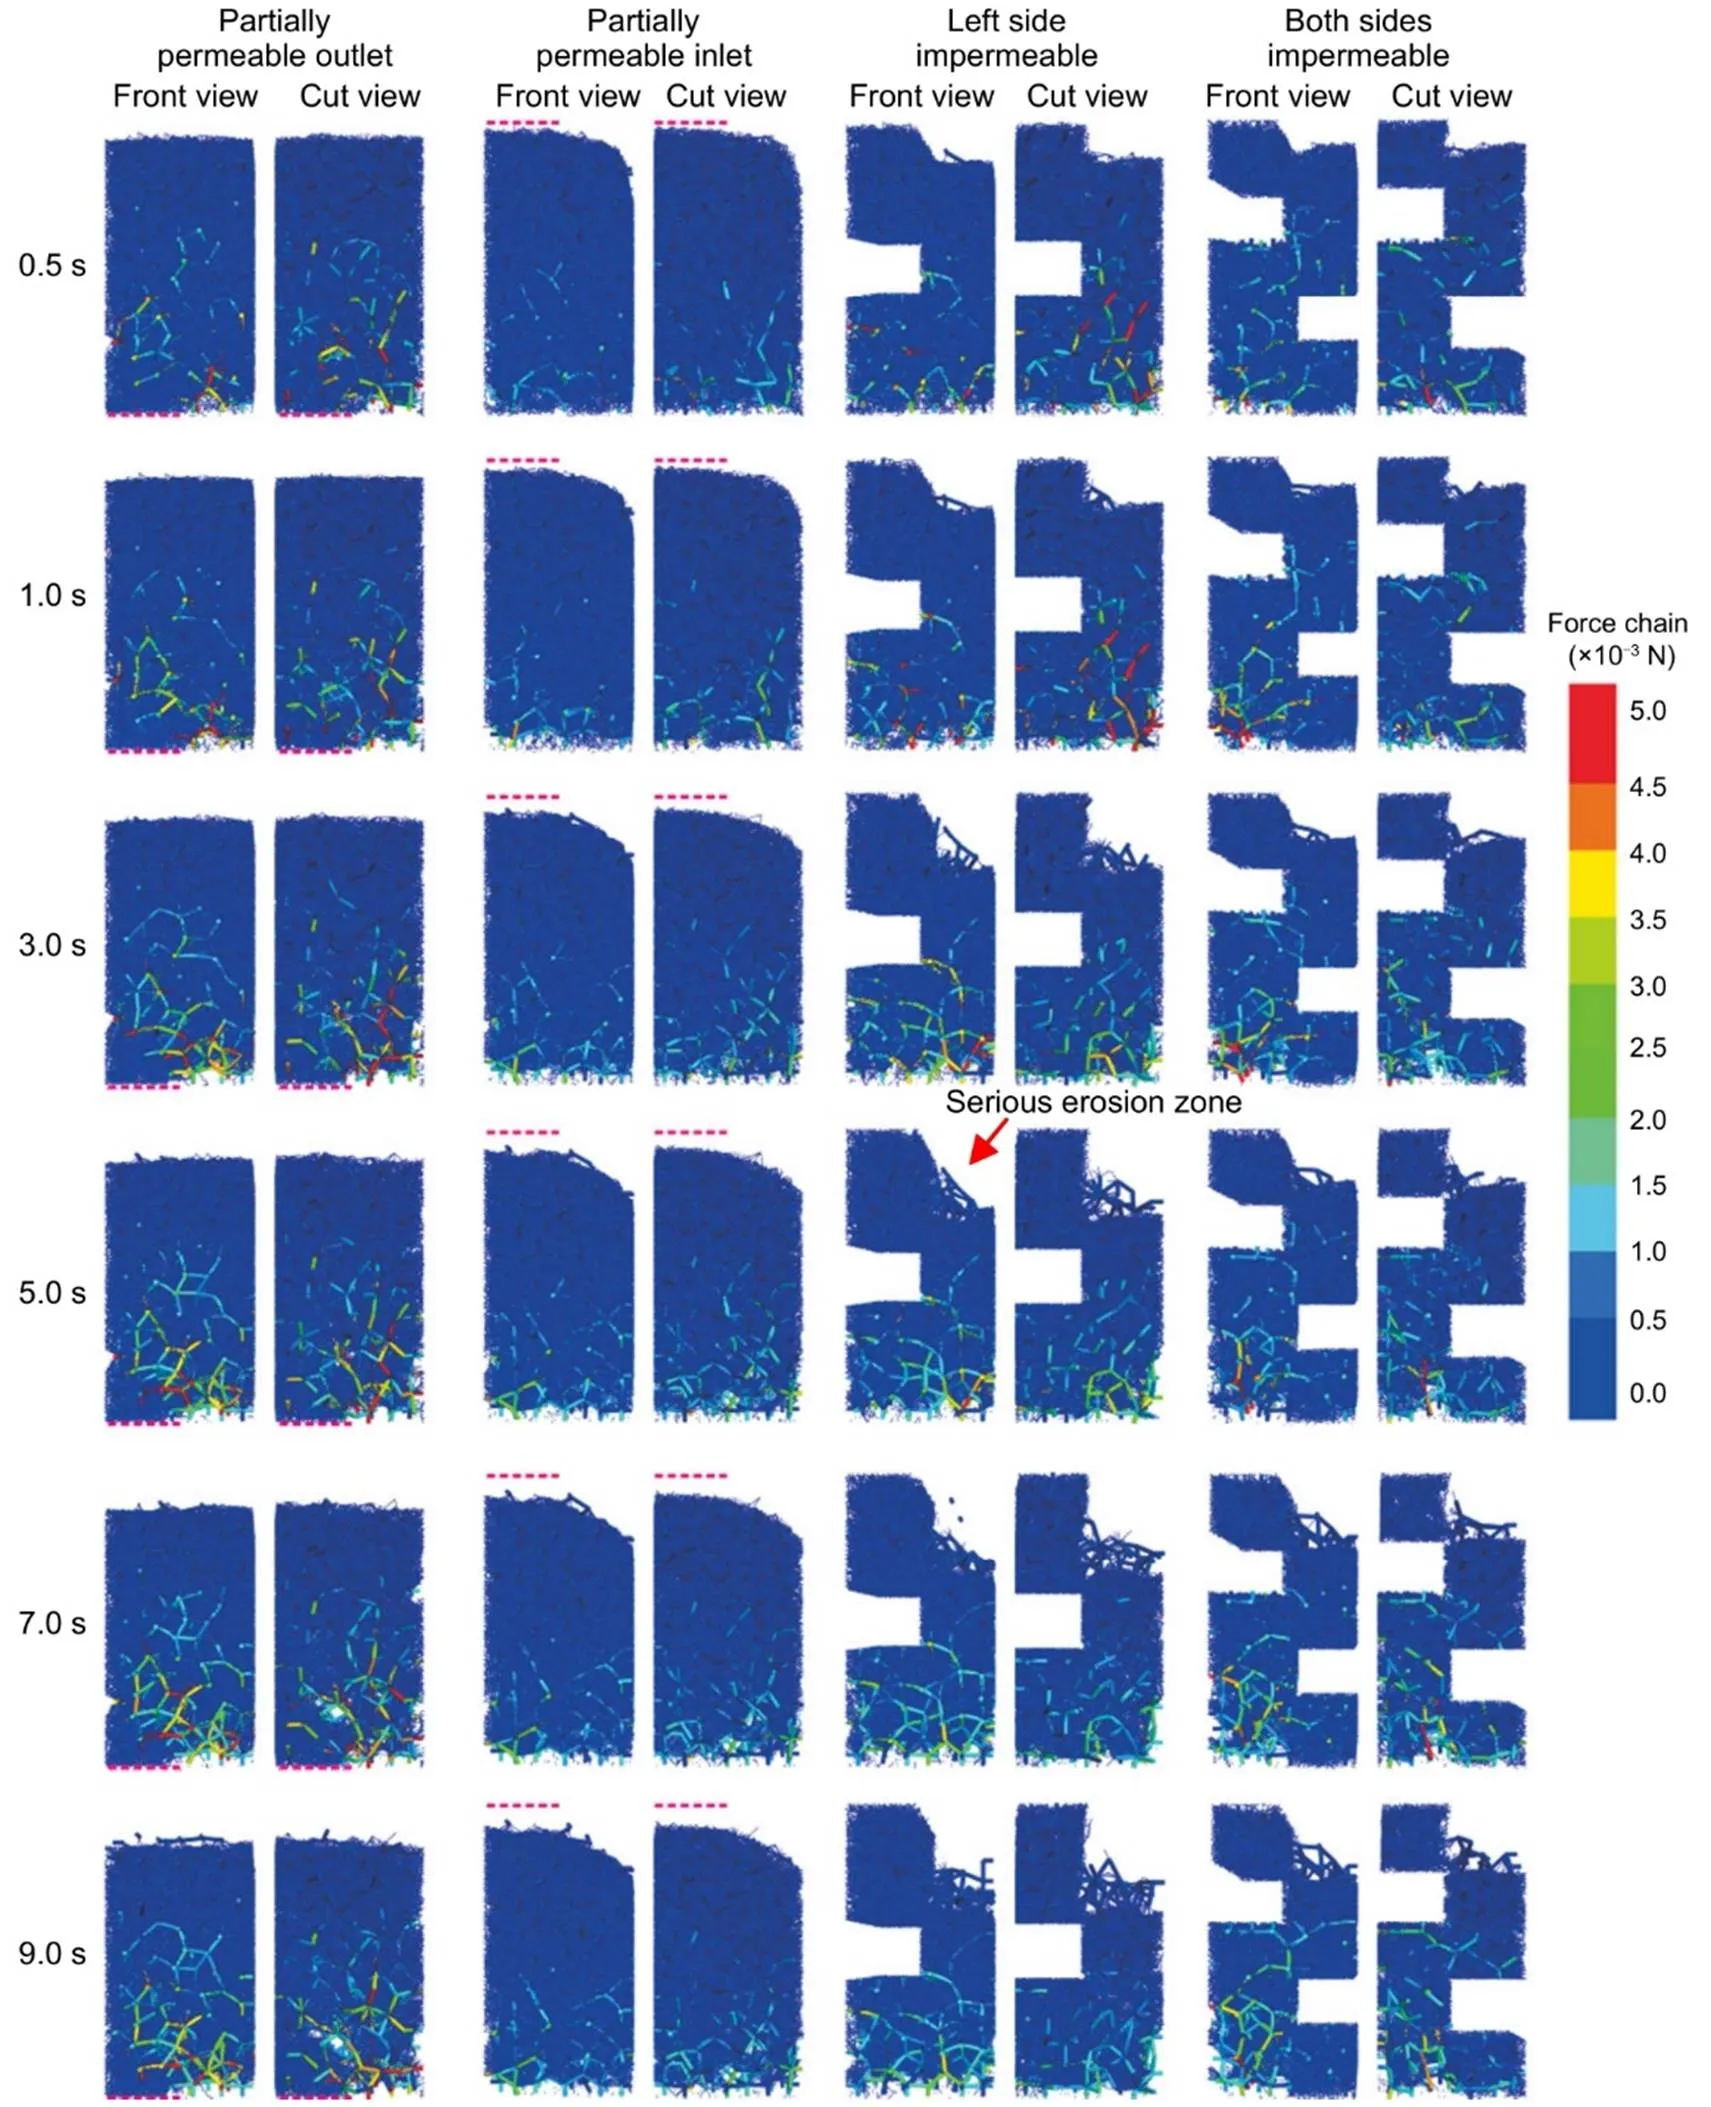
Fig. 12 Evolution of force chains in specimens with impermeable zones
Table 2 shows the final eroded mass of all tests. The results indicate that the higher the fines contact of the bottom soil layer, the higher the cumulative eroded mass. When soils above the bottom layer have higher fines content, suffusion is alleviated. When soils above have lower fines content, suffusion is more severe. The eroded mass of the model with unilateral water entry is lower than that of the model with normal water entry. Under the condition of constant flow velocity, the erosion of the model with a unilateral impermeable layer is higher than that of the model with impermeable layers on both sides.
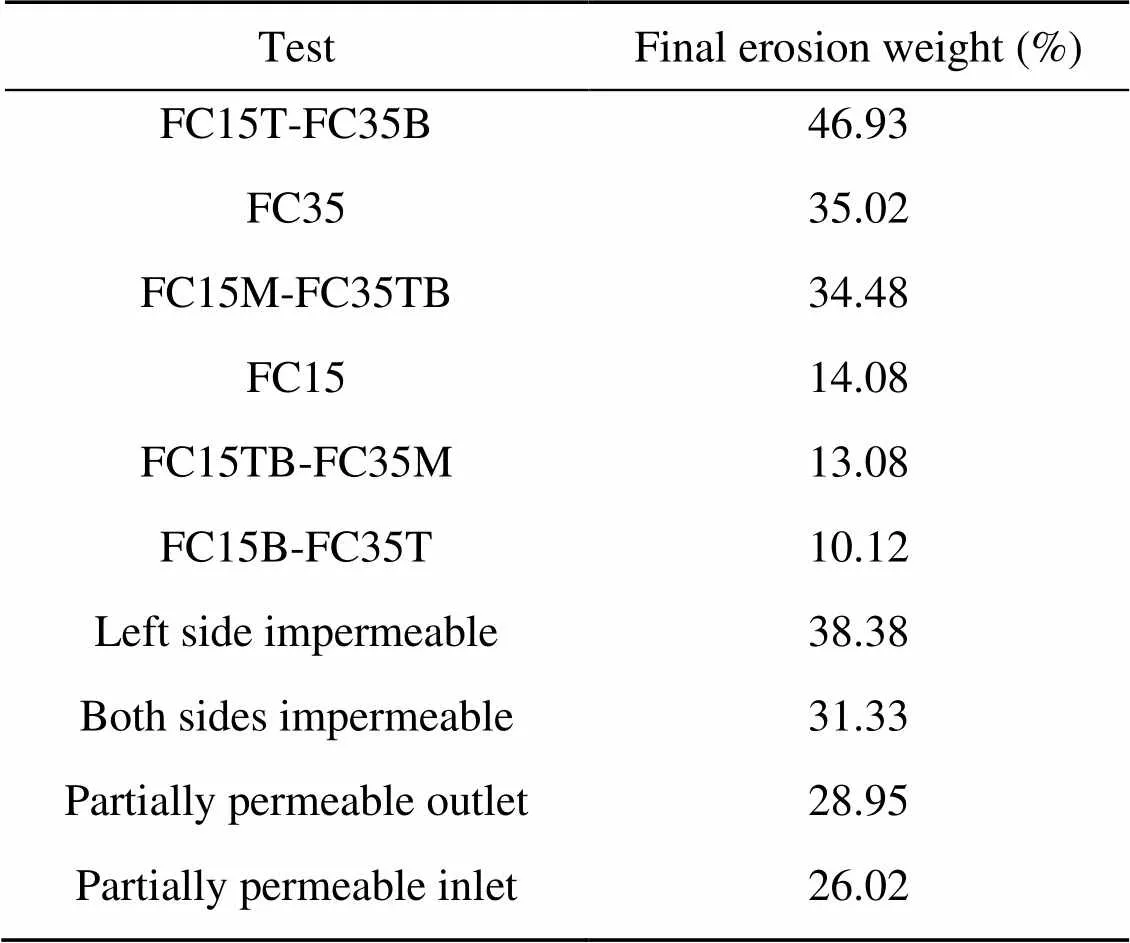
Table 2 Final erosion weights of all tests
5 Conclusions
In this paper, suffusion has been investigated using a coupled DEM and CFD approach. In contrast to previous simulations and tests using homogeneous soil specimens and regular-shaped specimens, this study focuses on suffusion in soils with multiple layers and impermeable zones. The parameters of the CFD-DEM model are first calibrated with the classic Ergun test and a good match with experiment is obtained. Then suffusion in multi-layered soils with different fines contents and soils impermeable zones is simulated and discussed.
For soils with multiple layers, the cumulative eroded mass is mainly determined by the layer at the bottom. In general, the higher the fines contact of the bottom soil layer, the higher the cumulative eroded mass. In addition, when soils above the bottom layer have higher fines content, suffusion is alleviated. On the other hand, when soils above have lower fines content, suffusion is more severe.
In the tests with specimens with various impermeable regions, the volume of flow plays a major role in determining the cumulative mass. The impermeable zones inside soil specimens can increase the flow velocity around these zones, facilitating the migration of fines particles and intensifying suffusion. Suffusion can also be alleviated by increasing the number of impermeable zones, which can increase the length of flow path and settle the fines particles.
The above observations enable engineers to make a better prediction of eroded mass in real engineering cases with various soil conditions.
Acknowledgments
This work is supported by the Research Grants Council (RGC) of Hong Kong (No. 15226322) and the National Natural Science Foundation of China (No. 42207210).
Author contributions
Pei WANG and Ying GE designed the research. Pei WANG and Tuo WANG processed the corresponding data. Pei WANG wrote the first draft of the manuscript. Tuo WANG helped to organize the manuscript. Qi-wei LIU and Shun-xiang SONG revised and edited the final version.
Conflict of interest
Pei WANG, Ying GE, Tuo WANG, Qi-wei LIU, and Shun-xiang SONG declare that they have no conflict ofinterest.
Bao N, Wei J, Chen JF, et al., 2020. 2D and 3D discrete num erical modelling of soil arching. Journal of Zhejiang University-SCIENCE A (Applied Physics & Engineering), 21(5):350-365. https://doi.org/10.1631/jzus.A1900672
Chang DS, Zhang LM, 2013. Extended internal stability criteria for soils under seepage. Soils and Foundations, 53(4):569-583. https://doi.org/10.1016/j.sandf.2013.06.008
Cheng K, Wang Y, Yang Q, 2018. A semi-resolved CFD-DEM model for seepage-induced fine particle migration in gap-graded soils. Computers and Geotechnics, 100:30-51. https://doi.org/10.1016/j.compgeo.2018.04.004
di Felice R, 1994. The voidage function for fluid-particle interaction systems. International Journal of Multiphase Flow, 20(1):153-159. https://doi.org/10.1016/0301-9322(94)90011-6
Emerson W, 1967. A classification of soil aggregates based on their coherence in water. Soil Research, 5(1):47-57. https://doi.org/10.1071/SR9670047
Ergun S, 1952. Fluid flow through packed columns. Chemical Engineering Progress, 48:89-94.
Foster M, Fell R, Spannagle M, 2000. The statistics of embankment dam failures and accidents. Canadian Geotechnical Journal, 37(5):1000-1024. https://doi.org/10.1139/t00-030
Ghebreiyessus YT, Gantzer CJ, Alberts EE, et al., 1994. Soil erosion by concentrated flow: shear stress and bulk density. Transactions of the ASAE, 37(6):1791-1797. https://doi.org/10.13031/2013.28268
Hanson GJ, Hunt SL, 2007. Lessons learned using laboratory jet method to measure soil erodibility of compacted soils. Applied Engineering in Agriculture, 23(3):305-312. https://doi.org/10.13031/2013.22686
Horikoshi K, Takahashi A, 2015. Suffusion-induced change in spatial distribution of fine fractions in embankment subjected to seepage flow. Soils and Foundations, 55(5):1293-1304. https://doi.org/10.1016/j.sandf.2015.09.027
Hu Z, Zhang YD, Yang ZX, 2019. Suffusion-induced deformation and microstructural change of granular soils: a coupled CFD-DEM study. Acta Geotechnica, 14(3):795-814. https://doi.org/10.1007/s11440-019-00789-8
Hu Z, Zhang YD, Yang ZX, 2020. Suffusion-induced evolution of mechanical and microstructural properties of gap-graded soils using CFD-DEM. Journal of Geotechnical and Geoenvironmental Engineering, 146(5):04020024. https://doi.org/10.1061/(ASCE)GT.1943-5606.0002245
Indraratna B, Nguyen VT, Rujikiatkamjorn C, 2011. Assessing the potential of internal erosion and suffusion of granular soils. Journal of geotechnical and Geoenvironmental Engineering, 137(5):550-554. https://doi.org/10.1061/(ASCE)GT.1943-5606.0000447
Itasca, 2015. PFC 3D particle flow code in 3 dimensions. PFC 5.0 Documentation. Itasca, Minneapolis, USA.
Jasak H, Jemcov A, Tukovic Z, 2007. OpenFOAM: ACþþ library for complex physics simulations. Proceedings of the International Workshop on Coupled Methods in Numerical Dynamics, Dubrovnik, Croatia, Vol. 1000.
Jin Z, Lu Z, Yang Y, 2021. Numerical analysis of column collapse by smoothed particle hydrodynamics with an advanced critical state-based model. Journal of Zhejiang University-SCIENCE A (Applied Physics & Engineering), 22(11):882-893. https://doi.org/10.1631/jzus.A2000598
Kakuturu S, Reddi LN, 2006. Evaluation of the parameters influencing self-healing in earth dams. Journal of Geotechnical and Geoenvironmental Engineering, 132(7):879-889. https://doi.org/10.1061/(asce)1090-0241(2006)132:7(879)
Kenney TC, Lau D, 1985. Internal stability of granular filters. Canadian Geotechnical Journal, 22(2):215-225. https://doi.org/10.1139/t85-029
Liu XX, Shen SL, Xu YS, et al., 2018. Analytical approach for time-dependent groundwater inflow into shield tunnel face in confined aquifer. International Journal for Numerical and Analytical Methods in Geomechanics, 42(4):655-673. https://doi.org/10.1002/nag.2760
Liu XX, Shen SL, Xu YS, et al., 2021a. Non-linear spring model for backfill grout-consolidation behind shield tunnel lining. Computers and Geotechnics, 136:104235. https://doi.org/10.1016/j.compgeo.2021.104235
Liu XX, Shen SL, Xu YS, et al., 2021b. A diffusion model for backfill grout behind shield tunnel lining. International Journal for Numerical and Analytical Methods in Geomechanics, 45(4):457-477. https://doi.org/10.1002/nag.3164
Liu YJ, Wang LZ, Hong Y, et al., 2020. A coupled CFD-DEM investigation of suffusion of gap graded soil: coupling effect of confining pressure and fines content. International Journal for Numerical and Analytical Methods in Geomechanics, 44(18):2473-2500. https://doi.org/10.1002/nag.3151
Liu YJ, Yin ZY, Wang LZ, et al., 2021. A coupled CFD–DEM investigation of internal erosion considering suspension flow. Canadian Geotechnical Journal, 58(9):1411-1425. https://doi.org/10.1139/cgj-2020-0099
Lyle WM, Smerdon ET, 1965. Relation of compaction and other soil properties to erosion resistance of soils. Transactions of the ASAE, 8(3):419-0422. https://doi.org/10.13031/2013.40536
Lyu HM, Shen SL, Wu YX, et al., 2021. Calculation of groundwater head distribution with a close barrier during excavation dewatering in confined aquifer. Geoscience Frontiers, 12(2):791-803. https://doi.org/10.1016/j.gsf.2020.08.002
Moffat R, Fannin RJ, Garner SJ, 2011. Spatial and temporal progression of internal erosion in cohesionless soil. Canadian Geotechnical Journal, 48(3):399-412. https://doi.org/10.1139/T10-071
Qian JG, Li WY, Yin ZY, et al., 2021a. Influences of buried depth and grain size distribution on seepage erosion in granular soils around tunnel by coupled CFD-DEM approach. Transportation Geotechnics, 29:100574. https://doi.org/10.1016/j.trgeo.2021.100574
Qian JG, Zhou C, Yin ZY, et al., 2021b. Investigating the effect of particle angularity on suffusion of gap-graded soil using coupled CFD-DEM. Computers and Geotechnics, 139:104383. https://doi.org/10.1016/j.compgeo.2021.104383
Reddi LN, Lee IM, Bonala MVS, 2000. Comparison of internal and surface erosion using flow pump tests on a sand-kaolinite mixture. Geotechnical Testing Journal, 23(1):116-122. https://doi.org/10.1520/GTJ11129J
Shen SL, Lyu HM, Zhou AN, et al., 2021. Automatic control of groundwater balance to combat dewatering during construction of a metro system. Automation in Construction, 123:103536. https://doi.org/10.1016/j.autcon.2020.103536
Sherard JL, Dunnigan LP, Decker RS, 1976. Identification and nature of dispersive soils. Journal of the Geotechnical Engineering Division, 102(4):287-301. https://doi.org/10.1061/AJGEB6.0000256
Wan CF, Fell R, 2004. Laboratory tests on the rate of piping erosion of soils in embankment dams. Geotechnical Testing Journal, 27(3):295-303. https://doi.org/10.1520/GTJ11903
Wang P, Yin ZY, Wang ZY, 2022. Micromechanical investigation of particle-size effect of granular materials in biaxial test with the role of particle breakage. Journal of Engineering Mechanics, 148(1):04021133. https://doi.org/10.1061/(ASCE)EM.1943-7889.0002039
Wang T, Zhang FS, Furtney J, et al., 2022. A review of methods, applications and limitations for incorporating fluid flow in the discrete element method. Journal of Rock Mechanics and Geotechnical Engineering, 14(3):1005-1024. https://doi.org/10.1016/j.jrmge.2021.10.015
Wen MJ, Wang KH, Wu WB, et al., 2021. Dynamic response of bilayered saturated porous media based on fractional thermoelastic theory. Journal of Zhejiang University-SCIENCE A (Applied Physics & Engineering), 22(12):992-1004. http://doi.org/10.1631/jzus.A2100084
Xie ZZ, Shen YS, Takabatake K, et al., 2020. Coarse-grained DEM study of solids sedimentation in water. Powder Technology, 361:21-32. https://doi.org/10.1016/j.powtec.2019.11.034
Xie ZZ, Wang S, Shen YS, 2021a. CFD-DEM modelling of the migration of fines in suspension flow through a solid packed bed. Chemical Engineering Science, 231:116261. https://doi.org/10.1016/j.ces.2020.116261
Xie ZZ, Wang S, Shen YS, 2021b. CFD-DEM study of segregation and mixing characteristics under a bi-disperse solid-liquid fluidised bed. Advanced Powder Technology, 32(11):4078-4095. https://doi.org/10.1016/j.apt.2021.09.012
Xiong H, Wu H, Bao XH, et al., 2021a. Investigating effect of particle shape on suffusion by CFD-DEM modeling. Construction and Building Materials, 289:123043. https://doi.org/10.1016/j.conbuildmat.2021.123043
Xiong H, Yin ZY, Zhao JD, et al., 2021b. Investigating the effect of flow direction on suffusion and its impacts on gap-graded granular soils. Acta Geotechnica, 16(2):399-419. https://doi.org/10.1007/s11440-020-01012-9
Yang J, Yin ZY, Laouafa F, et al., 2019a. Analysis of suffusion in cohesionless soils with randomly distributed porosity and fines content. Computers and Geotechnics, 111:157-171. https://doi.org/10.1016/j.compgeo.2019.03.011
Yang J, Yin ZY, Laouafa F, et al., 2019b. Modeling coupled erosion and filtration of fine particles in granular media. Acta Geotechnica, 14(6):1615-1627. https://doi.org/10.1007/s11440-019-00808-8
Yang J, Yin ZY, Laouafa F, et al., 2020. Three-dimensional hydromechanical modeling of internal erosion in dike‐on-foundation. International Journal for Numerical and Analytical Methods in Geomechanics, 44(8):1200-1218. https://doi.org/10.1002/nag.3057
Yin ZY, Wang P, Zhang FS, 2020. Effect of particle shape on the progressive failure of shield tunnel face in granular soils by coupled FDM-DEM method. Tunnelling and Underground Space Technology, 100:103394. https://doi.org/10.1016/j.tust.2020.103394
Yin ZY, Jin YF, Zhang X, 2021. Large deformation analysis in geohazards and geotechnics. Journal of Zhejiang University-SCIENCE A (Applied Physics & Engineering), 22(11):851-855. https://doi.org/10.1631/jzus.A21LDGG1
Zhao T, Houlsby GT, Utili S, 2014. Investigation of granular batch sedimentation via DEM-CFD coupling. Granular Matter, 16(6):921-932. https://doi.org/10.1007/s10035-014-0534-0
Mar. 4, 2022; Revision accepted Mar. 21, 2022; Crosschecked Aug. 18, 2022; Online first Sept. 27, 2022
https://doi.org/10.1631/jzus.A2200108
© Zhejiang University Press 2022
 Journal of Zhejiang University-Science A(Applied Physics & Engineering)2023年1期
- Journal of Zhejiang University-Science A(Applied Physics & Engineering)的其它文章
- Multiscale multiphysics modeling in geotechnical engineering
- Effect of hydraulic fracture deformation hysteresis on CO2 huff-n-puff performance in shale gas reservoirs
- Finite volume method-based numerical simulation method for hydraulic fracture initiation in rock around a perforation
- Numerical investigations of the failure mechanism evolution of rock-like disc specimens containing unfilled or filled flaws
- Mechanistic investigation on Hg0 capture over MnOx adsorbents: effects of the synthesis methods
- Modelling and applications of dissolution of rocks in geoengineering