
Application of machine learning algorithms to screen potential biomarkers under cadmium exposure based on human urine metabolic profiles
2023-01-30 06:49TingZengYnshnLingQingyunDiJinglinTinJinyoChenBoLeiZhuYngZongweiCi
Chinese Chemical Letters 2022年12期
Ting Zeng ,Ynshn Ling ,Qingyun Di ,Jinglin Tin,Jinyo Chen,Bo Lei ,Zhu Yng ,Zongwei Ci ,*
a Food Science and Technology Program,Beijing Normal University-Hong Kong Baptist University United International College,Zhuhai 519087,China
b State Key Laboratory of Environmental and Biological Analysis,Department of Chemistry,Hong Kong Baptist University,Hong Kong,China
c Department of Nutrition,Food Safety and Toxicology,West China School of Public Health,Sichuan University,Chengdu 6100 41,China
Keywords:Human urine High-resolution mass spectrometry Cadmium exposure Metabolic profiles Machine learning
ABSTRACT Exposure to environmental cadmium increases the health risk of residents.Early urine metabolic detection using high-resolution mass spectrometry and machine learning algorithms would be advantageous to predict the adverse health effects.Here,we conducted machine learning approaches to screen potential biomarkers under cadmium exposure in 403 urine samples.In positive and negative ionization mode,4207 and 3558 features were extracted,respectively.We compared seven machine learning algorithms and found that the extreme gradient boosting(XGBoost)and random forest(RF)classifiers showed better accuracy and predictive performance than others.Following 5-fold cross-validation,the value of area under curve(AUC)was both 0.93 for positive and negative ionization modes in XGBoost classifier.In the RF classifier,AUC were 0.80 and 0.84 for positive and negative ionization modes,respectively.We then identified a biomarker panel based on XGBoost and RF classifiers.The incorporation of machine learning models into urine analysis using high-resolution mass spectrometry could allow a convenient assessment of cadmium exposure.
Despite the fact that the official regulations of environmental cadmium(Cd)pollution have been in place for over one hundred years,the screening of potential biomarkers related to Cd toxicity is still in need to safeguard human health[1].The tolerable Cd exposure level is 0.83μg/kg body weight/day and urinary Cd is 5.24μg/g creatinine according to the Food and Agriculture Organization/World Health Organization(FAO/WHO)guideline[2].Appropriately,the safety standard of Cd in rice is 0.2 mg/kg according to the China Food Safety National Standard for Maximum Levels of Contaminants in Foods(GB2762-2017).In many cases,urine is routinely and robustly used to diagnose and monitor health conditions because it is easy-obtained and non-invasive sampling[3,4].The interpretation of the urinary profile under Cd exposure would be beneficial to the determination of Cd exposure grades based on the screening markers.Mass spectrometry(MS)is able to provide data information including the retention time,ion mass spectral data and peak intensities for thousands of molecules concurrently,which could deepen our knowledge in the urinary samples.Considering the growing capacities of high-resolution MS(HRMS)to reveal and characterize the pollutant-relevant health status,as well as the accessible nature of urine samples,a bunch of relevant studies has been conducted over the past years[5–7].
Machine learning(ML)algorithms,in parallel,have been successfully applied in clinical laboratories for years,demonstrating their ability to deal with complex data sets[8].The machine learning approach is a type of artificial intelligence,which contains supervised and unsupervised learning,and has been used to improve the diagnostic capabilities of HRMS on urinary samples for more challenging problems[9].Briefly,a typical application of ML works as follows.First,it is the infrastructure data collection and pre-processing.The most appropriate machine learning algorithms for the type of data would be selected after loading the data and adjusting the parameters.After training and testing the model on data,cross-validation would be properly used for evaluation through the best-performing machine learning algorithms and the optimized signatures[10,11].The ratio of the training to testing set was usually set at 70:30 or 80:20,and several compounds were pinpointed to distinguish the exposure status[12].Altogether,machine learning algorithms have great potential for automating the interpretation and analysis of the urinary sample under Cd exposure[13,14].
The purpose of this study was to develop ML-based models that used urinary metabolic characteristics to screen potential biomarkers under Cd exposure.We collected 403 urine samples and analyzed them using liquid chromatography-HRMS(LC–HRMS).We then compared seven machine learning algorithms on the LC–HRMS data set,including extreme gradient boosting classifier(XGBoost classifier),logistic regression classifier,support vector classifier(SVC),multi-layer perceptron classifier(MLP classifier),K-nearest neighbor classifier(KNN classifier),Gaussian naive Bayes classifier(GaussianNB classifier)and random forest classifier(RF classifier).Via5-fold cross-validation,the area under curve(AUC),accuracy,sensitivity,specificity,positive predictive value,and negative predictive value were calculated.Finally,we identified a biomarker panel based on the selected machine learning models.The incorporation of machine learning models into urine analysis by HRMS allows a convenient assessment for Cd exposure.
As for the urinary characteristics of Cd-exposed humans,the present study included 403 participants,among which 280 and 123 belong to the exposure and control groups,respectively.The discriminating criterion was whether the villagers lived in Cd exposure or control areas.The main exposure route of Cd to the villagers was dietary Cd intake.The Cd exposure area was miningaffected and the villagers mainly subsisted on home-grown rice.The Cd concentration of home-grown rice greater than 0.2 mg/kg in the polluted area was reported in the previous study[15].The villagers in the control area with a Cd concentration of homegrown rice lower than 0.05 mg/kg have a similar lifestyle to the villagers in the polluted area.Table 1 showed the demographic characteristics of the Cd exposure and the control group.Of the 403 participants included in this study,the characteristics such as gender,frequency of smoking,age,residence duration and body mass index between Cd exposure and the control group showed no significant differences(P>0.05).Nevertheless,there were significant differences(P<0.05)in the concentrations of urinary cadmium(UCd),blood cadmium(BCd)andβ2-microglobulin between the Cd exposure and the control groups.Among them,β2-microglobulin is one of the nephrotoxicity signal molecules.The renal function tests,hepatic function tests and cardiac function tests were conducted.The results of cardiac function tests revealed no significant differences(P>0.05)between the two groups.While some of the clinical traits in the renal function tests(creatinine and blood urea nitrogen)and the hepatic function tests(total bile acid,alkaline phosphatase,gamma-glutamyl transpeptidase,indirect bilirubin,direct bilirubin and total bilirubin)showed a significant difference(P<0.05)between Cd exposure and the control groups.After the acquisition of urine metabolic profiles,4207 and 3558 features were extracted in positive and negative ionization mode,respectively.Then the partial least squares-discriminant analysis(PLS-DA)and the following metabolic pathway analysis were conducted using MetaboAnalyst(https://www.metaboanalyst.ca).As shown in Fig.S1(Supporting information),the exposure group clustered away from the control group and the peak intensities of the quality control sample were stable during the whole analysis guaranteeing the system stability(RSD<30%).
Then,these samples were randomly split into two parts at a ratio of 7:3.The forest plot analysis of different machine learning algorithms based on positive and negative ionization mode mass spectra was conducted in terms of classifying the Cd exposure using data from sufficient metabolic features(Fig.1).In this step,the random subsampling method was applied primarily due to its convenient comparison among multiple algorithms.The XGBoost and RF classifiers outperformed other algorithms when applied to the data from both positive and negative ionization modes.Following 5-fold cross-validation,accuracy,sensitivity,specificity,positive and negative predictive values of both models were calculated.The AUC for positive and negative ionization modes were both 0.93 in the XGBoost classifier.In the RF classifier,the AUC were 0.80 and 0.84 for positive and negative ionization modes,respectively(Table 2).
As XGBoost and RF classifiers were preferred,the top thirty features calculated from their feature importance were selected from positive and negative ionization modes,as shown in Fig.2.Among the top thirty features selected from the XGBoost classifier and RF classifier,biomarkers were identified by matching their mass fragmentation patterns with those in the Human Metabolome Database(HMDB,https://hmdb.ca).In total,seven biomarkers were found,includingS-adenosylmethionine,dehydroepiandrosterone sulfate,propionic acid,L-asparagine,homovanillic acid,deoxyinosine and deoxycytidine(Table 3).These compounds are involved in amino acid metabolism,purine metabolism,steroid hormone biosynthesis,etc.(Fig.S2 in Supporting information)[16–20].The Spearman correlation matrix of the identified compounds from human urine under Cd exposure was shown in Fig.3.Correlation were obtained between UCd and BCd(r=0.26),UCd and L-asparagine(r=−0.22),deoxycytidine and dehydroepiandrosterone sulfate(r=−0.32),deoxycytidine and homovanillic acid (r= −0.34),deoxycytidine and S-adenosylmethionine(r=−0.31),S-adenosylmethionine and L-asparagine(r=0.36),S-adenosylmethionine and dehydroepiandrosterone sulfate(r=0.53),S-adenosylmethionine and homovanillic acid(r=0.73),homovanillic acid and L-asparagine(r=0.37),homovanillic acid and dehydroepiandrosterone sulfate(r=0.51)as well as dehydroepiandrosterone sulfate and Lasparagine(r=0.23).It is worth noting that additional work is required to identify more endogenous metabolites in urine and to expand the depth and breadth of this altered profile.The current models had scientific merits but were not comprehensive.
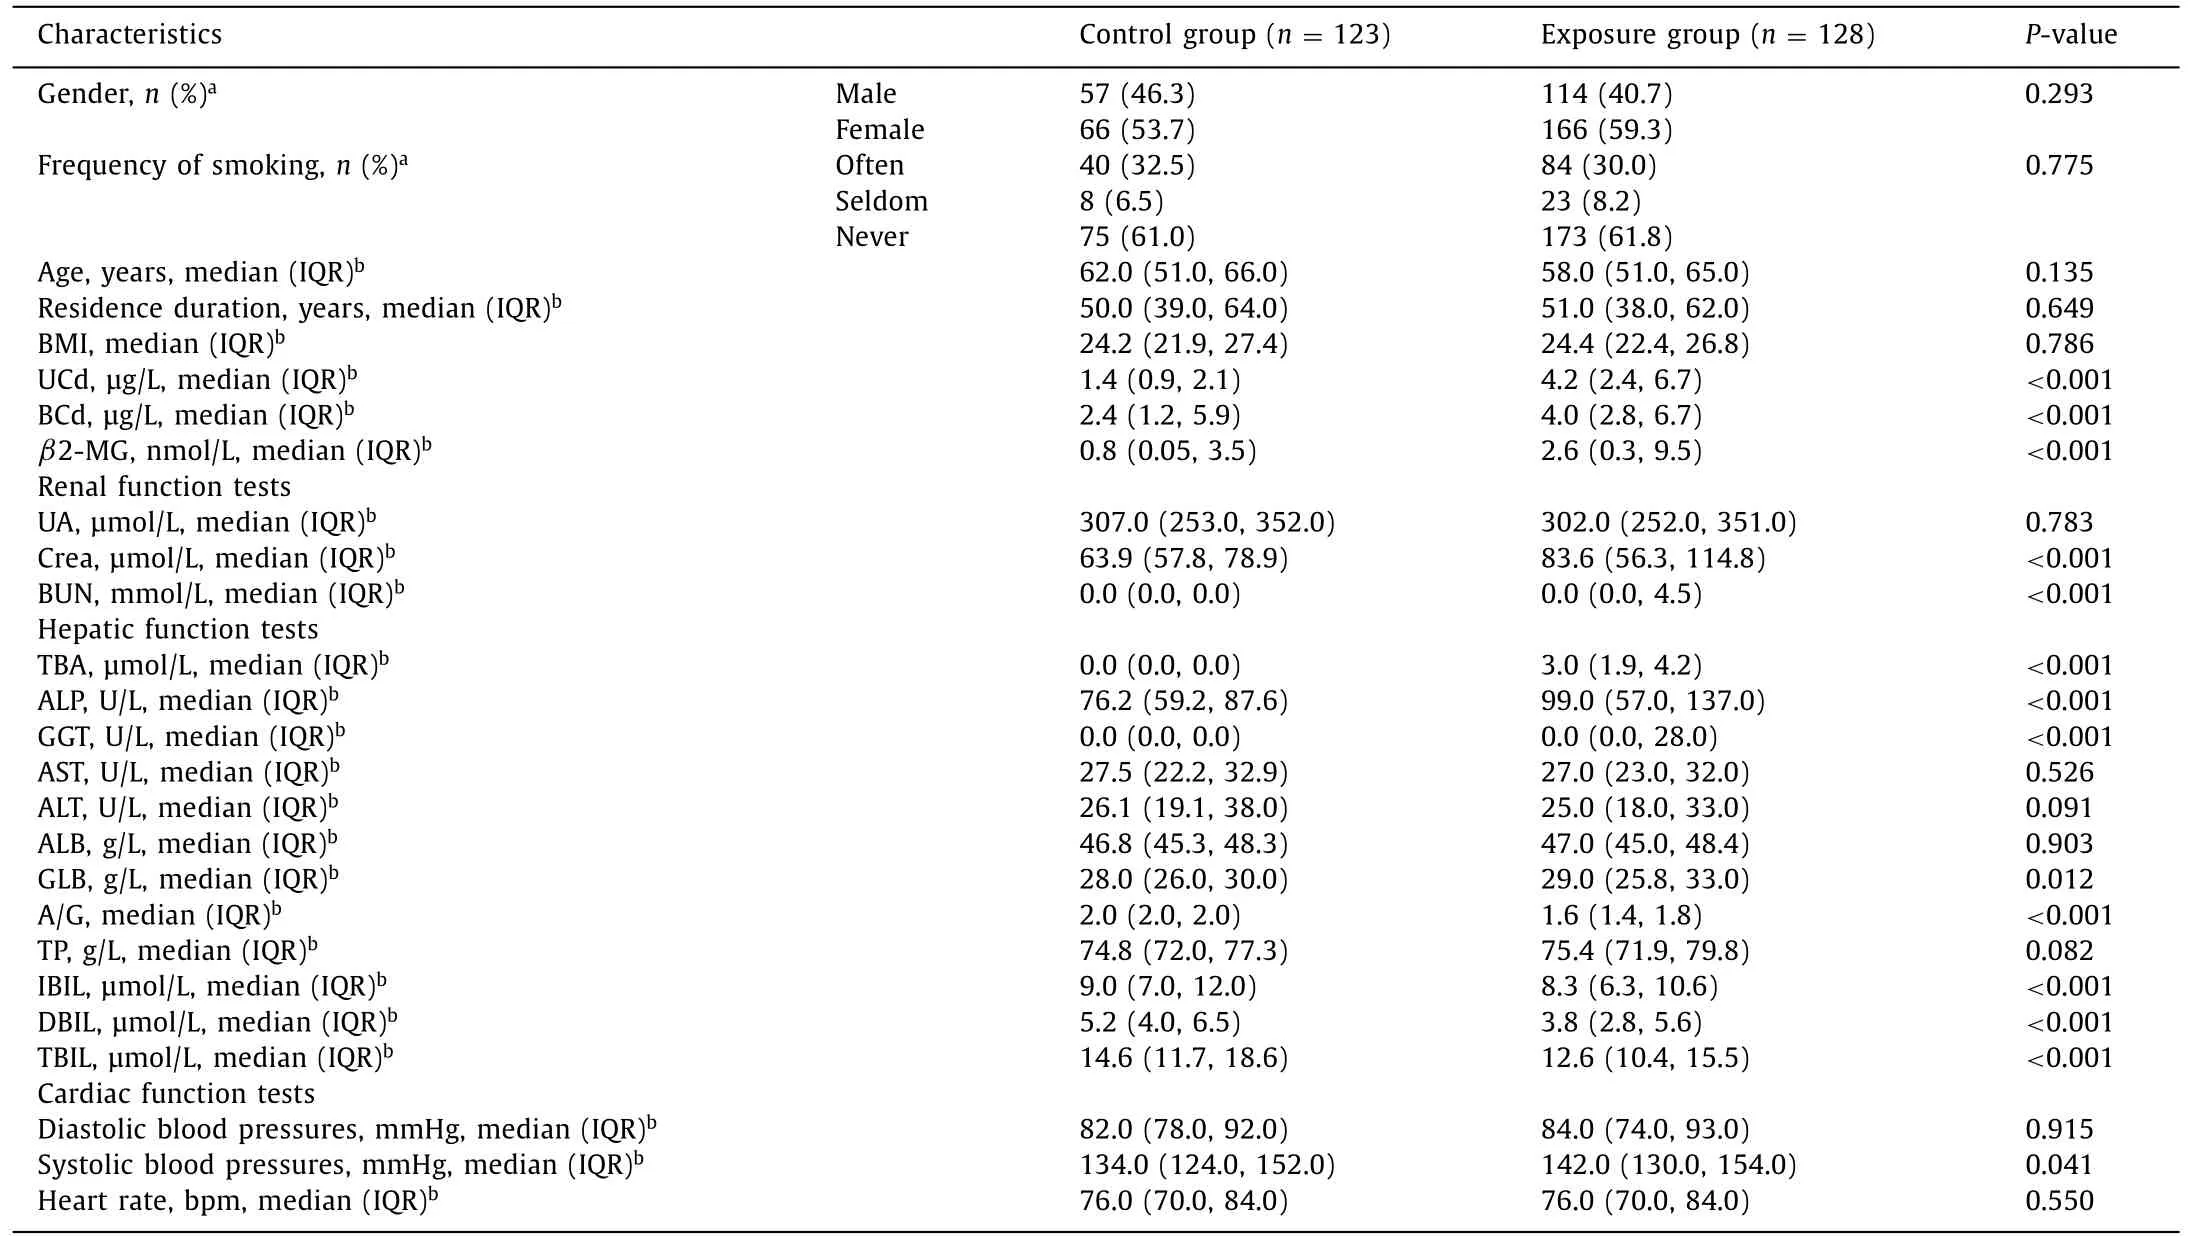
Table 1 Characteristics of the populations between Cd exposure and control group at baseline(n=403).
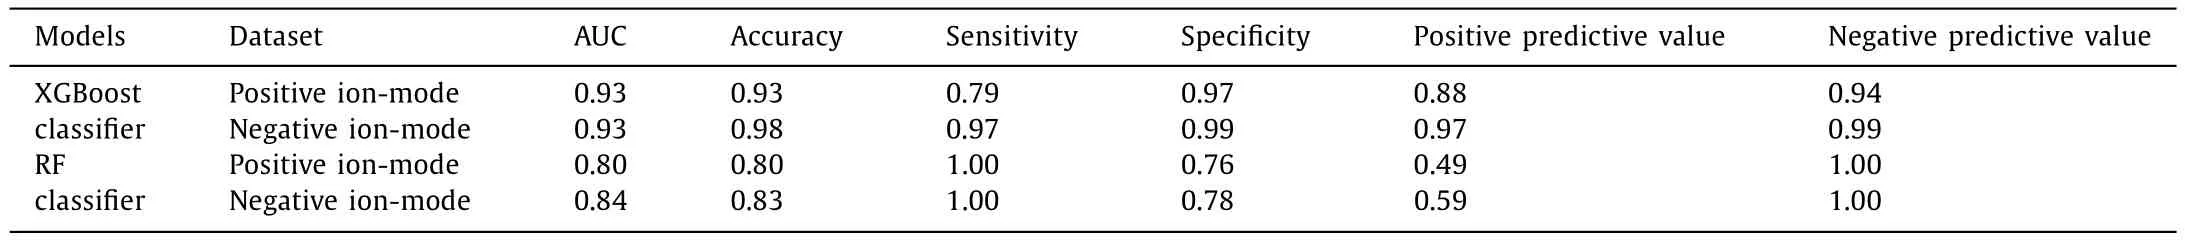
Table 2 Summary of 5-fold cross-validation result of different machine learning models on the dataset.
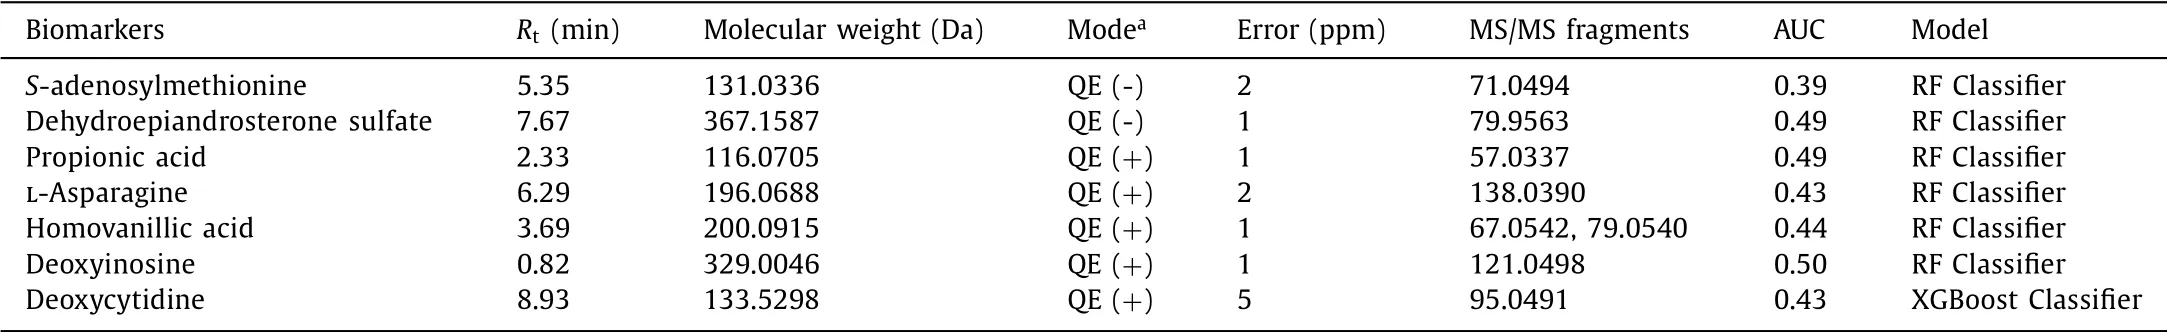
Table 3 Biomarkers identified from human urine under Cd exposure based on different machine learning models.
Although popular machine learning algorithms have been applied to predict Cd pollution in water springs,agricultural soil and lettuce leaves,to name a few[21–24],our research was the first study using seven different machine learning algorithms to screen potential biomarkers under Cd exposure based on human urine metabolic profiles.After the acquisition of MS data,fitting,coding,debugging,and fine-tuning of the specific machine learning algorithms,the XGBoost and RF classifiers showed better accuracy and predictive performance than others.These two algorithms are both decision tree-based supervised ensemble machine learning methods[25,26].To avoid overfitting,k-fold cross-validation is commonly used in these two algorithms[27].The most suitable one for our dataset is 5-fold cross-validation.The principles of various algorithms differ[28,29].The superior performances of XGBoost and RF classifiers in the present study may attribute to the skewed feature distributions and the unbalanced class distributions(123 control samples and 280 exposure samples)according to previous literature[30].XGBoost and RF classifiers are both promising in constructing predictive models and,as a result,providing variables of relatively high importance[31].To gain insights into these variables and several clinicopathologic characteristics,we may find more useful information hidden inside the high-dimensional mass spectrometry dataset.We trained and tested the models with a binary classified dataset(polluted or non-polluted)in this study.In reality,the polluted situations could be classified as non-polluted,low-polluted and high-polluted areas which would be more complex than binary classification.Thus,more human biological samples and optimized algorithms should be used to improve this multi-classification point in future studies.In short,the present study has added a new reference for selecting data-driven machinelearning algorithms for a metabolic analysis of urine upon Cd exposure.
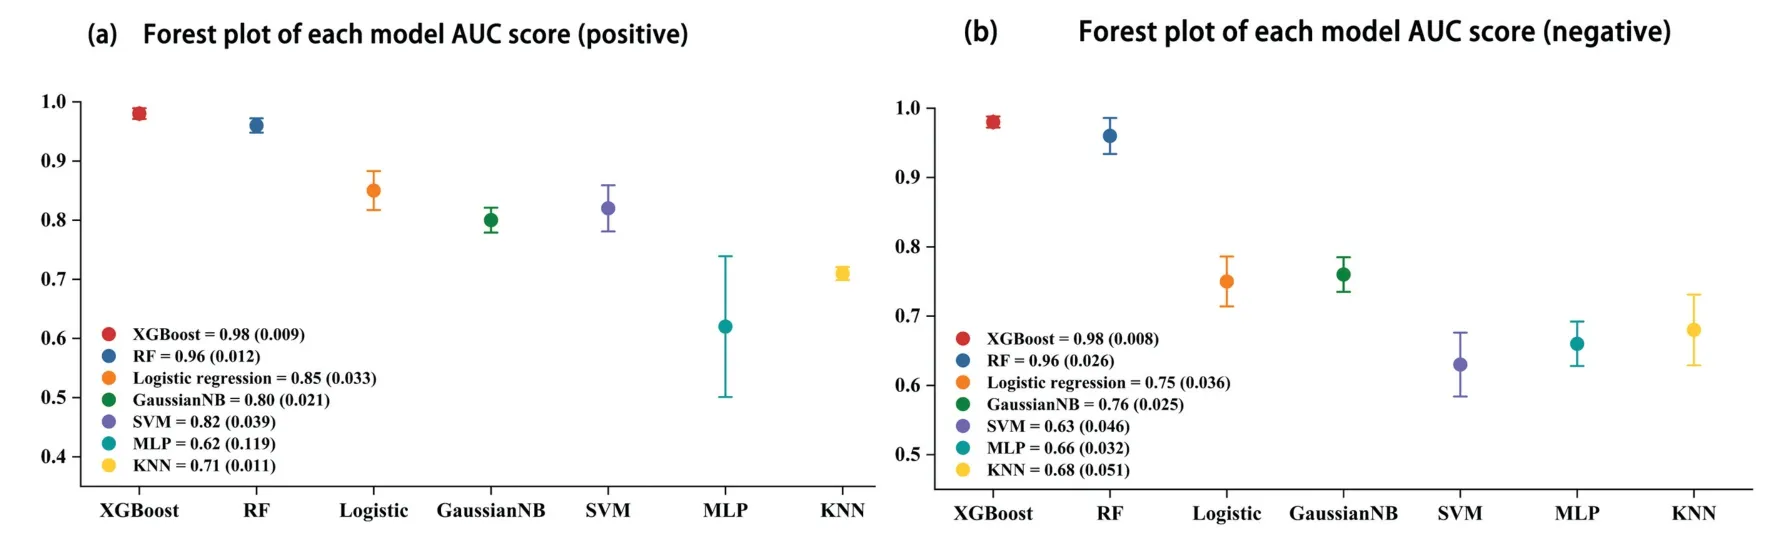
Fig.1.Forest plot of different machine learning algorithms based on positive(a)and negative(b)ionization mode mass spectra.The red,blue,orange,green,purple,light blue and light yellow represent the results from XGBoost,RF,Logistic regression,GaussianNB,SVM,MLP and KNN classifiers,respectively.
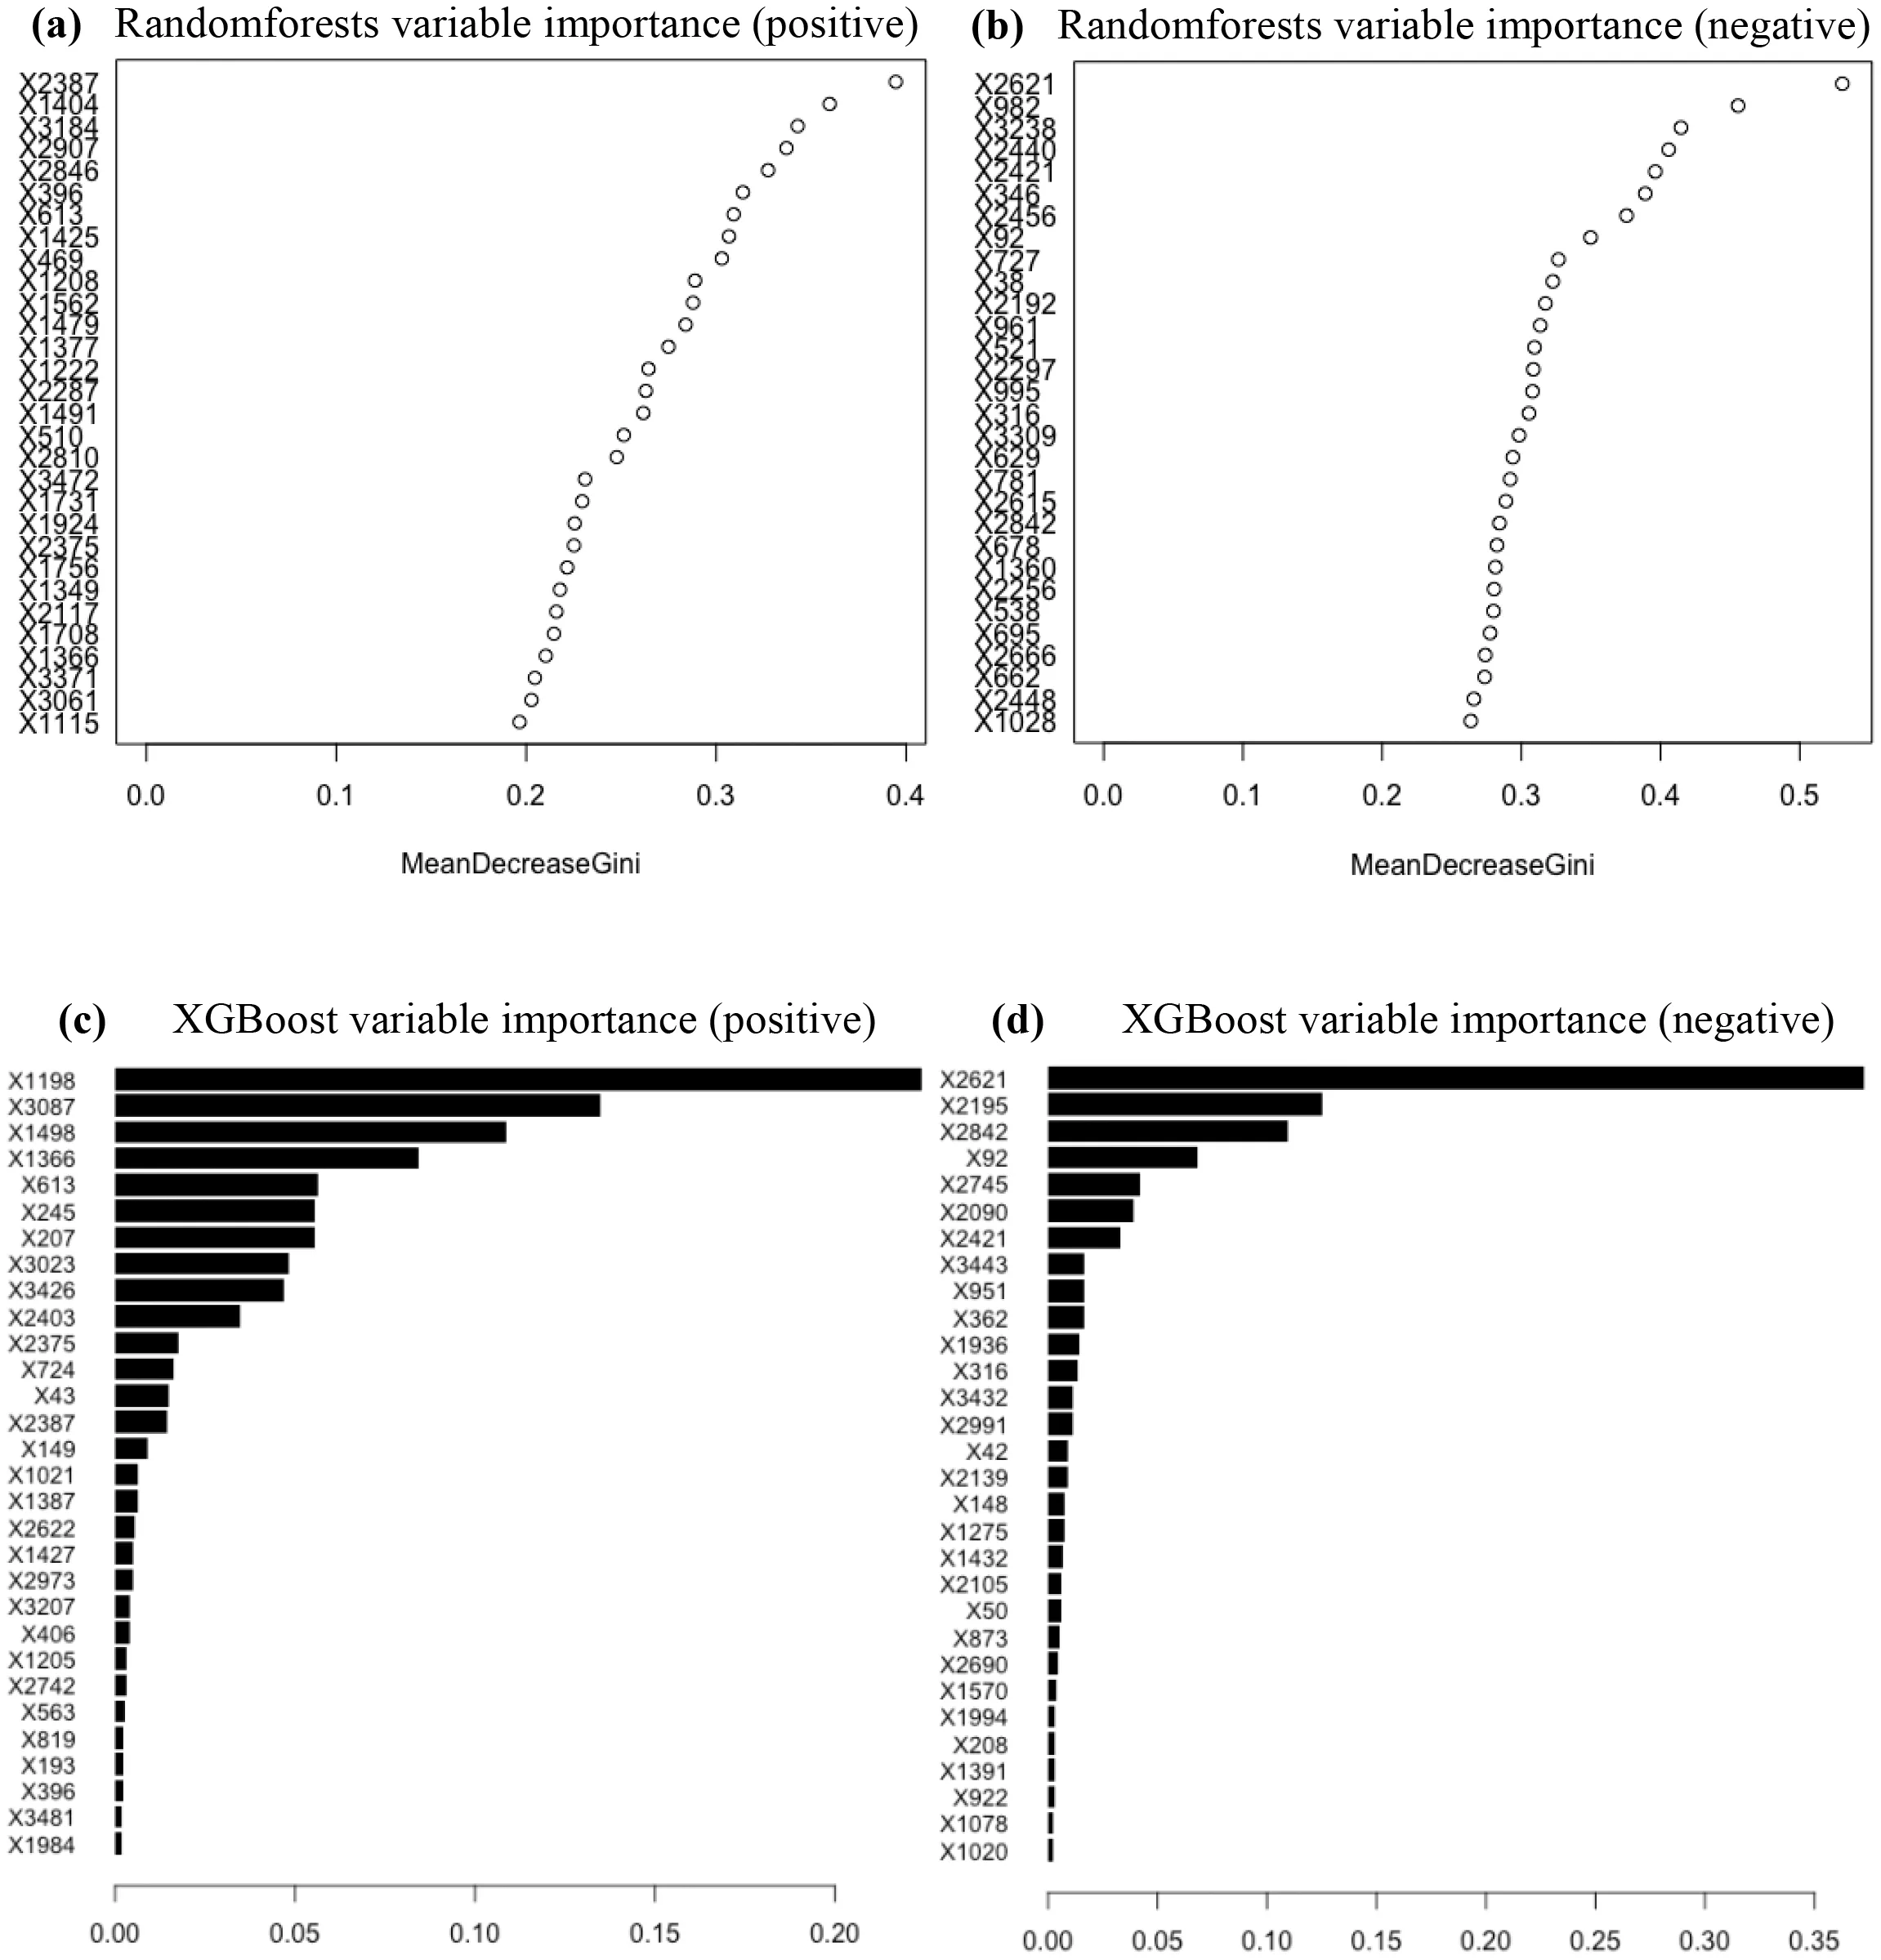
Fig.2.Top thirty features calculated from their feature importance selected from positive(a)and negative(b)ionization mode mass spectra based on the random forest classifier and positive(c)and negative(d)ionization mode mass spectra based on the extreme gradient boosting classifier.The x-axis represents the results of mean decrease Gini and weight-based feature importance to RF and XGBoost classifiers,respectively.
Due to the public health concerns about Cd,many metabolomics studies have been conducted.These reports have evidenced that amino acid metabolism,carbohydrate metabolism,purine metabolism,steroid hormone biosynthesis,creatine pathway,fatty acid oxidation,lipid metabolism,etc.would be influenced by Cd exposure[32–35].The biomarkers identified in this study were related to the changes in amino acid metabolism(Sadenosylmethionine,L-asparagine and homovanillic acid),purine metabolism (deoxyinosine)and steroid hormone biosynthesis(dehydroepiandrosterone sulfate).By convention,the aberration of amino acid metabolism indicated its energy expenditure under Cd exposure.As an illustration,S-adenosylmethionine,metabolized from the essential amino acid,methionine,is related to liver disease[16].Concomitantly,purine metabolism is associated with nephrotoxicity[36,37].The alteration of purine metabolism in this study also indicated the influence of Cd on the kidney.Dehydroepiandrosterone sulfate is a rich circulating steroid in humans and the steroid hormone biosynthesis dedicates to the normal development of the individual.These findings were generally consistent with the previous reports.As shown in the Spearman correlation analysis,the positive correlation coefficient between the concentration of UCd and BCd,two typical indexes for evaluating Cd exposure,was relatively higher than others.It was worth mentioning that mean decrease Gini and weight-based feature importance ranking were applied to RF and XGBoost classifiers,respectively.Other feature selection methodologies in these two algorithms could also be good alternatives for obtaining metabolic information to distinguish Cd exposure from control.Inferred from the information about hepatic and renal damage collected in the present study(Table 1)and supported by similar findings in the previous study[38–41],we concluded that the liver and kidney were susceptible to Cd exposure regardless of acute and chronic toxicity.As more and more omics data are accumulated[42,43],artificial intelligence-based techniques in combination with omics might be effective in recognizing unknown metabolic biomarkers and pathways,allowing for personalized risk assessments.
In conclusion,we acquired high-resolution mass spectrometry datasets from 403 human urine samples,trained XGBoost and RF classifiers and identified a biomarker panel under Cd exposure.Taking into account the vast potential of big data,prospective risk stratification of machine learning algorithms,more sophisticated models are needed based on the two algorithms.
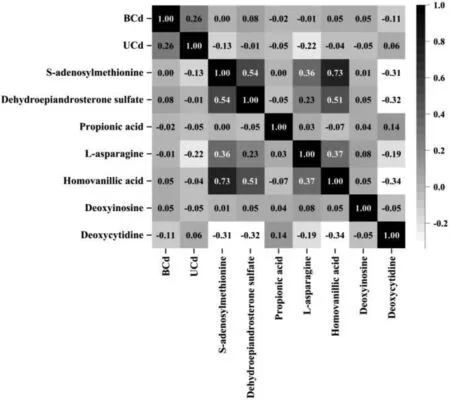
Fig.3.Spearman correlation matrix of the identified compounds from human urine under Cd exposure.
Declaration of competing interest
The authors declare that they have no known competing financial interests or personal relationships that could have appeared to influence the work reported in this paper.
Acknowledgment
This work was supported by the National Key Research and Development Program of China(No.2017YFC1600500).
Supplementary materials
Supplementary material associated with this article can be found,in the online version,at doi:10.1016/j.cclet.2022.03.020.
 Chinese Chemical Letters2022年12期
- Chinese Chemical Letters的其它文章
- Diverse strategic approaches en route to Taxol total synthesis
- Recent advances in gold-complex and chiral organocatalyst cooperative catalysis for asymmetric alkyne functionalization
- Unmodified methodologies in target discovery for small molecule drugs:A rising star
- Recent advances in single-crystalline two-dimensional polymers:Synthesis,characterization and challenges
- Environmental applications of graphene oxide composite membranes
- Recent advances in the application of metal organic frameworks using in advanced oxidation progresses for pollutants degradation