Dynamics of Phaeocystis globosa bloom and implications for its seed sources in the Beibu Gulf, China*
Zhuang NIU ,Weibing GUAN , Jinxiu WANG , Yongquan YUAN ,Fanzhou KONG , , Chao LIU , ,6, Qingchun ZHANG , ,**, Rencheng YU , ,6
1 CAS Key Laboratory of Marine Ecology and Environmental Sciences, Institute of Oceanology, Chinese Academy of Sciences,Qingdao 266071, China
2 Laboratory for Marine Ecology and Environmental Science, Pilot National Laboratory for Marine Science and Technology(Qingdao), Qingdao 266237, China
3 State Key Laboratory of Satellite Ocean Environment Dynamics, Second Institute of Oceanography, Ministry of Natural Resources, Hangzhou 310012, China
4 School of Oceanography, Shanghai Jiao Tong University, Shanghai 200030, China
5 Center of Ocean Mega-Science, Chinese Academy of Sciences, Qingdao 266071, China
6 University of Chinese Academy of Sciences, Beijing 100049, China
Abstract Algal blooms of haptophyte Phaeocystis globosa have been recorded in the Beibu Gulf,South China Sea (SCS) since 2011. Recent evidence suggests that Type I and Type Ⅳ are the two dominant genotypes of P. globosa coexisting in this area, and their marker pigment prof iles, colony sizes, and genetic information diff er. Two genotype-specif ic quantitative polymerase chain reaction (qPCR) assays were used to clarify the distribution and dynamics of P. globosa bloom in the Beibu Gulf from November 2018 to February 2019. Results show that the patterns of spatial-temporal distribution of Type I and Type Ⅳ were similar, the abundance of Type Ⅳ was higher than that of Type I during the algal bloom, and thus Type Ⅳcells dominated the P. globosa bloom in winter 2018. The relationships between environmental factors and P. globosa abundance indicated that temperature and nitrate were critical to the distribution and dynamics of P. globosa blooms in this area. The distribution of P. globosa cells in diff erent water masses before the bloom revealed that the westward water via the Qiongzhou Strait, the SCS bottom water, and the current in the northwestern waters of Hainan Island could transport P. globosa cells into the Beibu Gulf serving as the seed sources triggering the intense blooms in the Beibu Gulf.
Keyword: Phaeocystis globosa; harmful algal bloom (HAB); Beibu Gulf; environmental factor; seed source
1 INTRODUCTION
HaptophytePhaeocystisglobosais a cosmopolitan bloom-forming species and often occurs in blooms of gelatinous colonies in temperate and tropical coastal waters (Schoemann et al., 2005), seriously threatening the coastal ecosystem and aquaculture f ishery because of its toxic hemolytic substances and the formed foams after colony decay (Chen et al., 1999; Shen et al., 2018b). Since 1997, there have been frequent outbreaks ofP.globosablooms in the South China Sea (SCS) in the form of centimetersized giant colonies (Chen et al., 1999; Qi et al.,2004), much larger than those ofP.globosain other regions, such as the Atlantic North Sea, a region with high-frequencyP.globosablooms (Rousseau et al.,1990; Madhupratap et al., 2000). In the winter of 2011, aP.globosabloom was f irstly recorded in the Beibu Gulf (Qin et al., 2016) and has since become a recurrent phenomenon (He et al., 2019; Wang et al., 2019a), threatening the safe operation of power stations along the coastline in this region (Cao et al.,2017; He et al., 2019).
As a semi-closed gulf in the northwest of the SCS, the Beibu Gulf covers an area of 1.27×10⁵km2in average depth of approximately 40 m, and borders Vietnam to the west, and Guangxi Zhuang Autonomous Region,Leizhou Peninsula, and Hainan Island of China to the east and north. With the rapid development of the population, industry, and economics in the coastal regions, the input of dissolved inorganic nitrogen(DIN) and phosphate (DIP) into the Beibu Gulf increased rapidly, which is conducive to the increase in harmful algal bloom (HAB) events in this area (Xu et al., 2019). The hydrodynamics of the Beibu Gulf are complex (Shen et al., 2018a). The direction of summer circulation is not fully understood, and winter circulation is conf irmed to be counterclockwise (Hu et al., 2000), implying that the coastal water from Guangdong Province can enter the Beibu Gulf via the Qiongzhou Strait and enhance the formation of winter circulation (Chen et al., 2019). In addition,northeasterly monsoonal winds drive upwelling in the Beibu Gulf in winter (Tang et al., 2003; Shen et al.,2018). The complex hydrodynamics result in diff erent temporal and spatial distribution of water masses from diff erent sources in the Beibu Gulf (Cao et al., 2019).However, little is known of the relationship between the complex hydrodynamics and the distribution ofP.globosablooms in the Beibu Gulf.
Cumulative evidence suggests that diff erent geographical strains ofP.globosahave variable colony sizes and pigment prof iles, and maintain a high level of genetic diversity (Zapata et al., 2004; Medlin and Zingone, 2007; Smith et al., 2014). Recently,two genotypes (Type I and Type Ⅳ) ofP.globosahave been demonstrated to co-exist in the Beibu Gulf (Song et al., 2020, 2021; Zhang et al., 2021;Niu et al., 2022). Type I cells possess two marker pigments, 19ʹ-hexanoyloxyfucoxanthin (Hex-fuco)and 19ʹ-butanoyloxyfucoxanthin (But-fuco), and form small colonies (<0.3 cm in diameter), and TypeⅣ cells contain a unique marker pigment, But-fuco,and produce centimeter-sized giant colonies (Wang et al., 2019a; Niu et al., 2022; Zhang et al., 2022). Much less is known about the relationships between the spatiotemporal distribution of these two genotypes and the dynamics ofP.globosablooms in the Beibu Gulf. Recently, two genotype-specif ic quantitative polymerase chain reaction (qPCR) methods targeting the mitochondrialatp8 gene have been developed to quantitatively detect Type I and Type ⅣP.globosa.Both qPCR assays have a wide detection range and high sensitivity, with the lowest quantitative detection limit of 30 cells/L (Niu et al., 2022), providing helpful tools to quantify the cell abundance of Type I and Type Ⅳ in the Beibu Gulf.
Therefore, the aims of this study are to quantify the spatiotemporal distribution of Type I and TypeⅣP.globosain the Beibu Gulf during its bloom in winter 2018, to analyze the response ofP.globosato environmental factors, and to identify the potential seed sources ofP.globosatriggering the intense blooms, based on the distribution ofP.globosacells in diff erent water masses before bloom.
2 MATERIAL AND METHOD
2.1 Sample collection
Three investigations were performed in the Beibu Gulf during theP.globosabloom in November 2018 and January 2019, and February 2019. The f irst investigation covered 31 sampling sites; the last two investigations covered 28 sampling sites, excluding three southern sampling sites (ZN0-1, ZN0-2, and ZN0-3) (Fig.1). The seawater temperature, salinity,and excess water density were detected in situ using SBE-9 plus conductivity-temperature-depth(CTD) sensors (SBE 911, Sea-Bird Electronics).Approximately 2 L of seawater was collected from the surface, middle, and bottom of the water column,respectively; and then, 1-L and 0.5-L subsamples were f iltered through a 0.4-μm polycarbonate (PC)membrane (Millipore, USA) and a combusted glass f iber membrane (GF/F, Whatman) under a 40-kPa vacuum, respectively. The f iltered membranes were frozen in liquid nitrogen in situ and stored at -80 °C for DNA and chlorophyll-a(Chl-a) extraction. And 60-mL seawater f iltered by a GF/F membrane was stored frozen at -20 °C for nutrient analysis.
2.2 DNA extraction and qPCR amplif ication

Fig.1 Map of the Beibu Gulf and sampling sites (black dots)
The genomic DNA of seawater samples was extracted using a modif ied cetyltrimethylammonium bromide (CTAB) method (Winnepenninckx et al.,1993) and dissolved in 30-μL Tris-EDTA buff er solution (TE) before being stored at -20 °C. The qPCR reactions with the specif ic primer pairs and probes(Supplementary Table S1) were performed to detect the two genotypes ofP.globosain a Bio-Rad C1000 thermal cycler (Bio-Rad, USA) following the previous study (Niu et al., 2022). The qPCR reaction of Type I was performed in a total volume of 10 μL with 5 μL of 2× qPCR buff er (TaKaRa, Beijing, China), 3.1 μL of ddH2O, 0.3 μL of 10-nmol/L forward primer, 0.3 μL of 10-nmol/L reverse primer, 0.3 μL of 10-nmol/L probe,and 1 μL of DNA template. And the qPCR reaction of Type Ⅳ was done with 5 μL of 2× qPCR buff er(TaKaRa, Beijing, China), 3.4 μL of ddH2O, 0.2 μL of 10-nmol/L forward primer, 0.2 μL of 10-nmol/L reverse primer, 0.2 μL of 10-nmol/L probe, and 1 μL of DNA template in a f inal volume of 10 μL. Both the two qPCR assays were run at 95 °C for 30 s, followed by 40 cycles of 95 °C for 5 s and 60 °C for 30 s. The establishment of calibration curve and the limit of quantitative detection for the two assays were presented in the Supplementary materials (Supplementary Figs.S1 & S2).
2.3 Measurement of nutrients
Five nutrients (ammonium, nitrite, nitrate, phosphate,and silicate) were analyzed using a continuous f low analyzer (SKALAR, Breda, Netherlands) according to the protocol in Yuan et al. (2019).
2.4 Water mass characterization
To explore the eff ects of water masses on the cell abundance and distribution of two genotypes ofP.globosain the Beibu Gulf, the classif ication and distribution of water masses, including the coastal water (CW), SCS bottom water (BW), SCS mixed water (MW) in this area from November 2018 to February 2019, were analyzed based on CTD data,using theK-mean clustering method as described in the previous study (Cao et al., 2019). The CW water mass with low salinity (<32) from the river discharges is limited to a small strip on the coast of Guangxi Zhuang Autonomous Region, and the BW water mass with high salinity (>33) and low temperature is mainly formed by seawater intrusion from SCS off shore waters outside the Gulf. And according to the source of mixed water, the MW is subdivided into two parts from the Qiongzhou Strait (MW-Q) and the southern Beibu Gulf (MW-S).
2.5 Data analysis
Statistical analysis of raw data was performed using IBM SPSS Statistics 26 (IBM, Armonk, NY,USA). The horizontal and prof ile distribution of twoP.globosagenotypes was determined using Surfer 13.0 (Golden Software Inc., USA). The CANOCO 5.0 (Microcomputer Power, USA) was used to explore the relationship between environmentalfactors and two genotypes ofP.globosa. The result of detrended correspondence analysis (DCA)performed in CANOCO 5.0 revealed that the Type I and Type Ⅳ abundance exhibited a linear response to environmental factors, thus redundancy analysis(RDA) combined with Monte Carlo test (499 permutations) as a linear constrained ordination method was chosen for data analysis. In addition,Pearson correlation coeffi cients and two-tailed test were also used to evaluate correlation between environmental factors and the distribution of two genotypes ofP.globosa.
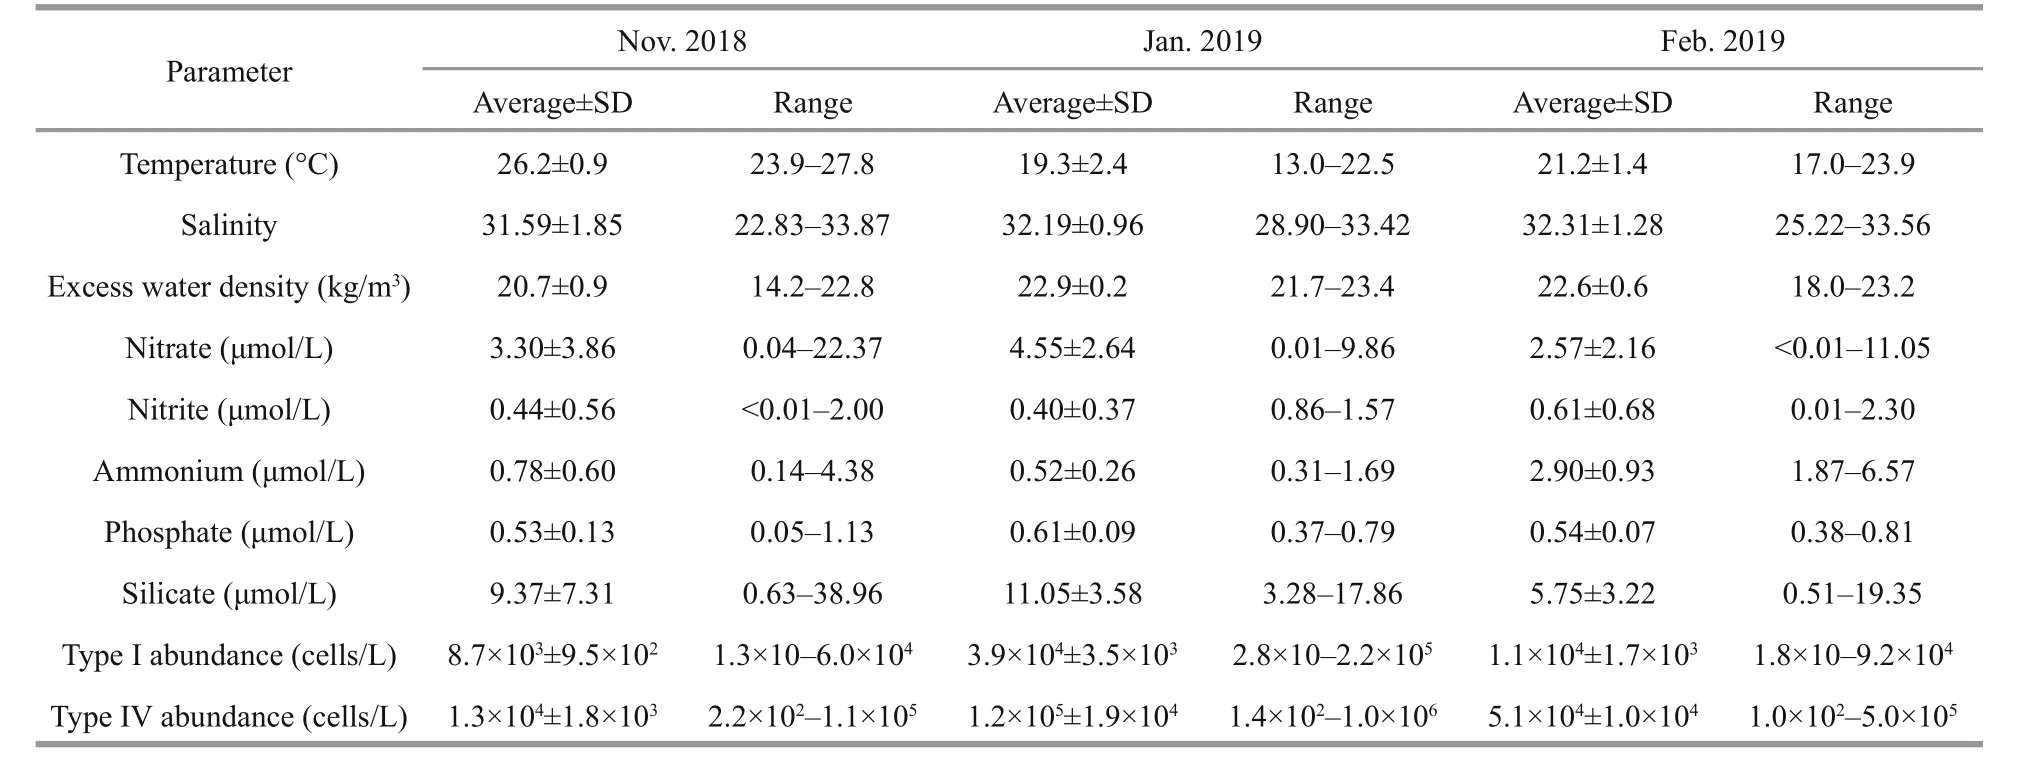
Table 1 Averages of temperature, salinity, nutrients, and chlorophyll a and abundance of Type Ⅰ and Type Ⅳ of Phaeocystis globosa in the Beibu Gulf from November 2018 to February 2019
3 RESULT
3.1 Dynamics of temperature, salinity, nutrients and Phaeocystis globosa abundance during the bloom
During the three investigations, the average temperature of water column was 26.2 °C in Nov.2018, decreased sharply to 19.3 °C in Jan. 2019,and increased to 21.2 °C in Feb. 2019. The average salinity gradually increased from 31.59 to 32.31 during the three investigations. The excess water density exhibited the lowest average value of 20.7 kg/m3,ranging from 14.2 to 22.8 kg/m3in Nov. 2018, and increased markedly to 22.9 kg/m3in Jan. 2019 and 22.6 kg/m3in Feb. 2019 (Table 1).
The average concentrations of nitrate and silicate showed a similar change trend, peaking in Jan.2019 and then decreasing to the lowest level in Feb.2019. Nitrite slightly decreased from Nov. 2018 to Jan. 2019, and peaked 0.61 μmol/L in Feb. 2019.Ammonium decreased from 0.78 to 0.52 μmol/L and then sharply increased to 2.90 μmol/L in Feb. 2019.Phosphate increased to 0.61 μmol/L in Jan. 2019, then down to the same level in Feb. 2019 as in Nov. 2018(Table 1).
The abundance of Type Ⅳ cells was higher than that of Type I cells during the three investigations.In Nov. 2018, the average abundances of Type I and Type Ⅳ were 8.7×10³and 1.3×10⁴cells/L, and subsequently increased to 3.9×10⁴and 1.2×10⁵cells/L in Jan. 2019, and then decreased to 1.1×10⁴cells/L and 5.1×10⁴cells/L in Feb. 2019, respectively (Table 1).
3.2 Horizontal distribution of hydrological factors and Phaeocystis globosa
The variations in the sea surface temperature (SST)and the sea bottom temperature (SBT) were similar during the three surveys (Fig.2). In Nov. 2018, the average SST was 26.3 °C, with the highest value of 27.8 °C at the site ZN0-2, and it decreased gradually toward inshore (Fig.2a). The SBT ranged from 23.9 °C to 27.6 °C in the survey area in Nov. 2018, and there was a high-temperature (>27.0 °C) zone in the middle of southern section that extended from site ZN0-3 to site ZN3-3 (Fig.2b). The lowest average seawater temperature was in Jan. 2019 (Table 1). In this month,the high-temperature zone (22.5 °C at the surface and 22.4 °C at the bottom) was in the south of the Gulf and gradually decreased toward the north (Fig.2c–d).During the last survey in Feb. 2019, the temperature did not change signif icantly throughout the study area (Fig.2e–f), and the surface and bottom average temperatures were 21.3 °C and 20.8 °C, respectively.
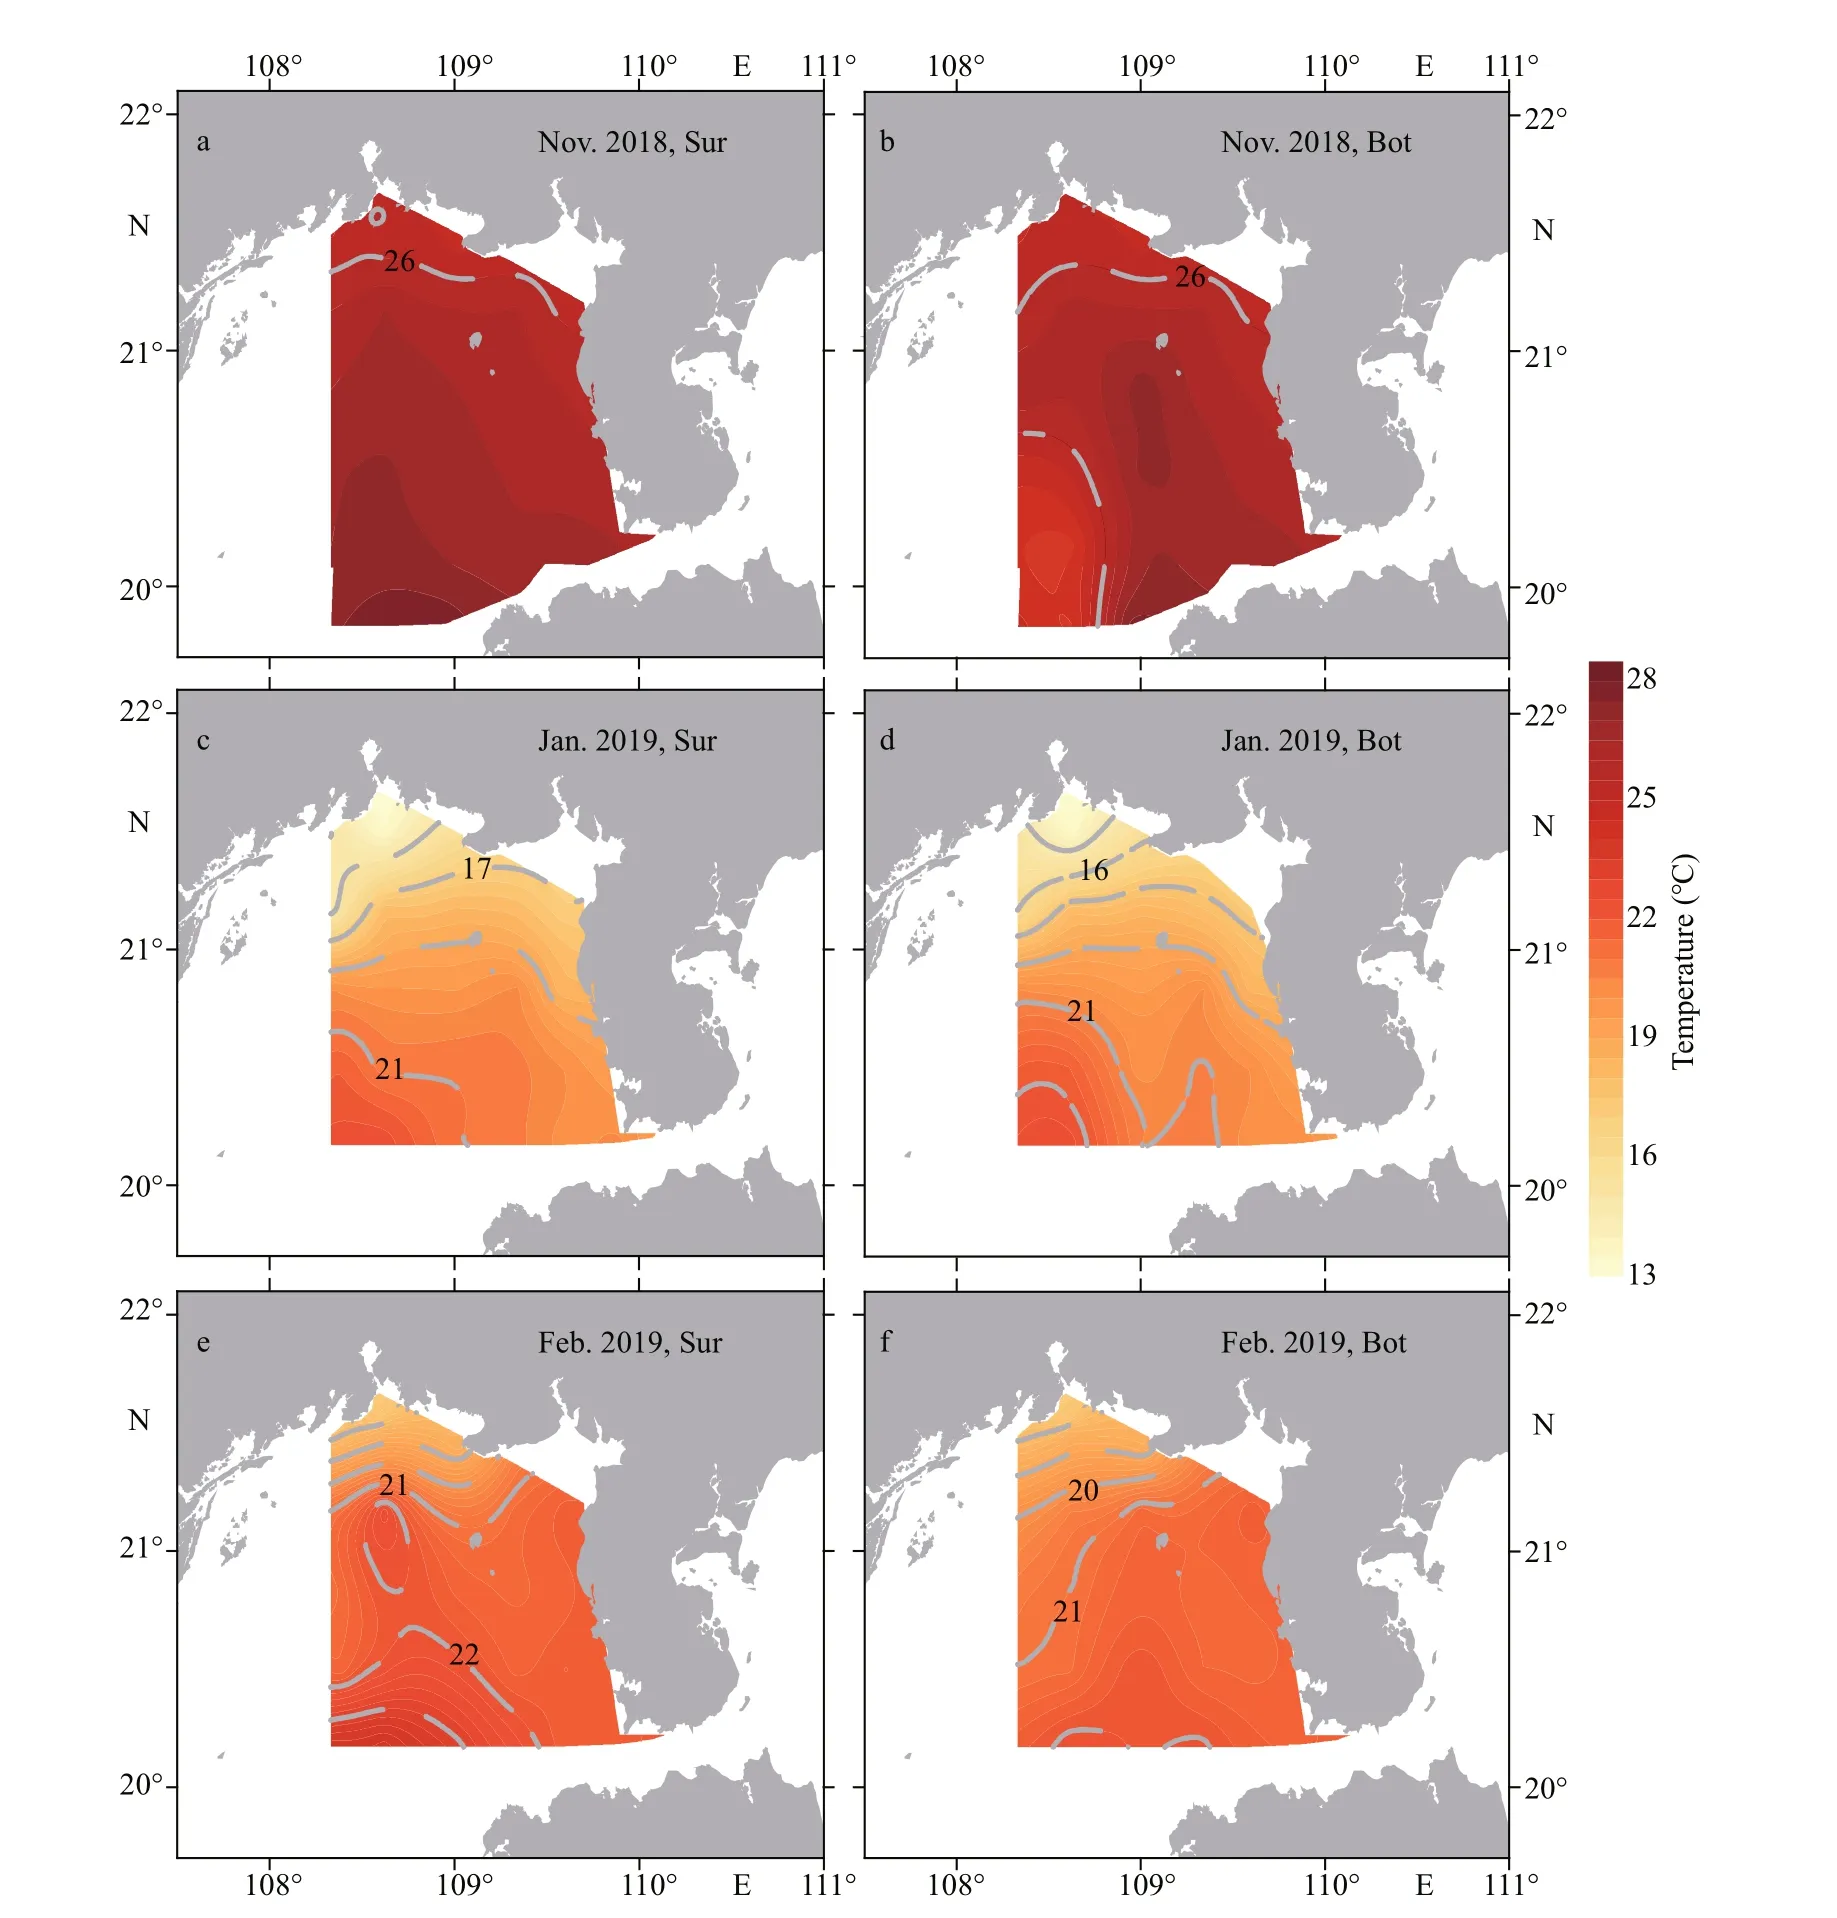
Fig.2 Distribution of temperature at surface (Sur) and bottom (Bot) of the Beibu Gulf from November 2018 to February 2019
The variations in sea surface salinity (SSS) and sea bottom salinity (SBS) were similar, ranging 22.8–33.5 and 23.0–33.9, respectively, in the three investigations. In Nov. 2018, the high-salinity water mass (>31.5) was located in the southwest waters and intrude northward and northeastward into the inshore.Notably, this high-salinity water mass separated the low-salinity water in Qinzhou Bay and southwest of the Leizhou Peninsula (Fig.3a–b). Subsequently,SSS and SBS increased and reached higher average values of 31.9 and 32.0 in Jan. 2019, respectively.High-salinity water (>32.5) occurred at the mouth of the Qiongzhou Strait and southwest of survey area and gradually decreased toward the coastline of Guangxi Zhuang Autonomous Region (Fig.3c–d).Seawater salinity continued to increase during the last investigation in Feb. 2019 (Table 1). High-salinity water (>32.5) f illed the survey area, excluding the low-salinity zones in the waters of Qinzhou Bay and the mouth of the Qiongzhou Strait (Fig.3e–f).
The surface and bottom distribution of excess water density was similar to that of salinity during the three surveys. In Nov. 2018, the high-density water intruded from the southwest of study area to the inshore of Beihai City and separated the lowdensity water in Qinzhou Bay and the southwest of Leizhou Peninsula (Fig.4a–b). In Jan. 2019, the high excess water density was located uniformly in the survey area, and there was a strip with a slightly lower density from the center of section ZN I (22.7 kg/m3) to the coast of Beihai City (Fig.4c–d). The excess water density in February was slightly lower than that in January and gradually decreased from the southwest
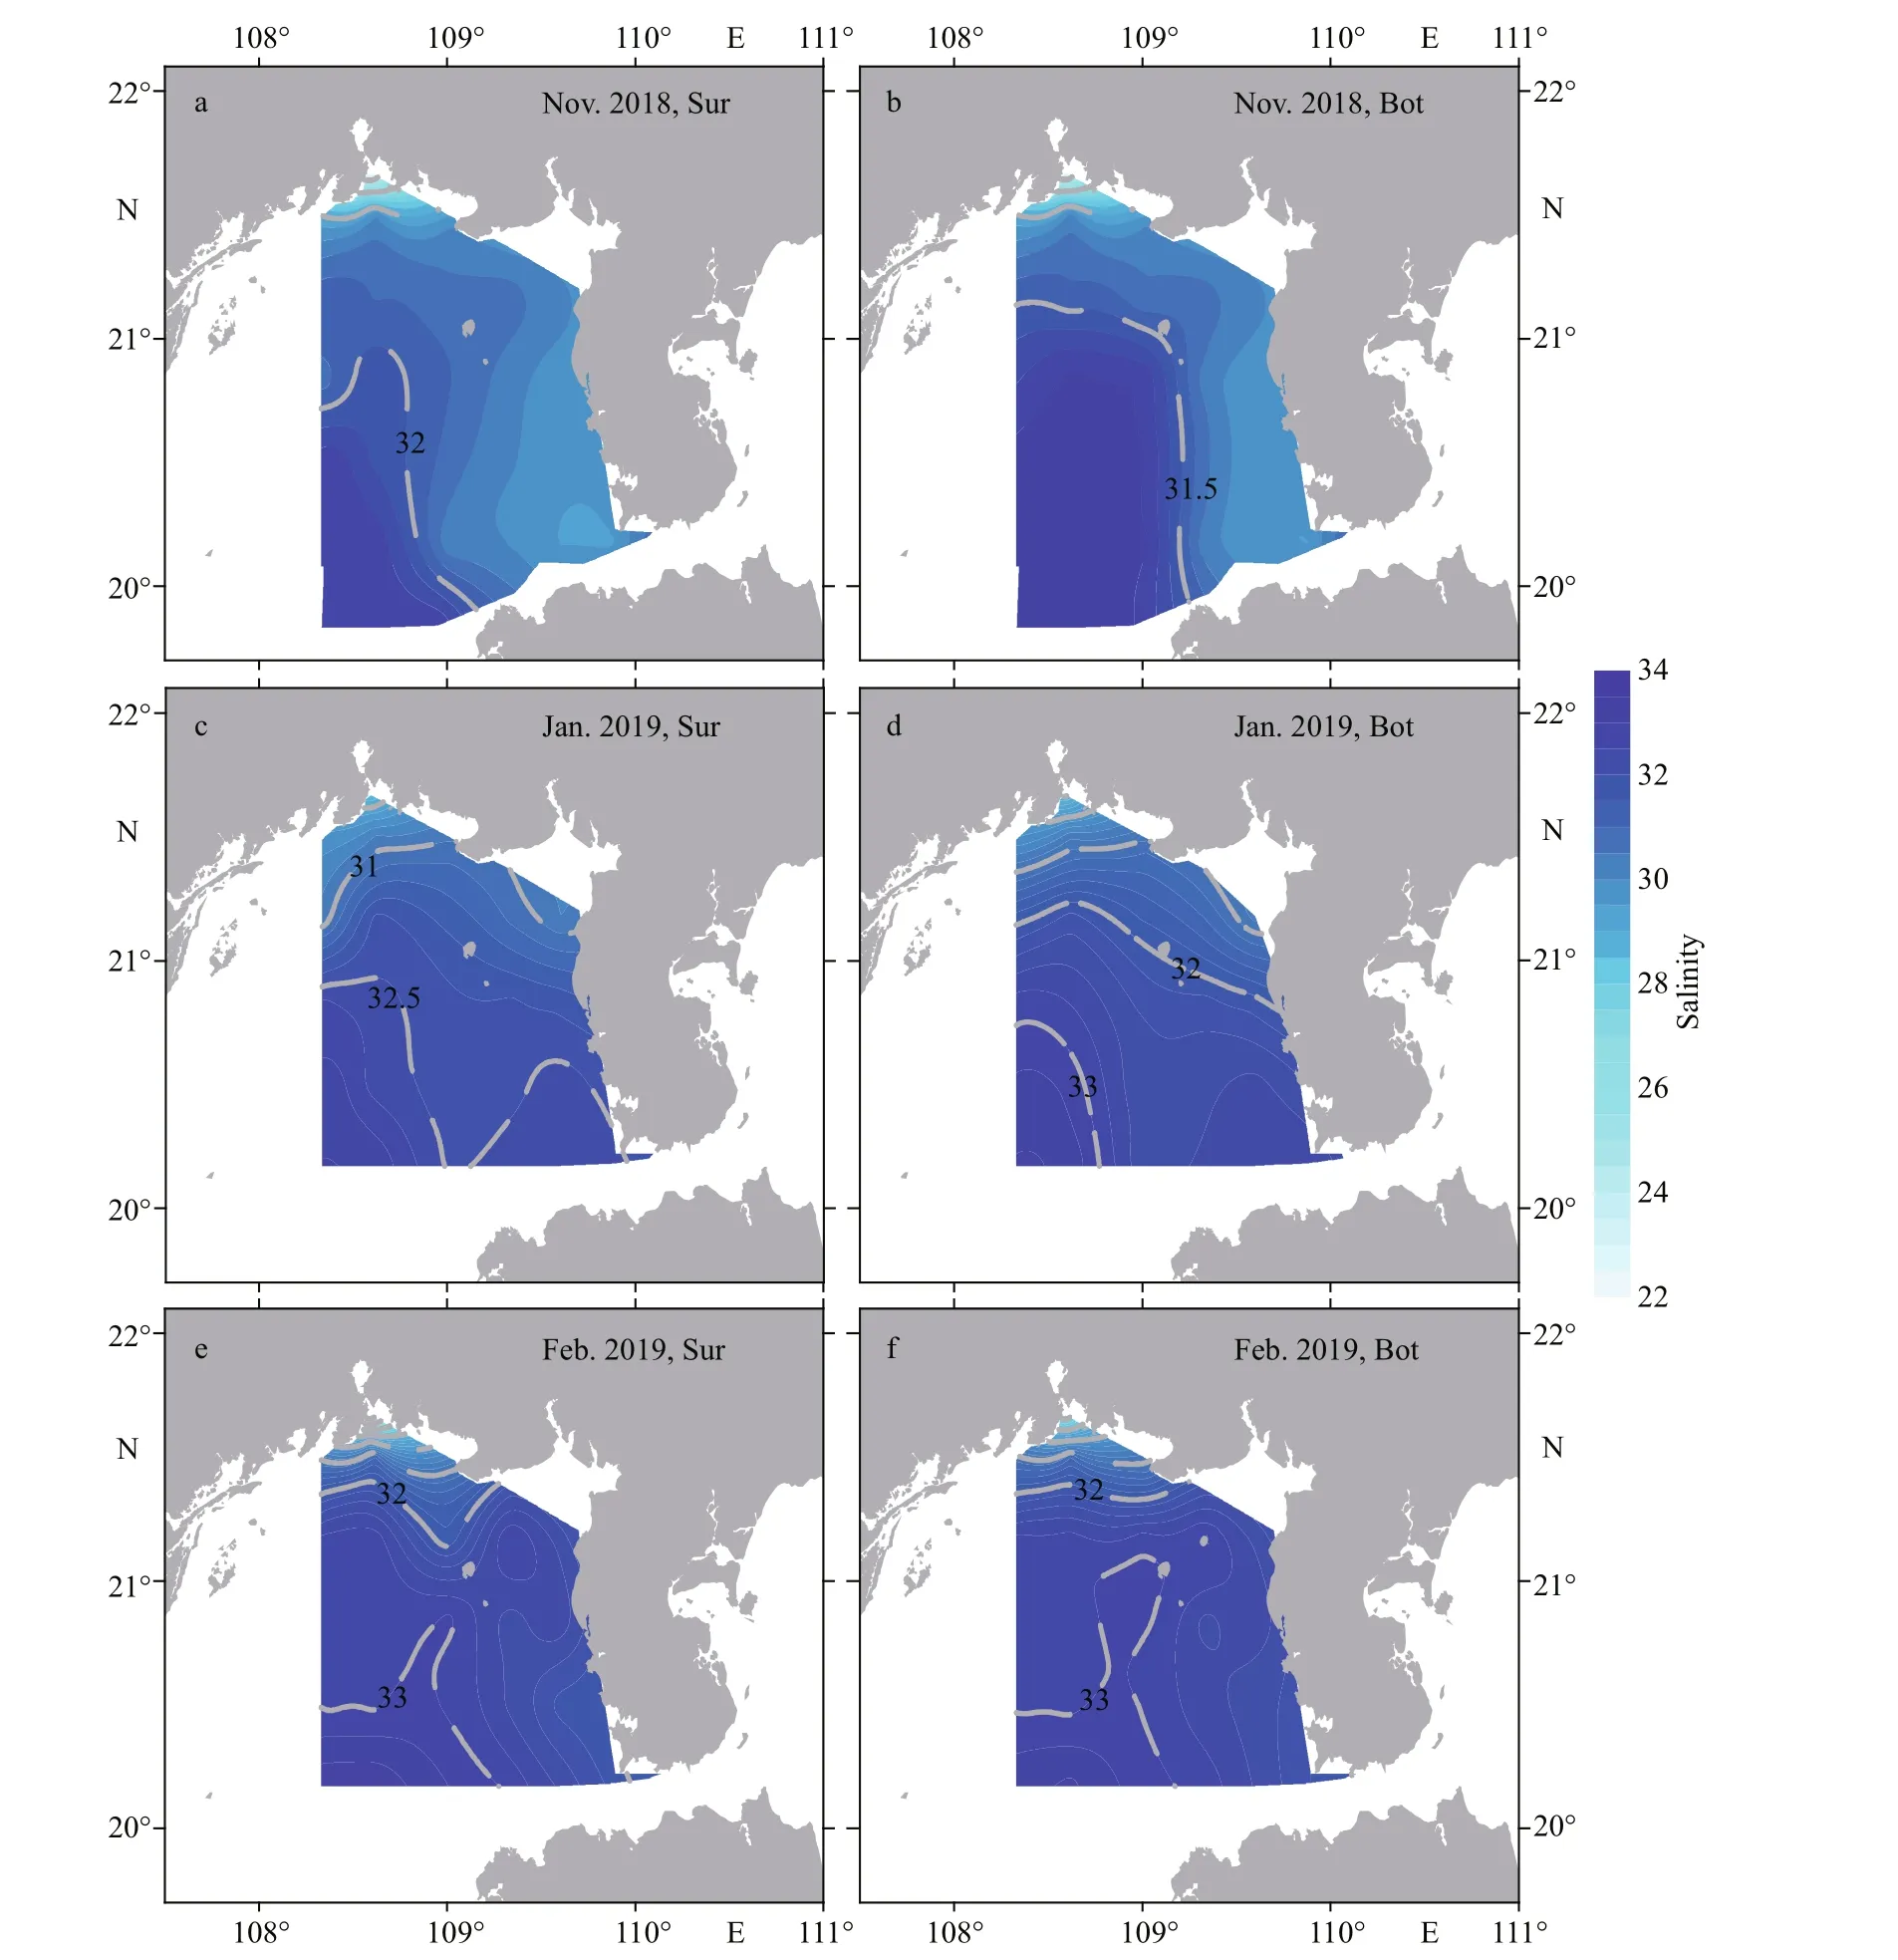
Fig.3 Distribution of salinity at surface (Sur) and bottom (Bot) of the Beibu Gulf from November 2018 to February 2019
of the Beibu Gulf to the inshore area (Fig.4e–f).
In Nov. 2018, the inshore area was dominated by the MW-Q, except for the CW at site ZN5-3, and the BW and MW-S on the southwest off shore surface and bottom (Fig.5a–b). In Jan. 2019, the MW-S expanded toward the coast of Guangxi Zhuang Autonomous Region and the Leizhou Peninsula, and occupied most of the region formerly controlled by the MWQ; the CW control region was signif icantly expanded larger than that in Nov. 2018; the MW-Q was only preserved in a small area between the CW and MW-S control regions (Fig.5c–d). During the last survey, the MW-Q reoccupied most of the survey area, except for the mouth of Qinzhou Bay located by the CW and the southwest waters located by the BW (Fig.5e–f).
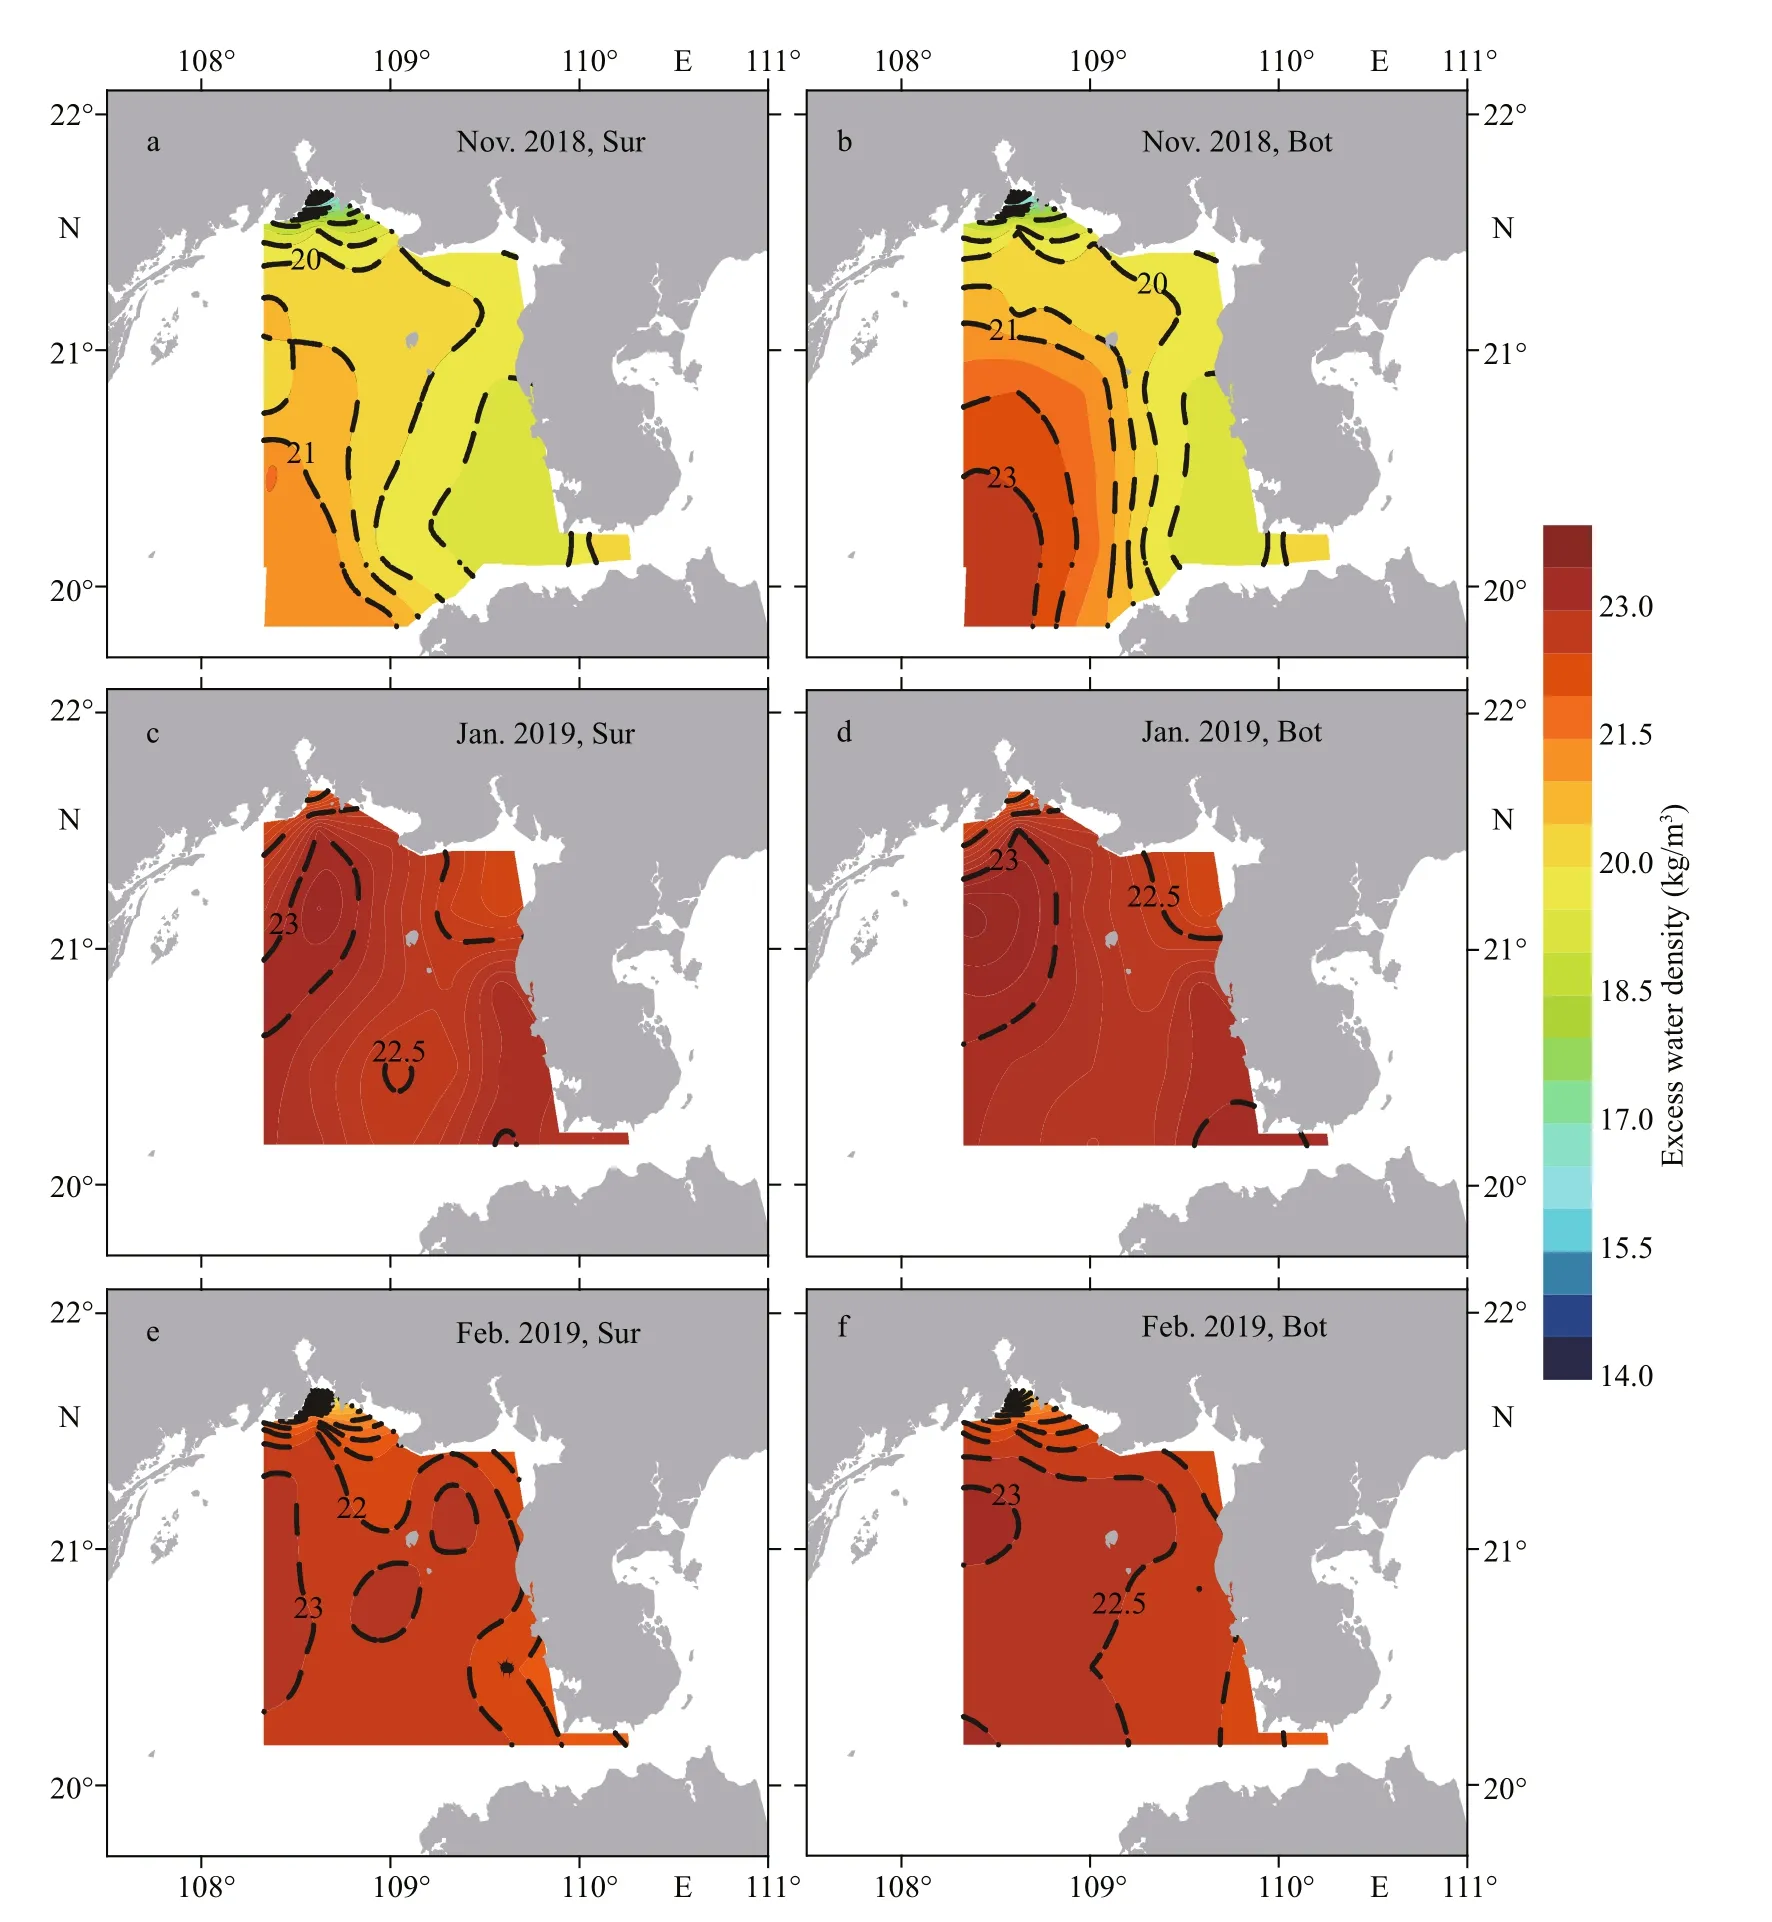
Fig.4 Distribution of excess water density at surface (Sur) and bottom (Bot) of the Beibu Gulf from November 2018 to February 2019
Apart from the diff erences in cell abundance(Table 1), the distribution patterns of Type I and TypeⅣP.globosawere similar during the three surveys.The distribution ofP.globosawas diff erent at the surface and bottom in Nov. 2018. The western and central surface waters of survey area were distributed with a low abundance ofP.globosa, while the high abundance (>5.0×10³cells/L) of Type I and Type Ⅳwas discontinuously distributed from the mouth of Qinzhou Bay to the west of the Leizhou Peninsula and Qiongzhou Strait. Notably, there was a lowabundance area between the Qinzhou Bay estuary and the coastline of Beihai City (Fig.6a & c). The high abundance of two genotypes was widespread at the bottom. The Type Ⅳ abundance was greater than that of Type I in the waters west of the Qiongzhou Strait and the mouth of Qinzhou Bay (Fig.6b & d). With the development ofP.globosablooms, the abundance of both genotypes increased rapidly, and their highabundance cells (>1.0×10⁴cells/L) were distributed in most surface and bottom waters of the surveyed area,except for the estuary of Qinzhou Bay and the waters adjacent station ZN1-4 in Jan. 2019 (Fig.6e–h). With the decline inP.globosabloom, the cell abundance of two genotypes gradually decreased, and their distribution decreased in the western part of survey area in Feb. 2019 (Fig.6i–l).
3.3 Prof ile distribution of hydrological factors and Phaeocystis globosa
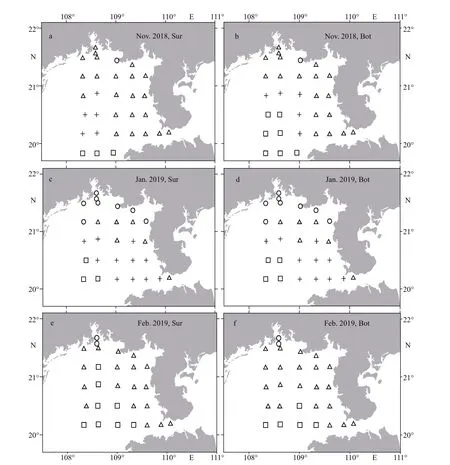
Fig.5 Distribution of water masses at surface (Sur) and bottom (Bot) of the Beibu Gulf from November 2018 to February 2019
Before the bloom in Nov. 2018, the prof ile distribution of hydrological factors andP.globosawas observed at north-south section I from site ZN6-2 to site ZN1-2, and east-west section Ⅱ from site ZN1-7 to site ZN1-1 (Fig.1). In north-south section I, a highdensity water mass with low temperature and high salinity was located at the south bottom and intruded the inshore of the Qinzhou Bay estuary along the slope (Fig.7a, c, & e). Similarly, the high abundance(>5.0×10³cells/L) of two genotypes was distributed from the south bottom to the inshore (Fig.7g & i).Unlike section I, there was a shoal in the middle of east-west section Ⅱ. The distribution patterns of hydrological factors diff ered on the eastern and western slopes. There was a high-density water mass with low temperature and high salinity at the western bottom with a water depth greater than 25 m (Fig.7b, d, & f).Low-density mixed seawater with high temperature and low salinity resided on the eastern slope and slightly intruded the western slope over the central shoal (Fig.7d & f). Similar to north-south section I,there was no obvious diff erence in the distribution of two genotypes in section Ⅱ, and the high-abundance cells (>5.0×10³cells/L) were distributed at the western bottom and in eastern mixed water (Fig.7h & j).
3.4 Relationships between the distribution of two genotypes of Phaeocystis globosa and environmental factors
RDA and Pearson correlation analysis were used to analyze the relationships between the distribution of two genotypes ofP.globosaand environmental factors(Fig.8; Supplementary Table S2). The permutation tests showed that the RDA model including all environmental variables was extremely signif icant(P<0.01). RDA axes 1 and 2 explained 19.24% and 2.54% of total variation, respectively. Temperature(0.58), and ammonium (0.46) were positively correlated with the RDA Axis 1. By contrast, salinity(-0.12), phosphate (-0.37), silicate (-0.18), nitrite(-0.31), and nitrate (-0.14) were negatively correlated with the RDA Axis 1. Temperature was the most important response variable, and both genotypes ofP.globosahad extremely negative correlations with temperature (P<0.01). In addition, the abundance of two genotypes also showed a negative correlation with nitrite, nitrate, ammonium (P<0.01 for Type I),and DIN (P<0.01 for Type I, 0.01≤P<0.05 for TypeⅣ). Notably, the correlations between the abundance of two genotypes and salinity, silicate, and phosphate diff ered. Salinity was positively correlated with the abundance of Type I, but was not correlated with TypeⅣ. The correlation between phosphate and Type I was positive, while negative correlations were found between silicate, phosphate, and Type Ⅳ.
4 DISCUSSION
4.1 Causative genotype of Phaeocystis globosa blooms in the Beibu Gulf
Phaeocystisglobosablooms, characterized by giant colonies (>1 cm in diameter), have been continually occurring in the SCS, including the coastalwaters of Guangdong Province, Hainan Island, and the Beibu Gulf (Qi et al., 2004; Qin et al., 2016).Previous studies have found that multiple genotypes ofP.globosareside in the SCS, among which the Type I and Type Ⅳ are the two dominant genotypes in the Beibu Gulf (Song et al., 2020; Zhang et al.,2021, 2022). As a result, determining the dynamics of dominant genotype in the Beibu Gulf will advance the understanding of formation mechanisms ofP.globosablooms in this area.
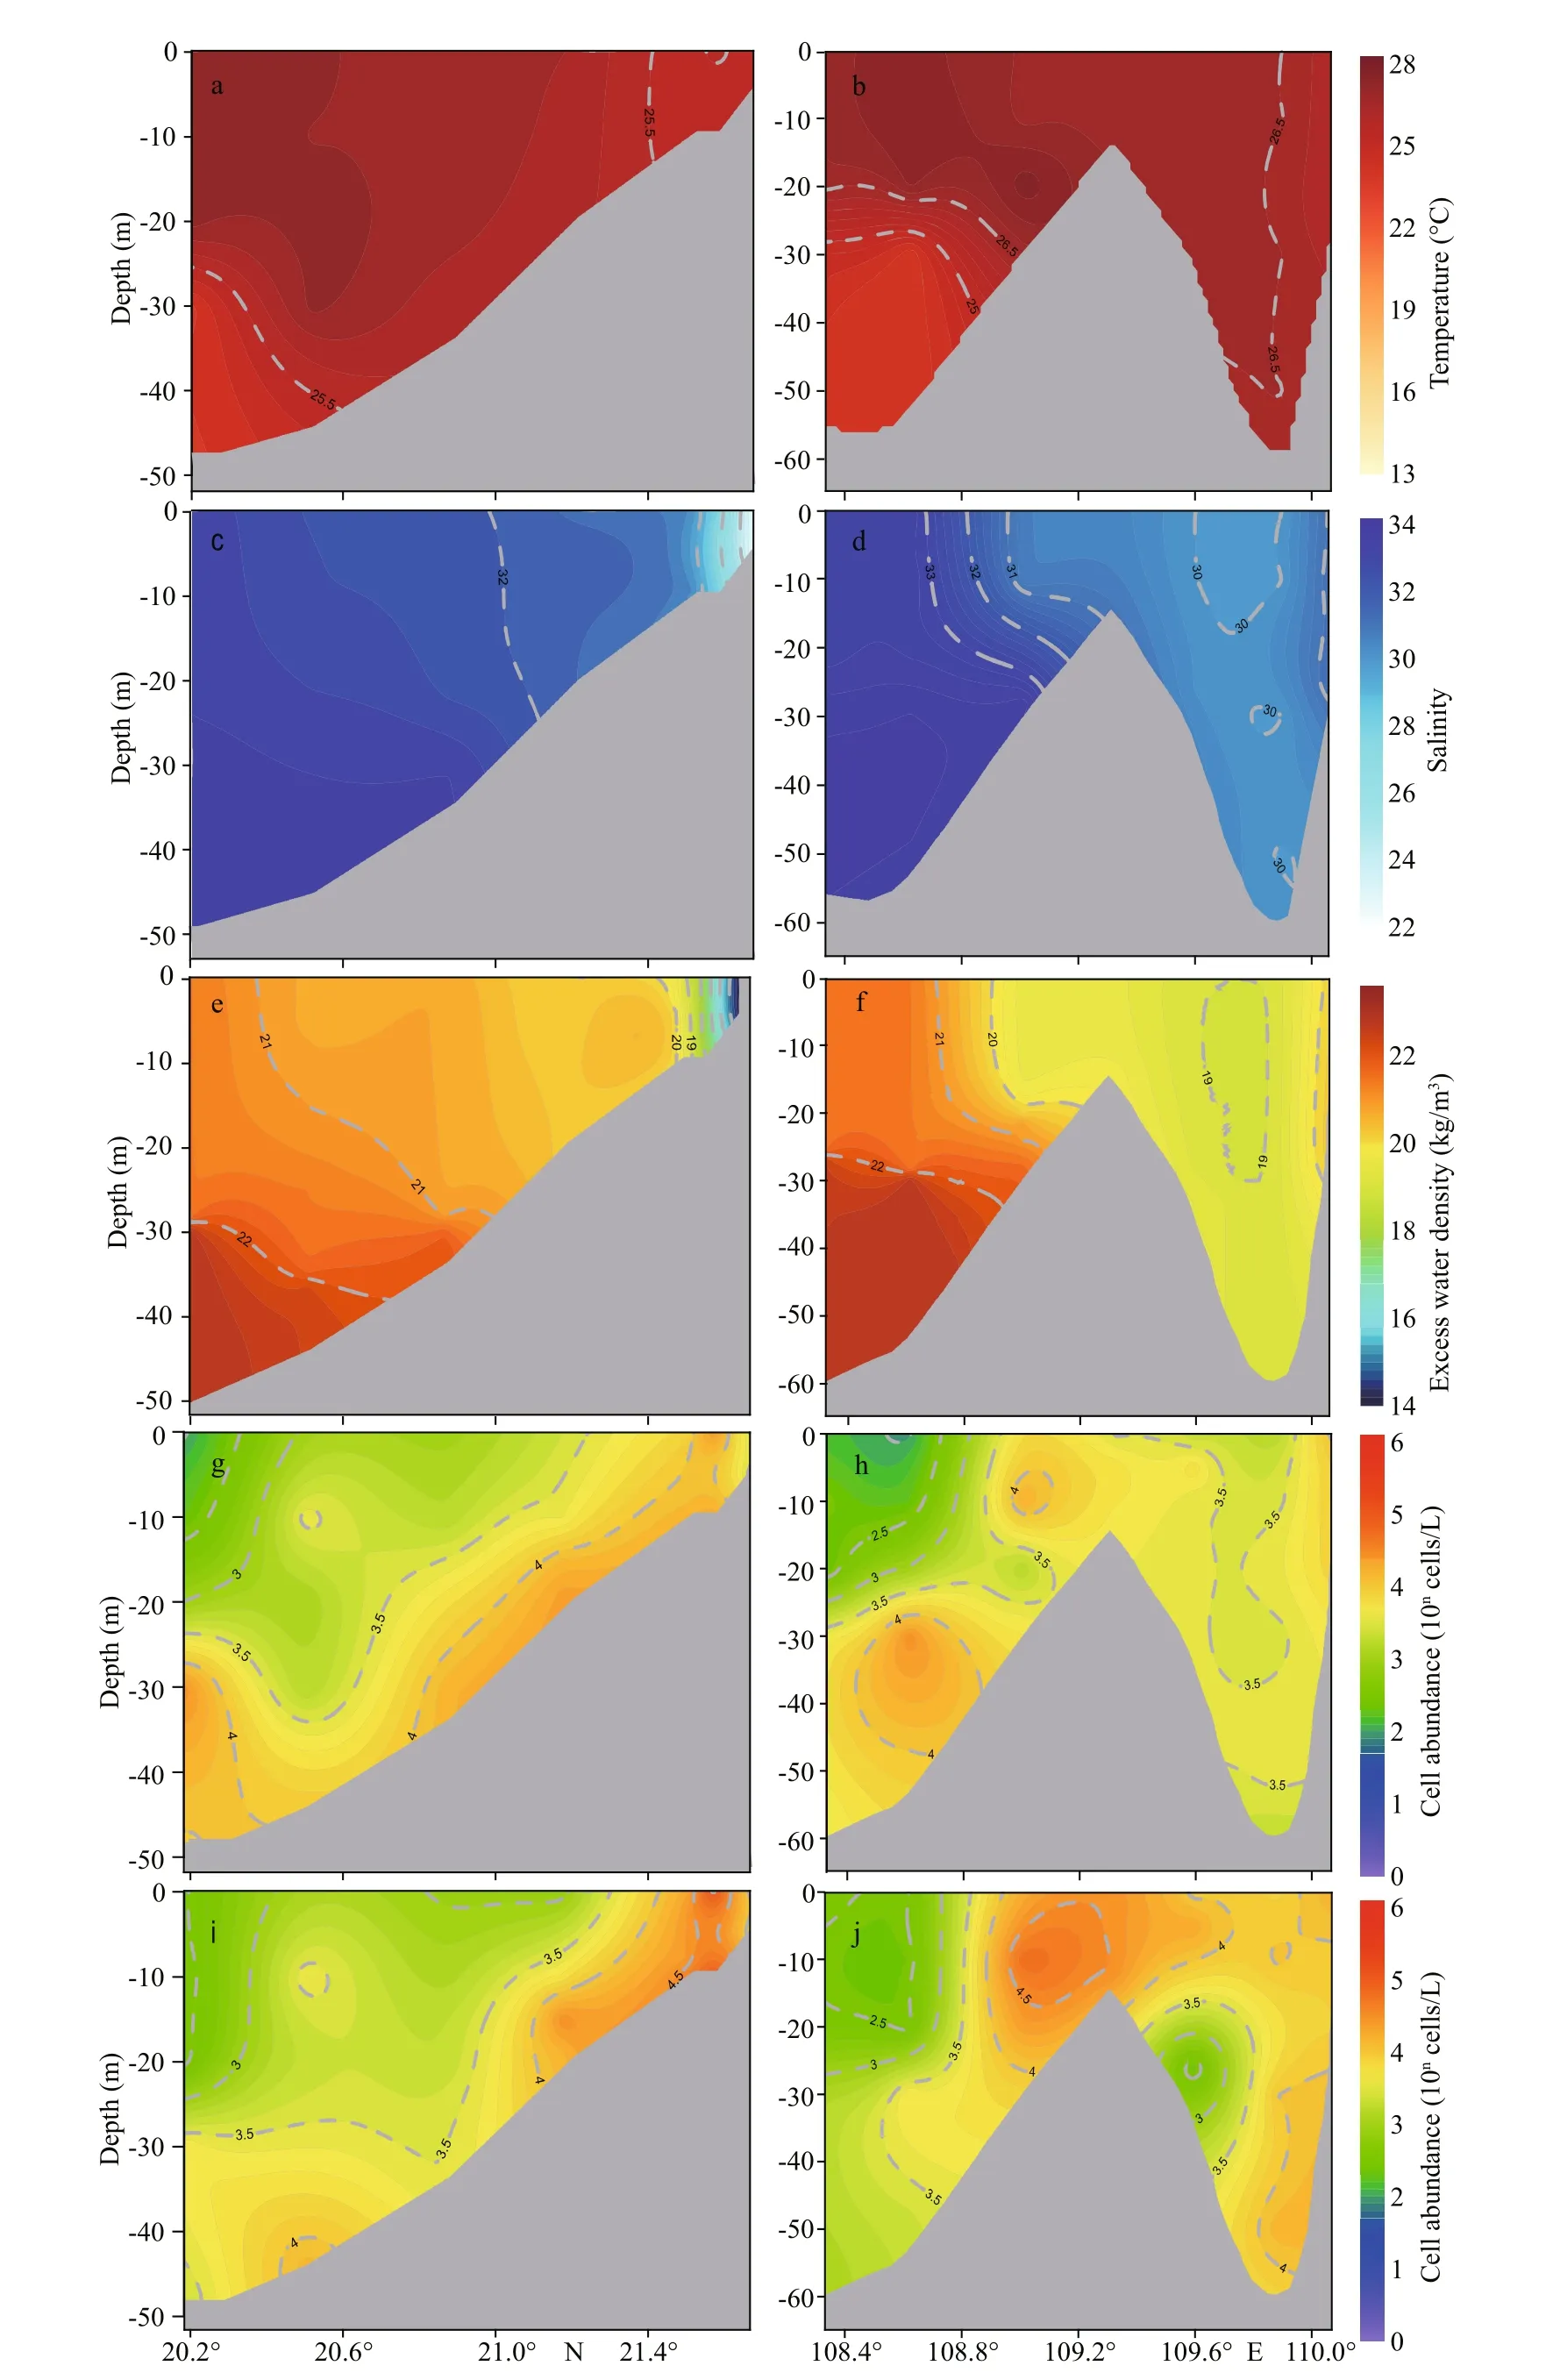
Fig.7 Prof ile distribution of temperature (a, b), salinity (c, d), excess water density (e, f), and abundance of Type Ⅰ (g, h) and Type Ⅳ (i, j) of Phaeocystis globosa at section Ⅰ and section Ⅱ
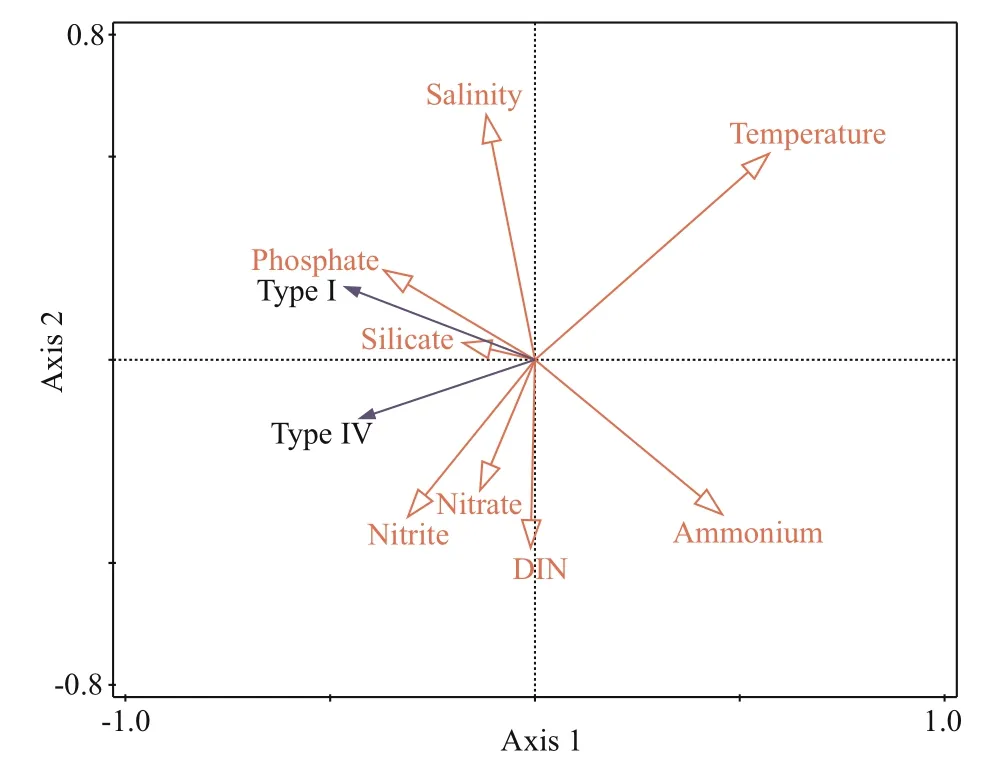
Fig.8 Redundancy analysis (RDA) ordination plots for the relationships between environmental factors and the cell abundance of two genotypes of Phaeocystis globosa
In this study, the abundance of two genotypes ofP.globosawas determined by the two sensitive genotype-specif ic qPCR assays (Niu et al., 2022). The cell abundance of Type Ⅳ was extremely signif icantly higher than that of Type I (Table 1,P<0.01) in the Beibu Gulf during the three surveys, especially at the bloom peak in Jan. 2019; the abundance of Type Ⅳwas three times greater than that of Type I. The similar results were found in the winter of 2016 before theP.globosabloom in this area (Niu et al., 2022). These results are consistent with the results based on the CHEMTAX analysis of phytoplankton assemblages in the Beibu Gulf in winter 2016 (Wang et al., 2021a).Some recent studies have found that centimeter-sized giant colonies ofP.globosawere mainly formed by Type Ⅳ cells duringP.globosablooms from 2016 to 2021 in the coastal waters of Guangdong Zhuang Autonomous Region and the Beibu Gulf,using a high-resolution chloroplast molecular marker (Zhang et al., 2021, 2022). The appearance of a large number of colonies is often regarded as an indicator ofP.globosabloom (Rousseau et al.,1994; Qi et al., 2004). During the three surveys in the winter of 2018, theP.globosacolonies were collected from the water column by vertical trawling using a phytoplankton sampling net (mesh aperture of 76 μm) during the bloom (Supplementary Fig.S3) (He, 2021). The distribution patterns of colonies and Type ⅣP.globosawere similar in Jan. and Feb.2019. Therefore, it is suggested that the Type Ⅳ cells account for theP.globosablooms in the Beibu Gulf.
4.2 Response of Phaeocystis globosa to environmental factors
Except for the lower cell abundance, the distribution patterns of Type I and Type Ⅳ were similar from Nov. 2018 to Feb. 2019 (Table 1; Fig.6).In Nov. 2018, the high abundance of Type I and TypeⅣ cells mainly distributed in the inshore surface and the broader bottom; in Jan. 2019, the high abundance ofP.globosacells was found throughout the survey area, except for a low-abundance zone in the middle of southern section Ⅱ; subsequently, the abundance of both genotypes decreased obviously in the western surveyed area in Feb. 2019 (Fig.6). The dynamics ofP.globosabloom may be associated with multiple environmental factors, including temperature,salinity, and nutrient loading in the Beibu Gulf.
Temperature is a crucial environmental factor aff ecting the growth and blooms ofP.globosa(He et al., 2019). Some experimental studies suggested that the optimal temperature is approximately 20–24 °C for the growth and colony formation ofP.globosain the SCS (Xu et al., 2017; Wang et al., 2021b), which is in accord with survey results of previous and this studies. In this study, the temperature ranged 18.0–23.9 °C in the region with a high abundance of TypeⅣ cells (Table 1). The temperature ranged from 18.5 to 24.0 °C in the Beibu Gulf from January to March 2017 when large numbers of colonies appeared (He et al., 2019), and 18.0 to 24.0 °C on the Guangdong coastal waters during theP.globosabloom in 1998(Chen et al., 1999). The RDA and Pearson correlation results showed that the abundance of bothP.globosagenotypes was extremely negatively associated with temperature, implying that low temperature in the winter is advantageous for the growth ofP.globosain the Beibu Gulf. During the last two surveys,the temperature in the most of study area was 18.0–24.0 °C within the range of optimum growth temperature forP.globosa, while that of the whole sea area was greater than 25.0 °C during the f irst survey in Nov. 2018 (Table 1 & Fig.2), which helps explain the variation ofP.globosaabundance from Nov. 2018 to Feb. 2019. In addition, the variation of seawater temperature during the surveys may also be responsible for the higher abundance ofP.globosacolonies in Jan. and Feb 2019 than in Nov. 2018(Supplementary Fig.S3) (He, 2021), which is also in agreement with previous studies (Tian and Lv, 2010;Zhang et al., 2020). Therefore, the low temperature in winter created a time window for the outbreaks ofP.globosablooms in Beibu Gulf.
Seawater salinity is another environmental factor aff ecting the spatial and temporal distribution ofP.globosablooms (Tian and Lv, 2010).P.globosacan grow under a wide range of salinity (20–40)(Madhupratap et al., 2000; Xu et al., 2003), and the optimal salinity for the growth and bloom ofP.globosais suggested to 25–33 (Schoemann et al., 2005; Tian and Lv, 2010). The Beibu Gulf winter salinity is generally within the optimum range for the growth ofP.globosa, which agree the widespread distribution ofP.globosain this area. The relationships between the twoP.globosagenotypes and salinity were diff erent based on the RDA and Pearson correlation results (Fig.8; Supplementary Table S2). Salinity was positively correlated with Type I, but no correlation with Type Ⅳ (Fig.8). Our further experiments show that the optimal salinity range of Type I was 30–35,and Type Ⅳ had a wider optimal salinity ranging from 25 to 40 (data not shown). These results imply that Type Ⅳ cells may be more habituated to the lowsalinity inshore environments than Type I cells.
Water eutrophication is a notable factor for the occurrence of HABs in the coastal waters worldwide(Anderson et al., 2002). Nutrient composition and stoichiometry are shown to inf luence the duration and succession of HABs (Glibert, 2020). The DIN concentrations averaged 3.9 μmol/L with the range from 0.4 to 25.4 μmol/L in the winter of 2018, lower than 7.3 μmol/L during theP.globosabloom in the winter of 2016 (Yuan et al., 2019), and the DIP concentrations in the winters of 2016 and 2018 were relatively stable and averaged 0.64 and 0.56 μmol/L(Yuan et al., 2019). It is implied that the Beibu Gulf is potentially nitrogen-limited with low inorganic N/P ratios during theP.globosablooms (Redf ield et al., 1963). By contrast, the most China’s coastal waters, particularly the estuary area of the Changjiang(Yangtze) River, in which HAB events are frequent,are primarily DIN-rich and phosphate-limited (Zhou et al., 2008). The distribution and dynamics ofP.globosablooms in the Beibu Gulf are strongly aff ected by the concentration and composition of nitrogen nutrients (Yuan et al., 2019). In general, the nitrate is the dominant composition in the DIN pools in the coastal waters. High concentration of nitrate can promote the formation of colonies and outbreak ofPhaeocystisblooms (Lancelot et al., 2007; Wang et al., 2021b). In this study, the average nitrate concentrate was 4.5 μmol/L at the bloom peak outbreak in Jan. 2019; subsequently, the nitrate content was consumed by the high abundance ofP.globosacells and colonies during the bloom maintenance; in Feb.2019, the nitrate concentrations decreased obviously accelerated the decrease ofP.globosacolonies(Table 1). The similar phenomenon was also observed near the coast of Vietnam, where aP.globosabloom occurred from August to September 2007 (Hai et al., 2010). Moreover, the distribution patterns ofPhaeocystisblooms are aff ected by the nitrate concentration (Lancelot et al., 2007). This study also shows that the high abundance ofP.globosacells and colonies distributed in several high-nitrate areas in the Beibu Gulf, including the coast of Guangxi Zhuang Autonomous Region, western waters of the Leizhou Peninsula, and southwestern waters of the Beibu Gulf, similar to other studies in this area (He et al., 2019; Liu et al., 2020). Therefore, the nitrate may be very crucial for duration and distribution ofP.globosablooms in the Beibu Gulf.
The dissolved organic nitrogen (DON) has been signif icantly elevated in many coastal waters in the last two decades (Glibert, 2020). Notably, urea content in seawater has increased signif icantly with the increasing use of urea as a nitrogen fertilizer(Zheng et al., 2001; Glibert et al., 2006). Previous studies have recognized the critical role of urea in the growth and formation ofP.globosacolonies (Chen et al., 2011; Liang et al., 2018). Thus, the role of DON inP.globosablooms cannot be ignored. Unfortunately,the dissolved organic substances were not included in this study. Further studies are necessary to elucidate the relationship between dissolved organic nutrients andP.globosablooms in this area.
Phaeocystisblooms require high concentration of phosphate, and 0.5 μmol/L is essential for the formation ofPhaeocystiscolonies (Cariou, 1991;Egge and Heimdal, 1994; Wang et al., 2007). During the three investigations, the average phosphate concentration was higher than 0.5 μmol/L in the Beibu Gulf, and the similar result was reported in the Beibu Gulf during theP.globosabloom in the winter of 2016 (He et al., 2019). These results indicate that phosphate is not a limiting factor that aff ects the distribution and dynamics ofP.globosabooms in the Beibu Gulf.
Providing the attachment substrates for the colony formation, diatoms also play an important role in the formation ofPhaeocystisblooms (Rousseau et al.,1994, 2002; Peperzak et al., 1998). As an essential nutrient for diatom growth, high content of silicate is consumed to increase the biomass of diatoms, which is conducive to the formation ofP.globosacolonies,and the initiation and duration ofPhaeocystisblooms(Tréguer and De La Rocha, 2013; He et al., 2019).In this study, silicate shared a similar variation with nitrate, implying the role of silicates and diatoms inP.globosablooms in the Beibu Gulf.
4.3 Implications for the potential seed sources of Phaeocystis globosa bloom in Beibu Gulf
Hydrological factors strongly regulate the distribution of bloom-forming species at the initial stage of a bloom and further aff ect the dynamics of subsequent intense bloom (Zhou and Zhu, 2006).In the early stage ofP.globosabloom in Nov.2018, the high abundance ofP.globosacells was discontinuously distributed in the inshore waters along Qinzhou Bay and Beihai City and the western waters of the Leizhou Peninsula. A distinctly lowabundance region was observed between Qinzhou Bay and Beihai City (Fig.6a–d), which was also observed in Nov. 2016 (Niu et al., 2022). This unique phenomenon may ref lect the multiple seed sources ofP.globosain the Beibu Gulf.
Prior to the formation of bloom in Nov. 2016 and 2018, the high-density water mass with low temperature and high salinity was located at the southwest bottom (Fig.7a, c, & e; Cao et al., 2019).Aff ected by the northeast monsoon, the surface water of Beibu Gulf moves southward from nearshore in autumn and winter (Liu et al., 2002). As part of compensation current, the SCS off shore bottom water outside the Gulf invades the inshore area via upwelling (Cao et al., 2019; Gao et al., 2019), which help to explain the high-density water mass located at the southwest bottom of the Gulf originates from the SCS off shore waters (Cao et al., 2019). The high abundance ofP.globosacells was in this high-density water mass and extended along the slope from the southern bottom water layer to the northern surface water in the Qinzhou Bay estuary (Figs.5b, 7a, 7c,7e, 7g, & 7i). Previous studies also demonstrated that phytoplankton assemblages at the southern bottom of the Gulf could extend to the coastline of Guangxi Zhuang Autonomous Region in autumn (Zhao et al.,2019). Therefore, the high abundanceP.globosacells in the Qinzhou Bay estuary more likely to originate from the SCS off shore waters outside the Beibu Gulf via upwelling.
There are two possible seed sources ofP.globosacells causing the bloom along the western waters of Leizhou Peninsula. Many studies agree that the cyclonic circulation is strongest in the Beibu Gulf in winter (Gao et al., 2013). Under the control of winter circulation, the seawater derived from Guangdong Province enters the western waters of Leizhou Peninsula via the Qiongzhou Strait (Sun and Huang, 2001). The local phytoplankton assemblies and high nutrient content along the coastal waters of Guangdong Province were found to be imported into the Beibu Gulf via the Qiongzhou Strait (Tang et al.,2003; Wang et al., 2014). This study showed that a high abundance ofP.globosacells was continuously distributed in the Qiongzhou Strait and the western waters of the Leizhou Peninsula resided with the MW-Q featuring low salinity and water density in Nov. 2018 (Figs.3, 4, 5a, 5b, 7d, & 7f). Further studies have found thatP.globosagenotypes have the same diversity in the coastal waters of Guangdong Province and the Beibu Gulf (Zhang et al., 2022), providing helpful evidence for the genetic connectivity ofP.globosain these two areas. Therefore, theP.globosacells in the Guangdong waters with high frequently ofP.globosablooms in autumn and winter can be transported into the western waters of the Leizhou Peninsula via the Qiongzhou Strait.
The high-abundance region ofP.globosain the western waters of the Leizhou Peninsula extended to the northwestern waters of Hainan Island prior to the boom in Nov. 2018 (Fig.6a–d). The similar phenomena were observed in the winters of 2012 and 2016 (Xu et al., 2015; Niu et al., 2022). The phenomena may be related to the strong upwelling along the southwestern waters of Hainan Island and the tidal front in the northeastern waters of the Gulf (Tang et al., 2003; Wang et al., 2019b). Previous studies have demonstrated that the nutrients can be transported from the bottom to the surface in the northwest waters of Hainan Island, and the phytoplankton assemblies can be transported from this area to the tidal mixing area in the western waters of the Leizhou Peninsula via the upwelling (Tang et al., 2003; Shen et al.,2018a; Wang et al., 2019b). Thus, it is implied that the southwestward current in the northwest waters of Hainan Island could likely transportP.globosacells to the western waters of the Leizhou Peninsula in winter.
In summary, theP.globosablooms in the Beibu Gulf may have diff erent seed sources. TheP.globosacells from the SCS off shore waters outside the Gulf are more likely to be transported to the mouth of Qinzhou Bay via upwelling in winter. TheP.globoacells distributed along the western waters of the Leizhou Peninsula are likely to originate from the coastal waters of Guangdong via the Qiongzhou Gulf, and the northwestern waters of Hainan Island via upwelling.
5 CONCLUSION
Having quantif ied the distribution and dynamics ofP.globosabloom using two sensitive genotypespecif ic qPCR methods in the Beibu Gulf in the winter of 2018, and analyzed the relationships between the two types ofP.globosaand environmental factors,we found that the Type Ⅳ cells ofP.globosadominated the bloom; low temperature in winter was conducive to the occurrence ofP.globosablooms;and nitrate was one of the key factors inf luencing the bloom dynamics. TheP.globosacells triggering intenseP.globosabloom in the Beibu Gulf are likely originated from the mixed water via the Qiongzhou Strait, and the northwestern waters of Hainan Island and the SCS off shore waters outside the Beibu Gulf via upwelling.
6 DATA AVAILABILITY STATEMENT
The datasets analyzed during the current study are available from the corresponding author on reasonable request.
7 ACKNOWLEDGMENT
We acknowledge all the researchers who worked on survey cruises for the collection of f ield samples.We deeply miss the late Professor Weibing GUAN, a co-author of this article.
 Journal of Oceanology and Limnology2022年6期
- Journal of Oceanology and Limnology的其它文章
- Overview of harmful algal blooms (red tides) in Hong Kong during 1975–2021
- Information standardization for typical toxic and harmful algae in China’s coastal waters—a case study of Karenia mikimotoi*
- Biochemical composition of the brown tide causative species Aureococcus anophageff erens cultivated in diff erent nitrogen sources*
- Identif ication of paralytic shellf ish toxin-producing microalgae using machine learning and deep learning methods*
- Screening for lipophilic marine toxins and their potential producers in coastal waters of Weihai in autumn, 2020*
- First observation of domoic acid and its isomers in shellf ish samples from Shandong Province, China*
