Comparative chloroplast genomes of Ulva prolifera and U. linza (Ulvophyceae) provide genetic resources for the development of interspecif ic markers*
Wenzheng LIU , Qianchun LIU , Jin ZHAO , Xiu WEI ,4, Peng JIANG ,**
1 CAS and Shandong Province Key Laboratory of Experimental Marine Biology, Center for Ocean Mega-Science, Institute of Oceanology, Chinese Academy of Sciences, Qingdao 266071, China
2 Laboratory for Marine Biology and Biotechnology, Pilot National Laboratory for Marine Science and Technology (Qingdao),Qingdao 266237, China
3 University of Chinese Academy of Sciences, Beijing 100049, China
4 College of Life Science, Qingdao University, Qingdao 266071, China
Abstract The green seaweeds Ulva linza and U. prolifera are closely related species. They usually co-occur widely and have important ecological signif icance as primary producers thriving in the intertidal zone. In the Yellow Sea, a genetically unique f loating ecotype of U. prolifera even bloomed to cause serious green tides. However, there is still a lack of appropriate molecular markers to distinguish these two species,partially due to limited evaluations on the intraspecif ic variations in U. prolifera among diff erent ecotypes.Since organelle genomes could provide rich genetic resources for phylogenetic analysis and development of genetic markers, in this study, the chloroplast genome from one attached population of U. prolifera was completely sequenced, and comparative genomic analyses were performed with other existing chloroplast genomes from U. linza and the f loating ecotype of U. prolifera. The results showed that in spite of the high level of collinearity among three genomes, there were plenty of genetic variations especially within the non-coding regions, including introns and gene spacer regions. A strategy was proposed that only those signals of variation, which were identical between two ecotypes of U. prolifera but divergent between U. linza and U. prolifera, were selected to develop the interspecif ic markers for U. linza and U. prolifera.Two candidate markers, psa B and pet B, were shown to be able to distinguish these two closely related species and were applicable to more attached populations of U. prolifera from a wide range of geographical sources. In addition to the interspecif ic marker, this study would also provide resources for the development of intraspecif ic markers for U. prolifera. These markers might contribute to the surveys for Ulva species composition and green tide monitoring especially in the Yellow Sea region.
Keyword: chloroplast genome; comparative genomics; intraspecif ic variation; Ulva linza; Ulva prolifera
1 INTRODUCTION
Ulvaspecies are widely distributed worldwide,thriving in intertidal, brackish, estuaries, and even freshwater environments (Mantri et al., 2020), with more than 80 identif ied species documented in the Algaebase (Guiry and Guiry, 2021). The thallus ofUlvais composed of distromatic blade or monostromatic tube. As their morphological features are very limited and unstable, which are sensitive to various factors such as salinity (Blomster et al., 1998), temperature(Blomster et al., 2002), and associated bacteria(Kessler et al., 2018), the morphological identif ication forUlvaare always very diffi cult (Blomster et al.,1999). The development of molecular approaches has signif icantly improved this dilemma, resulting in the reconstruction of generaUlva(Hayden et al., 2003),and identif ication of some cryptic species (Hofmann et al., 2010), but some of related species still lack appropriate molecular markers to distinguish them from each other (Kang et al., 2019; Steinhagen et al.,2019).
The type locations forU.linzaLinnaeus 1753 andU.proliferaO. F. Müller 1778 were at Kent of England, and Danish island of Lorand respectively.Due to the lack of holotype ofU.prolifera, the representative sequences of genetic markers for this species were originally derived from the samples collected in the British Isles that have been identif ied as “U.prolifera” on the basis of morphological characteristics (Blomster et al., 1998; Tan et al.,1999). However, Shimada et al. (2008) suggested that in the ITS-based phylogenetic tree, thoseU.proliferacollected in Japan were separated from European“U.prolifera”, and they were almost completely indistinguishable withU.linzaandU.procera(synonym ofU.prolifera), forming a cluster named LPP. Cui et al. (2018) conf irmed that the epitype ofU.proliferacollected from the type location were also located in the LPP cluster, and suggested to revise the previous “U.prolifera” toU.splitiana. In addition to the genetic similarities betweenU.proliferaandU.linza, their distribution areas are often overlapped as well, including the Baltic Sea in Europe (Cui et al.,2018; Steinhagen et al., 2019), the Atlantic coast of North America (Guidone et al., 2013), and many parts of the Northwest Pacif ic (Shimada et al., 2008; Zhao et al., 2018). In general,U.linzais mainly spread in marine habitats, while strains ofU.proliferaare found commonly in estuaries and brackish waters(Shimada et al., 2008; Ogawa et al., 2013). However,in the Southern Yellow Sea area, the two species grew intermixed and the biomass of both species is very high (Han et al., 2013). In particular,U.prolifera, as the dominant species, has caused the largest green tide in the world for consecutive years (Zhao et al.,2013). Thus, the accurate discrimination between these two related species have become necessary for investigations ofUlvaspecies composition and green tide monitoring especially in this sea area.
Because molecular markers commonly used inUlva, including ITS,rbcL andtufA, always failed to distinguish betweenU.proliferaandU.linza(Leliaert et al., 2009; Zhang et al., 2011; Xie et al., 2019), the 5S rDNA spacer region, which was polymorphic in individual, was developed (Shimada et al., 2008),and has been used widely to discriminate these two species (Hiraoka et al., 2011; Duan et al., 2012; Zhang et al., 2015; Song et al., 2019). From each species, this marker could generate multiple amplif ied products of diff erent sequences and lengths, of which the smallest fragment of about 300 bp was considered to be specif ic toU.linza, and was not available inU.prolifera.However, this likelyU.linza-specif ic genotype was later found in the epitype ofU.proliferaas well (Cui et al., 2018), suggesting that the 5S rDNA spacer region was probably not a substantial interspecif ic marker (Melton III and Lopez-Bautista, 2021). New eff orts focused more on the organelle genomes, since they have much richer polymorphic sites which are usually used for phylogenetic analysis among populations or related species (Yang et al., 2013;Zhang et al., 2021). Liu et al. (2020b) reported that a newly developed mitochondrial markerrps2-trnL can well distinguish fourUlvaspecies includingU.linzaand the driftingU.proliferacausing the Yellow Sea green tide. However, the driftingU.proliferahas been revealed as a unique f loating ecotype, which was clearly diff erent from the widely-distributed attached populations, in terms of both genetics and the performances of reproductive isolation withU.linza(Hiraoka et al., 2011; Zhao et al., 2015), whether the usage ofrps2-trnL can be extended to distinguish these two species still needs further verif ication with the attached populations ofU.prolifera.
In this study, the chloroplast genome of a representative strain for attachedU.proliferawas sequenced, and two existing chloroplast genomes which were fromU.linzaand the f loating ecotype ofU.proliferarespectively, were combined for a comparative analysis. The identif ied interspecif ic variations were used to develop new markers for the discrimination between these two related species.
2 MATERIAL AND METHOD
2.1 Seaweeds and molecular identif ication
EachUlvastrain used in this study was unialgal culture maintained in our laboratory, the collection information were shown in Supplementary Table S1. All the samples were cultured in Von Stosch’s Enriched (VSE) medium renewed once a week, at 20 °C with a 12-h꞉12-h light (L)꞉dark (D) photoperiod and a photosynthetic irradiance of about 80 μmol photons/(m2·s).
Genomic DNA of each sample was extracted using a Plant Genomic DNA Extraction Kit (Tiangen Biotech Co. Ltd., Beijing, China) according to the manufacturer’s instruction. The molecular identif ication for all samples were performed using ITS, 5S rDNA spacer, and a sequence characterized amplif ied region (SCAR) marker which was specif ic to the f loating ecotype ofU.proliferadominating the green tide in the Yellow Sea. The primers and PCR procedures for ITS, 5S rDNA spacer, and SCAR markers referred to Leskinen and Pamilo(1997), Shimada et al. (2008), and Zhao et al. (2015)respectively. PCR products were sequenced in Ruibo Bio Tech Co. Ltd, Qingdao, China by a Genetic Analyzer (ABI3730XL, USA). Phylogenetic analysis were performed according to previous descriptions from Xie et al. (2020).
2.2 Chloroplast genome sequencing, assembly,annotation, and phylogenetic analysis
An attachedU.proliferasample U161 was selected as a representative for chloroplast genome sequencing. A single thallus was cut into segments for vegetative growth, then the algal tissue was sent to HengChuang Gene Co. Ltd. (Shenzhen, China) for high-throughput sequencing. Total genomic DNA was extracted using a Plant Genomic DNA Extraction Kit(Tiangen Biotech Co. Ltd., Beijing, China). The DNA library with an insert size of 350 bp was constructed using a library preparation kit (New England Biolabs Co. Ltd., USA) and sequenced using the Hiseq 4000 platform (Illumina Co. Ltd., USA) to obtain 150 bp ×2 paired-end reads. The low-quality sequences which are those with over 50% bases having quality values ofQ<19 or over 5% bases being ‘N’ were removed.The f iltered reads were assembled into contigs by SOAPdenovo v2.04 (Luo et al., 2015), then aligned and ordered according to the reference genome. Last,raw reads were again mapped to the assembled draft chloroplast genome and the majority of gaps were f illed through local assembly.
The chloroplast genome was annotated using program PGA (Qu et al., 2019). Ribosomal RNA genes (rRNAs) were identif ied by RNAmmer v1.2(Lagesen et al., 2007), and transfer RNA genes(tRNAs) were searched using the tRNAscan-SE v2.0 (Chan and Lowe, 2019). The OGDRAW v1.3.1 was applied to draw the genome map (Greiner et al.,2019). The whole chloroplast genome sequence with annotation information was submitted to GenBank of NCBI using Bankit.
For phylogenetic analysis with whole chloroplast genomes, a total of 48 shared protein-coding genes among all available 26 chloroplast genomes ofUlva, including our data from U161 and other 25 which were obtained from NCBI as references, were selected for alignment by MAFFT v7.475 (Kuraku et al., 2013). After alignment and concatenating of the shared genes, the full length of 48 gene sequences were about 36 kb. The maximum likelihood (ML)phylogenetic tree with alignment sequences from 26 chloroplast genomes ofUlvawas constructed using a GTR + G + I model and the sequence divergences were calculated with MEGA 6.0 (Tamura et al.,2013).
2.3 Comparative genomic analysis between U. linza and two ecotypes of U. prolifera
The complete chloroplast genomes ofU.linza(NC030312), the f loatingU.prolifera(NC036137)collected from the Yellow Sea green tide, and the attachedU.proliferaU161 (MZ571508), were used for comparative genomic analysis. The codon usage biases was analyzed using PhyloSiute v1.2.2(Zhang et al., 2020) and codonW v1.4.4 (Meade et al., 1997). The collinearity analysis with these three chloroplast genomes was carried out to check the genome rearrangement by Mauve v2.4 with the ProgressiveMauve algorithm (Darling et al.,2010). Single nucleotide polymorphism (SNP) sites were searched by Mauve v2.4, and indel (insertiondeletion) sites were identif ied by Dnasp v5.1 (Librado and Rozas, 2009). In order to visualize structure variations across the genomes, the chloroplast genomic sequence comparative analysis were conducted using the mVISTA following a global pairwise alignment of the sequences with the LAGAN program (Frazer et al., 2004).
2.4 Development of new species-specif ic markers from chloroplast genomes
From the identif ied SNP, indels or structural variations, some of those regions that were homologous between the two ecotypes ofU.proliferabut had obvious divergences betweenU.proliferaandU.linzawere selected as molecular marker targets, and the f lanking sequences at both ends,which were completely identical among the three chloroplast genomes, were used for design of speciesspecif ic primers using Primer 3.0. All primers were synthesized by Sangon Biotech (Shanghai) Co. Ltd.(Shanghai, China). The eff ects of species distinguish for designed primers were evaluated with each of twelveUlvasamples by PCR reactions. The prof ile of the PCR reactions consisted of one initial denaturation of 10 min at 94 ℃, then 35 cycles of denaturation of 45 s at 94 ℃, primer annealing of 45 s at 55 ℃ and extensions of 2 min at 72 ℃, and a f inal extension of 10 min at 72 ℃. Following the cycles, there was a f inal hold at 4 ℃. PCR products were detected using gel electrophoresis in a 1.5% agarose gel stained with Super GelRed (US Everbright Inc., Suzhou, China).The sequencing and phylogenetic analysis were performed following the previous descriptions for ITS.
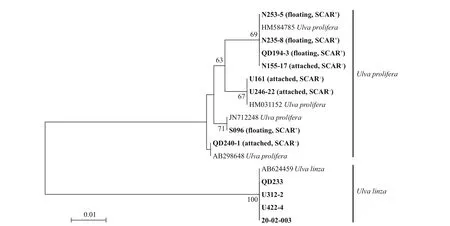
Fig.1 Phylogenetic tree based on ML analysis with 5S rDNA spacer sequences
3 RESULT
3.1 Molecular identif ication
The phylogenetic tree for ITS showed that all 12 samples fell into theU.prolifera-U.linzacomplex(Supplementary Fig.S1), and the tree for 5S rRNA spacer showed that they were clearly resolved into two clades, i.e.,U.proliferaandU.linza. After that,eight samples ofU.proliferawere detected by SCAR marker further, and the results showed that all four f loating samples belonged to the f loating ecotype ofU.prolifera(Fig.1).
3.2 Chloroplast genome of U. prolifera U161 with phylogenetic analysis
To develop interspecif ic genetic markers forU.proliferaandU.linzabased on the intraspecif ic variations withinU.prolifera, an attachedU.proliferastrain U161 was selected for sequencing of chloroplast genome since both references of f loatingU.proliferaandU.linzaare readily available.After genome sequencing, assembly, and annotation,it was shown that the complete chloroplast genome of U161 is 99 724 bp in size (Fig.2) (GenBank accession No. MZ571508), encoding 95 genes including 67 protein-coding genes, 26 tRNAs, and 2 rRNAs. There are f ive genes (psbB,psbD,atpA,atpB, andpsaB) containing one intron and there is one gene (petB) containing two introns. The overall base composition was A (37.7%), T (37.0%), C(12.6%), and G (12.7%). The voucher (assigned number MBM 287038) was deposited in the Marine Biological Museum of Chinese Academy of Sciences(MBMCAS) at the Institute of Oceanology, Chinese Academy of Sciences, China.
The ML phylogenetic tree of chloroplast genomes ofUlvawas shown in Fig.3. It was shown that the attached and f loatingU.proliferagathered into a cluster which was separated fromU.linza. The chloroplast genome sequence divergence was 0.3%betweenU.linzaand the attachedU.prolifera, and 0.4% betweenU.linzaand the f loatingU.prolifera.This result suggested thatU.linzaandU.proliferacan be distinguished as two species by the whole chloroplast genome despite the intraspecif ic divergences withinU.proifera.
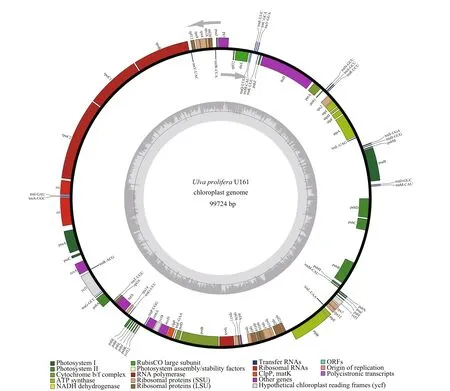
Fig.2 Chloroplast genome map of U. prolifera U161
3.3 Comparative analysis of chloroplast genomes among U. linza and two ecotypes of U. prolifera
As shown in Fig.4, the relative synonymous codon usage (RSCU) values were calculated and summarized with chloroplast genomes ofU.linzaand two ecotypes ofU.proliferarespectively. In general, it was clearly indicated that the codon selection strategies in the three chloroplast genomes were extremely similar.Except for methionine and tryptophan (RSCU=1),most amino acids were exhibited to have codon bias.A total of 26 high frequency codons (RSCU>1),including a stop codon, were identif ied with A/T ending as usual inUlva(Cai et al., 2017), while the codons with negative bias (RSCU<1) were prone to end with G/C. The results showed that the codon usage of the three genomes are extremely conservative without potential to provide resources for interspecif ic discrimination. Furthermore, we analyzed the genetic variations within the non-coding regions, including introns and gene spacer regions.
The collinearity analysis was conducted with these three chloroplast genomes. It was obviously shown that none of structural rearrangements such as inversions or translocations were detected among three genomes, and the orders of similarity sequences in the chloroplast genomes ofU.linzaand two ecotypes ofU.proliferawere almost identical except for some slight variations such as insertions and deletions mainly located in the regions of introns or gene spacers (Fig.5). Therefore, results of both the codon bias and collinearity analysis showed thatU.linzahad a very close genetic relationship withU.prolifera.
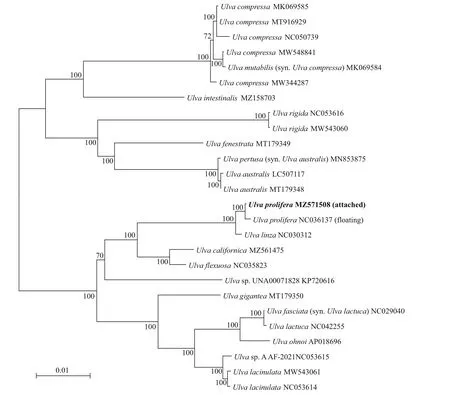
Fig.3 Phylogenetic tree based on ML analysis with 26 Ulva chloroplast genomes
To investigate the interspecif ic variations betweenU.linzaandU.prolifera, these three chloroplast genomic sequences were compared using mVISTA.As shown in Fig.6, plenty of variations were detected which were distributed in both the conserved noncoding sequences (CNS) and exon regions. By ignoring the intraspecif ic variations between the two ecotypes ofU.prolifera, such as thepsbB-psbC spacer region,only those signals which were identical between two ecotypes ofU.proliferabut divergent betweenU.linzaandU.prolifera, were further searched out to represent the interspecif ic variations between these two related species. A total of 454 SNPs, 131 indels and six structural variations were identif ied. In particular, three of the six structural variations were found to be longer than 1 000 bp. According to the position displayed on the X axis which was based on the chloroplast genome sequence of the attached ecotype ofU.prolifera(MZ571508), these three regions of large structural variations were found to be located atpsaB (3 kb–4 kb),petB (70.5 kb–71.8 kb),andpsbB (91 kb–92 kb) respectively. Upon further analysis, each region was determined as an intron in the chloroplast genomes ofU.prolifera, while it was a complete deletion in that ofU.linza.
3.4 Development of new species-specif ic markers from chloroplast genomes
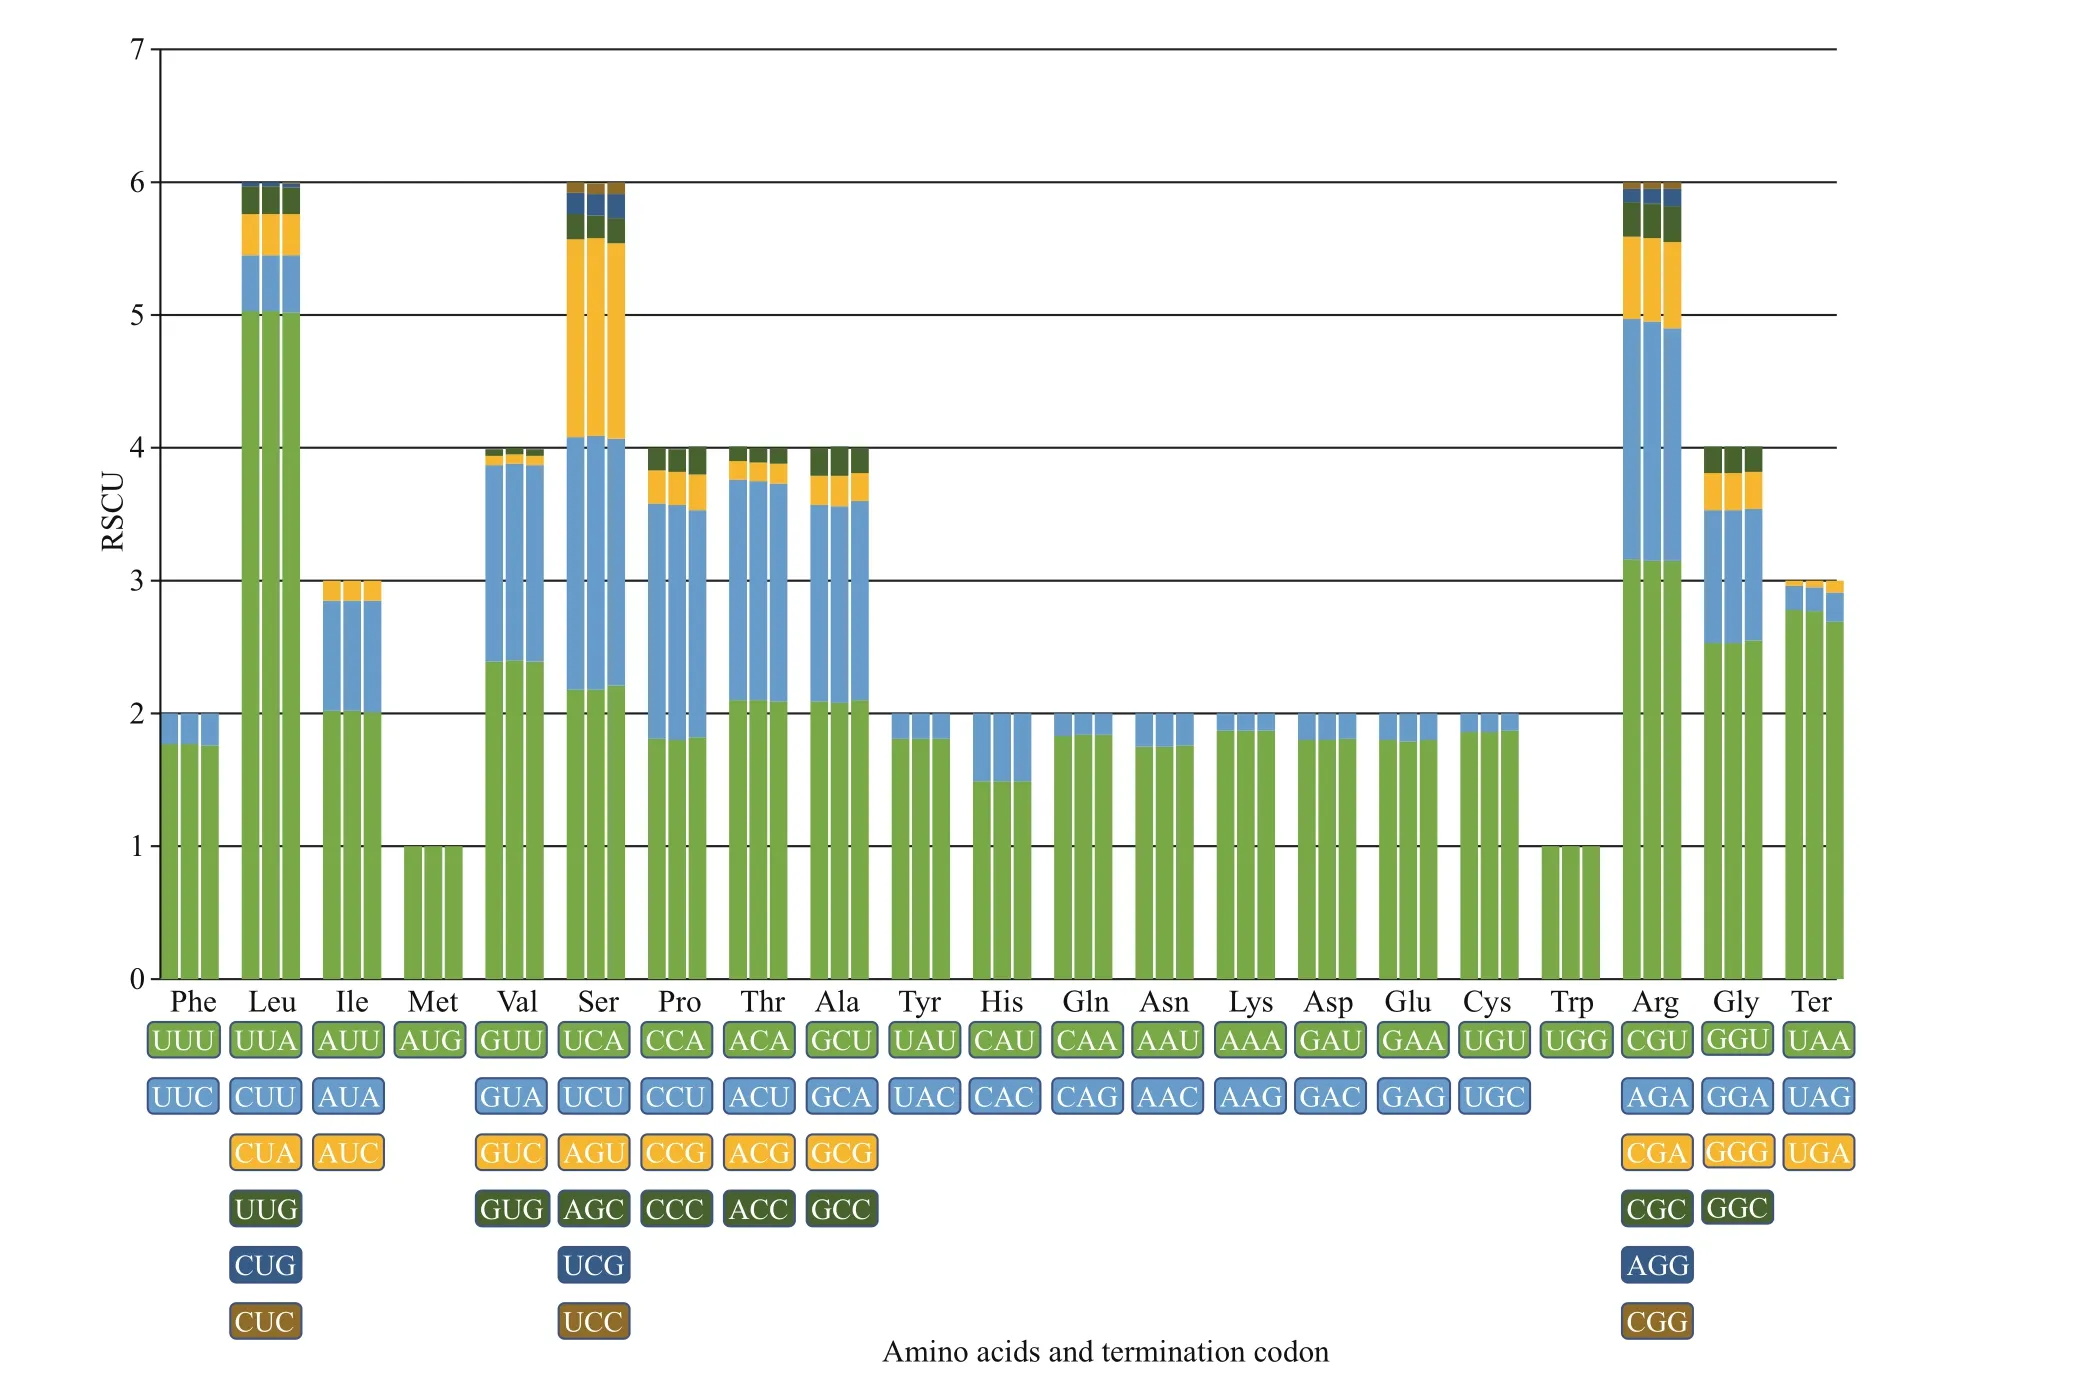
Fig.4 RSCU of all 64 codons for protein-coding genes from three chloroplast genomes
Dozens of pairs of primers were designed to target those interspecif ic variations betweenU.proliferaandU.linzawhich were located in either CNS or exon regions. After validation with PCR amplif ications,those primers generating no products, polymorphic products, diff erent products between two ecotypes ofU.prolifera, or identical products between two related species, were all abandoned. Finally, two pairs of primers, which were designed to match the coding regions withinpsaB gene andpetB gene respectively (Supplementary Table S2), were proved to be capable of generating species-specif ic signals to distinguishU.proliferaandU.linza(Fig.7), and the sequences data have been uploaded to NCBI(Supplementary Table S3). The primers forpsaB marker could amplify approximately 2 100-bp bands of the same size from both ecotypes ofU.prolifera,while only about 1 000-bp bands can be amplif ied fromU.linza. Similarly, the primers forpetB marker could amplify an about 1 800-bp band from each ofU.proliferasamples, whereas about 150-bp bands inU.linzasamples. The ML phylogenetic trees forpetB andpsaB markers showed that all samples were clearly resolved into two clades, i.e.,U.proliferaandU.linza, without signif icant genetic divergency in each clade (Supplementary Figs.S2–S3).
4 DISCUSSION
The phenotypic diff erentiations between the two ecotypes ofU.proliferahave long been concerned, in terms of the morphology (Wang et al., 2010; Hiraoka et al., 2011; Gao et al., 2016; Ma et al., 2020), habitats(Ding et al., 2009), and transcription level of some key metabolism-related genes (He et al., 2019). Their signif icant diff erences in performances of reproductive isolation withU.linzawere also described (Hiraoka et al., 2011). In particular, the genetic variations have also been revealed, by using inter-simple sequence repeat (ISSR) markers which were located throughout whole genomes (Zhao et al., 2011). A SCAR marker specif ic to the f loating ecotype has been developed to f ind that this unique ecotype almost never formed a colonization population in the intertidal zone(Zhao et al., 2018). These f indings implied the genetic diff erentiation between the two ecotypes ofU.prolifera, which was conf irmed to some extent by the comparative chloroplast genomic analysis in this study. In contrast, the results of all four tested molecular markers, especially 5S spacer, showed that allU.linzasamples from diff erent geographic populations were almost genetically identical,suggesting that the intraspecif ic genetic diff erences inU.linzawere not signif icant. Therefore, in order to develop species-specif ic molecular markers forU.linzaandU.prolifera, the inf luence of intraspecif ic diff erences, especially forU.proliferathat consisting of diff erent ecotypes, should be fully considered.
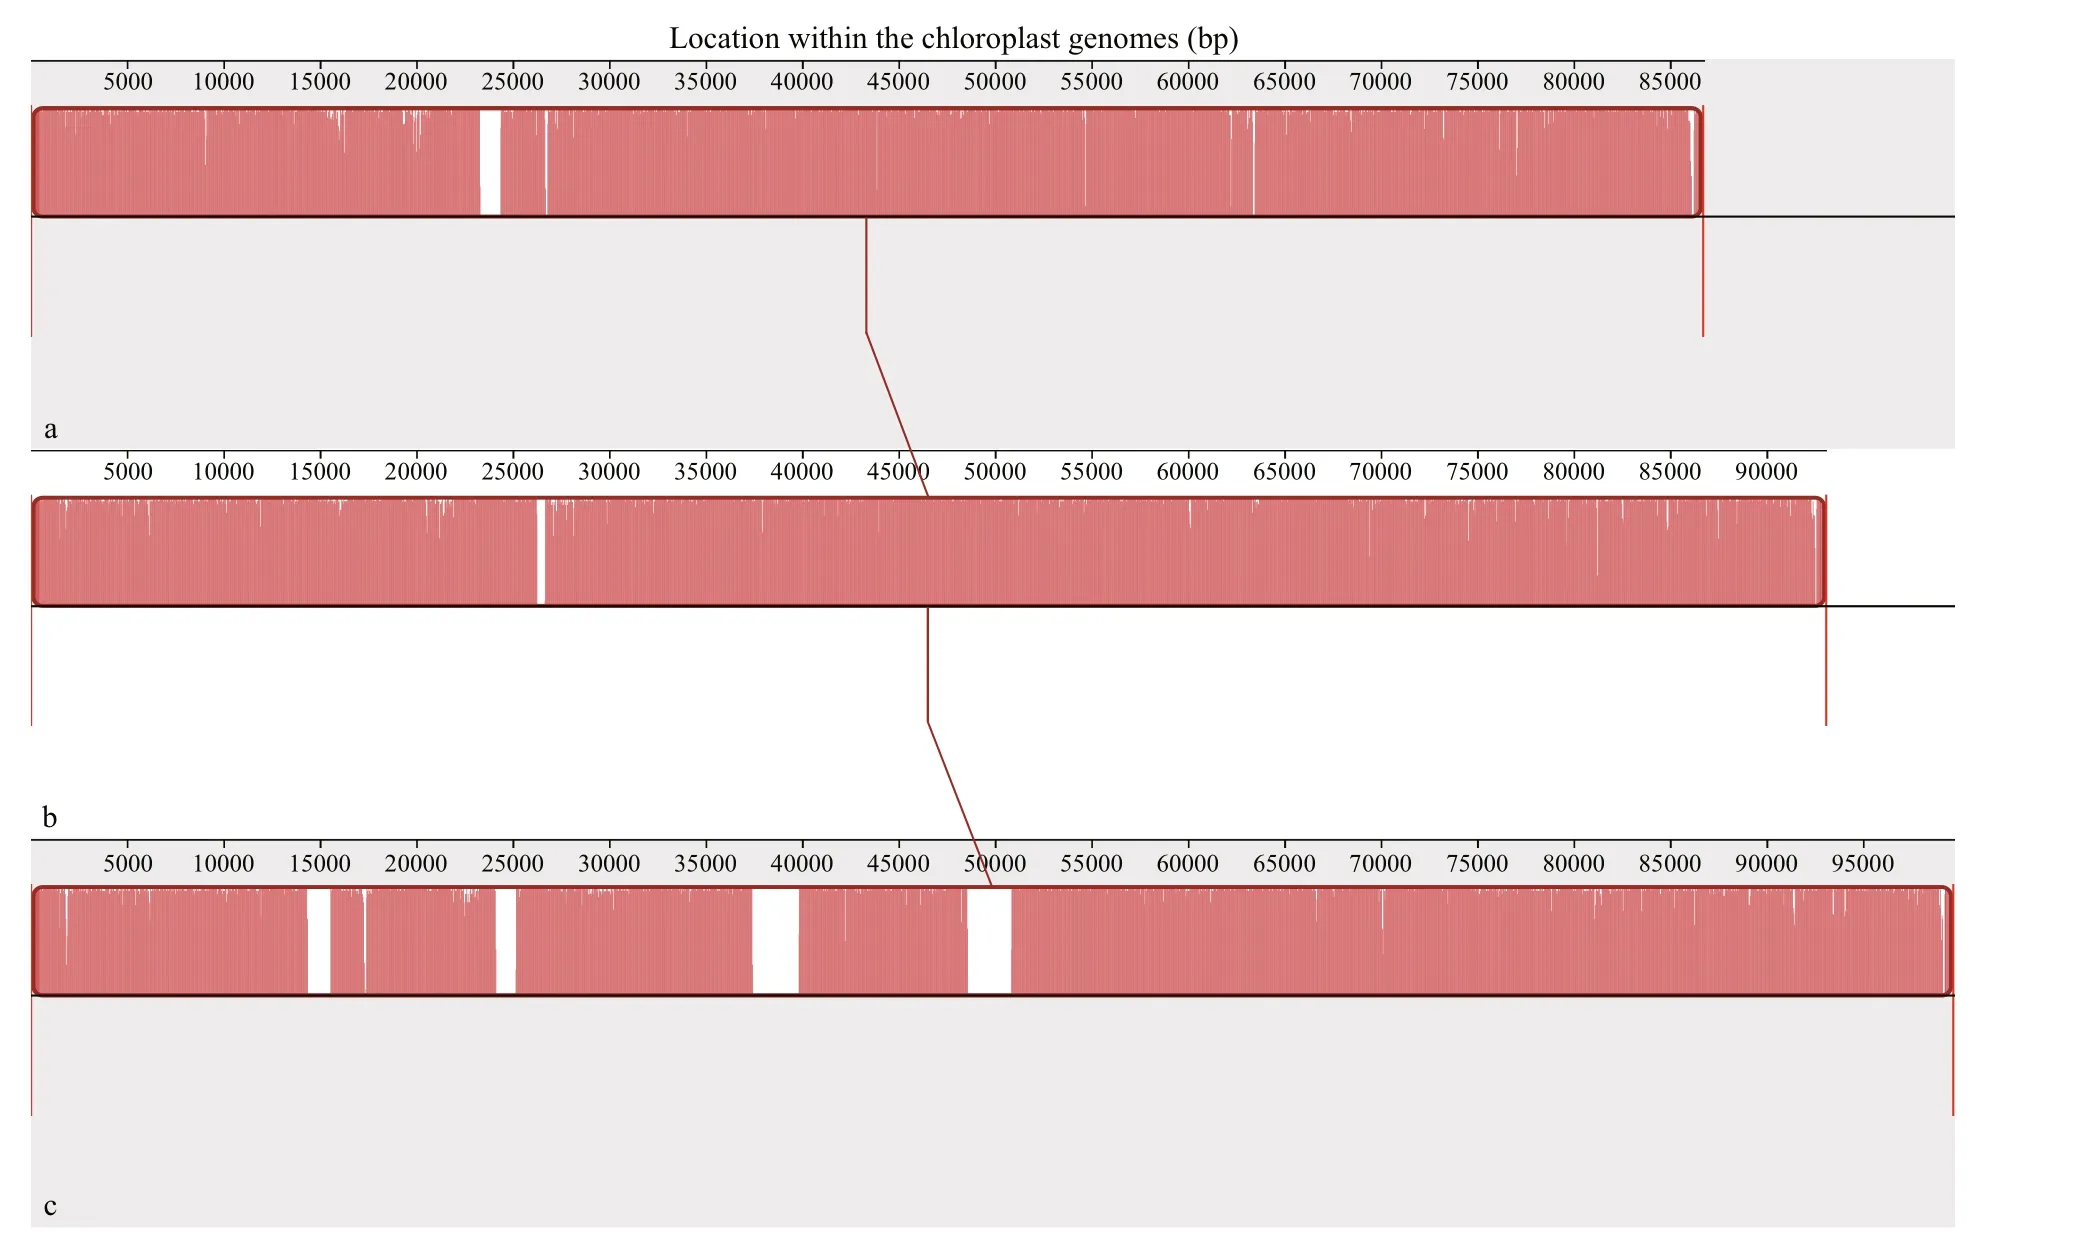
Fig.5 Collinearity analysis among chloroplast genomes of U. linza and two ecotypes of U. prolifera
In this study, the chloroplast genome from one representative attached population ofU.proliferawas completely sequenced, and comparative analysis was performed with other chloroplast genomes fromU.linzaand the f loating ecotype ofU.prolifera. A strategy was proposed that only those signals of variation which were identical between two ecotypes ofU.proliferabut divergent betweenU.linzaandU.prolifera, were selected to develop the interspecif ic markers forU.linzaandU.prolifera. Two candidate markers,i.e.psaB andpetB, were validated to be capable of distinguishing these two related species.These new markers are expected to be used in surveys forUlvaspecies composition and green tide monitoring especially in the southern Yellow Sea.This sea area has experienced severe green tides for more than a decade (Yu et al., 2018). It was proposed that, the fouling green seaweeds on the nori rafts at Subei, in which bothU.linzaandU.proliferawere major members (Fan et al., 2015; Huo et al., 2015),provided the origin of biomass for the green tides in the Yellow Sea (Liu et al., 2009), and only the f loating ecotype ofU.proliferaf inally succeed to be extremely dominant (Zhao et al., 2015). In addtion, it was suggested that theUlvaspecies composition and biomass in samples, including those fouling green seaweeds and theUlvamicro-propagules distributed in seawaters or surface sediments in this area, might contribute greatly to the interannual characteristics of the green tides (Song et al., 2015). Therefore, the new interspecif ic markers developed in this study,in combination with the existing f loating ecotypesspecif ic marker, are expected to be able to characterise the detailed dynamic characteristics of the Yellow Sea green tide, and provided important data for eff ective risk mornitoring and management.
Organelle genomes contain abundant genetic resources, the mitochondrial genome sizes inUlvavary between 55 kb to 88 kb, and the chloroplast genome sizes are 86 kb–119 kb. At present, genome sequences including 33 mitochondria and 26 chloroplasts fromUlvahave been available in the GenBank database(https://www.ncbi.nlm.nih.gov), which were conducive to the development of molecular markers and used for inter- or intra-specif ic phylogenetic analysis. Recent studies showed that, for some widely distributedUlvaspecies, such asU.pertusa(synonym ofU.australis) andU.compressa, a certain degree of intraspecif ic variations in organelle genomes have been detected among diff erent geographic populations(Liu et al., 2017, 2020a; Cai et al., 2021). SinceU.linzaandU.proliferaalso occurred worldwide,the organelle genome resources we provided in this study could contribute to validation or development of interspecif ic markers in future.
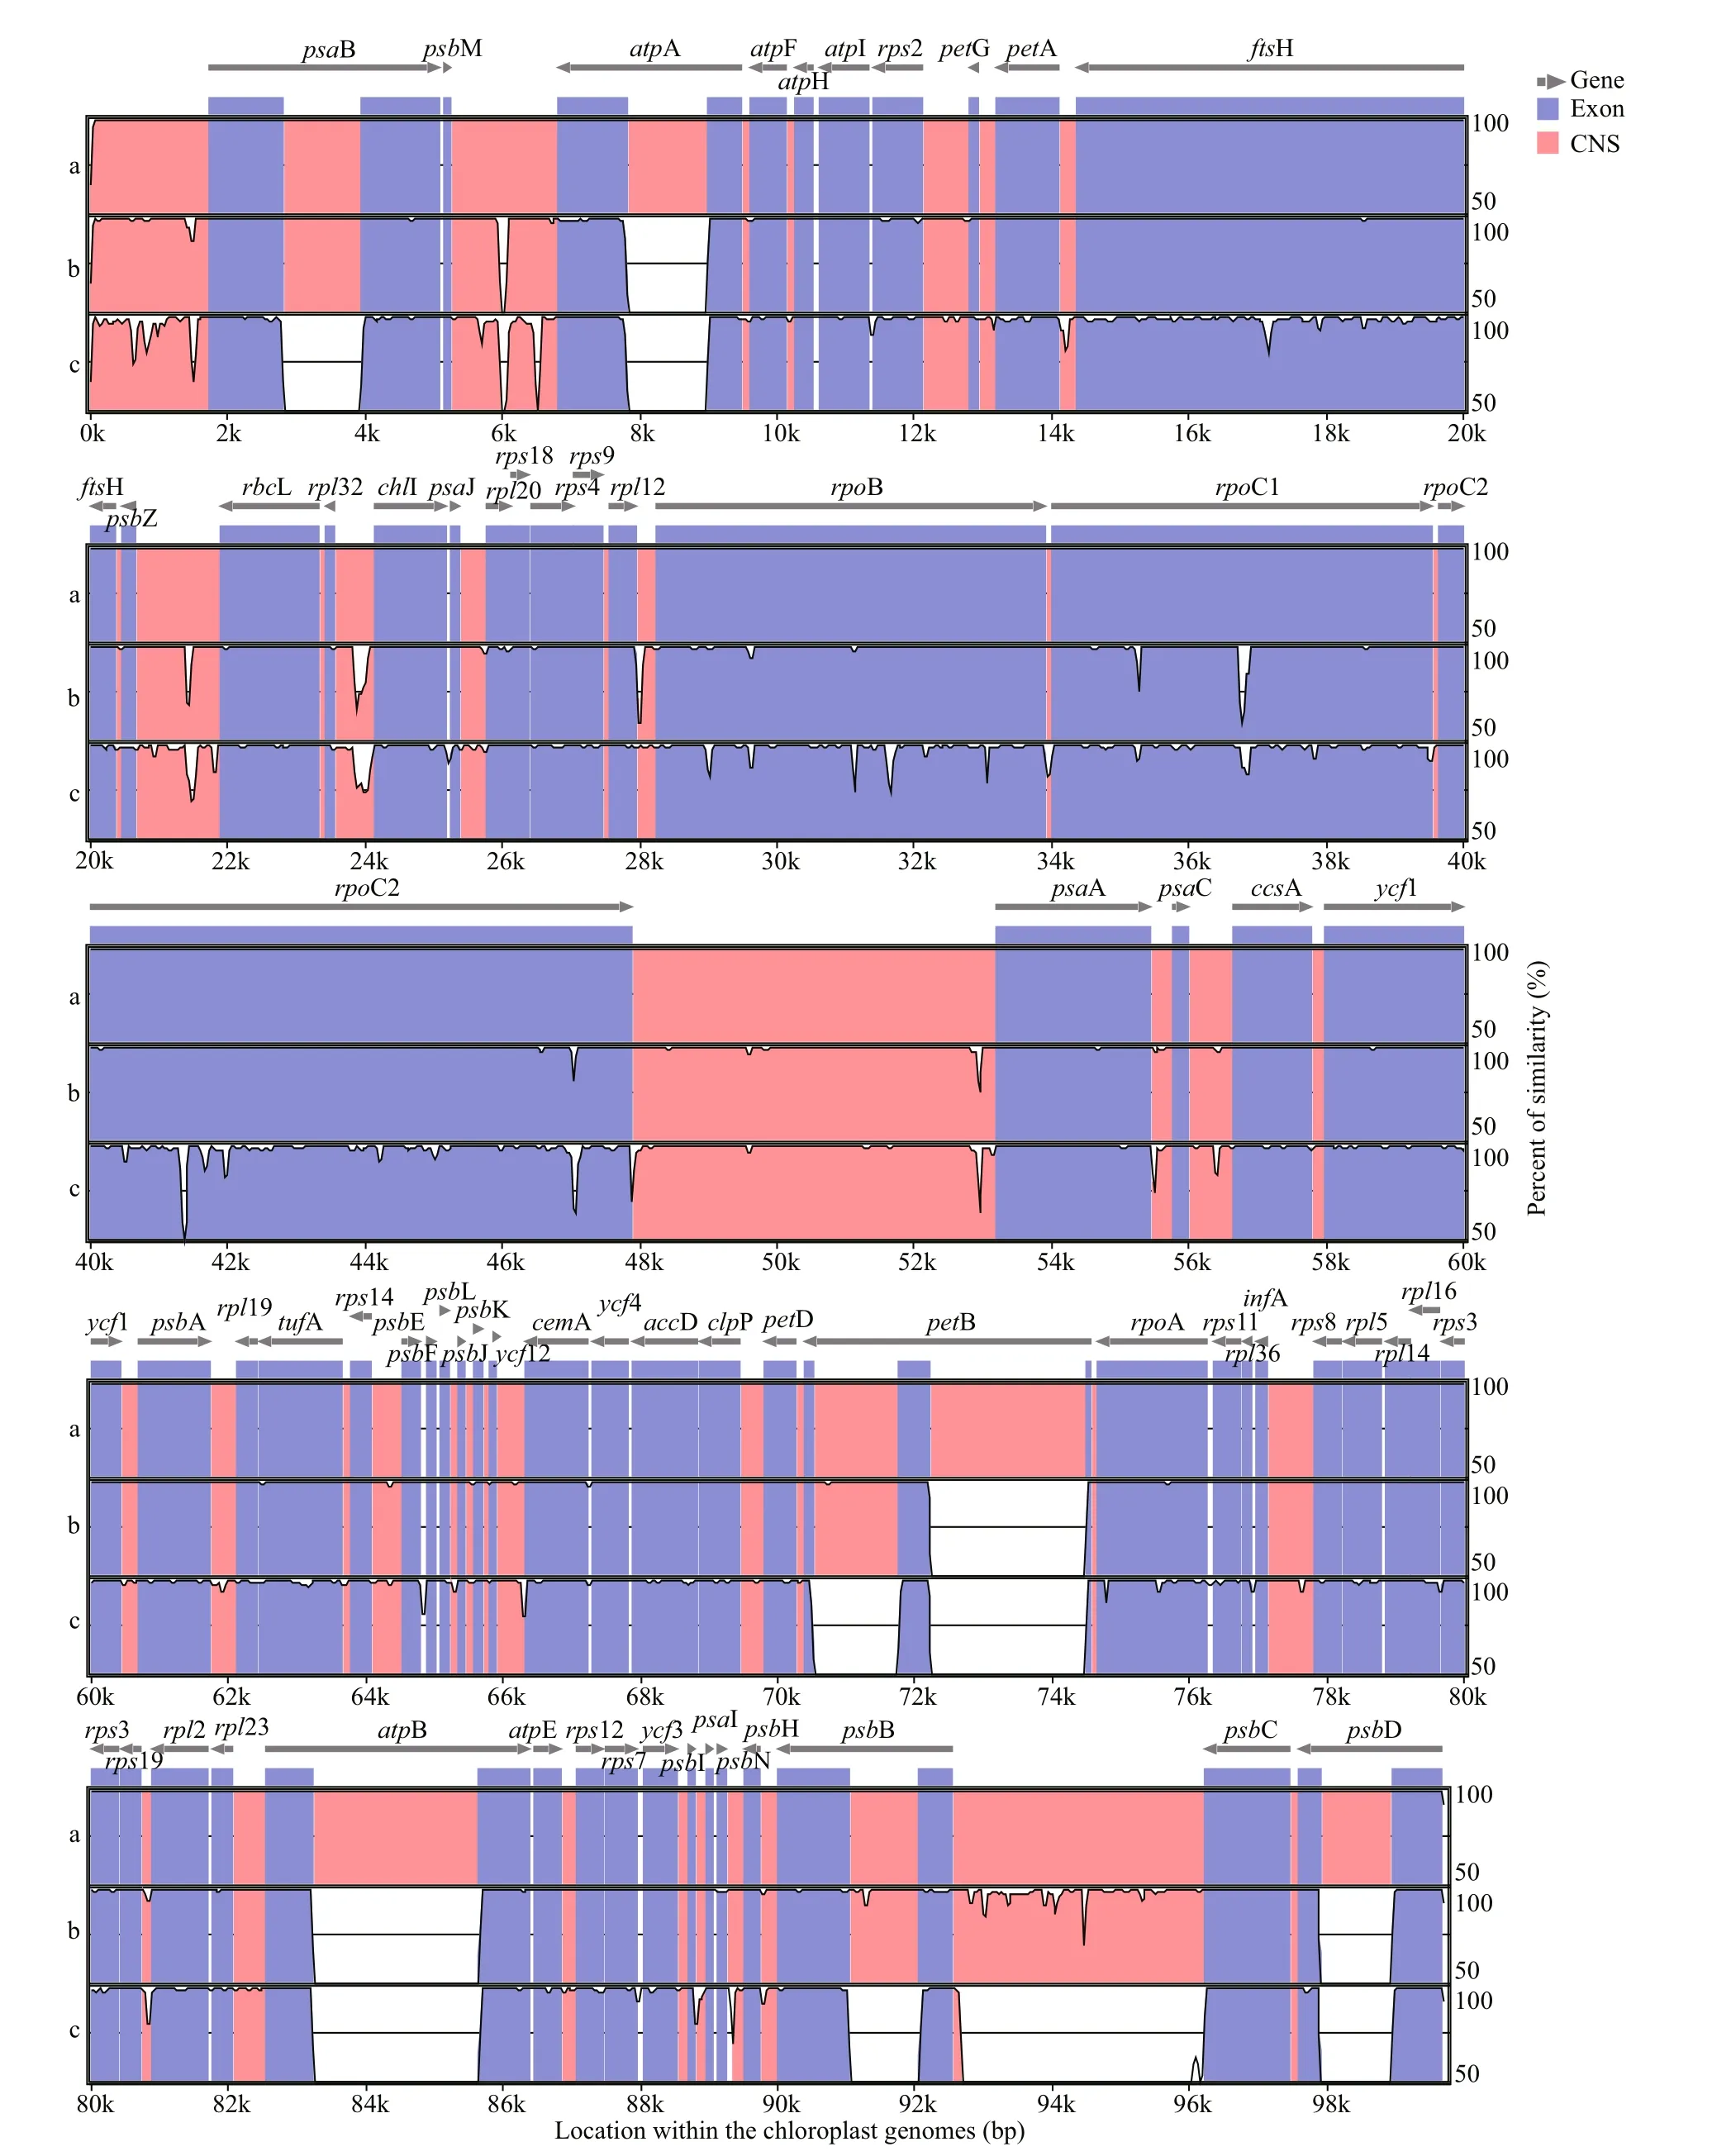
Fig.6 Comparison of the chloroplast genome sequences among U. linza and two ecotypes of U. prolifera by mVISTA
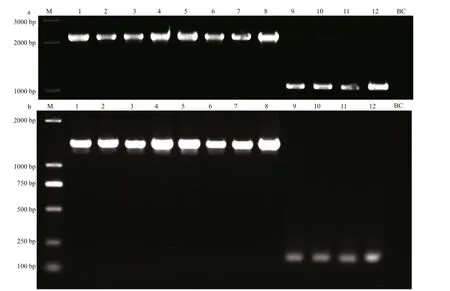
Fig.7 PCR detection of psa B and pet B markers
Moreover, in addition to the interspecif ic markers forU.linzaandU.prolifera, the candidates of intraspecif ic markers specif ic to the f loating ecotype ofU.proliferawere also noted in this study. Novel organelle genome-derived markers could be developed from the chloroplast genomes and could be used together with the nuclear genome-derived SCAR marker for the ecological investigation of the green tide of Yellow Sea (Zhao et al., 2015).
5 CONCLUSION
In this study, a chloroplast genome from one attached population ofU.proliferawas completely sequenced, and comparative genome analysis was performed with other existing chloroplast genomes fromU.linzaand the f loating ecotype ofU.prolifera.The results showed that in spite of the high level of collinearity among three genomes, there were plenty of interspecif ic and intraspecif ic genetic variations.Two developed markers,psaB andpetB, were shown to be able to distinguish these two closely related species and were applicable to more attached populations ofU.proliferafrom a wide range of geographical sources.
6 DATA AVAILABILITY STATEMENT
The genome sequence data of this study are openly available in GenBank of NCBI at https://www.ncbi.nlm.nih.gov under the accession No. MZ571508.The datasets analyzed during the current study were available from the corresponding author on reasonable request.
 Journal of Oceanology and Limnology2022年6期
- Journal of Oceanology and Limnology的其它文章
- Overview of harmful algal blooms (red tides) in Hong Kong during 1975–2021
- Information standardization for typical toxic and harmful algae in China’s coastal waters—a case study of Karenia mikimotoi*
- Biochemical composition of the brown tide causative species Aureococcus anophageff erens cultivated in diff erent nitrogen sources*
- Identif ication of paralytic shellf ish toxin-producing microalgae using machine learning and deep learning methods*
- Screening for lipophilic marine toxins and their potential producers in coastal waters of Weihai in autumn, 2020*
- First observation of domoic acid and its isomers in shellf ish samples from Shandong Province, China*
