
Review on the management of cardiovascular risk factors in the elderly
2022-12-20 09:29MagaliGonzlezColaHarmandMardelMarGarcSanzAntniaAgustPablosarPradaArrondoAlbertoDomnguezRodrguezBeatrizGrandalLeirDavidPeOteroNataliaNegrMenaJesJavierpezHernndezPabloezVillanueva
Journal of Geriatric Cardiology 2022年11期
Magali González-Colaço Harmand, María del Mar García-Sanz, Antònia Agustí, Pablo César Prada-Arrondo, Alberto Domínguez-Rodríguez, Beatriz Grandal-Leirós, David Peña-Otero, Natalia Negrín-Mena, Jesús Javier López-Hernández, Pablo Díez-Villanueva
1. Department of Internal Medicine-Geriatric Medicine, Hospital Universitario Nuestra Señora de Candelaria, Santa Cruz de Tenerife, Spain; 2. Universidad Europea de Canarias, Faculty of Health Sciences, La Orotava, Spain; 3. Clinical Pharmacology Department, Hospital Universitario Marqués de Valdecilla, Santander, Spain; 4. Clinical Pharmacology Department. Hospital Vall d'Hebron, Barcelona, Spain; 5. Cardiac Surgery Department, Hospital Universitario de Canarias,La Laguna, Tenerife, Spain; 6. Cardiology Department, Hospital Universitario de Canarias, La Laguna, Tenerife, Spain;7. Ortogeriatric Department. Hospital Universitario de Canarias, La Laguna, Tenerife, Spain; 8. Subdepartment of Health Care, Hospital Universitario Marqués de Valdecilla, Servicio Cántabro de Salud, Santander, Spain; 9. Instituto de Investigación Sanitaria Gregorio Marañón (liSGM) y Valdecilla (IDIVAL), Spain; 10. Hospital Universitario de Canarias, Sistema Canario de Salud, Tenerife, Spain; 11. Primary Care Management, Servicio Cántabro de Salud, Spain; 12. Cardiology Department, Hospital de la Princesa, Madrid, Spain
ABSTRACT Cardiovascular risk factors (CVRF) are very prevalent in the elderly population and in addition to predisposing to cardiovascular disease they are related to functional decline, which limits the quality of life in this population. The objective of this work is to offer a review of the current evidence in the management of CVRF in the elderly population. The search strategy was executed in PubMed, Clinicalstrials.org and Embase, to search for clinical trials, observational cohort or cross-sectional studies, reviews, and clinical practice guidelines focused or including elderly population. The results provided were refined after reading the title and abstract, as well as elimination of duplicates, and were finally identified and assessed following the GRADE methodology. A total of 136 studies were obtained for all predefined risk factors, such as sedentary lifestyle, smoking, obesity and metabolic syndrome, hypertension, diabetes mellitus, dyslipidemia and alcohol. We described the results of the studies identified and assessed according to their methodological quality in different recommendation sections: diagnostic and prevention, intervention, or treatment in the elderly population. As the main limitation to the results of this review, there is the lack of quality studies whose target population is elderly patients. This issue limits the recommendations that can be made in this population.Due to this reason, comprehensive geriatric assessment seems the best tool currently available to implement the most appropriate treatment plans based on the baseline situation and comorbidity of each elderly patient.
Cardiovascular risk factors (CVRF) are highly prevalent among older adults, with hypertension being present in around 70%,obesity in 20%-40%, diabetes in 15% and dyslipidaemia in 35%.[1]Cardiovascular disease (CVD) causes 39% of deaths in octogenarians.[1]Moreover, its presence in this population is linked to cognitive decline, functional deterioration and dependency,increasing healthcare costs.[1,2,3]
Despite the importance of CVRF, there is still a wide margin for improvement in the management of CVRF in the older population. This is partly because the main risk factor for CVD is age,[3]which cannot be modified, but also because diagnostic criteria are not adjusted to this age group and their treatment goals do not always include maintaining quality of life and functional status, in addition to survival. There are numerous standards of care and clinical practice guidelines for the management of CVRF aimed at the general population, but recommendations for older adults are scarce and are too general to be easily and safely applied in clinical practice.
Moreover, frailty, a particular feature in this age group, is not usually included in guidelines on the management of CVRF and should be included in routine clinical practice since it has a demonstrated relationship with CVD in older adults.[4]This is particularly important, given the reverse epidemiology of CVRF in older adults, which refers to the loss of predictive power of classical CVRF in persons older than 70 years. Consequently, there is a need to identify other, non-traditional risk factors.
The aim of this study was to summarize the current evidence on the management of CVRF in older adults, focusing on the treatment goals specific to this age group, such as functional independence,quality of life, and the management of patients with frailty.
METHODS
The working group consisted of specialists from different fields related to the care of older adults(geriatricians, cardiologists, pharmacologists, and nurses). For each of the CVRF (sedentariness, smoking, obesity, metabolic syndrome, hypertension,type 2 diabetes mellitus, dyslipidemia and alcohol intake), a series of clinical questions was formulated on management specifically in older adults(Table 1)

Table 1 Clinical questions on the management of cardiovascular risk factors in the older population.

AF: atrial fibrillation; CKD: chronic kidney disease; DBP: diastolic blood pressure; DM2: type 2 diabetes mellitus; DPP4: dipeptidyl peptidase-4; GLP-1 receptor antagonists: glucagon-like peptide 1 receptor antagonist ; HF: heart failure; MS: metabolic syndrome: SBP:systolic blood pressure
We reviewed the literature using the GRADE (Grading of Recommendations of Assessment Development and Evaluations) system.[5]We analysed study design and quality, consistency, and direct and indirect evidence (Tables 2-8, citations are listed in Supplementary 1). Overall quality was defined as follows: high (very unlikely that new studies will change confidence in the results); moderate (likely that new studies will change confidence in the results); low (likely that new studies will affect confidence in the quality of the results); and very low (any result is highly doubtful). We assessed only full-text publications.
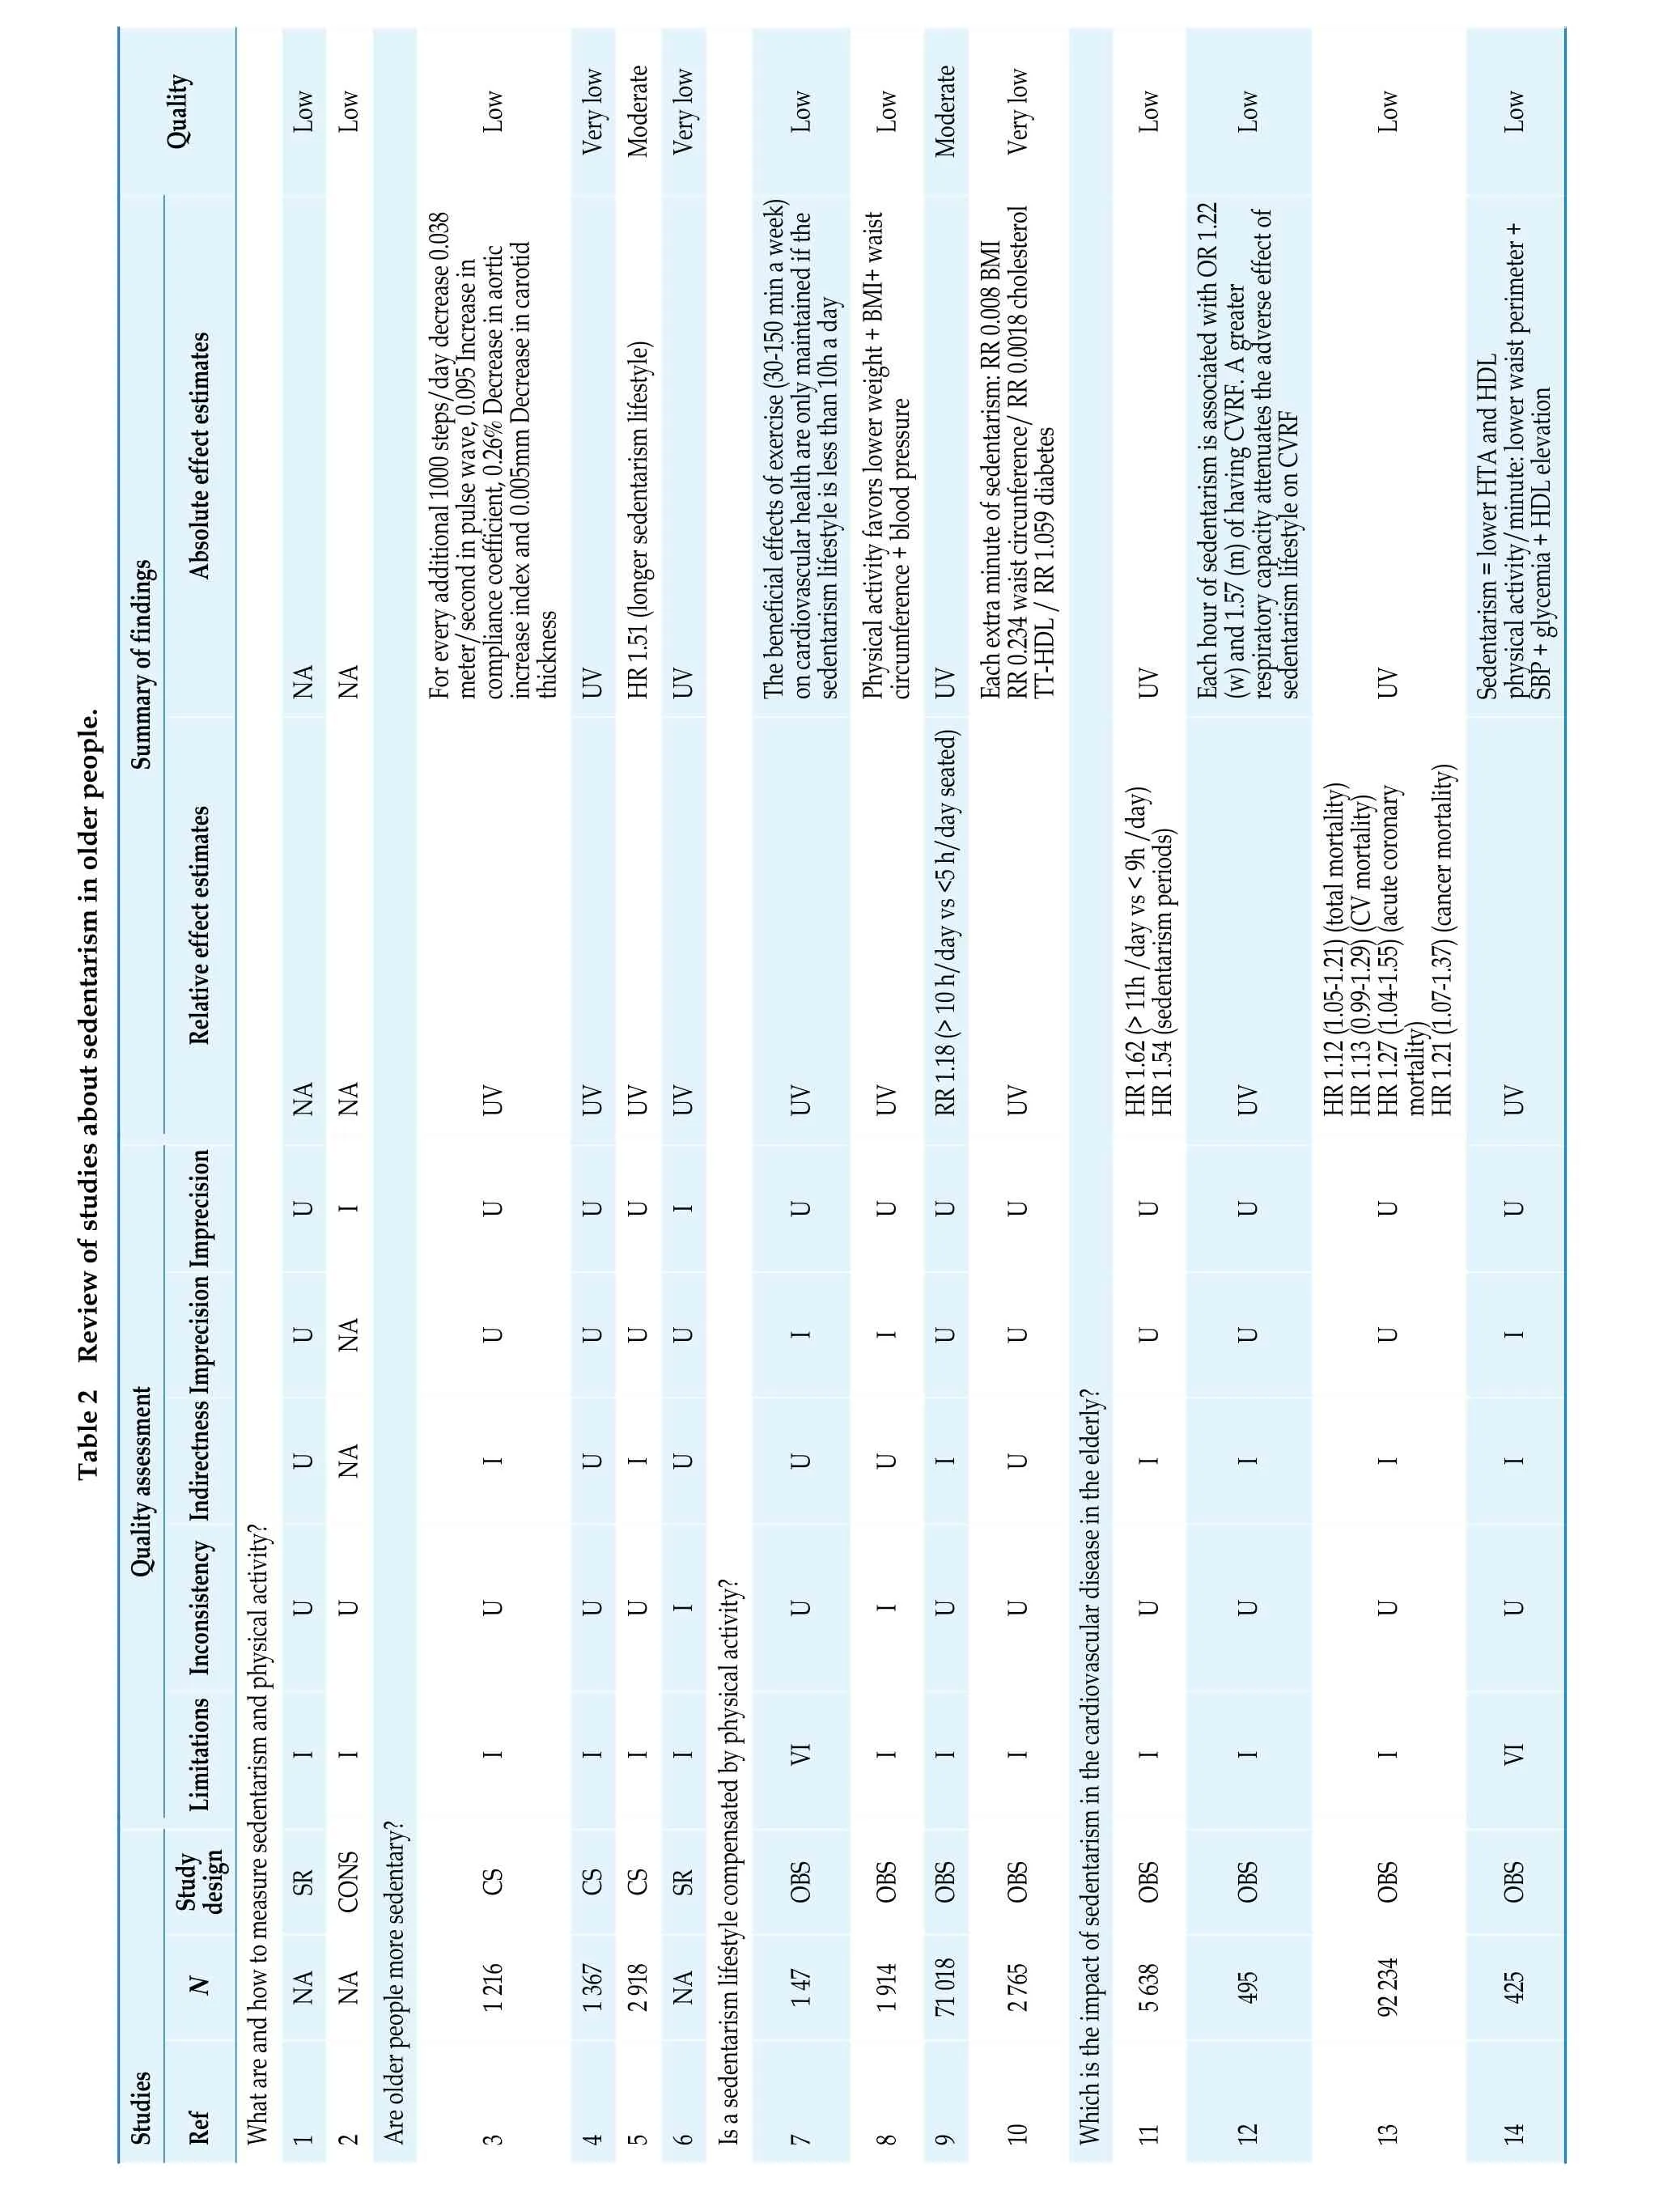
Quality Low Low Low Very low Moderate Very low Low Low Moderate Very low Low Low Low Low Table 2 Review of studies about sedentarism in older people.Summary of fin dings Absolute effect estimatesy additional 1000 steps/day de cond in pulse wave, 0.095 Incr s ce coefficient, 0.26% Decrease index and 0.005mm Decrease i(longer sedentarism lifestyle)NA NA For evercrease 0.038 meter/seease in thicknes complianin aortic increase n carotid UV HR 1.51 UV The beneficial effects of exercise (30-150 min a week)on cardiovascular health are only maintained if the sedentarism lifestyle is less than 10h a day Physical activity favors lower weight + BMI+ waist circumference + blood pressure UV Each extra minute of sedentarism: RR 0.008 BMI RR 0.234 waist circunference/ RR 0.0018 cholesterol TT-HDL / RR 1.059 diabetes UV Each hour of sedentarism is associated with OR 1.22(w) and 1.57 (m) of having CVRF. A greater sedentarism lifestyle on CVRF respiratory capacity attenuates the adverse effect of Sedentarism = lower HTA and HDL physical activity/minute: lower waist perimeter +SBP + glycemia + HDL elevation Relative effect estimates NA NA UV UV UV UV UV UV RR 1.18 (> 10 h/day vs <5 h/day seated)UV HR 1.62 (> 11h /day vs < 9h /day)HR 1.54 (sedentarism periods)UV HR 1.12 (1.05-1.21) (total mortality)HR 1.13 (0.99-1.29) (CV mortality)HR 1.27 (1.04-1.55) (acute coronary mortality) HR 1.21 (1.07-1.37) (cancer mortality)UV UV U I U UU I U U U U U U U U U NA U UU U I I U U U U U I Quality assessment U NA I UI U U U I U I I I I IndirectnessImprecisionImprecision U UU What are and how to measure sedentarism and physical activity?LimitationsInconsistency U U I U I U U U U U U I I I II I VI I I I I I I VI CONS N Study design SR CS CS CS SR OBS OBS OBS OBS OBS OBS OBS OBS NA NA 1 216 1 367 2 918 NA 1 47 1 914 71 018 2 765 5 638 495 92 234 425 Studies Ref 1 2 Are older people more sedentary?3 45 6Is a sedentarism lifestyle compensated by physical activity?7 8 9 10 Which is the impact of sedentarism in the cardiovascular disease in the elderly?11 12 13 14
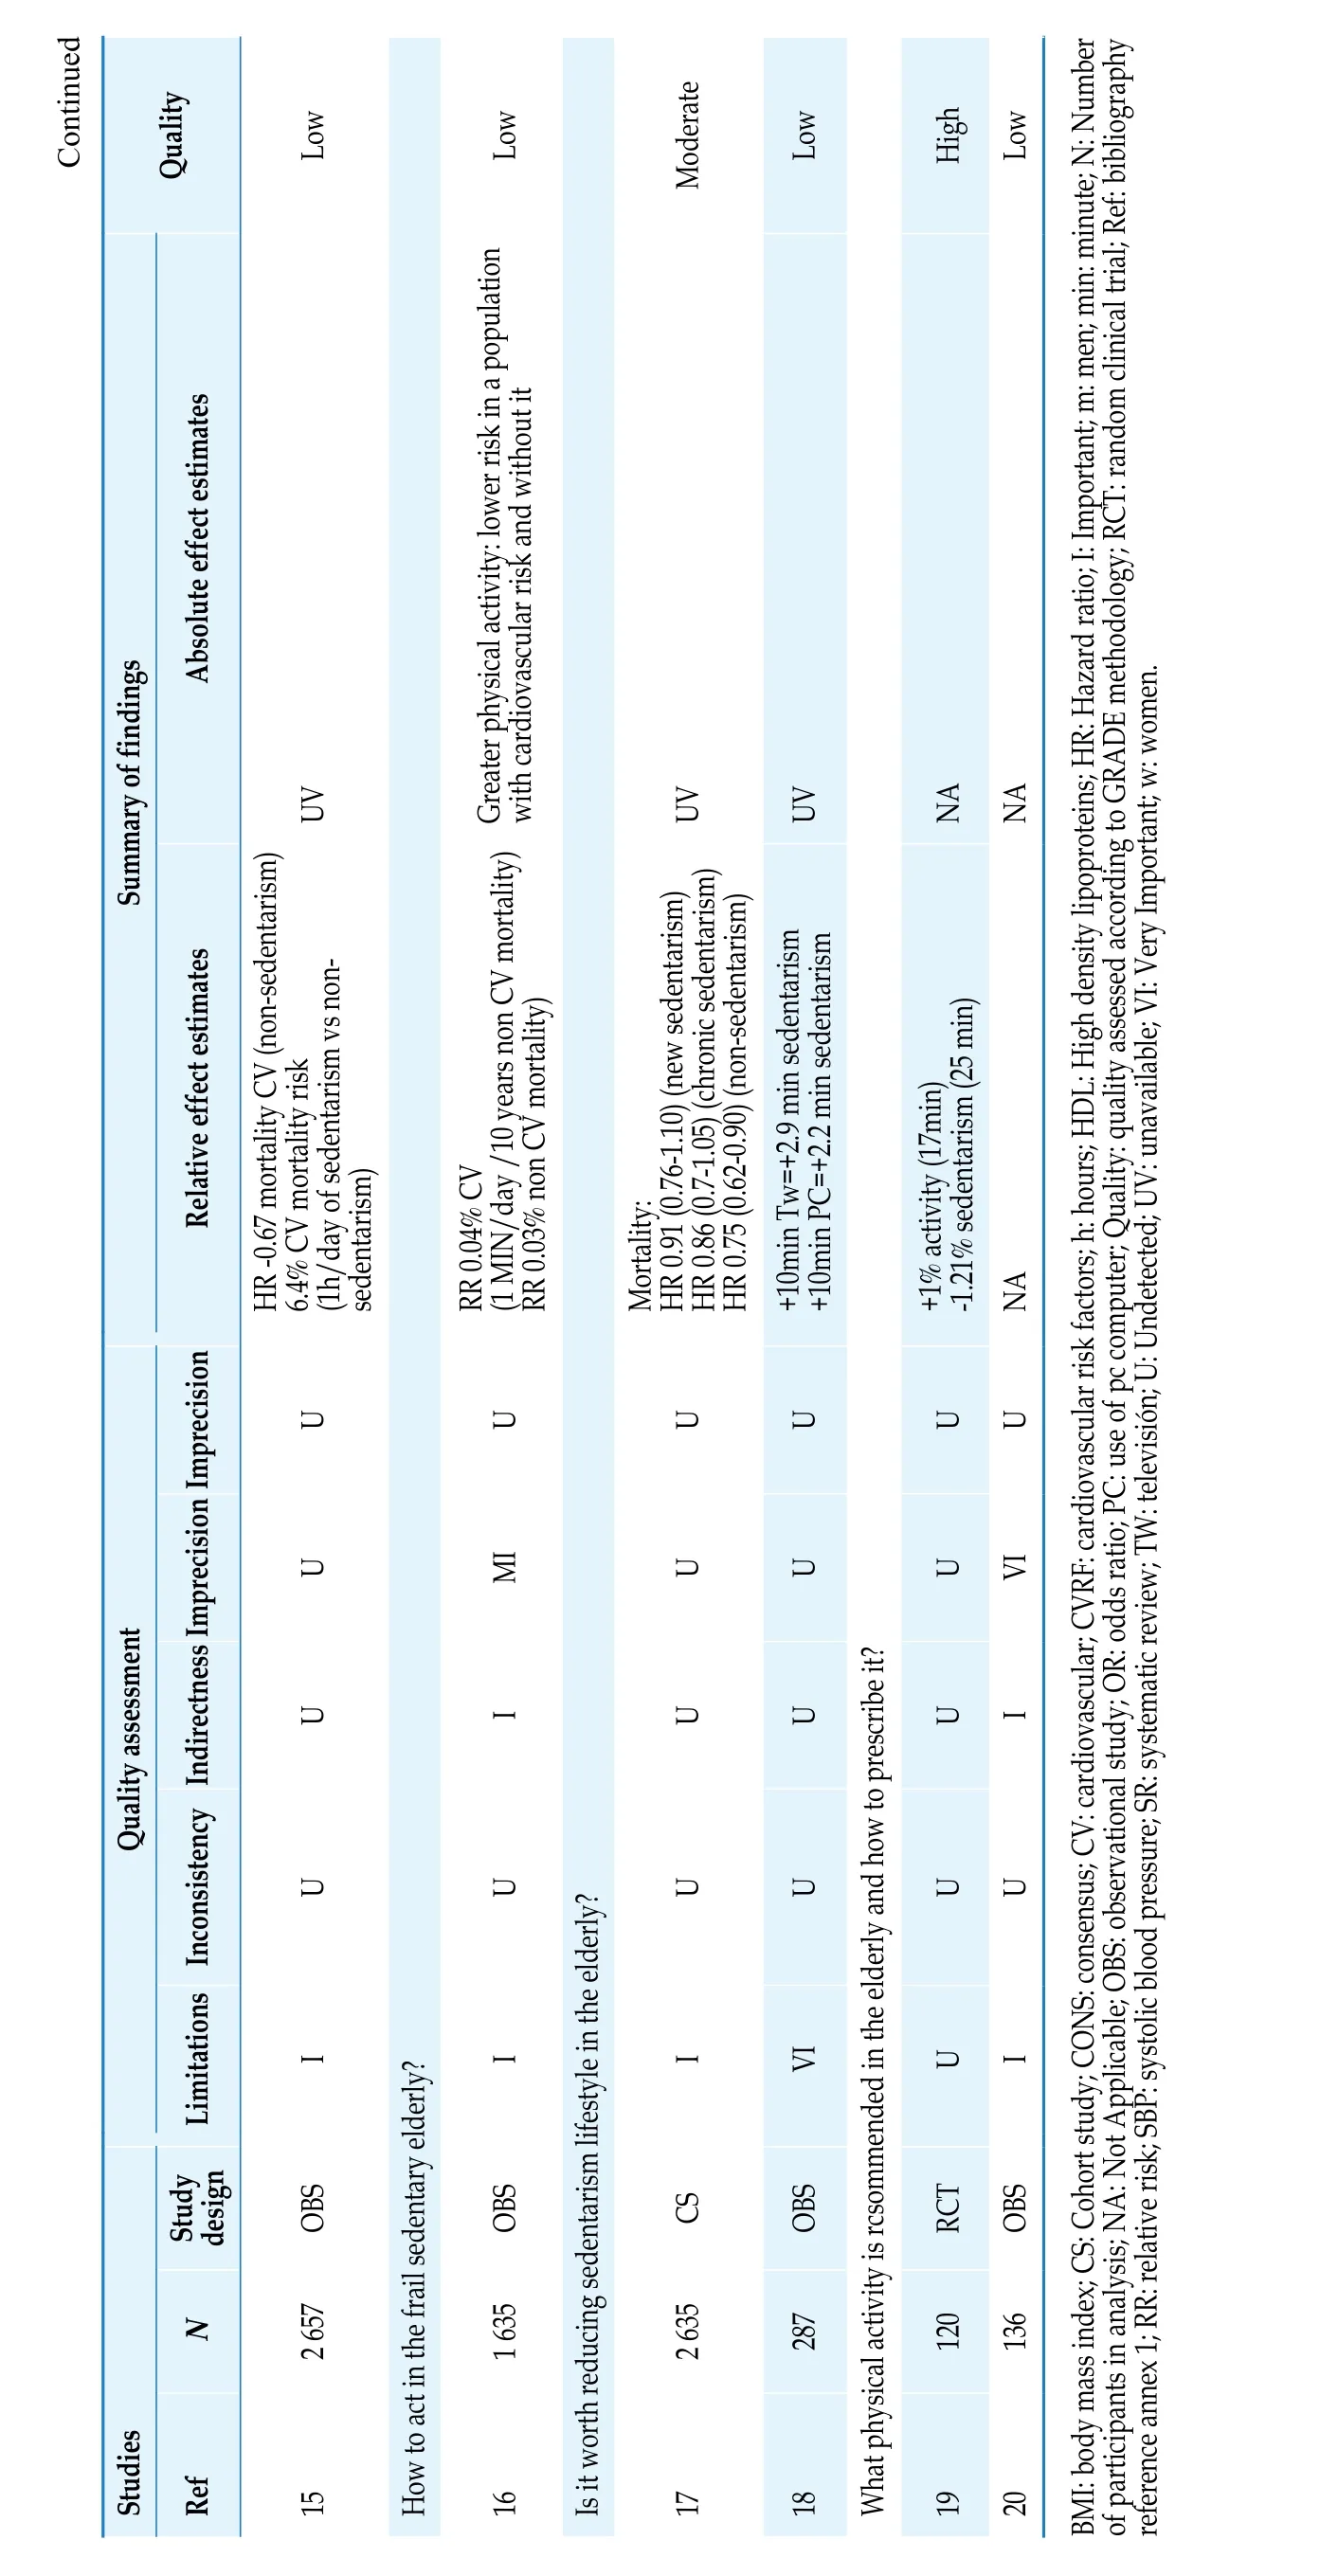
Continued Quality Low Low Moderate Low High Low Summary of findings Absolute effect estimates UV Greater physical activity: lower risk in a population with cardiovascular risk and without it UV UV NA NA Relative effect estimates HR -0.67 mortality CV (non-sedentarism)6.4% CV mortality risk (1h/day of sedentarism vs nonsedentarism)RR 0.03% non CV mortality)HR 0.86 (0.7-1.05) (chronic sedentarism)HR 0.75 (0.62-0.90) (non-sedentarism)+10min Tw=+2.9 min sedentarism+10min PC=+2.2 min sedentarism NA IndirectnessImprecisionImprecision U U RR 0.04% CV (1 MIN/day /10 years non CV mortality)U Mortality: HR 0.91 (0.76-1.10) (new sedentarism)U U+1% activity (17min) -1.21% sedentarism (25 min)U U MI U U U VI Quality assessment U I U U U I U U U U U U LimitationsInconsistency I I I VI U I OBS N Study design OBS CS OBS RCT OBS 2 657 1 635 2 635 287 120 136 Studies Ref 15 How to act in the frail sedentary elderly?16 Is it worth reducing sedentarism lifestyle in the elderly?17 18 What physical activity is rcsommended in the elderly and how to prescribe it?19 20 BMI: body mass index; CS: Cohort study; CONS: consensus; CV: cardiovascular; CVRF: cardiovascular risk factors; h: hours; HDL: High density lipoproteins; HR: Hazard ratio; I: Important; m: men; min: minute; N: Number of participants in analysis; NA: Not Applicable; OBS: observational study; OR: odds ratio; PC: use of pc computer; Quality: quality assessed according to GRADE methodology; RCT: random clinical trial; Ref: bibliography reference annex 1; RR: relative risk; SBP: systolic blood pressure; SR: systematic review; TW: televisión; U: Undetected; UV: unavailable; VI: Very Important; w: women.
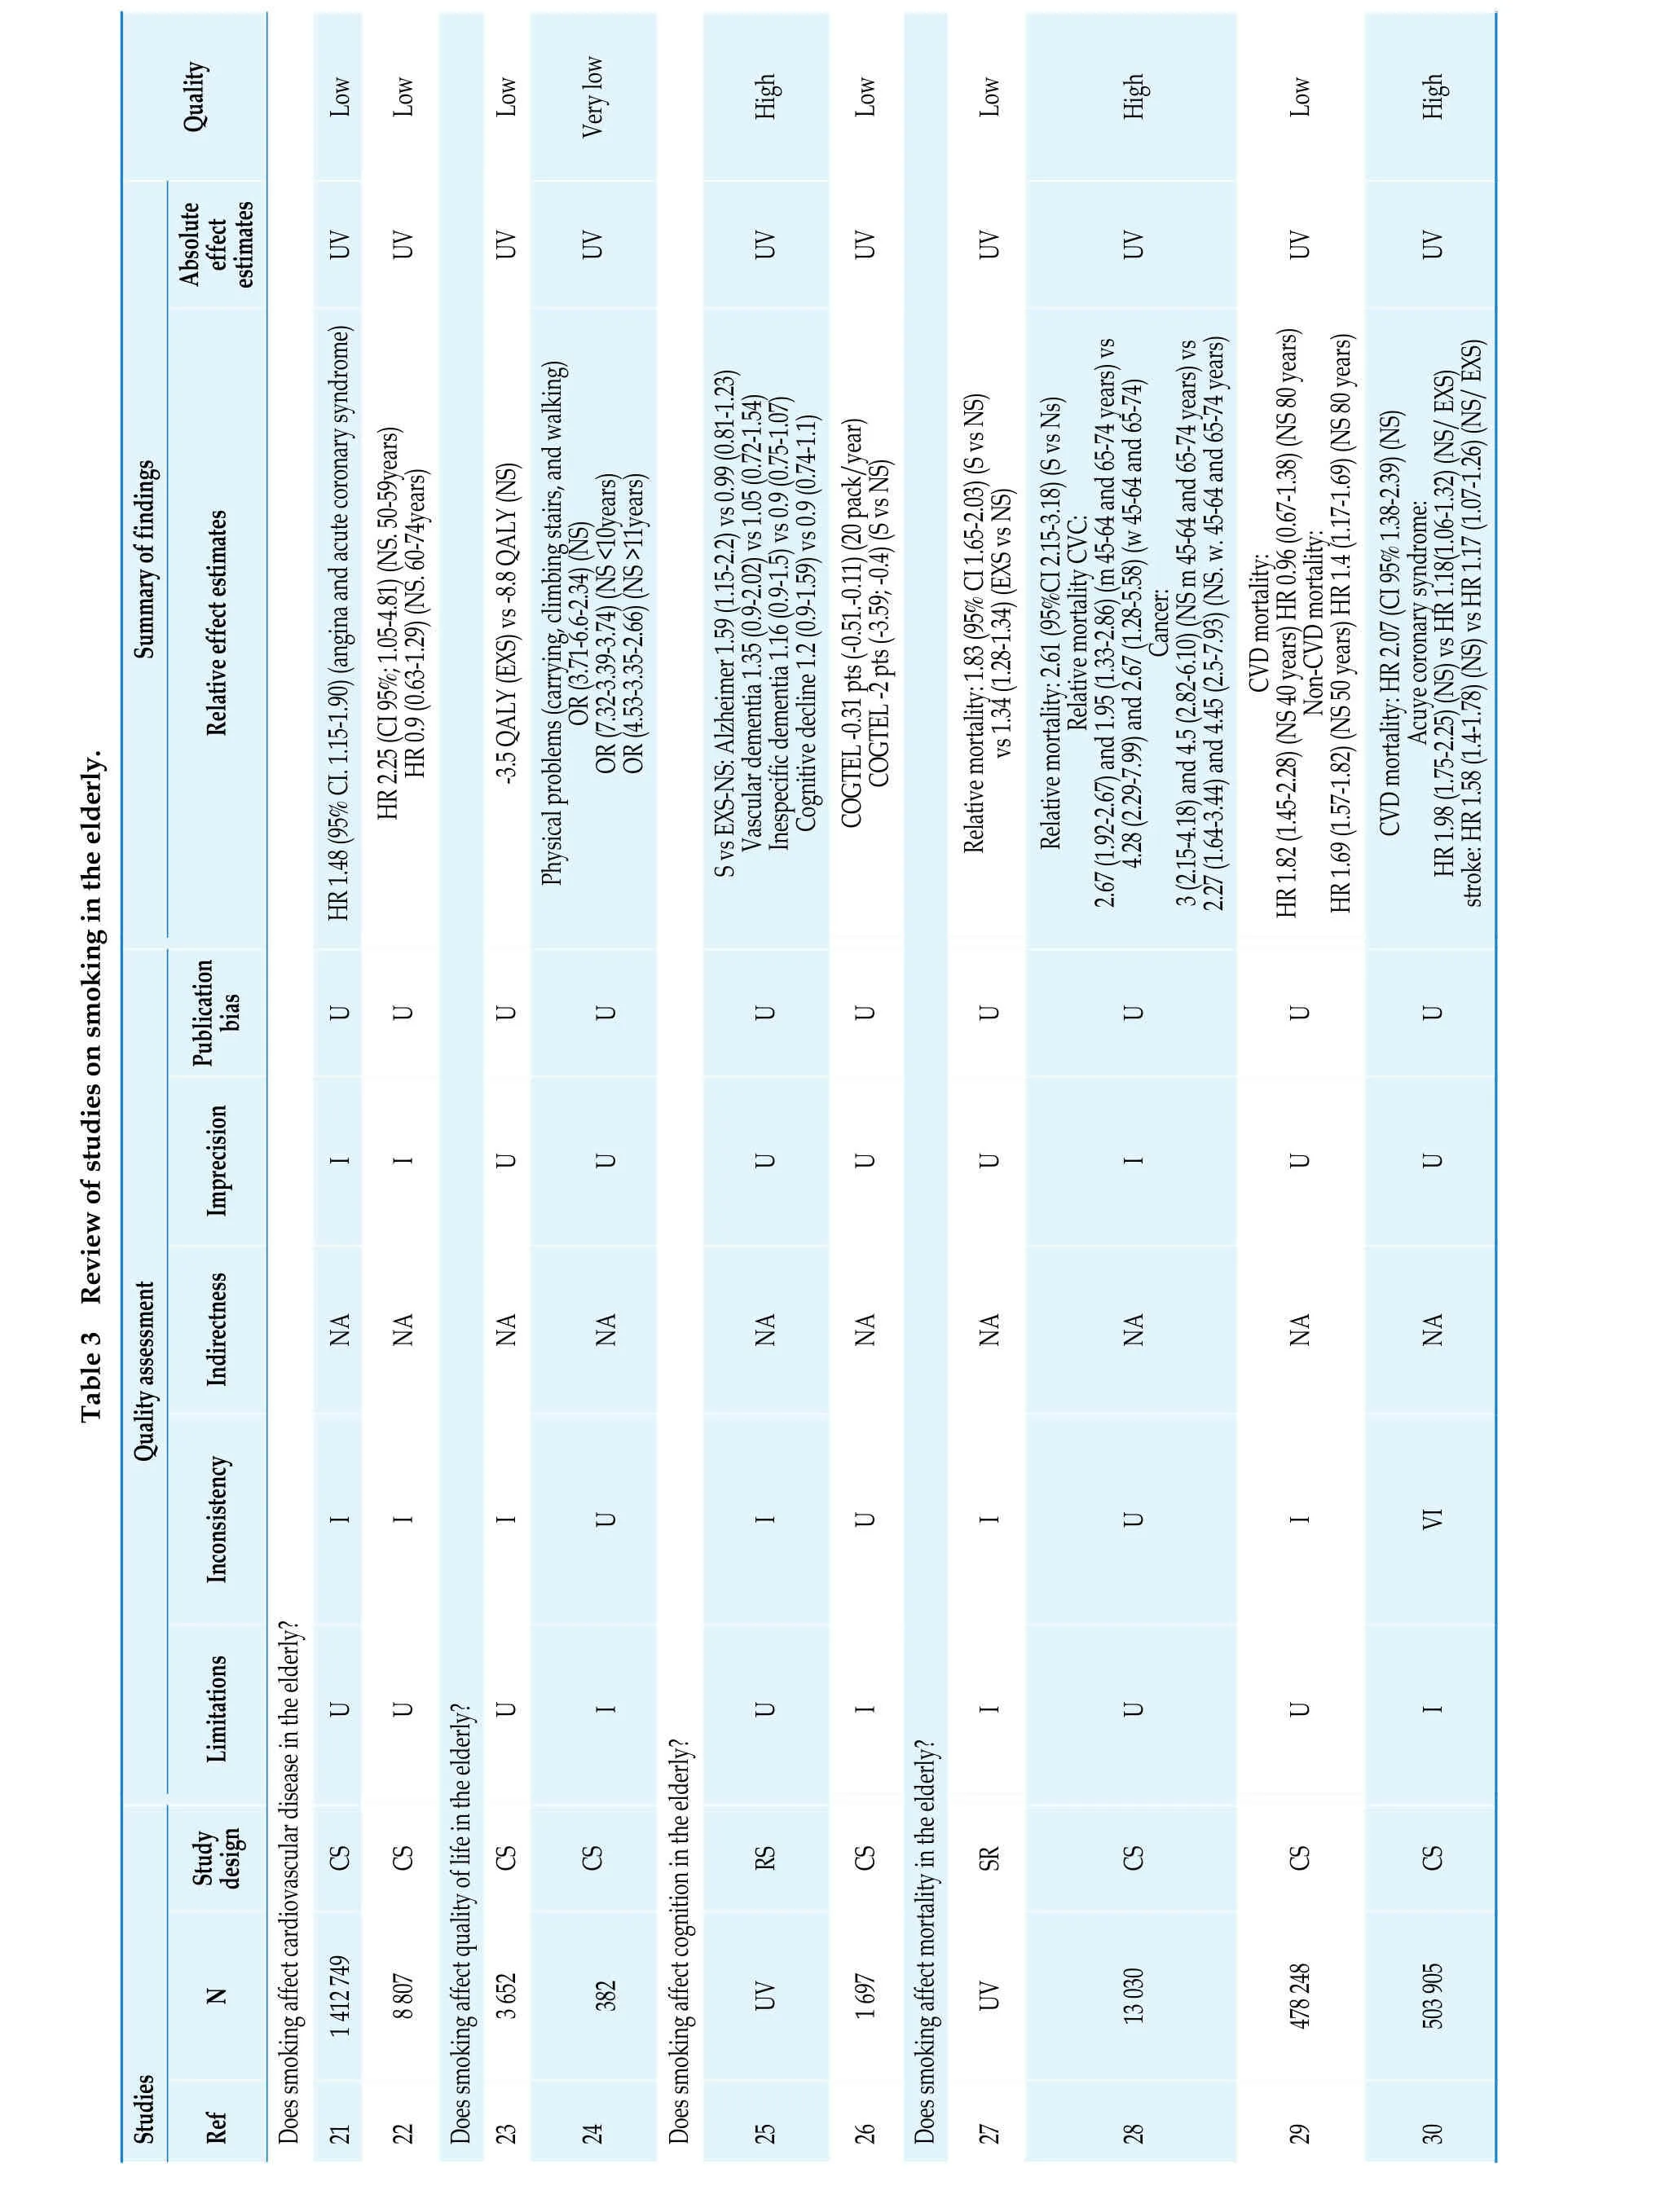
Quality Low Low Low Very low High Low Low High Low High UV UV UV UV UV UV UV UV UV Summary of findings OR (3.71-6.6-2.34) (NS)Relative mortality CVC:Cancer:CVD mortality:Non-CVD mortality:Table 3 Review of studies on smoking in the elderly.Relative effect estimates Absolute effect estimates HR 1.48 (95% CI. 1.15-1.90) (angina and acute coronary syndrome)UV HR 2.25 (CI 95%; 1.05-4.81) (NS. 50-59years)HR 0.9 (0.63-1.29) (NS. 60-74years)-3.5 QALY (EXS) vs -8.8 QALY (NS)Physical problems (carrying, climbing stairs, and walking)OR (7.32-3.39-3.74) (NS <10years)OR (4.53-3.35-2.66) (NS >11years)S vs EXS-NS: Alzheimer 1.59 (1.15-2.2) vs 0.99 (0.81-1.23)Vascular dementia 1.35 (0.9-2.02) vs 1.05 (0.72-1.54)Inespecific dementia 1.16 (0.9-1.5) vs 0.9 (0.75-1.07)Cognitive decline 1.2 (0.9-1.59) vs 0.9 (0.74-1.1)COGTEL -0.31 pts (-0.51.-0.11) (20 pack/year)COGTEL -2 pts (-3.59; -0.4) (S vs NS)Relative mortality: 1.83 (95% CI 1.65-2.03) (S vs NS)vs 1.34 (1.28-1.34) (EXS vs NS)Relative mortality: 2.61 (95%CI 2.15-3.18) (S vs Ns)2.67 (1.92-2.67) and 1.95 (1.33-2.86) (m 45-64 and 65-74 years) vs 4.28 (2.29-7.99) and 2.67 (1.28-5.58) (w 45-64 and 65-74)3 (2.15-4.18) and 4.5 (2.82-6.10) (NS m 45-64 and 65-74 years) vs HR 1.82 (1.45-2.28) (NS 40 years) HR 0.96 (0.67-1.38) (NS 80 years)2.27 (1.64-3.44) and 4.45 (2.5-7.93) (NS. w. 45-64 and 65-74 years)HR 1.69 (1.57-1.82) (NS 50 years) HR 1.4 (1.17-1.69) (NS 80 years)CVD mortality: HR 2.07 (CI 95% 1.38-2.39) (NS)Acuye coronary syndrome:HR 1.98 (1.75-2.25) (NS) vs HR 1.18(1.06-1.32) (NS/ EXS)stroke: HR 1.58 (1.4-1.78) (NS) vs HR 1.17 (1.07-1.26) (NS/ EXS)Imprecision Publication bias U U U U U U U U U U I I U U U U U I U U Quality assessment Indirectness NA NA NA NA NA NA NA NA NA NA Inconsistency I I I U I U I U I VI Limitations U U U U I I U U I N Study design Does smoking affect cardiovascular disease in the elderly?CS CS CS CSI RS CS SR CS CS CS 1 412 749 8 807 3 652 UV 1 697 UV 13 030 478 248 503 905 Studies Ref 21 22 Does smoking affect quality of life in the elderly?23 24382 Does smoking affect cognition in the elderly?25 26 Does smoking affect mortality in the elderly?27 28 29 30

Continued Quality Low Low High Low Low Low Low Relative effect estimates Absolute effect estimates UV UV UV UV UV Summary of findings COPD risk hospitalization: HR 6.81 (CI95%: 5.87-7.89) (NS/ EXS)General risk hospitalization:HR 0.84 (95% CI. 0.82-0.86) 16% (c/10 years smoking cessation)(w)Stroke (NS/ EXS): RR 1.39 (95%CI 1.13-1.70) (m) vs RR 1.65 (1.21-2.25)3.35 (2.23-5-02) (w) CVD total (NS/ EXS)Acute coronary syndrome (NS/ EXS): RR 1.6 (1.39-1.84) (m) vs RR RR 1.60 (1.39-1.84) (m) vs RR 2.06 (1.69-2.51) (w)Mortality (NS): RR 2.43 (2.21-2.48) (m) vs RR 1.68 (1.56-1.8) (w)Mortality (NS 3-5 years): RR 1.29 (0.88-1.69) (m) vs RR 1.55(1.17-1.93)(w)(smoking cessation 6 months)88% vs 82% (try to smoking cessation 6 months) 40% vs 33 % (p<0.05)88% vs 82% (p<0.05) (try to smoking cessation 12 months) 33% vs 31% (smoking cessation 12 months)OR 2.24 (CI 95%; 1.07-4.69) (w)UV OR 1.1 (0.7-1.8) (control vs therapy 1) vs OR 1.7 (1.1-2.6)(control vs therapy 2)HR 0.74 (CI 95%; 0.6-0.92)UV U U U Imprecision Publication bias U U U U I U U VI I VI VI Quality assessment Indirectness NA NA NA U U U NA Inconsistency U I VI U U U U Limitations I I I I I I U N Study design Is it beneficial to quit smoking in older people?CS OBS CS RCT RCT RCT CS 877 243 267 010 95 683 470 Studies Ref 31 32 33 Are smoking cessation int erventions effective in the elder ly?34 35 177 92 (in treatment group)36 1 553 1 016 (in treatment group)37 315 (in treatment group)CI: confidence Interval; CO GTEL: Cogn itive Telephone Screening Instrument; CO PD: chronic obstru ctive pulmonary d isease; CS: co hort study; CV: cardiovascular; CVD: cardiovascular disease; COGTEL: Cognitive Te lephone Screening Instrument; COPD: chroni c obstructiv e pulmonary disea se; EXS: exsmokers; HR: Hazard ratio; I: Important; m: me n;NA: no app licable; NS: non smoking; OBS: observational study; OR: odds ratio; RCT: random clinical trial; Ref:bibliography reference ann ex 1; RR: re lative risk; RV: Rev iew; S: smokers; SR: sy stematic review; U: Undetected; UV: unavailable; VI: very important; QALY: quality-adjusted life year; Quality: qualit y assessed acc ording to GRADE methodology; w: women.
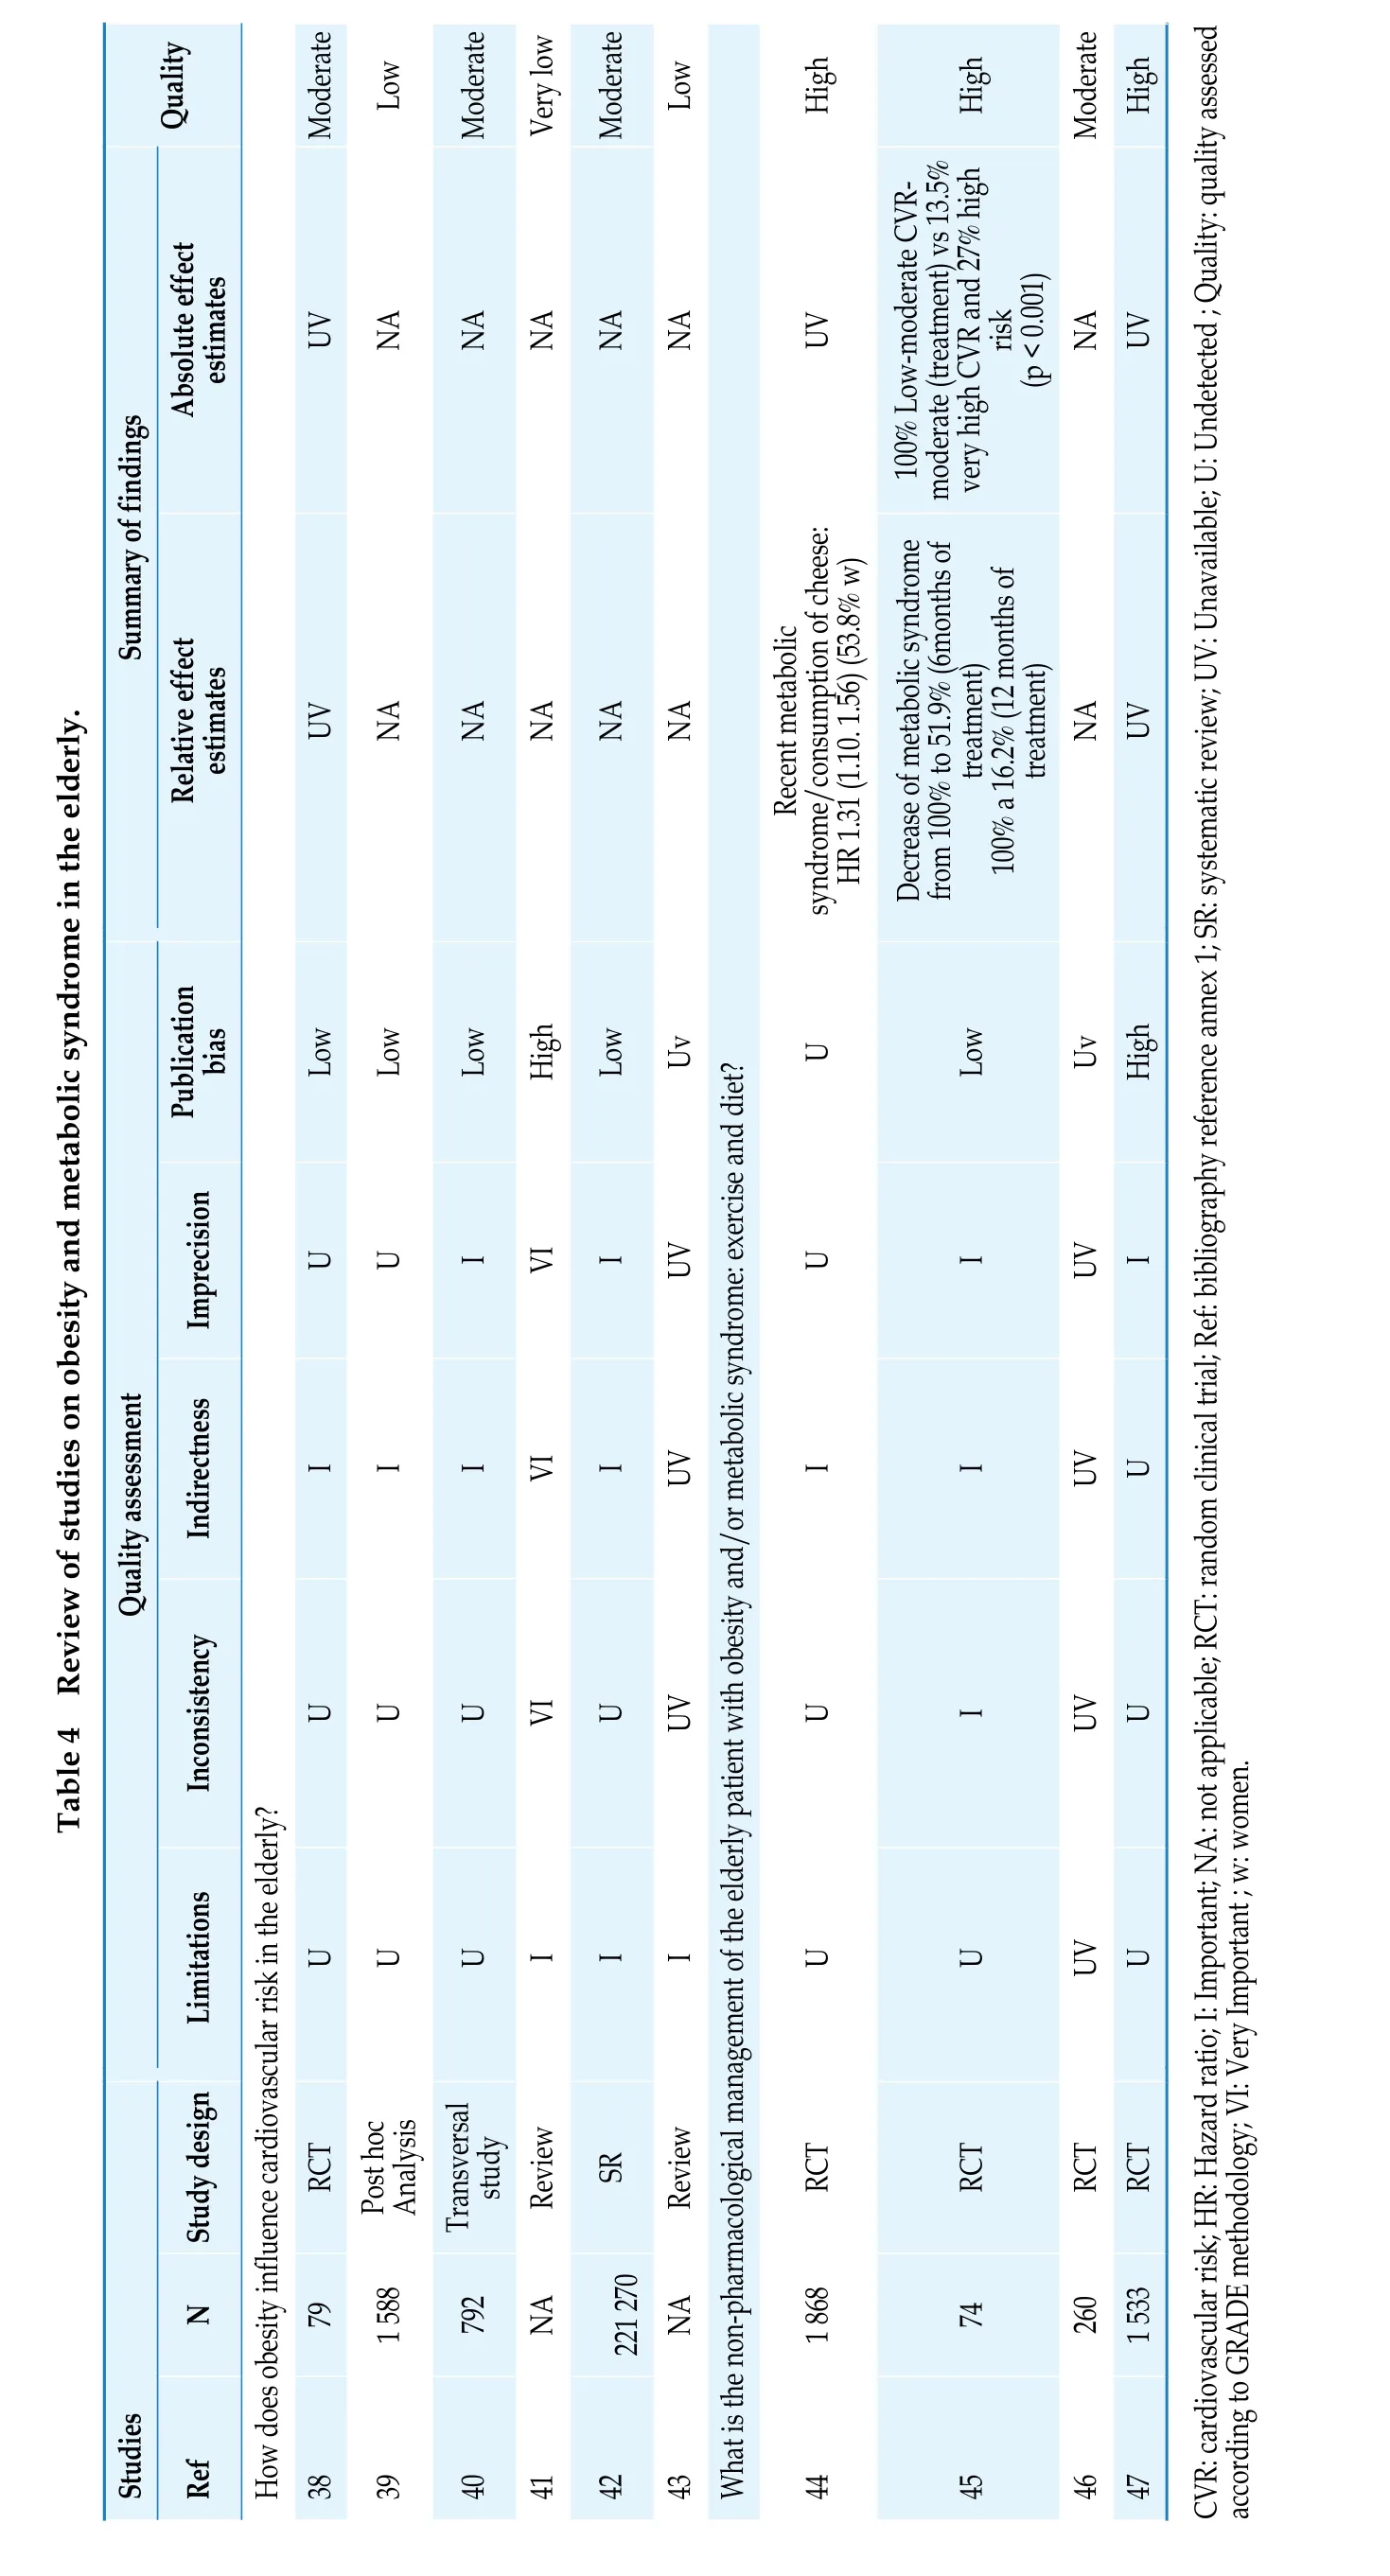
Quality Moderate Low Moderate Very low Absolute effect estimates UV NA NA NA Summary of findings Table 4 Review of studies on obesity and metabolic syndrome in the elderly.Relative effect estimates UV NA NA NA Low Low Low High Imprecision Publication bias U U I VI Quality assessment Indirectness I I I VI Inconsistency U U U VI Limitations U U U I Study design RCT Review N 79 1 588 Post hoc Analysis 792 Transversal study NA Studies Ref How does obesity influence cardiovascular risk in the elderly?38 39 40 41 Moderate Low High High Moderate High NA NA UV moderate (treatment) vs 13.5%very high CVR and 27% high risk(p < 0.001)NA UV NA NA HR 1.31 (1.10. 1.56) (53.8% w)from 100% to 51.9% (6months of treatment) 100% a 16.2% (12 months of treatment)100% Low-moderate CVRDecrease of metabolic syndrome NA UV Low Uv U Recent metabolic syndrome/consumption of cheese:Low Uv High I UV U I UV I I UV I I UV U U UV U I UV U I I U U UV U SR Review RCT RCT RCT RCT 42 221 270 NA 1 868 74 260 1 533 43 What is the non-pharm acological man agement of the elder ly patient with obesity a nd/or metabolic sy ndrome: exercise and diet?44 45 46 47 CVR: cardiov ascular ris k; HR: Hazard ratio; I: Important; N A: not applicable; RCT: r andom clinical trial; Ref: bibliograph y reference annex 1; SR: systematic review; UV: Unavailab le; U: Undetected ; Quality: quali ty assessed according to GRADE m ethodology; VI: Very Important ; w: women.

Quality Low Moderate High Moderate Moderate- low Moderate- low Low Moderate UV UV UV UV Summary of findings Absolute effect estimates 1.78% events/year (CI95% 1.41-2.24) (intensive treatment) vs 2.63% events/year (CI 95% 2.17-3.18) (standard treatment)(3.75years): 0.11 (intensive treatment)vs 0.15 (standard treatment)0.67% events/year (CI95% 0.46-0.97)(intensive treatment) vs RR 1.24 (CI 0.99-1.54)31/1000 (low SBP) 39/1000 (CI95% 31-48)Relative effect estimates U RR 0.95 (0.81-1.11) ( > 65 years SBP≥ 140 mm Hg) RR 0.73 (0.52-1.02) (SBP < 140 mm Hg)HR 0.72 (0.43-1.21)U HR 0.67 (0.49-0.92) (intensive treatment)Cumulative incidence events/year RR 0.82 (CI 0.50-1.36)RR 1.25 (CI 0.94-1.67)20 /1000 (low SBP) 25 /1000 (CI95%: 19 a 33) (high SBP)Table 5 Review of studies on hypertension in the elderly.0.85% events/year (CI 95% 0.61-1.19) (standard treatment)High HR 1.02 (0.90-1.16) (SBP < 140 mm Hg /frail) HR 0.86 (0.77-0.96) (SBP < 140 mm Hg / non-frail) HR 1.01 (0.69-1.46) (DBP < 90 mm Hg /frail) HR 0.90 (0.76-1.07) (DBP < 90 mm Hg / non frail)Publication bias U U U HR 0.67 (0.49-0.91) (intensive treatment) HR 0.64 (0.41-1.01) p=0.05 (in frail patients) HR 0.75 (0.44-1.26) (in walking speed)U U U U RR 0.70 (0.60-0.83) ( > 65 years SBP≥ 140 mm Hg) RR 0.65 (0.49-0.86) (SBP < 140 mm Hg)Imprecision I U U I I I I U I Quality assessment Indirectness U U U U I I U U U Inconsistency I I I I I I I I I Limitations VI I I I VI VI VI I I N Study design Which is the impact of hypertension in the overall mortality in the elderly?SR SR RCT SR RCT SR OBS SR RCT 8 221 (4 120 with treatment)440 with treatment (FI > 0.21)(SBP < 140 mm Hg and DBP < 90 mm Hg)11 899 (N > 65years ≥ 140 mm Hg SBP)21 906(SBP < 140 mm Hg and DBP < 90 mm Hg)440 with treatment (FI > 0.21 mm Hg)11 899 with treatment ( > 65years SBP≥140 mm Hg)SR Studies 371 with treatment (walking speed < 0.8/s)371 with treatment (walking speed < 0.8/s)Ref 48 49>33 600 4 120 with treatment (SBP 130 mm Hg -140 mm Hg)50 2 636 1 317 with treatment (SBP < 12 mm Hg)51 96 549 18 139 (N < 140 mm Hg)52 1167 586 with treatment (SBP < 120 mm Hg)53 Which is the impact of hypertension on stroke in the elderly?48 8 221 4 120 with treatment 50 2 636 1 317 with treatment (SBP < 120 mm Hg)51 96 549 18 139 with treatment (SBP < 140 mm Hg)Which is the impact of hypertension on serious adverse events in the elderly?

Continued Quality Low Moderate Moderate- low Moderate High Moderate Low Moderate Moderate UV UV UV UV UV Summary of findings Absolute effect estimates 2.59% events/year (CI95% 2.13-3.14)(intensive treatment) vs RR 1.95 (CI 0.98-1.45)42/1000 (low SBP) 50/1000 (Ci95%: 41 a 61) (high SBP)3.85% events/year (CI 95% 3.28-4.53) (standard treatment)High(standard treatment)0.44% events/year (CI95% 0.28-0.70)(intensive treatment) vs U RR 0.78 (0.70-0.86) ( > 65 years SBP≥ 140 mm Hg) RR 0.75 (0.62-0.89) (SBP < 140 mm Hg)U HR 0.67 (0.50-0.90) (intensive treatment)Cumulative incidence (3.61/year): 0.13(intensive treatment) vs 0.18 (standard treatment)HR 0.69 (0.45-1.05)0.92% events/year (CI 95% 0.67-1.27) (intensive treatment) vs 1.34% events/year (Ci 95% 1.02-1.75)U RR 0.84 (0.73-0.99) ( > 65 years SBP≥ 140 mm Hg) RR 0.69 (0.47-1.02) (SBP < 140 mm Hg)RR 1.52 (CI 1.06-2.19)17 por 1000 (low SBP) 14 por 1000 (high SBP)0.72% events/year (CI 95% 0.50-1.03) (standard treatment)High Relative effect estimates HR 0.63 (0.40-0.99) p=0.05 (walking speed)RR 1.04 (CI 0.57-1.89)RR 0.75 (CI 0.41-1.39)HR 0.60 (0.33-1.09)Publication bias U U HR 0.66 (0.51-0.85) (intensive treatment) HR 0.68 (0.45-1.01) p=0.06 (frail)U U U U U U RR 0.84 (0.67-1.06) ( > 65 years SBP≥ 140 mm Hg) R R 0.62 (0.38-1.02) ns (SBP < 140 mm Hg)Imprecision I U I I U U I I U U I Quality assessment Indirectness U U U I U U U U U U U Inconsistency I I I I I I I I I I I Limitations VI I I VI I I I VI I I I RCT N Study design SR SR RCT SR RCT SR SR SR RCT SR 48 8 221 4 120 with treatment (SBP < 140 mm Hg Y 440 with treatment (FI > 0.21)DBP < 90 mm Hg)(SBP < 140 mm Hg Y DBP < 90 mm Hg)Studies 371 with treatment (walking speed < 0.8/s)Ref 50 2 636 1 317 with treatment (SBP < 120 mm Hg)51 96 549 6 779 with treatment ( > 65years SBP≥140 mm Hg) 21 042 with treatment (SBP < 140 mm Hg)52 1 167 586 with treatment (SBP < 120 mm Hg)Which is the impact of hypertension on acute myocardial infarction in the elderly?49>33 600 4 120 with treatment (SBP 130 mm Hg -104 mm Hg)50 2 636 1 317 with treatment (SBP < 120 mm Hg)51 96 549 21 042 with treatment ( > 65years SBP≥140 mm Hg) 17 785 with treatment (SBP < 140 mm Hg)Which is the impact of hypertension on cardiovascular mortality in the elderly?48 8 221 4 120 with treatment 49>33 600 4 120 with treatment (SBP 130 mm Hg -140 mm Hg)50 2 636 1 317 with treatment (SBP < 120 mm Hg)51 96 549 with treatment ( > 65years SBP ≥ 140 mm Hg) 17 785 with treatment (SBP < 140 mm Hg)Is a higher withdrawal rate due to adverse effects in the elderly?

Continued Quality Low High Moderate Moderate- low Moderate-High Moderate High High UV Summary of findings Absolute effect estimates 17 por 1000 (low SBP)0.60 (intensive treatment) vs 0.61 (standard treatment)failure (3.57 YEAR): 0.10 (intensive 81 per 1000 (CI95% 75-90) (active) vs 95 per 1000 (control) (60-79 a) ARR 1.4%; NNTB 72 138 per 1000 (CI95% 124-157) (active)142 per 1000 (N C) ARR ns; NNTB ns 14 por 1000 (CI95%: 10 a 20) (high SBP)-16/1000 patientss/5 years ( > 65 a)-7/1000 patiens/5 years ( > 80 a)Absolute difference (1000 patients/year): 0.8 (-3.0 a 4.6) (treatment vs PBO)SBP/1000 patients/year (no events):47.2 (196) (treatment) vs 59.6 (235) (PBO)SAES cumulative incidence (3.76 year):treatment) vs 0.05 (standard treatment)Relative effect estimates RR 0.83 (CI 0.58-1.19)HR 0.99 (0.89-1.11)SAEs 48.4% (N 637) (intensive treatment) SAESs 48.3% (N 637) (standard treatment)HR +0.92 (0.79-1.07) (SAEs)HR 2.12 (95% CI 1.37-3.26) (kidney failure)U RR 2.18 (0.73-6.54) ( > 65 years SBP≥ 140 mm Hg) RR 1.55 (1.21-1.95) (SBP < 140 mm Hg)RR 0.91 (0.85-0.97) ( > 60 years)Cumulative incidence of acute kidney HR 3.41 (1.92-6.06) (- 30% eGFR)RR 0.86 (0.79-0.95) 60-79 years)RR 0.87 (0.76-0.99) ( > 65 years)RR 0.87 (0.87-1.10) ( > 80 years)RR 0.98 (0.85-1.14) ( > 80 years)HR non ajusted 0.79 (0.65-0.95) p=0.02 Publication bias U U U U U U Difference (%): 3% (-14 a 18) (Active vs PBO) 16% (-5 to 33) (D vs PBO) 8% (-34 to 12) (BQ vs PBO)U Imprecision I U I I U I U U Quality assessment Indirectness U U U I U U U U Inconsistency I I I I U I U U Limitations VI I I VI VI I I U N Study design SR RCT SR RCT SR SR CS BS RCT RCT(SBP < 140 mm Hg Y DBP < 90 mm Hg)3 070 with treatment ( > 80years)Studies Ref 48 8 221 4 120 with treatment Which is the withdrawal rate due to adverse effects in the elderly?50 2 636 1 317 with treatment (SBP < 120 mm Hg)51 96 549 7 465 with treatment ( > 65years SBP≥140 mm Hg) 17 331 with treatment (SBP < 140 mm Hg)52 1 167 586 with treatment (SBP < 120 mm Hg)What pharmarcological options for hypertension are available to improve overall mortality in the elderly?54 26 795 13 368 with treatment 51 96 549 30 059 with treatment ( > 65years)55 4 396 6 290 with treatment/year 6 330 with treatment BQ/year 56 3 845 1 933 with treatment

Continued Quality High Moderate High High High Moderate-high UV UV Summary of findings Absolute effect estimates-19/1000 patients/5 years ns ( > 80 years)Absolute difference (1000 patients/year): 1.3 (-1.5 a 4.1) ns (treatment vs PBO)23.9 (99) (active) vs 30.7(121) (PBO)93 per 1000 (CI95%: 85 to 101)(treatment) vs 131 per 1000 (control) (60-79 years) ARR = 3.8%. NNTB = 27 115 per 1000 (CI95% 75 to 100)(treatment) vs 86 per 1000 (control)-16/1000 patients/5 years ( > 65 years)HR non adjusted 0.77 (0.60 to 1.01) nsSAEs 1000 patientss/year (no events):Relative effect estimates( > 80 years) ARR = 2.9%. NNTB = 35 RR 1.00 (0.94-1.06) (D vs others) RR 1.14 (1.04-1.25) (BQ vs others) RR 0.94 (0.91-0.98) (CA-ANTAG vs others) RR 1.04 (0.99-1.08) (ACE vs others)RR 0.76 (0.61-0.94) ( > 65 years)RR 0.90 (0.74-1.09) ( > 80 years)29% (4 to 48) (p=0.03) (D vs PBO)-6% (-39 to 19) ns (BQ-PBO)RR 0.85 (0.74-0.98) (D vs PBO)RR 0.98 (0.89-1.07) (D vs others) RR 0.88 (0.62-1.29) (BQ vs PBO)RR 1.39 (1.03-1.88) (BQ vs others)1.11 (0.82-1.49) (ARBs vs PBO)RR 0.72 (0.68-0.77) ( > 60 years)RR 0.75 (0.65-0.87) ( > 80 years)U Difference (%): 9% (-12 to 27) ns (treatment vs PBO)RR 0.50 (0.29-0.89) (CA-ANTAG vs PBO) RR 0.95 (0.89-1.01) (CA-ANTAG vs others) RR 1.04 (0.98-1.11) (ACE vs others) RR RR 0.71 (0.65-0.77) (60-79 years)Publication bias U U U U U Imprecision I I U U I U Quality assessment Indirectness U U U U U U Inconsistency I I U U I U Limitations I I I U I VI SR CS BS RCT RCT SR N Study design 15 742 with treatment ACE 6 222 with treatment ARBs SR CS 55 645-94 228 19 942 with treatment D 7 937 with treatment BQ 23 362 with treatment CA-ANTAG 3 010 with treatment ( > 80years)15 742 with treatment ACE 6 222 with treatment ARBs SR CS 55 645-94 228 19 942 with treatment D 7 937 with treatment BQ 23 362 with treatment CA-ANTAG Studies Ref 57 What pharmacological options for hypertension are available to improve cardiovascular mortality in the elderly?51 96 549 30 299 with treatment ( > 65years)55 4 396 6 290 with treatment /year 6 330 with treatment BQ/year 56 3 845 1 933 with treatment 57 What pharmacological options for hypertension are there to improve cardiovascular morbidity and mortality in the elderly?54 26 795 13 368 with treatment

Continued Quality Moderate High High High Moderate-high Moderate High UV Summary of findings Absolute effect estimates Absolute difference (1000 patients/year): 4.2 (0.5 a 7.9) (treatment vs PBO)33.7 (138) (treatment) vs 50.6 (193) (PBO)33 per 1000 (CI95%: 29 to 38) vs 50 per 52 per 1000 (control) ( > 80 years):ARR 21.7%; NNTB 59 Absolute difference (1000 patients/year): 2.7 (0.3 a 5.1) (active vs PBO)-67/1000 patients/5 years ( > 65 years)-66/1000 patients/5 years ( > 80 years)1000 (control) (60-79 years); ARR 1.7%; NNTB 59 35 per 1000 (CI95%: 27 to 43) vs-28/1000 patients/5 years ( > 65 years)-29/1000 patients/5 years ( > 80 years)Relative effect estimates RR 0.72 (0.63-0.82) ( > 65 years)RR 0.75 (0.63-0.88) ( > 80 years)35% (17 a 49) (p=0.0005) (D vs PBO)4% (-19 a 23) (BQ vs PBO)RR 0.77 (0.69-0.87) (D vs PBO)RR 0.90 (0.82-0.98) (D vs others)RR 0.91 (0.79-1.05) (BQ VS RR 0.51 (0.31-0.85) (CA-ANTAG vs 0.84 (0.74-0.94) (ARBs vs PBO)U Difference (%): 17% (2 a 29) (p=0.03) (Active vs PBO)U HR non adjusted 0.66 (0.53-0.82) (p < 0.001)SAEs (1000 patients/year):PBO)RR 1.36 (1.11-1.77) (BQ vs others)PBO) RR 1.09 (1.02-1.15) (CA-ANTAG RR 0.66 (0.59-0.74) ( > 60 years)RR 0.66 (0.52-0.83) ( > 80 years)RR 0.99 (0.92-1.07) (ARBs vs others)RR 0.67 (0.58-0.77) ( > 65 years)RR 0.66 (0.58-0.76) (60-79 years)RR 0.68 (0.54-0.84) ( > 80 years)31% (3 a 51) (p=0.04) (D vs PBO)18% (-14 a 40) (BQ vs PBO)vs others)RR 0.51 (0.39-0.66 ACE vs PBO) RR 0.96 (0.89-1.04) (ACE vs others) RR Publication bias U U U U U Diffence (%): 25% (3 a 42) (p=0.04) (ACTIVE vs PBO)Imprecision I U U I U I U Quality assessment Indirectness U U U U U U U Inconsistency I U U I U I U Limitations I I U I VI I I BS RCT N Study design SR CS RCT SR SR CS BS RCT 51 96 549 30 299 with treatment ( > 65years)15 742 with treatment ACE 6 222 with treatment ARBs SR CS 3 010 with treatment ( > 80years)55 645-94 228 19 942 with treatment D 7 937 with treatment BQ 23 362 with treatment CA-ANTAG 3 010 with treatment ( > 80years)Studies Ref 55 4 396 6 290 with treatment /year 6 330 with treatment BQ/year 56 3 845 1 933 with treatment 57 What pharmacological options for hypertension are available to improve neurovascular morbidity and mortality in the elderly?54 26 795 13 368 with treatment 51 96 549 30 299 with treatment ( > 65years)55 4 396 6 290 with treatment /year 6 330 with treatment BQ/year

Continued Quality High High Moderate High High High Moderate- low UV UV UV Summary of findings Absolute effect estimates SAEs (1000 patients/year):41 per 1000 (CI95%: 36 to 47)1/1000 patients/5 years ( > 80 years)Absolute difference (1000 P/year):2.4 (-0.2 a 5.0) (treatment vs PBO)SBP (1000 patients/years. no events):2.2 (9) (treatment) vs 3.1 (12) (PBO)12.4 (51) (treatment) vs 17.7 (69) (PBO)(treatment) vs 21 per 1000 (control) ( > 80 years)Moderate-high-7/1000 patients/5 years ( > 65 years)-Relative effect estimates HR non adjusted 0.70 (0.49-1.01) ns 0.46 (0.26-0.81) (CA-ANTAG vs PBO)(treatment) vs 52 per 1000 (control) (60- 79 years) 17 per 1000 (CI95%: 12 to 25)RR 0.70 (0.60-0.81) (D vs PBO)RR 0.78 (0.69-0.89) (D vs others) RR 0.82 (0.69-0.89) (BQ vs PBO)RR 1.43 (1.16-1.75) (BQ vs others) RR RR 0.96 (0.80-1.14) (CA-ANTAG vs others) RR 1.09 (0.93-1.27) (ACE vs others) RR 0.62 (0.38-1.03) (ARBS vs PBO)RR 0.78 (0.69-0.88) ( > 60 years)RR 0.79 (0.69-0.90) (60-79 years)RR 0.82 (0.56-1.2) ( > 80 years)RR 0.78 (0.66-0.94) ( > 65 years RR)RR 0.96 (0.57-1.63) ns ( > 80 years)44% (21 a 60) (p=0.0009) (D vs PBO)3% (-30 a 27) ns (BQ vs PBO)HR non adjusted 0.72 (0.30-1.7)RR 1.03 (0.89-1.20) (D vs others)RR 1.24 (0.91-1.68) (BQ vs others) RR RR 0.93 (0.82-1.04) (ACE vs others)U Difference (%): 19% (-2 a 36) (treatment Vs PBO)1.01 (0.93-1.10) (CA-ANTAG vs others)RR 0.93 (0.78-1.10) (ARBs vs others)RR 2.91 (2.56-3.30) ( > 60 years)Publication bias U U U U U U U Imprecision U I U I U U I U Quality assessment Indirectness U U U U U U U U Inconsistency U I U I U U I U Limitations U I VI I I U I VI N Study design RCT SR SR CS BS RCT RCT SR 15 742 with treatment ACE 6 222 with treatment ARBs SR CS 3 010 with treatment ( > 80years)56 3 845 1 933 with treatment 15 742 with treatment ACE 6 222 with treatment ARBs SR CS 55 645-94 228 19 942 with treatment D 7 937 with treatment BQ 23 362 with treatment CA-ANTAG What pharmacological options for hypertension are available to improve acute myocardial infarction in the elderly?54 26 795 13 368 with treatment 51 96 549 30 299 with treatment ( > 65years)55 4 396 6 290 with treatment /year 6 330 with treatment BQ/year 56 3 845 1 933 with treatment 55 645-94 228 19 942 with treatment D 7 937 with treatment BQ 23 362 with treatment CA-ANTAG Studies Ref 57 57 What pharmacological options for hypertension are available to improve the withdrawal due to adverse events in the elderly?54 26 795 13 368 with treatment

Continued Quality Moderate-high High High UV Summary of findings Absolute effect estimates SBP DWA -3.96 mmHg (N 115 > 55a)SBP DWA -6.52 mmHg (N 53 w > 55)DBP DWA -1.30 mmHg (N 115 > 55a)DBP DWA -2.07 mmHg (N 73 m > 55a) DBP DWA -2.40 mmHg (N 53 w > 55)Moderate (sbp)low(dbp)RR 4.31 (0.30-62.28) ( > 80 years)+100/1000 patients/5 years ( > 65 years) +27/1000 patients/5 years ( > 80 years)UV Advers events: 358 (treatment group) vs 448 (PBO); p = 0.001 0.59 (0.45-0.78) (CA-ANTAG vs others)SBP DWA -4.71 mmHg (N 73 m > 55a)Relative effect estimates RR 1.72 (1.09-2.74) ( > 65 years)RR 2.60 (1.38-4.88) (D vs PBO)RR 0.91 (0.27-3.08) (D vs others)RR 2.11 (0.63-7.04) (BQ vs PBO)RR 2.07 (1.74-2.45) (BQ vs others) RR RR 1.17 (0.62-2.16) (ARBs vs PBO)UV Publication bias U U U U Imprecision I U I I Quality assessment Indirectness U U U U Inconsistency I U I I Limitations I U I VI N Study design What pharmacological options for hypertension are available to improve the adverse events in the elderly?SR CS RCT SR 51 96 549 30 299 with treatment ( > 65years)3 010 with treatment ( > 80years)15742 with treatment ACE 6222 with treatment ARBs SR CS 56 3 845 1 933 with treatment 55 645-94 228 19 942 with treatment D 7 937 with treatment BQ 23 362 with treatment CA-ANTAG 466 241 with treatment ( > 55years)Studies Ref 57 What is the effect of exercise on sbp y dbp in the elderly?58 ACEI: Angiotensin-converting enzyme inhibitors; ARBs: Angiotensin II receptor blockers; ARR: absolute risk reduction; BS: Blind Study; BQ: beta-blockers; CA-ANTAG: calcium antagonist; CI: confidence interval; CS: cohort study; D: diuretic; DWA: difference in weighted averages; DBP: dyastolic blood pressure;eGFR: estimated glomerular filtration rate; FI: frailty index ; HR: Hazard ratio; I: Important; m: men; NA: Not Applicable; NNTB: number needed to treat for an additional beneficial outcome; ns: not significant; OBS: observational study; OR: odds ratio; PBO: placebo group; RCT: random clinical trial; Ref: bibliography reference annex 1; RR: relative risk; s: second; SAEs: serious adverse events ;SBP: systolic blood pressure;SR: systematic review; UV: unavailable; U: Untected ; VI: very Important;vs:versus; w: women.
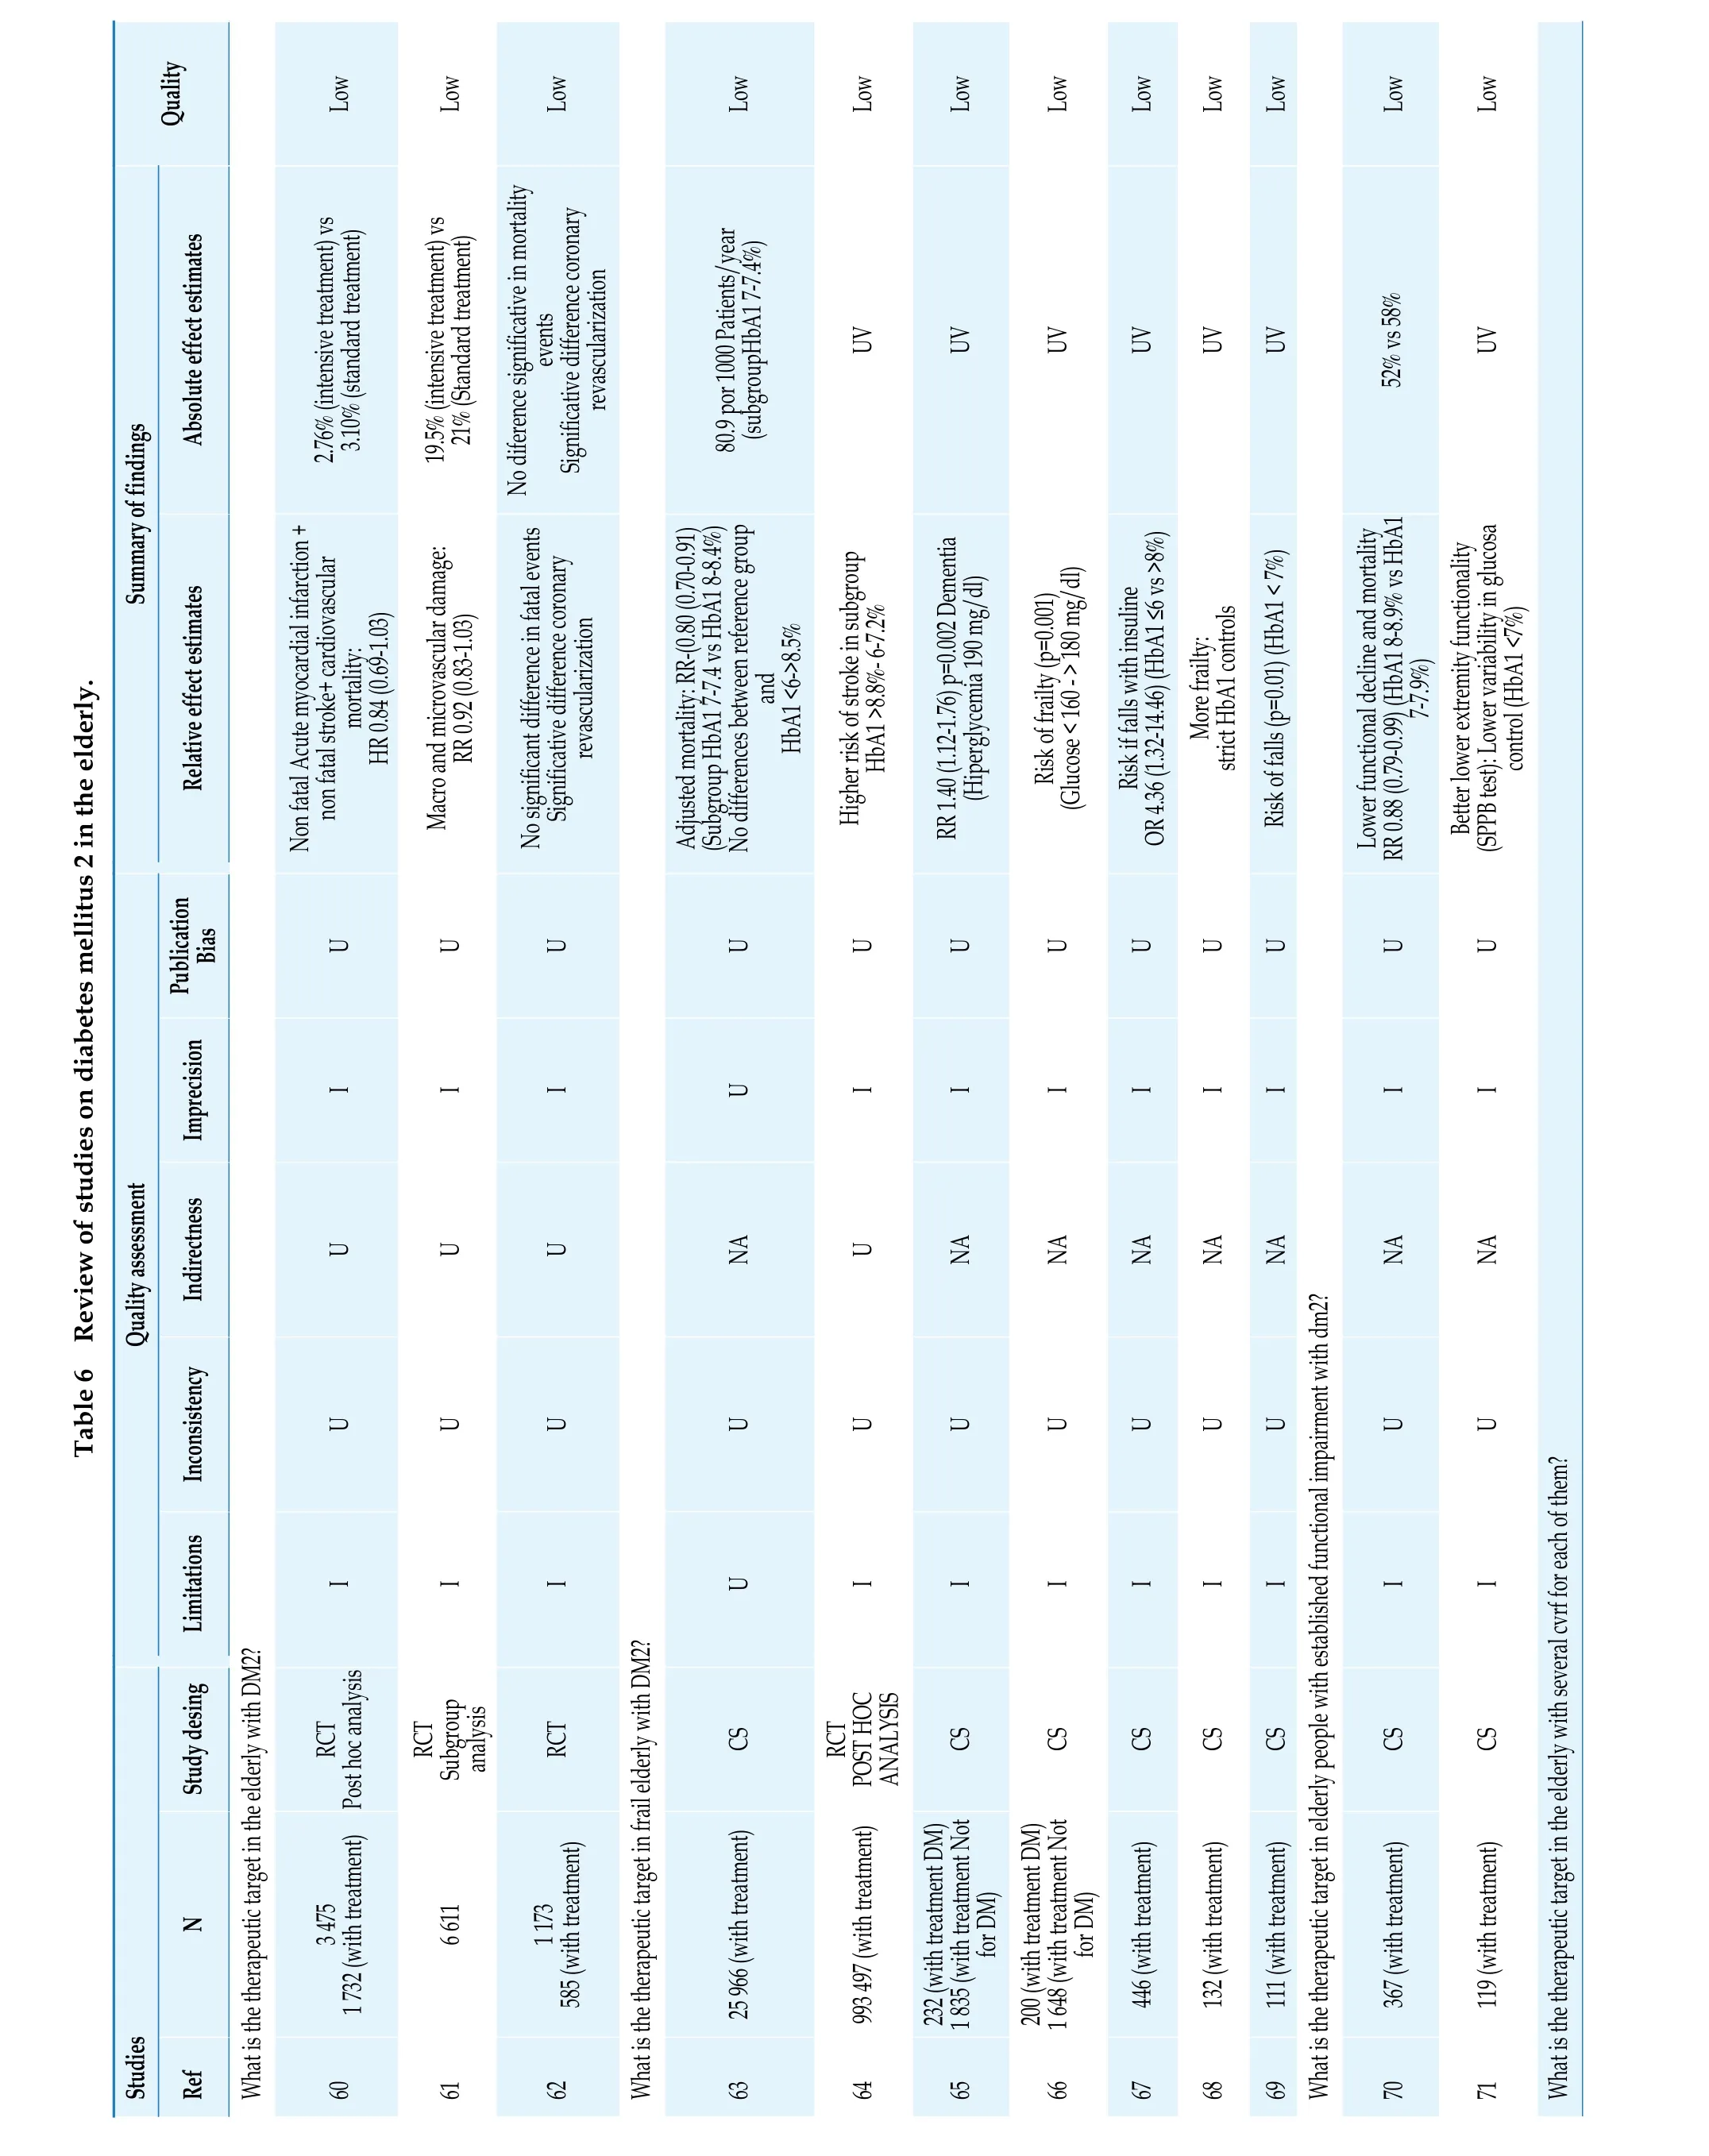
Quality Low Low Low Low Low Low Low Low Low Low Low UV UV UV UV UV UV Summary of findings Absolute effect estimates 3.10% (standard treatment)Table 6 Review of studies on diabetes mellitus 2 in the elderly.Relative effect estimates non fatal stroke+ cardiovascular mortality: HR 0.84 (0.69-1.03)2.76% (intensive treatment) vs Non fatal Acute myocardial infarction +Significative difference coronary revascularization No diference significative in mortality events Significative difference coronary revascularization No significant difference in fatal events Adjusted mortality: RR-(0.80 (0.70-0.91)(Subgroup HbA1 7-7.4 vs HbA1 8-8.4%)U Macro and microvascular damage: RR 0.92 (0.83-1.03)19.5% (intensive treatment) vs 21% (Standard treatment)No differences between reference group and HbA1 <6->8.5%80.9 por 1000 Patients/year (subgroupHbA1 7-7.4%)RR 1.40 (1.12-1.76) p=0.002 Dementia(Hiperglycemia 190 mg/dl)Risk if falls with insuline OR 4.36 (1.32-14.46) (HbA1 ≤6 vs >8%)Risk of falls (p=0.01) (HbA1 < 7%)UV Lower functional decline and mortality Better lower extremity functionality(SPPB test): Lower variability in glucosa control (HbA1 <7%)RR 0.88 (0.79-0.99) (HbA1 8-8.9% vs HbA1 7-7.9%)52% vs 58%Low U Imprecision Publication Bias U U U Higher risk of stroke in subgroup HbA1 >8.8%- 6-7.2%U U Risk of frailty (p=0.001) (Glucose < 160 - > 180 mg/dl)U U More frailty: strict HbA1 controls U U U I I I U I I I I I I I I Quality assessment Indirectness U U U NA U NA NA NA NA NA NA NA Inconsistency U U U U U U U U U U U U Limitations I I I U I I I I I I I I Study desing RCT CS CS CS CS CS CS CS CS RCT Post hoc analysis N 6 611 RCT Subgroup analysis 25 966 (with treatment)446 (with treatment)132 (with treatment)111 (with treatment)367 (with treatment)119 (with treatment)Studies 993 497 (with treatment)RCT POST HOC ANALYSIS 60 3 475 1 732 (with treatment)What is the therapeutic target in th e elderly with DM 2?Ref 61 62 1 173 585 (with treatment)What is the therapeutic target in frail elderly with DM2?63 64 65 232 (with treatment DM) 1 835 (with treatment Not for DM)66 200 (with treatment DM) 1 648 (with treatment Not for DM)67 68 69 What is the therapeutic target in elderly people with established functional impairment with dm2?70 71 What is the therapeutic target in the elderly with several cvrf for each of them?

Continued Quality Low Low Very low Low Low Low Low Low Very low Low UV UV UV 30.1% vs 36%UV UV UV UV Summary of findings Absolute effect estimates Relative effect estimates No higher mortality risk with HbA1 7%. blood pressure 145/80 mmHg and total cholesterol < 240 mg/dl kidney disease and macroangiopathy Higher mortality depending on terminal any cause HR 0.87 (0.78-0.97) (MET vs other treatments)24.7% vs 36%Annual mortality HR 0.92 (0.81-1.06)Higher mortality risk:(MET + strict glycemia control < 6.5%)HR 2.63; 1.39-4.97 Reduction of annual mortality from any cause HR 0.87 (0.80-0.94) Higher(MET VS treatment other treatments)Annual mortality HR 0.92 (0.80-1.05)Higher risk of readmission (1.09;1-1.20)Higher risk of readmission for heart U Lower mortality risk MET failureHR 1.17 (1.05-1.3).(previous stroke, obesity and hiher levels of LDL)19.6% Mortality (6years)Low Increased bone loss TZD (women):Reduction of annual mortality risk from risk with heart failure HR 1.06 (1-1.09)HR -0.61 ( -1.02-0.21)Reduction of mortality TZD/MET not with Sulfonylureas (0.99;0.91-1.08) Higher risk of stroke ( TZD)Higher risk of readmission for heart failure (1.06;1-1.09) (TZD)Higher risk of mortality Sulfonylureas(strict control of HbA1 < 7%) HR 2.49 (1.14-5.44)Composite outcome (mortality +atrial fibrilation +stroke+heart failure+ Acute myocardial infarction):gliburide/glipizide/repaglinide HR 0.91 (0.78-1.05)28.1%30.2%23.4%U Imprecision Publication Bias U U U U U U U U U I I I VI U I I I I VI I Quality assessment Indirectness NA NA NA NA NA NA NA NA NA NA NA Inconsistency U U U U U U U U U U NA Limitations I I I I U I I I I I I Study desing CS CS CS CS CS CS CS CS CS CS CS N 388 (with treatment)367 (with treatment)12 069 (with treatment)130 N TTO SLF Studies 819 (with treatment TZD)1 273 (with treatmentMET)2 276 (with treatment TZD)5 543 (with treatment SLF)Ref 72 Efficacy of pharmacological treatment in the elderly: metformin 73 74 1 273 (with treatment MET)75 76 8 393 (with treatmenttMET)Efficacy of pharmacological treatment in the elderly: pioglitazone 74 73 77 69 (with treatment TZD) 30 (with treatment PIO)Efficacy of pharmacological treatment in the elderly: sulfonylureas 73 75 78
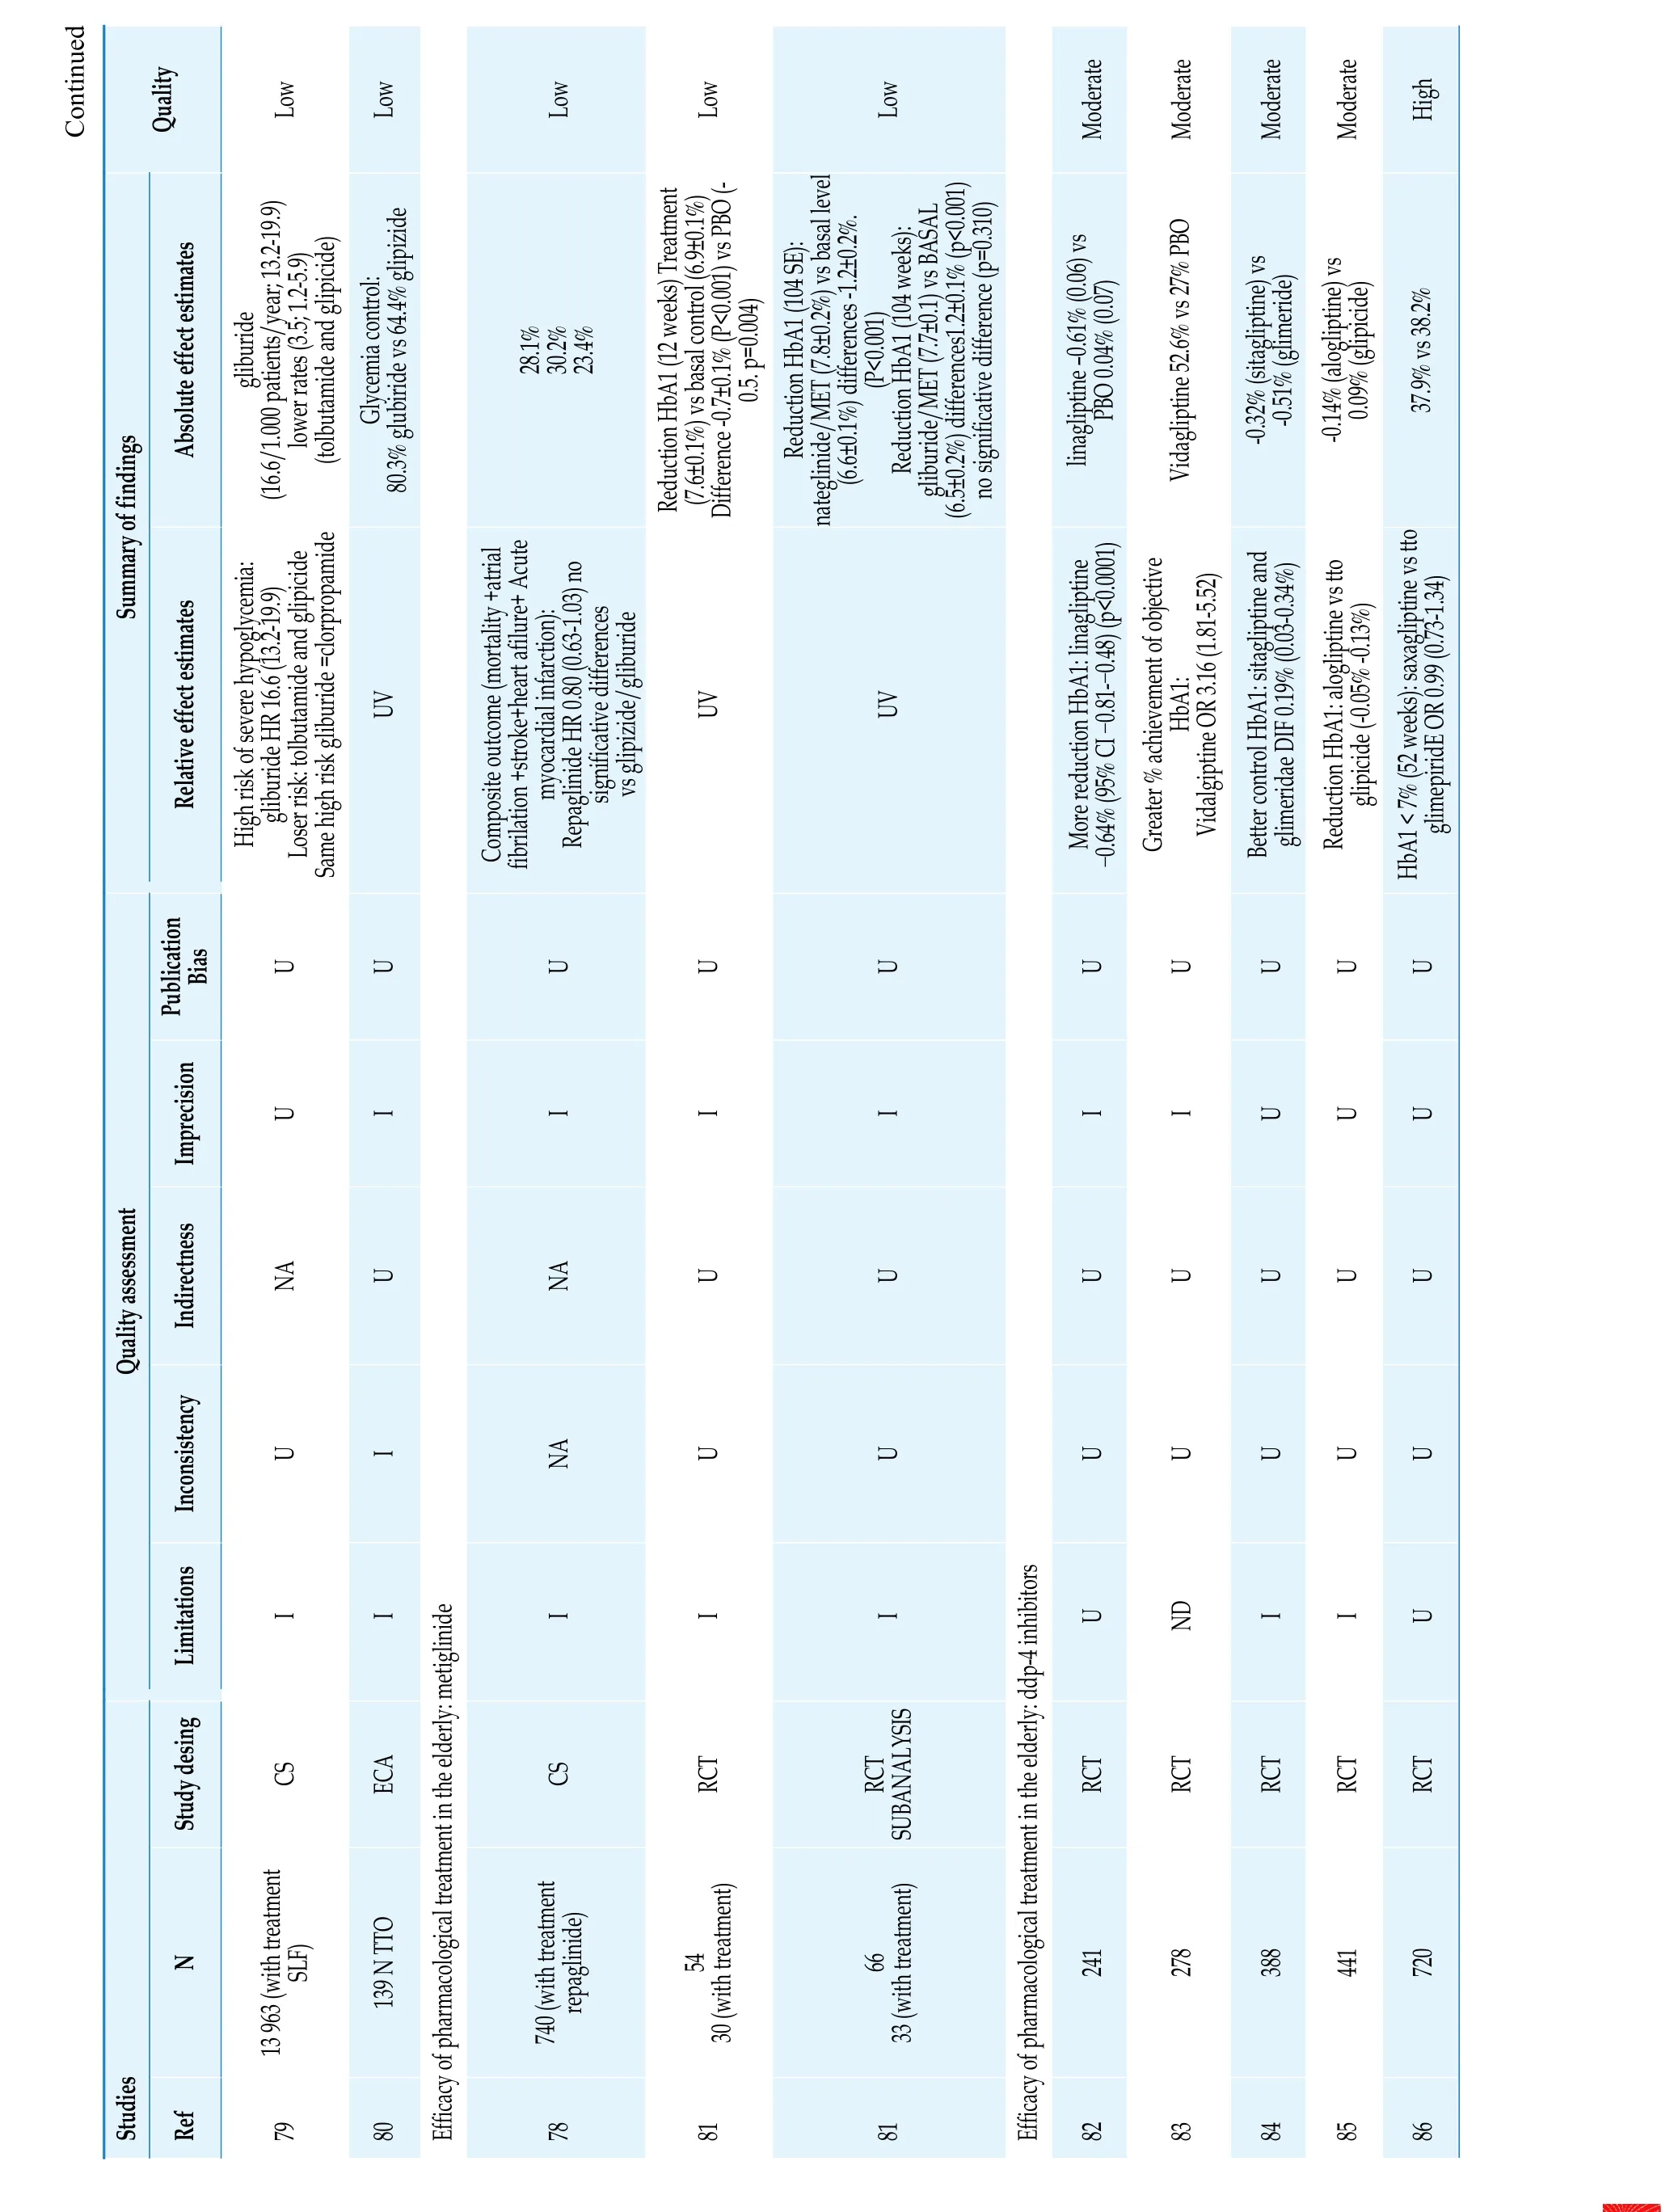
Continued Quality Low Low Low Moderate Moderate Moderate High 28.1%30.2%23.4%37.9% vs 38.2%Summary of findings Absolute effect estimates lower rates (3.5; 1.2-5.9) (tolbutamide and glipicide)Low gliburide (16.6/1.000 patients/year; 13.2-19.9)Reduction HbA1 (12 weeks) Treatment(7.6±0.1%) vs basal control (6.9±0.1%)UV Glycemia control: 80.3% glubiride vs 64.4% glipizide Difference -0.7±0.1% (P<0.001) vs PBO (- 0.5. p=0.004)Low Reduction HbA1 (104 SE):(6.6±0.1%) differences -1.2±0.2%. (P<0.001) Reduction HbA1 (104 weeks):gliburide/MET (7.7±0.1) vs BASAL no significative difference (p=0.310)Vidagliptine 52.6% vs 27% PBOModerate nateglinide/MET (7.8±0.2%) vs basal level(6.5±0.2%) differences1.2±0.1% (p<0.001)Relative effect estimates High risk of severe hypoglycemia:gliburide HR 16.6 (13.2-19.9)Loser risk: tolbutamide and glipicide Composite outcome (mortality +atrial fibrilation +stroke+heart afilure+ Acute myocardial infarction):significative differences vs glipizide/gliburide Repaglinide HR 0.80 (0.63-1.03) no UV UV-0.64% (95% CI -0.81--0.48) (p<0.0001)linagliptine -0.61% (0.06) vs PBO 0.04% (0.07)More reduction HbA1: linagliptine glimeridae DIF 0.19% (0.03-0.34%)-0.32% (sitagliptine) vs -0.51% (glimeride)Better control HbA1: sitagliptine and glipicide (-0.05% -0.13%)-0.14% (alogliptine) vs 0.09% (glipicide)Reduction HbA1: alogliptine vs tto glimepiridE OR 0.99 (0.73-1.34)Same high risk gliburide =clorpropamide HbA1 < 7% (52 weeks): saxagliptine vs tto U Imprecision Publication Bias U U U U U U Greater % achievement of objective HbA1: Vidalgiptine OR 3.16 (1.81-5.52)U U U U I I I I I I U U U Quality assessment Indirectness NA U NA U U U U U U U Inconsistency U I NA U U U U U U U Limitations I I I I I U ND I I U Study desing CS ECA CS RCT RCT SUBANALYSIS RCT RCT RCT RCT RCT N 139 N TTO 241 278 388 441 720 Studies Ref 79 13 963 (with treatment SLF)80 Efficacy of pharmacological treatment in the elderly: metiglinide 78 740 (with treatment repaglinide)81 54 30 (with treatment)81 66 33 (with treatment)Efficacy of pharmacological treatment in the elderly: ddp-4 inhibitors 82 83 84 85 86

Continued Quality Low Moderate Low Low Low Moderate(PBO) (P < 0.05)UV 9%) p<0.001) vs Summary of findings Absolute effect estimates(-0.64 ± 0.07% and -0.75 ± 0.07%)Moderate Mortality incidence (1000/year)(DPP4 I vs no treatment):36.01 y 66.91 / myocardial infarction,cerebrovascular accident or Non fatal infarction (100 patients/year):myocardial infaction (6.76 8.58) stroke (20.34 y 25.85)Moderate 0.4 (0.2 a 0.6) (DPP4 I) 1.0 (0.8 a 1.2) (SULF)(DPP4 I) 4.5 (3.8 a 5.2) (TZD)(DPP4 I); 3.5 (2.9 a 4.1) (TZD)cardiovascular death (26.37 y 33.41) acute Blood glucose reduction fasting:Combinated outcome: 3.9 (3.5 a 4.3)Global mortality: 2.9 (2.6 a 3.3)Reduction HbA1 -1.9% vs 1.4% (insuline 0.2 ± 0.3 (treatment) vs. -0.5 ± 0.2 mmol/l subgroup + other hypoglycemia Treatment vs regular mixte insuline+ Human protamine)higher % HbA1 ≤7% + without nocturn hypoglycemia 55.2% vs 30.2% (p=0.006).Reduction HbA1 -0.52% (0.5%) (HBA1 8-Increase HbA1 0.37% (0.7%) (HBA1<7%) p=0.03)Low Higher reduction of HbA1 and Relative effect estimates Lower mortality:cerebrovascular accident or(HR=0.79; 0.75-0.83)U Reduction HbA1: No differences with vildagliptine Reduction of non- mortal infarct <0.38 (-0.71, -0.05) Global mortality: -0.44 (-0.83, -0.06)DPP4 Inh Vs no treatment (HR=0.54;0.52- 0.56) Treatment for myocardial infarction,UV Reduction HbA1 (1 A): TTO acarbose - 0.6±1 vs PBO cardiovascular death vs no treatment DPP4 I vs SULF excepting those with UV UV UV postpandrial glucose (2hours): sitagliptinesitagliptine: difference 0.7% and 61 mg/dlHigh MTF as base treatment: (-0.92 (-1.60, - 0.24). Composite outcome VS Tiazolidinedione: -Imprecision Publication Bias U U U U Higher reduction HbA1: lixixenatide- 0.57% (lixixenatide) vs +0.06% (PBO) (p<0.0001)U U U Anual mortality for any cause: HR 0.96 (0.88-1.05)U U U U U U U I I I I I Quality assessment Indirectness U U NA NA U U U NA NA NA Inconsistency U U U U U U U U U U Limitations U I U I I I MI I I I Study desing RCT RCT CS CS RCT RCT RCT CS RCT CS N 201 335 58 485 12 069 (with treatment)130 (with treatment)65 (with treatment)Studies Ref 87 88 89 90 35 206 (with treatment SULF) 9 517 (with treatmentTZD)Efficacy of pharmacological treatment in the elderly: GLP-1 receptor agonist 91 350 174 (with treatment)Efficacy of pharmacological treatment in the elderly: alpha glucosidase inhibitors 92 192 93 (with treatment)93 45 22 (with treatment)Efficacy of pharmacological treatment in the elderly: insuline 73 94 What are the effects associated with overtreatment in the elderly?95

Continued Quality Low Low Low Very low Very low Low Low Low Low Low Low High UV UV Summary of findings Absolute effect estimates 67% (HbA1 <7%) 10.5%52% strict control HbA1 (<7%)(hypoglycemia episodes in previous year)Moreover in comorbid patients older and recent weight loss without treatment (6.5%±0.7)without treatment (5.8%±0.9)Withdrawal of treatment: 9.6% (37%hypoglycemia antecedents)glomerular filtration 45-60 ml/min)77% MET vs 31% y 80% combined Improvement SPPB: 0.83 (0.58 -1.11)HbA1: with treatment (HbA1 6.2%±0.8) vs HbA1: with treatment (HbA1 5.2%±0.4) vs Relative effect estimates UV UV UV 26% strict control: Higher risk of hypoglycemia in pharmacological group UV UV UV Reduction HbA1:(<≥ 65years) + (glomerular filtration >60 ml/min)Lower reduction (≥ 65Ayears and UV Mortality and hospitalization: 52% y 85% SULF vs 33%Mortality: MET vs no treatment OR 0.65(0.48-0.87) MET/other hypoglycemic treatments Vs no hypoglycemic treatments OR 0.72 (0.59-0.90)hypoglycemic treatments Mortality MET + combined treatment vs Sulfonylureas 0.59 (0.36-0.96)At long term (0.67; 0.51-0.88)Improvement SPPB: 0.85 (0.44-1.26)Withdrawal of treatment: 1.28 (1.22-1.33)Withdrawal of treatment: 71.5% intervention group VS 56% no intervention group No reduction of mortality with insuline or U Imprecision Publication Bias U U U U U U U U U U U I U U VI VI U U U I I I U Quality assessment Indirectness NA NA NA NA NA NA NA U NA NA NA U Inconsistency U U U U U U U U U U U U Limitations I U I MI MI I ND U U U U U Study desing CS CS CS OBS OBS CS CS SR RCT CS OBS CS RCT N 133 (with treatment)15 643 (with treatment)42 669 (with treatment)8 (with treatment)32 (with treatment)4 368 (with treatment)2 830 (with treatment)1 633 (with treatment)451 (with treatment)Studies Ref 96 97 98 99 100 101 102 How does chronic kidney disease modify therapeutic options in the elderly with diabetes?103 4 053 1 147 (N ≥ 65years)How does chronic heart failure modify therapeutic options in the elderly with diabetes?104 1 833 773 (with treatment SULF) 208 (with treatment MET)105 106 217 (with treatment SULF) 68 (with treatment MET)What are the therapeutic options in the elderly with diabetes and frailty?107 CS: cohort study; DM2: type 2 diabetes; DPP-4 (dipeptidylpeptidase-4) inhibitor; HR: Hazard ratio; I: Important; MET: metformin; NA: Not Applicable; O BS: observational study; OR: odds ratio; PBO: placebo; PIO: pioglitazone; Quality: quality assessed according to GRADE methodology; RCT: random clinical trial; Ref: bibliography reference annex 1; SR: systematic review; SPPB: short physical performa nce battery; SULF: sulfonylurea; TZD: Thiazolidinediones; U: Undetected; UV: unavailable; VI: very Important; vs: versus.

Quality High High High High High High High High High High High High Low High UV UV UV UV UV UV UV UV UV 8.70%UV UV Summary of findings RR 0.94 Relative effect estimates Absolute effect estimates RR 0.84 (DM 75-8 years) RR 1.05 (DM> 85 years)UV RR 0.90 RR 0.60 RR 0.76 RR 0.89 RR 0.76 (DM 75-84 years) RR 0.82 (DM > 85 years)UV RR 0.87 (0.77-0.99) (total)HR 0.75 UV Table 7 Review of studies about dyslipidemia in older people.RR 0.98 (NO-DM 75-84 years)RR 0.97 (NO-DM > 8 years)RR 0.94 (NO-DM 75-84 years)RR 0.93 (NO-DM > 85 years)RR 0.85 (0.73-0.98) (with CV treatment)RR 0.74 (95% CI. 0.61-0.89)RR 0.92 (0.73-1.16) (without CV treatment)NO CVR in control LDL group (≥ 75 years)Lower CVR in control LDL group HR 0.80 (IC 95%. 0.70-0.90)Imprecision Publication bias U U U U U U U U UU U U UU U U U U U U U U UU U U UU Quality assessment Indirectness U UV U U U U UV U UUV UV U UV UV Inconsistency U U U U U U U U UU UV UV UV U Limitations U U U U U U U U UU U U UU N Study design SR CS SR SR SR SR CS SR SR RCT CS CS RCT RCT CS 4 802 (NO-DM 75-84 years)21 435 743 (NO-DM > 85 years) 1 756 (DM 75-84 years) 201 (DM > 85 years)13 914 15 929 16 322 11 556 21 492 UV UV 1 716 with treatment 4 819 Studies Ref Which is the usefulness of statins for the prevention of cardiovascular disease in the elderly on overall mortality?107 108 Which is the usefulness of statins for the prevention of cardiovascular mortality in the elderly?107 Which is the usefulness of statins for the prevention of acute myocardial infarction in the elderly?107 Which is the usefulness of statins for the prevention of stroke in the elderly?107 Which is the usefulness of statins for the prevention of atherosclerotic cardiovascular disease in the elderly?107 Which is the usefulness of statins for the prevention of cancer in the elderly?108 4 802 (NO-DM 75-84years) 743 (NO-DM > 85years) 1 756 (DM 75-84 years) 201 (DM > 85 years)Which is the usefulness of statins for the prevention of cardiovascular risk in the elderly?109 186 854 TOTAL (756 with CV treatment/ 295 without CV treatment)110 111 112 IS IT BETTER THE USE OF PRAVASTINA vs USUAL PRACTICE FOR THE PREVENTION OF THE CARDIOVASCULAR RISK IN THE ELDERLY?113 1 428 with treatment (>75 years)114 115 CI: confidence interval; CS: Cohort study; CV: cardiovascular; CVR: cardiovascular risk; DM: patients with diabetes mellitus; HR: Hazard ratio; LDL: low density lipoprotein; NO-DM: Non-diabetic patients; RCT: random clinical trial; Ref: bibliography reference; RR: relative risk; SR: systematic review; U: undetected; UV: unavailable; Quality: quality assessed according to GRADE methodology.

Quality Low Low High Very low Very low Very low Low Very low Low Low Low Low Low Low Low UV NA NA NA NA UV UV UV UV UV UV UV UV Summary of findings Relative effect estimates Absolute effect estimates NA NA NA NA intake/week)intake/week)Table 8 Review of studies on alcohol intake in the elderly.Increased likelihood of medication-alcohol intake RR -13% Hypertension (alcohol intake vs abstinence)UV Alcohol intake vs abstinence: healthy values (fibrinogen, HDL cholesterol, apo A-liporotein, insulin) and unhealthy (LDL cholesterol. blood pressure)RR 0.69 (former consumers) RR 0.54 (mild consumer)RR 0.44 (moderate consumer) RR 0.21 (high consumer)RR 0.90 (<1 alcohol intake/week) RR 0.93 (1-6 alcohol RR 0.76 (7-14 alcohol intake/week) RR 0.58 (>14.alcohol No significant differences alcohol-Systolic blood pressure significant differences alcohol-Dyastolic blood pressure Mild consumer: < intimate-medium thickness High consumer: > intimate-medium thickness Consumptium vs no consumptium:HR +1.19 (mortality including heart failure)U HR 0.5 (0.3-0.9) (h) HR 0.7 (0.4-1.1) (m)HR -0.79 (mortality without including heart failure)Mortality in consumers vs abstinents: HR 0.79 mild consumer /HR 0.81 mild consumer / HR 0.75 moderate consumer UV HR 0.53 moderate consumer and risk of heart failure:No relation between consume and heart failure Imprecision UU U USI U U U U U U U U U Imprecision U U NA UND NA U U U I U U U U I Quality assessment Indirectness U I NA UNA NA U U U U U U U U U Inconsistency U U ND UND U U U U U U U MI U U Limitations I I I VI VI VI I I I I VI I I I I N Study design How is alcohol intake evaluated in the elderly?OBS OBS RV OBS RV RV OBS OBS OBS OBS OBS OBS OBS OBS OBS 3 058 3 815 1 500 542 NA NA 1 896 4 655 983 4 410 553 4 247 1 332 2 235 6 083 Studies Ref 117 118 119 Is it saf e to consume alcohol in th e elderly?120 121 How do es alcohol in take influen ce cardiovascular risk in th e elderly?122 123 124 125 126 HOW C OULD THE CARDIOPR OTECTIVE EFFECT OF AL COHOL be justified?127 128 How do es alcohol in fluence hear t failure?129 130 131

Continued Quality Low Low Low Very low Very low Very low UV UV UV NA UV Summary of findings Relative effect estimates Absolute effect estimates HR 0.77 lower risk in mild consume Risk for heart faliure:HR 0.82 (mild consumers vs abstinents)HR 0.66 (moderate consumers vs abstinents)HR 1.15 (former consumers vs abstinents)Average survival:+ 383 days (moderate consumers vs abstinents)UV UV Abstinence 5 years: 52% (> 50 years) 40% (<50 years)NA Imprecision U U U UU U Imprecision U U I UU I Quality assessment Indirectness U U U ND U I Inconsistency U U U UU U Limitations I I I VI I VI N Study design OBS OBS OBS RV OBS CS 4 490 5 595 5 888 NA 51 925 Studies Ref 132 133 134 Do the elderly benefit from alcohol cessation treatments?135 136 137 CS: Cohort study; HR: Hazard ratio; I: Important; NA: not applicable; OBS: observational study; OR: odds ratio; Re: bibliography reference annex 1; RR: relative risk; sig: significant; RV: review; U: undetected; UV: Unavailable; VI: Very Important; Quality:quality assessed according to GRADE methodology.
Literature Search
We searched for clinical trials, observational cohort studies, cross sectional studies, reviews and clinical practice guidelines in Pubmed, Clinicaltrials.org and Embase.
The search terms used and cross-referenced for each of the clinical questions established were as follows: obesity AND elderly AND “cardiovascular risk”; obesity AND “oldest old” AND “cardiovascular risk”; metabolic syndrome AND elderly AND“cardiovascular risk”; “Metabolic syndrome” AND oldest old AND “cardiovascular risk”; sedentary AND “older adults” AND cardiovascular AND“risk factor”; alcohol AND “cardiovascular risk factors” AND older adults. We searched for literature published up to August 1, 2020. There were no strict criteria for age, to allow inclusion of all publications focused on older ages.
Evaluation and Synthesis of the Literature
The search results were screened, with elimination of duplicates and irrelevant studies. Among relevant studies, 136 were identified and assessed(Figure 1).
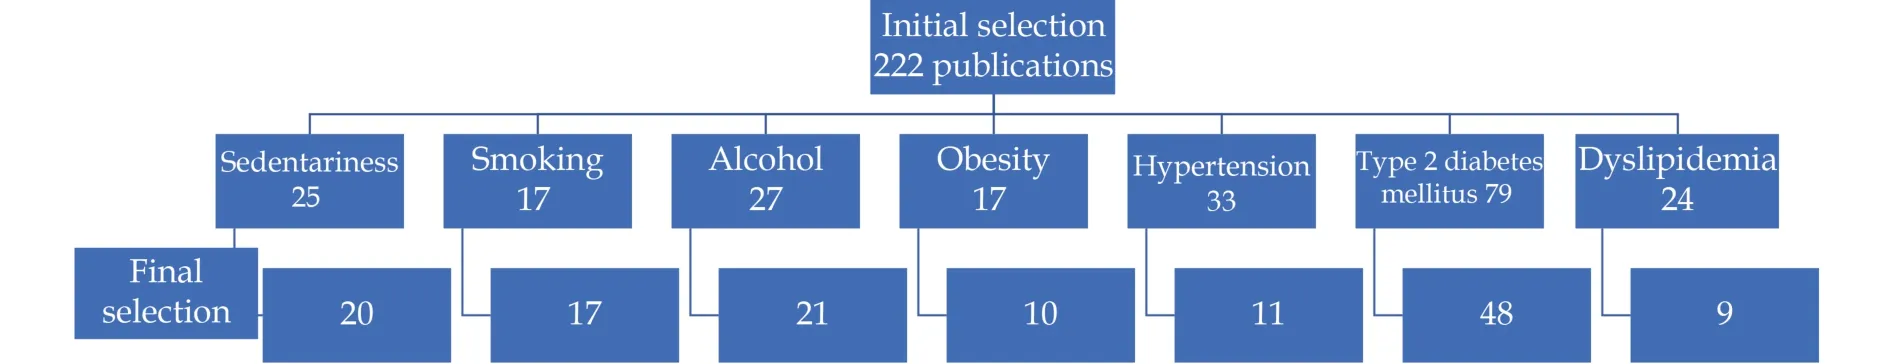
Figure 1 Flowchart of the screening process for the selection of eligible articles.
RESULTS
The evidence was synthesized in terms of diagnosis, prevention and treatment (Table 9).

Table 9 Overall results on cardiovascular risk factors in the older population. Diagnosis, prevention and treatment.
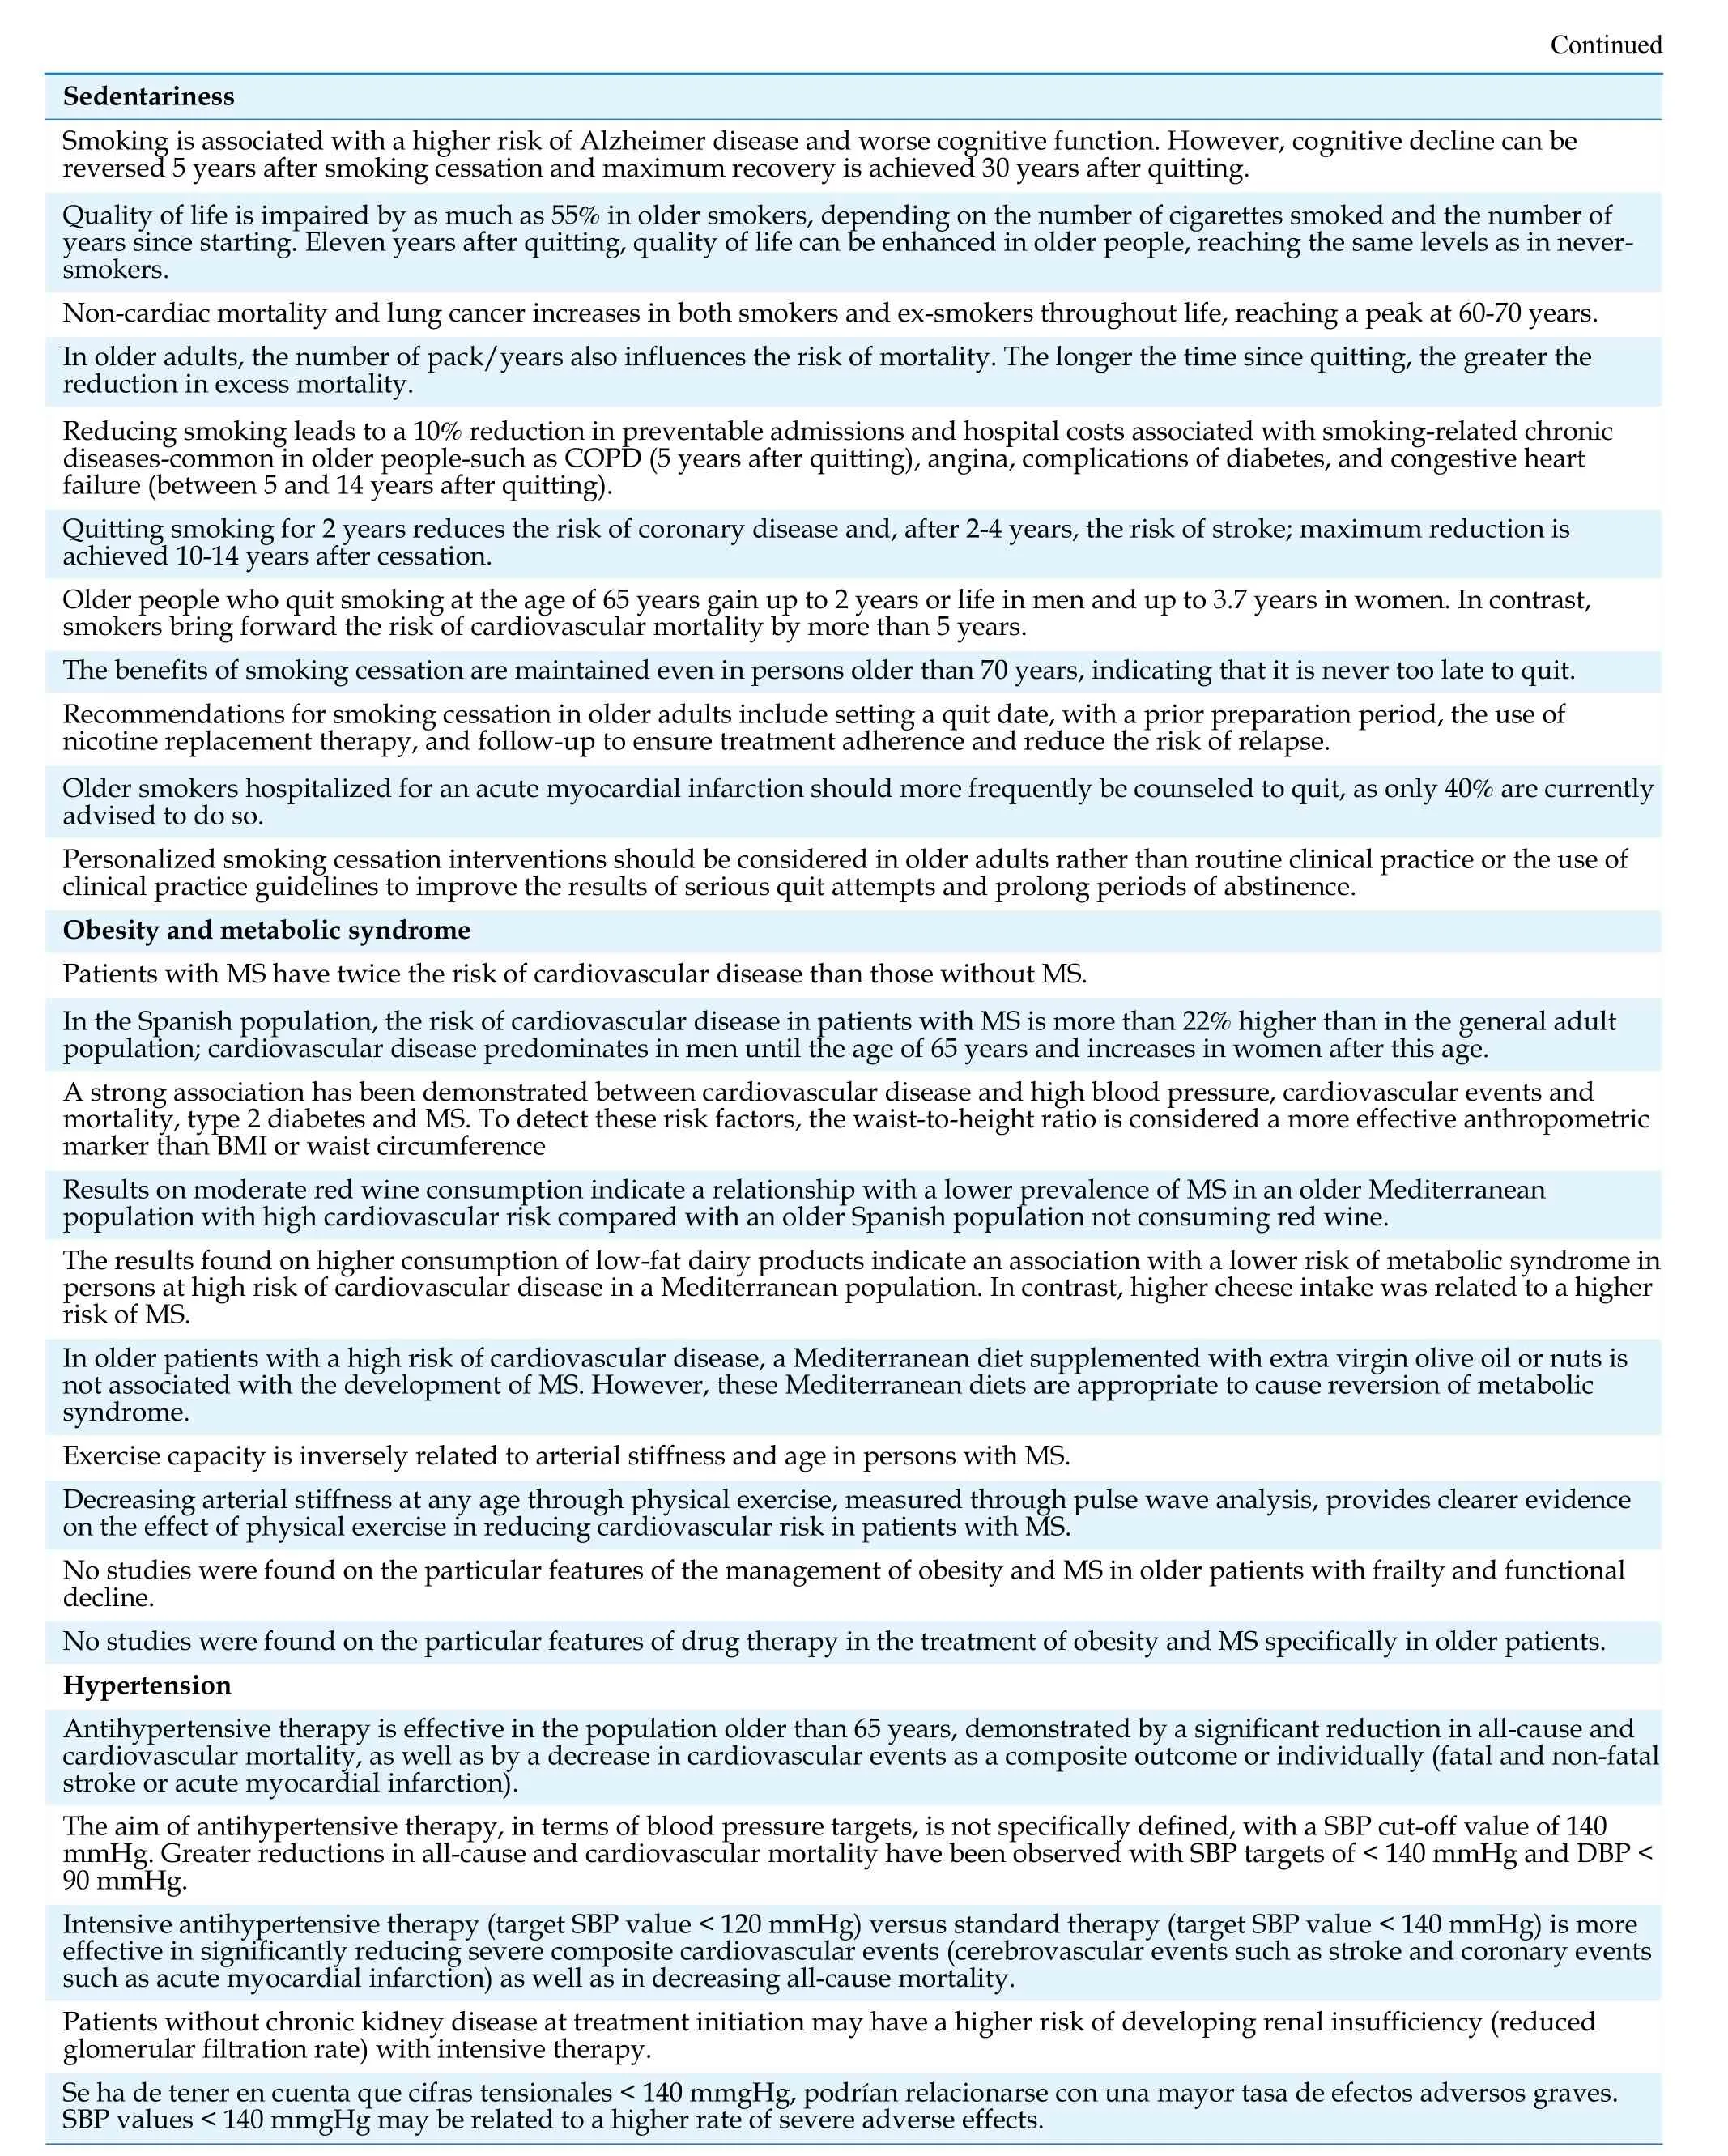
?Continued Sedentariness Smoking is associated with a higher risk of Alzheimer disease and worse cognitive function. However, cognitive decline can be reversed 5 years after smoking cessation and maximum recovery is achieved 30 years after quitting.Quality of life is impaired by as much as 55% in older smokers, depending on the number of cigarettes smoked and the number of years since starting. Eleven years after quitting, quality of life can be enhanced in older people, reaching the same levels as in neversmokers.Non-cardiac mortality and lung cancer increases in both smokers and ex-smokers throughout life, reaching a peak at 60-70 years.In older adults, the number of pack/years also influences the risk of mortality. The longer the time since quitting, the greater the reduction in excess mortality.Reducing smoking leads to a 10% reduction in preventable admissions and hospital costs associated with smoking-related chronic diseases-common in older people-such as COPD (5 years after quitting), angina, complications of diabetes, and congestive heart failure (between 5 and 14 years after quitting).Quitting smoking for 2 years reduces the risk of coronary disease and, after 2-4 years, the risk of stroke; maximum reduction is achieved 10-14 years after cessation.Older people who quit smoking at the age of 65 years gain up to 2 years or life in men and up to 3.7 years in women. In contrast,smokers bring forward the risk of cardiovascular mortality by more than 5 years.The benefits of smoking cessation are maintained even in persons older than 70 years, indicating that it is never too late to quit.Recommendations for smoking cessation in older adults include setting a quit date, with a prior preparation period, the use of nicotine replacement therapy, and follow-up to ensure treatment adherence and reduce the risk of relapse.Older smokers hospitalized for an acute myocardial infarction should more frequently be counseled to quit, as only 40% are currently advised to do so.Personalized smoking cessation interventions should be considered in older adults rather than routine clinical practice or the use of clinical practice guidelines to improve the results of serious quit attempts and prolong periods of abstinence.Obesity and metabolic syndrome Patients with MS have twice the risk of cardiovascular disease than those without MS.In the Spanish population, the risk of cardiovascular disease in patients with MS is more than 22% higher than in the general adult population; cardiovascular disease predominates in men until the age of 65 years and increases in women after this age.A strong association has been demonstrated between cardiovascular disease and high blood pressure, cardiovascular events and mortality, type 2 diabetes and MS. To detect these risk factors, the waist-to-height ratio is considered a more effective anthropometric marker than BMI or waist circumference Results on moderate red wine consumption indicate a relationship with a lower prevalence of MS in an older Mediterranean population with high cardiovascular risk compared with an older Spanish population not consuming red wine.The results found on higher consumption of low-fat dairy products indicate an association with a lower risk of metabolic syndrome in persons at high risk of cardiovascular disease in a Mediterranean population. In contrast, higher cheese intake was related to a higher risk of MS.In older patients with a high risk of cardiovascular disease, a Mediterranean diet supplemented with extra virgin olive oil or nuts is not associated with the development of MS. However, these Mediterranean diets are appropriate to cause reversion of metabolic syndrome.Exercise capacity is inversely related to arterial stiffness and age in persons with MS.Decreasing arterial stiffness at any age through physical exercise, measured through pulse wave analysis, provides clearer evidence on the effect of physical exercise in reducing cardiovascular risk in patients with MS.No studies were found on the particular features of the management of obesity and MS in older patients with frailty and functional decline.No studies were found on the particular features of drug therapy in the treatment of obesity and MS specifically in older patients.Hypertension Antihypertensive therapy is effective in the population older than 65 years, demonstrated by a significant reduction in all-cause and cardiovascular mortality, as well as by a decrease in cardiovascular events as a composite outcome or individually (fatal and non-fatal stroke or acute myocardial infarction).The aim of antihypertensive therapy, in terms of blood pressure targets, is not specifically defined, with a SBP cut-off value of 140 mmHg. Greater reductions in all-cause and cardiovascular mortality have been observed with SBP targets of < 140 mmHg and DBP <90 mmHg.Intensive antihypertensive therapy (target SBP value < 120 mmHg) versus standard therapy (target SBP value < 140 mmHg) is more effective in significantly reducing severe composite cardiovascular events (cerebrovascular events such as stroke and coronary events such as acute myocardial infarction) as well as in decreasing all-cause mortality.Patients without chronic kidney disease at treatment initiation may have a higher risk of developing renal insufficiency (reduced glomerular filtration rate) with intensive therapy.Se ha de tener en cuenta que cifras tensionales < 140 mmgHg, podrían relacionarse con una mayor tasa de efectos adversos graves.SBP values < 140 mmgHg may be related to a higher rate of severe adverse effects.
Continued Sedentariness Intensive therapy in persons older than 80 years (maintaining SBP values < 120 mmHg) has been shown to produce a significantly greater reduction in all-cause mortality and major cardiovascular events (composite variable) than standard therapy (SBP < 140 mmHg); clinicians should be alert to a possible clinically significant reduction in kidney function (> 30% decrease in glomerular filtration rate) and a higher rate of acute renal insufficiency with intensive therapy.Treatments aiming at SBP values < 140 mmHg have not shown a significant reduction in mortality in older patients with frailty in studies where frailty is defined as baseline vulnerability (gait speed, grip strength, Fried model, Groeningen frailty index,osteoporotic fracture index).The risk of cardiovascular events has been demonstrated to be higher in patients older than 75 years with frailty than in those without frailty, independently of the intensity of antihypertensive treatment.Intensive therapy that achieves sustained SBP values < 120 mmHg in older patients decreases the number of major cardiovascular events and all-cause mortality in absolute terms compared with standard therapy (sustained SBP values < 120 mmHg).Antihypertensive treatments with diuretics in general (both potassium-sparing and thiazide diuretics) have favorable results versus placebo or other treatments in reducing cardiovascular risk, both in terms of cardiovascular and all-cause mortality. The results are more consistent in terms of their ability to reduce serious cardiovascular events overall and particularly in decreasing cerebrovascular morbidity and mortality (stroke). These antihypertensive treatments with diuretics show contradictory results in terms of the rate of adverse events but the rate is not higher than with other antihypertensive therapies.Antihypertensive therapy with beta-adrenergic blockers has not been demonstrated to significantly reduce cardiovascular risk versus placebo or other treatments; this treatment has only been shown to significantly decrease cerebrovascular morbidity and mortality versus placebo, but has a higher rate of adverse events than other antihypertensive therapies.Antihypertensive treatment with calcium channel blockers versus placebo has shown good results in reducing cardiovascular risk,cardiovascular and all-cause mortality, and cardiovascular morbidity and mortality overall and especially in decreasing cerebrovascular events, with a lower rate of adverse events versus other antihypertensive therapies.Antihypertensive drug therapy with angiotensin-converting enzyme inhibitors and angiotensin II receptor blockers are less well studied in the older population; only one meta-analysis has demonstrated a reduction in cardiovascular morbidity and mortality measured as a composite outcome but not different events separately.In the population older than 55 years, simple exercises such as handgrip exercise training for more than 4 weeks produce a clinically significant reduction in SBP and DBP, although the benefit on cardiovascular risk has not been assessed.Type 2 diabetes mellitus The retrieved studies assessing intensive vs conventional glucose control in patients ≥ 65 years do not demonstrate reductions in mortality, major cardiovascular events (fatal and non-fatal), or micro- and macrovascular events, but do report a higher yearly rate of severe hypoglycemic episodes. In other studies, strict glucose control in patients ≥ 65 years has shown a reduction in the composite outcome (major macrovascular events and microvascular events), only in terms of a lower incidence of kidney disease.Studies conducted in patients aged ≥ 80 years with type 2 diabetes have shown that very low (< 6%) or very high (> 8.5%)glycosylated hemoglobin levels were associated with higher mortality compared with intermediate levels (7.0%-7.4% or 8%-8.4%).Studies have demonstrated a “U”-shaped association between blood glucose levels and frailty in older people with type 2 diabetes:the risk of frailty increases with extremely high, low or elevated blood glucose levels.Treatments based on strict blood glucose control in older patients with type 2 diabetes have an increased risk of falls, functional deterioration and some geriatric syndromes.Low glycosylated hemoglobin levels (7%-7.9%) have been associated with worse functional status than higher levels (8%-8.9%) in patients with type 2 diabetes and a mean age of 80 years.There are no results from clinical trials evaluating the effect of intensive glucose control on cardiovascular events in older patients with frailty and type 2 diabetes.In older patients, glycemic control targets should be adapted to functional and cognitive status, comorbidities and life expectancy.In older patients with type 2 diabetes and good functional and cognitive status, virtually no comorbidity and good life expectancy, it is recommended to maintain targets similar to those of young adults with diabetes (HbA1c 7%-7.5%).In patients with functional disability, frailty, high comorbidity burden, or dementia, treatment for glycemic control should avoid symptomatic hyperglycemia and hypoglycemia. The aim of treatment is to maintain HbA1c targets of 7.5%-8.5%; targets are around 7.5%-8% in patients with mild or initial-phase disability or around 8%-8.5% if disability is moderate or severe.In patients receiving palliative care, it is recommended to avoid symptomatic hyperglycemia and hypoglycemic episodes, not perform HbA1c monitoring and maintain glycemia < 200 mg/dL.In patients with type 2 diabetes ≥ 65 years, metformin is recommended as the first-line oral glucose-lowering agent due to its ability to reduce mortality and other cardiovascular events and because it does not cause hypoglycemia or weight gain; it can also reduce agerelated comorbidities.Metformin is contraindicated in patients with a glomerular filtration rate < 30 mL/min per 1.73 m2 due to its tendency to accumulate in blood and the increased risk of lactic acidosis.Studies with patients with type 2 diabetes discharged with a principal diagnosis of acute myocardial infarction or heart failure demonstrate that treatments with thiazolidinediones (pioglitazone) and metformin reduced all-cause mortality.These results contradict those of other studies reporting a higher risk of admission for heart failure and acute myocardial infarction(with rosiglitazone) or all-cause mortality.Thiazolidinediones increase weight, produce fluid retention and increase the risk of heart failure, loss of bone mineral density in older women with diabetes and fracture risk.

Continued Sedentariness Drug therapy with sulfonylureas in patients with type 2 diabetes aged ≥ 65 years has not been demonstrated to reduce mortality but has been shown to increase the risk of hypoglycemia; there are no studies demonstrating a reduction in macro- or microvascular complications.Glibenclamide use is not recommended in patients with glomerular filtration rate < 30 mL/min per 1.73 m2 or in those with severe liver failure or an elevated risk of hypoglycemia (a history of severe hypoglycemia, cognitive decline, major depression, advanced age with pluripathology and disability, and low BMI).Meglitinides have been demonstrated to have a lower risk of hypoglycemia than sulfonylureas.There are no studies demonstrating their effect or benefit on cardiovascular events in the older population with diabetes.Repaglinide is excreted mainly through the biliary route and can be an alternative in patients with glomerular filtration rate < 30 ml/min per 1.73 m2.Alpha-glucosidase inhibitors (acarbose) reduce postprandial glycemia without increasing the risk of hypoglycemia in older patients with type 2 diabetes; clinicians should bear in mind their adverse gastrointestinal effects (flatulence and diarrhea) and scarce efficacy.Use of dipeptidylpeptidase-4 (DPP-4) inhibitors in older patients with type 2 diabetes has proven effectiveness in reducing glycosylated hemoglobin and glycemia and demonstrated safety even in adults of advanced age in terms of the incidence of cardiovascular events, mortality, and hospitalization for heart failure and has also been shown to be well tolerated (very low risk of hypoglycemia and neutral effect on weight).DPP-4 inhibitors can be administered in patients with renal insufficiency by adjusting the dose, except lingliptin due to its biliary excretion.In patients with type 2 diabetes aged ≥ 70 years, use of lixisenatide, a glucagon-like peptide-1 antagonist, reduces glycosylated hemoglobin and postprandial glycemia versus placebo. It is also associated with greater weight loss and more frequent development of gastrointestinal symptoms such as nausea and vomiting. In two pooled analyses of patients aged ≥ 65 years in clinical trials with lixisenatide and liraglutide, no differences were found in safety or efficacy compared with younger patients.There are no studies on GLP-1 receptor antagonists demonstrating their effect on cardiovascular events in older adults with type 2 diabetes, although liraglutide and semaglutide have decreased cardiovascular events in studies with younger patients with type 2 diabetes. These drugs have been associated with a risk of pancreatitis, although this finding has not been confirmed in all studies.Studies of the effect of treatment with sodium-glucose type 2 cotransporter (SGLT-2) inhibitors have demonstrated that they act independently of insulin, interfering with glucose reabsorption and favoring glucosuria.Empagliflozin has been demonstrated to reduce all-cause and cardiovascular mortality; empagliflozin, canagliflozin and dapagliflozin have been shown to reduce hospitalization for heart failure.Data show no differences in safety and efficacy between the older and younger population; however, these drugs should be administered cautiously in the older population due to the lack of specific data for this age group. Older patients should also be well selected due to their tendency to hypertension and sensitivity to water loss, as well as their risk of fractures (canaglafloxin), toe and metatarsal amputations and possible rare cases of euglycemic ketoacidosis (entire drug group).Basal insulin analogs (glargine, determir and degludec) have not been shown to improve glycemic control but have been associated with a lower frequency of hypoglycemic episodes (nocturnal). These treatments can be considered as the treatments of choice versus NPH insulin in patients with a tendency to hypoglycemia.In older patients with diabetes, maintenance of combined therapy with oral antidiabetic agents is recommended to reduce insulin doses and avoid the use of complex insulin regimens.In older patients, insulin therapy is associated with a higher risk of hypoglycemia, falls and fractures; therefore, decision-making on this therapy should be personalized in this age group with priority given to safety.Biphasic, or premixed, forms of insulin are associated with better glycemia control (in patients poorly controlled with basal insulin);these forms are also associated with weight gain and a higher risk of hypoglycemia.Simplifying and de-escalating antidiabetic treatment is recommended in older patients after comprehensive geriatric assessment. The use of more complete regimens (e.g., basal-bolus) should be reserved for patients requiring them and who maintain good quality of life, life expectancy and self-care ability.A multimodal intervention consisting of physical exercise and nutritional education has been shown to be effective in improving functional status in older patients with type 2 diabetes mellitus and frailty.Dyslipidemia Primary prevention measures for dyslipidemia should be the same in older adults as in younger adults, including smoking cessation and avoiding sedentariness and overweight.Diet is especially important in the older population, with avoidance of restrictive diets and malnutrition risk, particularly in persons with cognitive decline and nursing home residents.Older patients benefit from a comprehensive approach with attention paid to comorbidity and geriatric syndromes.Drug therapy used for secondary prevention should be the same in older patients as in the younger population.Lipid-lowering therapy in the older population, with LDL-C reduction, prevents both individual and composite cardiovascular events (cardiovascular death, myocardial infarction, stroke, and coronary revascularization), especially in secondary prevention, with similar benefits as those in the younger population.Initiating statin therapy should be considered in primary prevention in older patients at high or very high cardiovascular risk.Initiating low-dose statin therapy is recommended in patients with significant renal insufficiency or a high probability of drug interactions, depending on their tolerance and target LDL-C levels, to avoid more serious secondary effects (such as myalgia or myopathy) and rare adverse effects (such as rhabdomyolysis).
BMI: body mass index; COPD: chronic obstructive pulmonary disease; CV: cardiovascular; CVR: cardiovascular risk; DM: diabetes mellitu; DBP: diastolic blood pressure; GLP-1 receptor antagonists: glucagon-like peptide 1 receptor antagonist; HDL-C: high-density lipoprotein colesterol; LDL-C: low-density lipoprotein colesterol; MS: metabolic syndrome; NPH insulin: Neutral Protamine Hagedorn;SBP: systolic blood pressure; SGLT-2: sodium-glucose type 2 cotransporter.
Sedentariness
The overall quality of the evidence is low. There were no specific diagnostic criteria for sedentariness in older adults.
Prevention. All-cause mortality decreased in formerly sedentary older adults but remained higher than in consistently non-sedentary individuals.[6]Moreover, mortality increased among newly sedentary adults but less so than in consistently sedentary individuals.[6]
The results on whether increasing physical activity in older adults decreases sedentariness are contradictory,[2,6]and there are no strategies that specifically target sedentariness in older adults, except the recommendation of reducing sitting time and taking more frequent breaks during sedentary behaviour.[7]
Intervention-treatment. Moderate-to-intense physical activity (measured with an accelerometer) positively impacts CVRF in older adults,[8]while the benefit of light physical activity is more controversial.[4,8,9]Prescription of physical activity should be progressive, individualized, precise and with clear objectives. The program should include aerobic exercise,strength training, flexibility and balance, as well as health education. Exercise programs for patients with sarcopenia or frailty lack the specificity, frequency and duration needed for patient improvement,[10]and it is especially important to achieve cardiovascular conditioning in patients with CVRF.Perhaps the simplest way to increase aerobic physical exercise in robust older adults is to set a target of more than 10,000 steps a day (high level of evidence).[11]
Smoking
The overall quality of studies is low. There are no specific diagnostic criteria in older adults.
Prevention. Older adults who smoke or are exsmokers have a higher risk of all-cause mortality and mortality due to CVD and cancer,[12,13,14]as well as a higher risk of cognitive decline.[15,16]Mortality reaches a peak around the age of 60-70 years.[17,18,19]The number of pack/years also influences mortality risk and the longer the time since smoking cessation, the greater the risk reduction.[18,19]The risk of all cardiovascular events 5-10 years after quitting is reduced by 46%,[17,20]indicating that, given current life expectancy, smoking cessation should be recommended even in very old persons. Older smokers lose quality-adjusted life years, and the higher the number of cigarettes smoked and the longer they have smoked, the greater the loss (up to 55%).[21]Quality of life begins to improve 11 years after quitting in older adults and can equal that in never-smokers.[21]
Intervention-treatment. Recommendations do not differ from those in the rest of the population, focusing on the need for clear prescription by the health team, setting a date for quitting smoking with a prior preparation period, and the use of nicotine replacement therapy, which lacks specific recommendations for older adults in the product information sheet. Regarding personalized interventions for older adults, some clinical trials have reported satisfactory results versus routine clinical practice or guideline recommendations in serious attempts to quit or short periods of abstinence, but unfortunately these affects did not persist in the long term.[21,22,23]
Obesity and Metabolic Syndrome
The overall quality of the studies is moderate or high, particularly those examining treatment and prevention.
There are no specific diagnostic criteria for obesity and metabolic syndrome in older adults. However, in the last few years, knowledge has increased on sarcopenic obesity as an especially important entity in functional decline in older adults.[24]
Prevention. The prevalence of metabolic syndrome in the elderly seems to be lower in older adults with moderate red wine consumption[25]and higher intake of low-fat dairy products.[26]
Treatment-intervention. No studies were found on the management of obesity and metabolic syndrome specifically in older adults with frailty and functional decline or on drug therapy for the treatment of obesity and metabolic syndrome in older adults. Exercise capacity seems to be inversely related to arterial stiffness and age in persons with metabolic syndrome.[27]In older patients at high risk of CVD, a Mediterranean diet supplemented with extra virgin olive oil or nuts seems to reverse metabolic syndrome.[28]
Hypertension
The overall quality of studies is moderate or high.There were no specific studies on diagnosis in the older population.
Prevention. In older patients with frailty and those older than 80 years, there are doubts about the benefit of treatment,[29,30,31]but meta-analyses in this patient subgroup show a reduction in cardiovascular morbidity and mortality when expressed as a composite outcome including various cardiovascular events or cerebrovascular morbidity and mortality, or all-cause mortality.[32,33]
Intervention-treatment. In older adults, intensive targets (systolic blood pressure [SBP] < 120 mmHg or diastolic blood pressure [DBP] < 90 mmHg) seem to reduce all-cause mortality[34,35]or cardiovascular mortality as a composite,[36]or individual outcome.[34]However, achieving targets < 140 mmHg was related to more frequent severe adverse effects[33]versus standard targets (SBP < 140 mmHg). Older adults with frailty derive no mortality benefit from the application of intensive therapy.
Diuretics (potassium-sparing or thiazide diuretics), beta-blockers and calcium channel blockers have been shown to effectively reduce cardiovascular risk. However, calcium channel blockers seem to have a more favourable safety profile, while betablockers may have a higher rate of adverse events.These conclusions are drawn from clinical trials and meta-analyses of these trials, and consequently the evidence is of high quality. There is less evidence on angiotensin-converting enzyme inhibitors and angiotensin II receptor blockers (Table 5), and its overall quality is moderate.
Type 2 Diabetes Mellitus
Although we retrieved a substantial number of studies, the general quality of the evidence is low,except that for dipeptidyl peptidase-4 (DPP4) inhibitors and for recommendations on multifactorial intervention in older adults with frailty[38](Table 6).
No studies were found on diagnosis or prevention with results specifically in the older population.
Intervention-treatment. In patients ≥ 65 years, intensive glucose-lowering vs standard glucose-lowering strategies did not reduce mortality or cardiovascular events but did lead to higher annualized rates of severe hypoglycaemia.[39]None of the remaining large clinical trials,[40,41]comparing the effect of intensive versus standard glucose-lowering strategies on micro- or macrovascular events provided data specifically on the older population. Among the group of “very old” adults,[42,43]very low (< 6%)or very high (> 8.5%) glycosylated hemoglobin levels were associated with higher mortality and worse functional status. Moreover, the risk of frailty increased with extreme glycemia levels,[44,45]which also increased the risk of falls.[46,47]
The decision to prescribe insulin to this age group should be individualized with priority given to safety regarding the risk of falls, fractures and hypoglycemic episodes.[48]Basal insulin analogs (glargine, detemir and degludec) do not achieve strict glycemic control but produce fewer episodes of nocturnal hypoglycemia. The MID-frail trial demonstrated the effectiveness of a multimodal intervention composed of physical and nutritional education on improving functional status in older people with frailty and type 2 diabetes mellitus.[38]
Dyslipidemia
The general quality of selected studies on this CVRF is high. There were no studies on diagnosis or prevention reporting results specifically in the older population.
Prevention. Recommendation of highly restrictive diets should be avoided due to the associated risk of malnutrition, especially in older adults with cognitive impairment or those living in nursing homes. Reducing low-density lipoprotein cholesterol (LDL-C) levels is indicated in older patients because of its prognostic benefit in primary and secondary prevention, especially in patients with the most elevated cholesterol levels and highest cardiovascular risk.[49,50]
智者云:“成功不是等待将来才会拥有,而是从决定去做的那一刻起,持续积累而得。”中学生语言的积累亦是如此,而语言的积累建立在中学生博览群书的基础之上。我们要鼓励引领中学生博览广记,为学生营造轻松愉悦的阅读氛围,点燃他们阅读的趣味之火,使他们走进文本,学会精研词句,深度解读文本,以促其积累。
Intervention-treatment. Current recommendations are broadly similar to those in younger patients,[51]but attention should be paid to polypharmacy, adverse effects, comorbidity and geriatric syndromes, and a comprehensive approach should be adopted that adapts treatment goals to patients´ functional prognosis and life expectancy. In older patients, very low cholesterol levels can be associated with more frequent negative events, possibly reflecting worse nutritional status and a higher prevalence of comorbidity and geriatric syndromes.
Recommendations on drug therapy do not differ from those in the younger population, but adverse events are more frequent in older adults[52](Table 7).
Alcohol
The overall quality of the selected studies is low or very low.
Diagnosis. Screening questionnaires for alcohol abuse, such as CAGE,[53]are designed for the younger population, who more commonly have occupational, legal or social complications; moreover,they focus on current rather than lifelong consumption and do not include atypical manifestations (falls or confusion) or masking due to comorbidity.[54,55]Screening tests designed for the older population are the MAST-G and its brief version SMAST-G,[56]which have good sensitivity and specificity.[54]
Prevention. Given that older adults are more sensitive to the effects of alcohol, it has been postulated that neither sex should exceed intake of 10 grams of alcohol per day,[57,58]but observational studies have reported that light or moderate consumption (12-30 g) in men older than 65 years is safe, and reduces allcause mortality and the incidence of CVRF, especially ischemic heart disease.[59,60]Older patients should never be advised to start or increase drinking alcohol to gain a cardioprotective benefit,[59]due to the interaction between alcohol and certain drugs, including antidiabetic agents, anticoagulants and antithrombotics.[59,61]The effect of maintaining light-to-moderate alcohol consumption in elderly patients with heart failure is less clear.
Intervention-treatment. Older individuals are less frequently referred to specialist treatment.[54]However, studies suggest that response to rehabilitation among persons older than 65 years is better than in younger persons. Inpatient detox is recommended because of the greater number of complications and length of the process. Benzodiazepines should be prescribed cautiously because of the risk of adverse effects. The evidence on other drug therapies is limited.[54]Long-term follow-up and support are essential to maintain abstinence.[55]
DISCUSSION
The quality of the studies reviewed was mostly low or moderate. Moreover, many studies contained no data that could help to answer the clinical questions posed in this review.
Several points should be highlighted: first, there are no specific diagnostic criteria for any CVRF in the older population and definitions are universal.However, this review reveals that the specific characteristics of older adults may bias not only therapeutic management but also diagnosis; thus; sedentariness can be confused with functional decline and, in patients who begin to be dependent or who are in chronic pain (highly frequent and disabling in older adults), the same criteria cannot be used. Similarly, because of the high rate of sarcopenic obesity in older adults, there is a need to establish specific screening criteria. The criteria for alcoholism should perhaps also be updated, given that there may be no effects on working or family life in older adults.
Second, it is essential to remember that the aim of any treatment plan in older adults is not only survival but also quality of life and, in particular, maintaining the functional independence that maintains quality of life. A major shortfall of the studies analyzed is their failure to include these factors. Although studies recommend evaluation of patients´baseline status before the start of statin therapy in primary prevention as well as avoiding overly restrictive diets due to the risk of undernutrition in this age group, and even include events such as the risk of falls, fractures and hypoglycemic episodes when discussing management with antidiabetic agents(Tables 5 & 6), quality of life and functional independence are only analyzed in highly specific studies.[38]
Third, in the last few years, frailty syndrome has become key in the care of older patients, in all clinical settings, but especially in the approach to patients with heart disease.[62]However, there is very little literature on how to modify CVRF management in older people with frailty. At the most, studies recommend a flexible approach in the treatment of diabetes in older patients with frailty or functional dependence, but reducing frailty is not mentioned as an outcome in studies on the treatment of CVRF or as a variable that could modify treatment.
Finally, clinical trials of drugs mainly used in older patients (such as those used for CVRF control)do not include a sufficient number of older participants,[63,64]and even less so patients with frailty,functional decline, or comorbidity. This hampers safe prescription in older patients, in whom we cannot even be sure that our interventions are appropriate since clinical trials do not reflect the reality of clinical practice.
Despite the recommendations that can be made on the basis of the available evidence, in the elderly,everything should be viewed through the prism of the presence of other geriatric syndromes. For example, diuretic use can be considered effective in reducing cardiovascular risk in older patients but can also worsen urinary incontinence and encourage, among other adverse effects, functional dependence and falls. Similarly, the use of oral antidiabetic agents in older adults should always prioritize safety[45]and current recommendations recommend adapting glycated haemoglobin targets to the profile of older adults (frailty, comorbidity, life expectancy).
The main limitation of this study is the lack of high-quality studies with older adults as the target population. Study designs are often observational,with self-reported measurements, and short study duration, and often exclude nursing home residents, reducing the quality of the available evidence and their ecological validity in older adults. Moreover, there is wide heterogeneity in the definition of older adults among authors, limiting the recommendations that can be made in this population. Another limitation is the large number of studies appearing each year on CVRF, leading to the need for guidelines to be periodically updated.
As conclusion, despite the large body of data on the management of CVRF in older adults, the available evidence should be applied with caution and always with a view to maintaining quality of life and functional independence. The most effective tool available is the continued use of comprehensive geriatric assessment to implement the most appropriate treatment plans according to each patient´s baseline status and comorbidity.
Acknowledgements
Drs. Marta Castro Rodríguez and Almudena Areosa Sastre have carried out an external review of the results of the project and the publication, providing improvements to it in the quality of its content and its writing.
Grant information
Funding has been received from the Mapfre Guanarteme Foundation for the study. This funding was not used for study design or data collection, analysis and interpretation; nor in the decision to submit the article for publication. This work has received the scientific endorsement of the Spanish Society of Geriatric Medicine and the Canarian Society of Geriatrics and Gerontology.
猜你喜欢
小学生学习指导(当代教科研)(2021年4期)2021-09-23
小学生学习指导(当代教科研)(2021年6期)2021-05-23
空中之家(2018年1期)2018-01-31
中学生英语(2016年3期)2016-12-01
空中之家(2016年1期)2016-05-17
太空探索(2015年4期)2015-07-12
小说月刊(2015年7期)2015-04-23
作文评点报·作文素材小学版(2014年8期)2014-03-12
自动化博览(2014年10期)2014-02-28
自动化博览(2014年7期)2014-02-28
 Journal of Geriatric Cardiology2022年11期
- Journal of Geriatric Cardiology的其它文章
- Screening for hypertension-mediated organ damage and aetiology: still of value after 65 years of age?
- Effectiveness of sacubitril-varsartan versus angiotensin converting enzyme inhibitors in patients hospitalized for acute heart failure: a retrospective cohort study of the RICA registry
- Systemic inflammatory markers in elderly patients undergoing transcatheter aortic valve replacement
- Cost-utility analysis of transcatheter aortic valve implantation versus surgery in severe aortic stenosis patients with intermediate surgical risk in Thailand
- The relationship between serum miR-21 levels and left atrium dilation in elderly patients with essential hypertension
- Validating the accuracy of a multifunctional smartwatch sphygmomanometer to monitor blood pressure