Weighting Function Modification Used for Phase Transform-Based Time Delay Estimation
Xue Yang,Changchun Bao,Zihao Cui
Speech and Audio Signal Processing Laboratory,Faculty of Information Technology,Beijing University of Technology,Beijing 100124,China
Abstract: Generalized cross-correlation is considered as the most straightforward time delay estimation algorithm.Depending on various weighting function,different methods were derived and a straightforward method,named phase transform (PHAT) has been widely used.PHAT is well-known for its robustness to reverberation and its sensitivity to noise,which is partly due to the fact that PHAT distributes same weights to the frequencies dominated by signal or noise.To alleviate this problem,two weighting functions are proposed in this paper.By taking a posteriori signal-to-noise ratio (SNR) into account to classify reliable and unreliable frequencies,different weights could be assigned.The first proposed weighting function borrows the idea of binary mask and distributes same weights to frequencies in same set,whereas,the second one assigns weights based on coherence function.Experiments showed the robustness of proposed methods to reverberation and noise for improving the performance of time delay estimation through various criteria.
Keywords: time delay estimation; generalized crosscorrelation;PHAT;a posteriori SNR;coherence function
I.INTRODUCTION
Time delay estimation (TDE),which aims at looking for the time difference of arrival(TDOA)between the signals received by microphone sensors,always serves as the first stage of a system to detect,identify and localize sound sources.Nowadays,TDE has been applied to various fields,including radar,sonar,seismology and wireless communication systems.In addition,it has played an important role in plenty of locationaware applications,such as automatic camera steering[1,2],tracking and localizing acoustic sources[3–5],microphone array beamforming for suppressing noise and reverberation[6],etc.
Ideally,without adverse influences imposed by ambient noise and reverberation,the signals received by microphone sensors are scaled and delayed version of each other.The TDE would be an easy task in this ideal case.However,in reality,the existence of noise is inevitable,moreover,the boundaries and/or objects may reflect the source signal and cause echo and spectral distortion.Therefore,the received signals may be severely deteriorated by these factors,which make TDE a complicated and challenging problem.For decades,researchers have made great efforts to explore the underlying properties of the received signals and a great many algorithms have been proposed.
Based on different analysis methods,the TDE algorithms could be divided into three categories: generalized cross-correlation(GCC)method[7–9],leastmean squares (LMS) adaptive filtering method [10–12],and adaptive eigenvalue decomposition (AEVD)method[13,14].The GCC method,which is the most straightforward TDE algorithm,computes the crosscorrelation function (CCF) of the filtered version of the received signals and determines the lag time that maximizes the CCF as the delay estimate.Depending on the filters used,variousa priorknowledge has been incorporated to improve the performance of TDE.Compared with the GCC method,the LMS-type adaptive method is derived differently.Taking two received signals into consideration,one is unfiltered and the other is filtered using a finite impulse response(FIR)filter.By minimizing the mean-square error between these two signals,the delay estimate is obtained as the lag time associated with the largest component of the FIR filter.The LMS-type adaptive method could achieve highly accurate results,but need an adaption time so that this method is unusable for real time systems.The AEVD method is derived from the convolutive model,which could accurately describe the signal propagation in reverberant conditions.Diverse from the other two categories,the AEVD method needs to identify the channel impulse response from the source to the microphone sensors and the delay estimate is determined by finding the direct paths from these two measured impulse responses.Therefore,the AEVD method offers an efficient solution for speech processing in reverberant environment.In the present work,since the GCC method could provide relatively fast results with an acceptable accuracy,this method will be mainly taken into consideration.
The GCC method was well explained in the landmark paper written by Knapp and Carter in 1976[7].It is still the most popular technique for the TDE.As aforementioned,the delay estimated is obtained by maximizing the CCF between the filtered versions of the received signals.Different filters,corresponding to various weighting functions in frequency domain,incorporate differenta priorknowledge and form a variety of GCC methods.One of the most preferable method is the phase transform(PHAT)method[7].As developed purely as a straightforward technique,the PHAT method only considers the cross-power spectrum phase (CSP) information by simply weighting each frequency component with the inverse of its magnitude.It has been shown and proved that the performance of the PHAT method is robust in reverberant scenarios but will deteriorate severely with the decrease of signal-to-noise ratio(SNR)[15,16].Another useful weighting function is the Hannan-Thomson(HT) processor [17],it assigned greater weights in regions of frequency domain where the coherence is large.It has been shown that the HT processor is a maximum likelihood (ML) estimator for time delay under certain conditions [7].Apart from these two well-known weighting functions,a great many of other weighting functions have been proposed as well.The Roth processor [18]has a desirable effect of suppressing the frequency regions where the noise spectrum is large but it uses only power spectrum of one signal.The smoothed coherence transform (SCOT) [19]is a generalized version of Roth and uses power spectra of both signals.Theρ-CSP[20],which adds a whitening parameter to the PHAT,discards the non-speech portion below 200Hz.Theρ-CSPC [21]reduced errors for relatively small energy signals by adding the minimum of the coherence function in the denominator ofρ-CSP.The modified PHAT method that de-emphasizes the noisy frequency components based on the idea of generalized spectral subtraction was proposed in [22].Apart from these methods,a novel approach to explore the CSP using frequency sliding window was proposed in 2020[23].
As PHAT shows great robustness to reverberation and high sensitivity to noise,the goal of this paper is to improve its robustness to noise.Thus,two modified weighting functions are proposed.By takinga posterioriSNR into account to classify the frequencies dominated by signal or noise,different weights could be assigned.The first method uses a binary mask to distribute same weight to frequencies in same set and the second one works based on coherence function.Experiments showed the effectiveness of the two proposed weighting functions.
The rest of the paper is organized as follows.The signal model and the general framework of GCC method are reviewed in Section II.The proposed weighting functions are described in Section III.The experimental settings and results are given in Section IV.Finally,the conclusions are addressed in Section V.
II.BASIS OF TIME DELAY ESTIMATION
The ideal anechoic model is first described in this section.Then,the general framework of GCC method is revised and several weighting functions are shown.
2.1 Signal Model
Assume that an acoustic source emits signals and a pair of microphone sensors receive the signals propagating by different paths.Considering an ideal anechoic scenario,the acoustic signals[n]propagates radiatively and the sound level drops due to the distance between the source and microphone sensors.The output noisy signals at these two sensors could be modeled as:
wherexi[n]andvi[n]are the received signal and the additive noise at theithsensor,respectively.βiis the attenuation factor of the propagation,varying from 0 to 1.miis the propagation time from the source to theithmicrophone sensor.
Since weighting functions operate in the frequency domain in general,the signals need to be transformed using the discrete-time Fourier transform (DTFT).Thus,the signals represented in frequency domain are expressed as:
whereYi(ω),Xi(ω),S(ω)andVi(ω)are the DTFTs of the output signal,the received signal,the source signal and the additive noise at theithsensor,respectively.
If the location of the source and theithmicrophone sensor are denoted asls=(xs,ys,zs)∈R3andli=(xi,yi,zi)∈R3respectively,the TDOA(expressed in samples)between the two sensors is obtained:
wherefsis the sampling frequency,cis the velocity of sound,Rd(·)represents the rounding operation.
2.2 General Framework of GCC
The GCC method provides a mechanism to incorporatea prioriknowledge to improve the performance of the TDE.It emphasizes some frequency regions and de-emphasizes the others through the weightingfunction used,which depends on the characteristics of the acoustic signal and the noise.The CCF of the filtered version of the noisy signals,termed as generalized CCF of the noisy signals as well,is the inverse discrete-time Fourier transform (IDTFT) of the weighted cross-power spectrum and is expressed as:
whereW(ω)is the frequency weighting function and Ψy1y2(ω)=E{Y1(ω)Y ∗2(ω)}is the cross-power spectrum of the two obtained signals,in whichE{·}represents the expectation.In practice,the crosspower spectrum has to be estimated and is usually calculated with the currently obtained signals instead of taking the expectation,i.e.,(ω)=Y1(ω)Y ∗2(ω).
The delay estimated is obtained as the lag time that maximizes the generalized CCF,i.e.:
Different weighting functions possess different properties.A widely used definition appeared in various weighting functions is the coherence function,which is a function related to the cross-correlation.The coherence function is a real function between 0 and 1 which gives a measure of correlation between the obtained signals at each frequency.It is defined in terms of cross-power spectrum and power spectrum,i.e.:
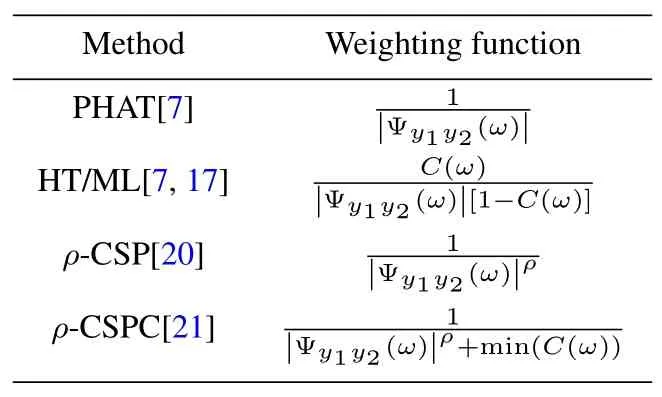
Equipped with these definition,several commonly used weighting functions are listed in Table 1.

Table 1.Several commonly used weighting functions.
As shown in Table 1,PHAT uses the inverse of the magnitude of cross-power spectrum as the weighting function,meaning that PHAT discards the magnitude information of the signals and achieves TDE only based on CSP.The“whitening”process corresponds to sharpening the peak of generalized CCF.If the noise is uncorrelated with speech signals and two additive noises are uncorrelated with each other,the generalized CCF is derived as:
whereδ[τ]is the unit impulse function.Thus,the generalized CCF of PHAT shows a unit impulse at the true delay.
One of the main advantages of PHAT is its robustness to reverberation,which is explained in [15].As a result,it becomes a suitable choice for TDE in real reverberant scenarios.However,its performance degrades rapidly with the decrease of SNR.To improve its robustness in the case of noise,while trying to keep its performance in reverberant scenarios as much as possible,several approaches have been proposed[20–23].
III.PROPOSED WEIGHTING FUNCTIONS
In this section,two weighting functions are proposed to improve the robustness of PHAT in the case of noise by selecting reliable frequency(i.e.,signal dominated frequency) components througha posterioriSNR and/or the coherence function in noisy situations.
3.1 Weighting Function Based on A Posteriori SNR
The reason for low robustness of PHAT in noisy scenarios is that all frequency components have the identical contribution,i.e.,frequencies influenced severely by the noise have the same effect with those reliable frequencies in the TDE.
Whilst I was fainting with terror he transported me here, and cried to me with his awful voice: There shall you remain, lonely and hideous84, despised even by the brutes85, till the end of your days, or till some one of his own free will asks you to be his wife
To attenuate this effect,the idea of binary mask[24]is borrowed.In the context of improving the robustness of PHAT for the noise,the binary mask makes use of binary gain functions,which amounts to choosing part of frequencies from the corrupted CSP.This selection is done according to a prescribed rule.
The most straightforward way to select reliable frequencies is to usea priorSNR as an indicator.A priorSNR is defined as the ratio of clean signal power to the noise power in[25].In practice,for each speech signal of the two microphone sensors,a priorSNR could be expressed as:
However,since the clean signal is not accessible,a priorSNR could not be calculated directly.Alternatively,a posterioriSNR,for each output signal,is used as selected criterion and is defined as:
Using the triangle inequality,a priorSNR could be bounded bya posterioriSNR:
As discussed in[26],for a particular frequencyω0,ifξi(ω0)>1 (i.e.,local SNR>0dB),then it is assumed that the signal dominates this frequency.On the contrary,ifξi(ω0)≤1,this frequency is dominated by the noise.Therefore,according to (10),a thresholdγth=4 fora posterioriSNR is obtained to classify a particular frequencyω0as signal dominated or noise dominated.As will be shown in Section IV,this threshold could also be verified by experiments.
Having this criterion based ona posterioriSNR at hand,the reliable frequencies for each noisy signal could be determined.By taking their intersection,the reliable frequencies for both signals are obtained and used for TDE.The set of these reliable frequencies is denoted as:
Using the notion of binary mask,higher weight is assigned for reliable frequencies inand lower weight is distributed for unreliable ones.Therefore,the modified weighting function is expressed as:
where the denominator is the magnitude of crosspower spectrum,same with that in PHAT.ρ(ω) is a binary mask depending ona posterioriSNR and is written as:
whereαis a constant whose value is between 0 and 1 and is determined through experiments.
3.2 Weighting Function Based on Coherence Function Combined with A Posteriori SNR
As mentioned in Section II,the coherence function is an indicator which shows the correlation between signals at each frequency.For a particular frequencyω0,the larger the valueC(ω0)is,the higher the correlation degree is at this particular frequency.By means of the coherence function,different weights could be assigned to the frequencies in the same set,depending on various correlation degree at each frequency.Assume that the additive noise is uncorrelated with the signal and the two noises are not totally uncorrelated,which is usually encountered in real world.The coherence function in(6)could further be written as:
The (14) could be interpreted in this way.If the speech signal dominates a particular frequencyω0,which means that the cross-power spectrum and power spectra of the noises are relatively small compared with the power spectrum of the source signal,then the coherence function will have the value close to 1 at this frequency.Similarly,if the noises dominate frequencyω0,the value of the coherence function may approximate 1 as well and the proximity depends on the correlation degree between these two noises.
Thus,using only the coherence function is not sufficient to reflect the correlation degree between signals since high value could be obtained for highly correlated noises at some frequencies.This problem could be alleviated by combining the coherence function witha posterioriSNR.Concretely,the weighting function is written as:
whereµ(ω)is used to control the degree of weighting and depends ona posterioriSNR:
whereβis greater than 1 and is determined through experiments.(15)and (16)could be explained as follows: For reliable frequencies determined bya posterioriSNR,the numerator of the weighting functionWC(ω)turns to be the coherence function and will assign different weights depending on the correlation degree of two signals.For unreliable frequencies,since the value of coherence function is between 0 and 1 andβis greater than 1,the numerator of the weighting functionWC(ω)becomes smaller and will assign small weight to unreliable frequencies.
In summary,two proposed weighting functions both choose reliable frequencies for both two signals based ona posterioriSNR,and assign high weights to these chosen frequencies.The main difference between these two weighting functions is that:the first one borrows the idea of binary mask and assigns same weights to frequencies in the same determined set,whereas,the second one assigns different weights depending on the correlation degree.
IV.EXPERIMENTAL RESULTS
This section gives the criteria used to assess the performance and describes the experiments conducted to evaluate the performance of the proposed weighting functions.
4.1 Performance Criteria
To better evaluate the performance of the TDE algorithm,the delay estimates are classified into two categories(non-anomalous class and anomalous class[27]) according to its absolute errorei=||τ†−||,whereτ†is the true time delay andis theithdelay estimate.Another definition used is the signal correlation timeTc[28],which is defined as the width of the main lobe of autocorrelation function of source signal (taken between the-3dB points).Tcequals to 4 samples (0.25ms) for the particular speech used in our experiments.A delay estimateis identified as a failure or an anomaly if the absolute erroreiexceedsTc/2,otherwise,it would be deemed as a success or a non-anomalous estimate.
In this paper,the performance of TDE algorithm is evaluated in terms of the percentage of accuracy over total estimatesPacc,the percentage of anomaliesPa,the mean absolute error(MAE)and the standard deviation of absolute error(SDAE)for the non-anomalous estimates.These measures are defined as:
whereNaccis the number of estimates whose value equals to the true delay,NTdenotes the total number of estimates,Nais the number of estimates that are identified as anomalies,Nnais the number of nonanomalous estimates,andχnarepresents the set of non-anomalous estimates.
4.2 Simulation Environment Setup and Algorithm Parameters
Considering a single source scenario,two identical microphone sensors are positioned in a rectangular room and receive signals radiated from the source.The image source method[29]is used to simulate reverberant environment.The parameters used are shown below:
• Room dimensions:7m×6m×3m(length×width×height).
• Uniform reflection coefficients for each reflective boundary:γivaries between 0 and 1 and is independent of the frequency and the incidence angle of the signal.
• Source position:a point omnidirectional source is located at(1.85,3.00,1.40).
• Sensor positions:two microphones are positioned at(3.45,5.00,1.40)and(3.55,5.00,1.40),with a spacing of 0.1m.The directivity of each sensor is omnidirectional.
• SNR:varying between-5dB and 15dB.
The clean speech signals are selected from the TIMIT corpus [30]and is down-sampled to 16kHz.Speech signals used to test the TDE algorithms is 40 seconds.The clean speech signals are convolved with the generated impulse response to produce the received signals.Various noise is scaled and added to the received speech signals for controlling SNR.The noise used is chosen from the NoiseX-92 database[31]and DEMAND database [32].The synthetic signals are framed using a hamming window with window length of 1024 samples and 50%overlap.The true delay for experimental setting in this paper is 3 samples.
The parameters used for two proposed weighting function areγth=4,α=0.05 andβ=3,their determinations will be shown below.The first proposed method based ona posterioriSNR is denoted as Gamma,and the second one using coherence function combined witha posterioriSNR is denoted as Co-Gamma.For comparative purposes,the results of PHAT,ML,ρ-CSPC,and modified PHAT [22](denoted as SPECSUB),which uses the idea of generalized spectral subtraction,are shown as well.The whitening parameterρinρ-CSPC is set to 0.9 and the parameters used for SPECSUB are same with that in[22].Apart from PHAT andρ-CSPC,other algorithms need to estimate the noise.Since different noises are added to simulate various environment,the noise estimation algorithm used in this paper is the one proposed by Loizouet al[33].
4.3 Determination of the Parameters in the Proposed Weighting Functions
As discussed in Section III,the threshold ofa posterioriSNR is chosen to beγth=4 for selecting frequencies which are dominated by signal.Experimental results show that this threshold is appropriate as well.The percentage of accuracy is obtained using Gamma method for different thresholds varying from 1 to 20.For simplicity,Gaussian white noise distributed over the whole frequency band is added to simulate noisy scenarios and SNR is set to 10dB,5dB and 0dB.
As shown in Figure 1,the curve obtained for each SNR case has a tendency to increase first and then decrease,meaning that there exists a maximum point.For a low threshold,the frequencies dominated by noise would be classified into reliable set as well and be assigned with high weights,leading to inaccurate delay estimate.With the increase of threshold,the size of the reliable set reduces and more reliable frequencies are classified into unreliable set,resulting in the slow decrease in accuracy.Taking all three curves into account,the maximum point for each curve occurs at the threshold around 4.Therefore,the threshold ofa posterioriSNR is set to be 4 in the subsequent experiments.
In Gamma method,after classifying frequencies into reliable set or unreliable set,the binary mask is used to assign different weights to these two sets.The weights for unreliable set are determined through experiments.Figure 2 shows the accuracy obtained in noisy scenarios and in reverberant scenarios for various parameterα.It is clearly shown that parameterαhas an opposite effect in noisy scenarios and in reverberant scenarios.Since the main purpose in this paper is to improve robustness of PHAT for the noisy case,while keeping its performance in reverberant scenarios as much as possible,a tradeoff is needed and the parameterαis chosen to be 0.05.
In Co-Gamma method,to attenuate the weights assigned to unreliable frequencies,the parameterβneeds to be determined.Figure 3 shows the accuracy obtained in noisy scenarios and in reverberant scenarios for varies parameterβ.As parameterβapproaches to 1,the performance of Co-Gamma is more accurate in reverberant scenarios and less accurate in noisy scenarios,which is similar to that for PHAT.With the increase ofβ,the accuracy in reverberant scenarios decreases and the accuracy in noisy scenarios increases.Again,a tradeoff needs to be made and parameterβis set to be 3.
4.4 TDE Results
The results in reverberant scenarios are shown in Figure 4 and Figure 5.The histograms of TDE of different methods are shown in Figure 4.The reverberant timeT60is set to 200ms,300ms and 400ms.As reverberant timeT60increases,the performance of all methods tends to degrade to some extent.However,PHAT and Co-Gamma show the highest robustness to reverberation,which is consistent with the goal in this paper.The performance for ML andρ-CSPC degrades severely,meaning that these two methods are sensitive to reverberation.ρ-CSPC performs even worse than ML as its accuracy is lower.The performance of SPECSUB and Gamma is better than that of ML andρ-CSPC and slightly worse than that of PHAT and Co-Gamma.The performance comparison of Gamma and Co-Gamma indicates that assigning the same weights to the same set of frequencies is a relatively rough choice and could be improved by considering the correlation degree of each frequency.Figure 5 shows the results for the percentage of anomaliesPa,the mean absolute error and the standard deviation of absolute error.The percentage of anomalies increases with the increase of reverberation time for all methods.Although the accuracy ofρ-CSPC is low,itsPais relatively better than other methods.Co-Gamma performs better than PHAT for these three criteria.Gamma performs better than ML,ρ-CSPC and SPECSUB in terms of MAE,however,itsPais relatively high.
The results in anechoic and noisy scenarios are shown in Figure 6 and Figure 7.Gaussian white noise is added and SNR is set to 10dB,5dB and 0dB for now.As the SNR decreases,the performance of PHAT degrades severely and ML shows the best robustness to noise as shown in Figure 6.By selecting reliable frequencies,Gamma and Co-Gamma perform better than PHAT and the performance of Co-Gamma is similar to that of ML in noisy scenarios.By considering the correlation degree at each frequency,Co-Gamma has less percentage of anomalies,less MAE and less SDAE than Gamma as shown in Figure 7.The performance ofρ-CSPC is similar to that of SPECSUB and both two methods are more robust to noise than PHAT.
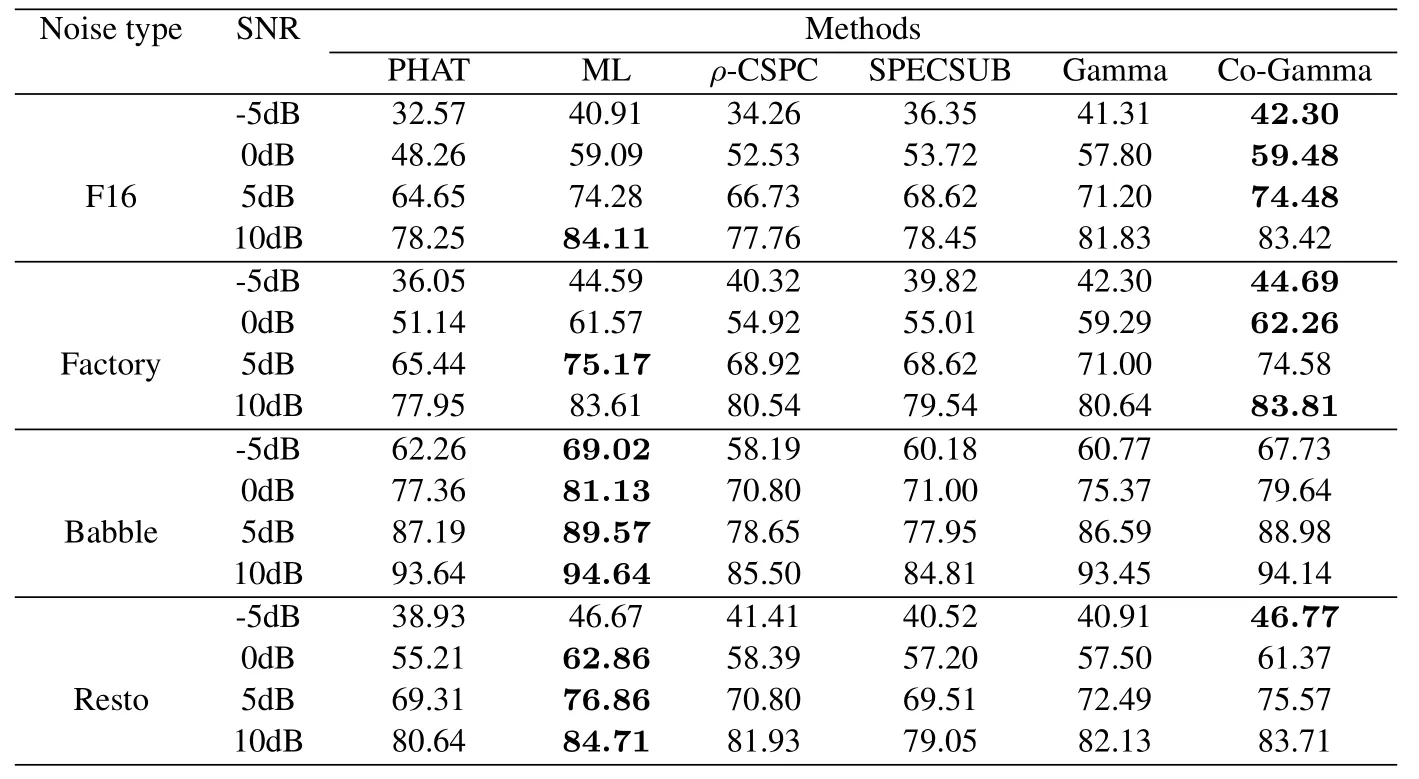
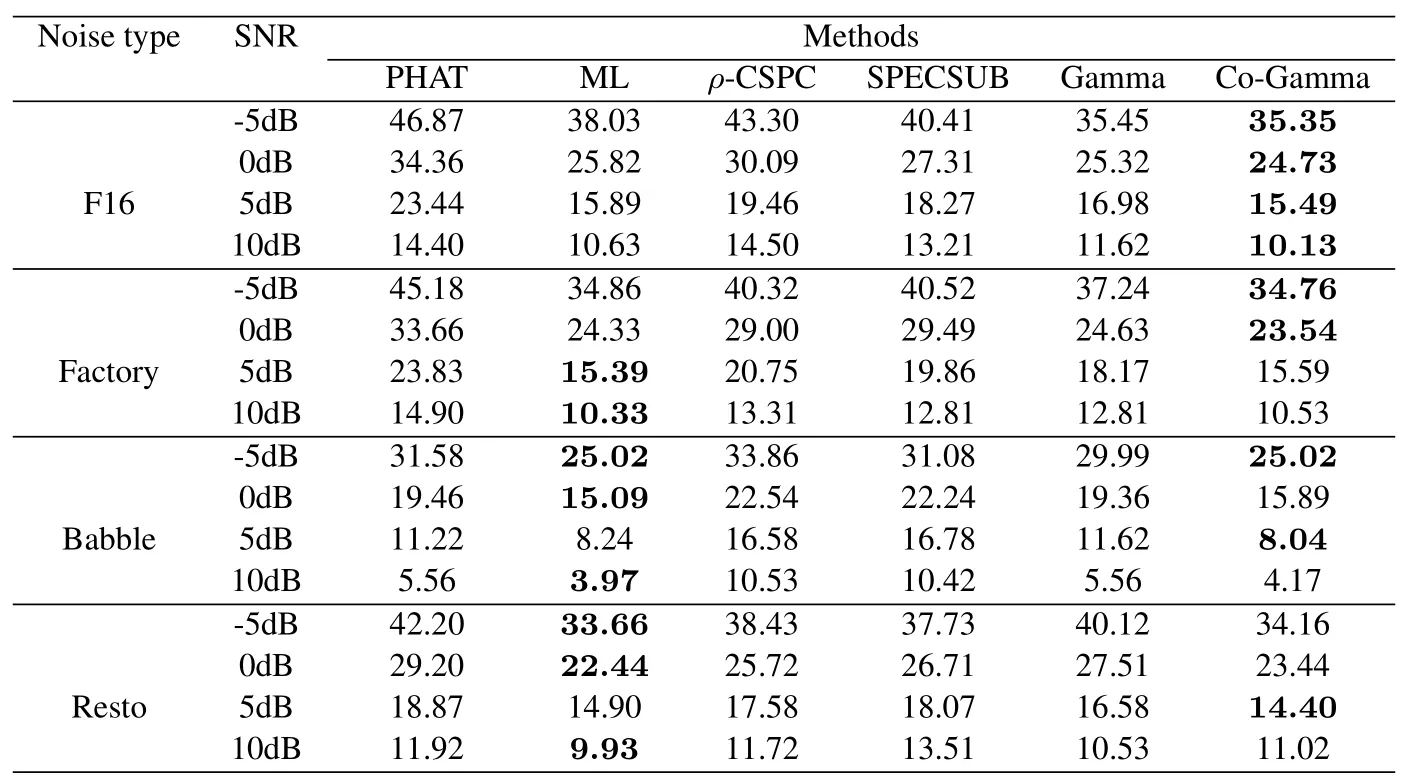
Different kinds of noise are added to evaluate the performance of proposed methods as well.The noises used are F16,factory,babble and resto.The results are shown in Table 2 and Table 3.ML,Gamma and Co-Gamma show their robustness to different kinds of noise and Gamma performs slightly worse than the other two.The results are similar for Co-Gamma and ML.For some kinds of noise,Co-Gamma is better and for others,ML works better.As for other methods,ρ-CSPC is comparable to SPECSUB.Apart from babble noise,PHAT is sensitive to other noise and worse than other methods since its accuracy decreases and its percentage of anomalies increases with the decrease of SNR.

Table 2.Percentage of accuracy for different methods in various noisy environments.

Table 3.Percentage of anomalies for different methods in various noisy environments.
The results in reverberant and noisy scenarios are shown in Figure 8.The noise used is the traffic noise in DEMAND database[32].In moderately noisy and reverberant environment,all methods performs relatively well and the accuracy of Co-Gamma is better than the others.However,as the reverberant time increases and SNR decreases,the performance of all methods degrades.With more reverberations introduced,the reliable and unreliable frequency sets estimated througha posterioriSNR become more and more inaccurate,leading to the degradation of performance.
V.CONCLUSIONS
In this paper,to improve the robustness of PHAT to noise while keeping its performance in reverberant scenarios,two weighting functions were proposed to modify the weight assignment of PHAT.The reliable and unreliable frequency sets were obtained based ona posterioriSNR.The first proposed method,Gamma,assigns same weight to frequencies in the same set by borrowing the idea of binary mask,whereas the second proposed method,Co-Gamma,takes the correlation degree of each frequency into account and assigns weights in a different way.The experiments show that both two methods achieved the goal by showing their robustness to both reverberation and noise.On the whole,Co-Gamma performs relatively better than Gamma by incorporating the coherence function.
ACKNOWLEDGEMENT
This work was supported by the National Natural Science Foundation of China(Grant No.61831019).
- China Communications的其它文章
- Environment Information-Based Channel Prediction Method Assisted by Graph Neural Network
- Multi-Scenario Millimeter Wave Wireless Channel Measurements and Sparsity Analysis
- AG Channel Measurements and Characteristics Analysis in Hilly Scenarios for 6G UAV Communications
- Long-Range VNA-Based Channel Sounder: Design and Measurement Validation at MmWave and Sub-THz Frequency Bands
- A Novel Millimeter-Wave Channel Measurement Platform for 6G Intelligent Railway Scenarios
- A Geometry-Based Stochastic Scattering Channel Model for V2V Communications in Dense Urban Street Environments

