Machine learning based altitude-dependent empirical LoS probability model for air-to-ground communications*#
Minghui PANG ,Qiuming ZHU ,Zhipeng LIN ,Fei BAI ,Yue TIAN,Zhuo LI,Xiaomin CHEN
1Key Laboratory of Dynamic Cognitive System of Electromagnetic Spectrum Space,College of Electronic and Information Engineering,Nanjing University of Aeronautics and Astronautics,Nanjing 211106,China
2State Key Laboratory of Integrated Services Networks,Xidian University,Xi’an 710000,China
3Key Laboratory of Radar Imaging and Microwave Photonics,Ministry of Education,College of Electronic and Information Engineering,Nanjing University of Aeronautics and Astronautics,Nanjing 211106,China
E-mail: {pangminghui,zhuqiuming,linlzp,baifei,tian_yue,lizhuo,chenxm402}@nuaa.edu.cn
Abstract:Line-of-sight (LoS) probability prediction is critical to the performance optimization of wireless communication systems.However,it is challenging to predict the LoS probability of air-to-ground (A2G) communication scenarios,because the altitude of unmanned aerial vehicles (UAVs) or other aircraft varies from dozens of meters to several kilometers.This paper presents an altitude-dependent empirical LoS probability model for A2G scenarios.Before estimating the model parameters,we design a K-nearest neighbor (KNN) based strategy to classify LoS and non-LoS (NLoS) paths.Then,a two-layer back propagation neural network (BPNN) based parameter estimation method is developed to build the relationship between every model parameter and the UAV altitude.Simulation results show that the results obtained using our proposed model has good consistency with the ray tracing (RT)data,the measurement data,and the results obtained using the standard models.Our model can also provide wider applicable altitudes than other LoS probability models,and thus can be applied to different altitudes under various A2G scenarios.
Key words:Line-of-sight probability model;Air-to-ground channel;Machine learning;Ray tracing
1 Introduction
The unmanned aerial vehicle (UAV) technique is expected to be widely used in sixth-generation(6G)wireless communication due to its compactness and flexibility (Zhang XF et al.,2010;Alladi et al.,2020;Xiao et al.,2020;You et al.,2021).Different from traditional ground base station (BS) communication,air-to-ground(A2G)communication involves three-dimensional random scatterers.Therefore,UAV altitude information needs to be considered in A2G scenarios (Fan et al.,2016;Zhu et al.,2019,2021b;Vitucci et al.,2021).However,the lineof-sight (LoS) path,which is the most reliable A2G link,is time-varying and difficult to predict.Therefore,constructing altitude-dependent LoS probability models is essential for design and optimization of A2G communication systems.
LoS probability models are generally divided into two classifications,i.e.,geometry-based analytical models and measure-based empirical models.The geometry-based analytical models predict the LoS probability according to the electromagnetic wave propagation theory and the geometry information.The geometry information is usually obtained from the given digital maps or statistical properties of environments.Digital maps analyze the signal propagation in a deterministic way,i.e.,via the ray tracing (RT) (Holis and Pechac,2008;Zhu et al.,2022)and point cloud(Järveläinen et al.,2016)methods,but these methods require an accurate digital map with detailed material information.Statistical properties describe the built-up environment using statistical characteristics of buildings (ITU-R,2003;Liu et al.,2018;Al-Hourani,2020;Cui et al.,2020;Gapeyenko et al.,2021).For example,ITU-R(2003)used three parameters to describe the geometrical statistics of urban areas.However,it is complex and difficult for the analytical methods to reflect the impact of the scenarios accurately.
Measure-based standard empirical models,e.g.,the Third Generation Partnership Project (3GPP)TR 38.901 (3GPP,2016b),5G Channel Model(5GCM) (3GPP,2016a),and WINNER II (WINNER,2008),are usually established based on the measurement data.Since field measurement is complex and costly,many researchers use RT simulation data for channel modeling (Holis and Pechac,2008;Samimi et al.,2015;Khawaja et al.,2018;Lee et al.,2018;Mao et al.,2020;Zhu et al.,2021b).Specifically,by analyzing the RT simulation data of New York City,Samimi et al.(2015) proposed an RT-based empirical model,where the square index was added to improve the descent speed.Lee et al.(2018)proposed a model that had a low mean square error in the high-rise urban scenario.Holis and Pechac(2008)built an empirical prediction LoS probability model with respect to the elevation angle for scenarios with altitudes of platforms more than 10 km.However,these models cannot be employed in UAV communication scenarios,because they are applicable only for scenarios where altitudes of the platforms are below dozens of meters or over several kilometers.
The aforementioned empirical methods are designed based on traditional parameter estimation methods,e.g.,the minimum mean square error(MMSE) and least square (LS) (Lin et al.,2018).These traditional methods usually require specific functional relationships between variables.Therefore,they are ineffective when the relationship is uncertain.Recently,machine learning (ML) based parameter estimation methods have received a lot of attention.This is because they can accurately determine the internal connection between parameters (Li et al.,2019;Yang WF et al.,2019;Huang C et al.,2020;Huang J et al.,2020;Zheng et al.,2020;Yang M et al.,2021).Moreover,as the first step of parameter estimation,the LoS and non-LoS(NLoS) classifications of channel data were studied in Huang C et al.(2020) and Zheng et al.(2020).Huang C et al.(2020) used the support vector machine(SVM)and artificial neural network(ANN)to perform LoS/NLoS recognition on vehicle-to-vehicle network measurement data.In Zheng et al.(2020),a new LoS/NLoS identification method based on the convolutional neural network (CNN) was proposed,achieving an error rate below 1%.Some researchers focused on using ML to predict the LoS probability directly.For example,Yang WF et al.(2019)used ANN,K-nearest neighbor(KNN),and gradient boosting decision tree (GBDT) methods to predict the LoS probability directly under indoor scenarios.However,none of these prediction models can be applied to different scenarios without modification.
In this paper,a new altitude-dependent empirical LoS probability model is presented for A2G communication scenarios.The main contributions are summarized as follows:
1.We propose a new altitude-dependent empirical LoS probability model based on massive RT simulation data for A2G communications.Considering the scenario effects,distance effects,and the altitude factor,this model is more suitable for A2G scenarios than other models.
2.We design an ML-based parameter estimation algorithm that introduces the altitude factor to every model parameter.We establish virtual city scenarios based on the statistical characteristics of buildings,and perform numerous RT simulations on the virtual scenarios to obtain the training data for the parameter estimation algorithm.
3.We propose a KNN-based LoS/NLoS identification solution to recognize the LoS path and calculate the LoS probability.We also construct a twolayer back propagation neural network (BPNN) for model parameter estimation.As a result,the adaptability and accuracy of the proposed empirical LoS probability model can be further improved.
2 New empirical model for the LoS probability
2.1 Background
The LoS probability is defined as the probability that the signal propagating from the transmitter to the receiver along the geometrically shortest route is not blocked by any object available in the propagation environment.The LoS probability is typically modeled as an exponential function against the distance with two undetermined parameters (Holis and Pechac,2008;3GPP,2016b;Zhu et al.,2021a).Specifically,the 3GPP LoS probability model can be expressed as

wheredTRis the distance between the transmitter and the receiver,D1=18 m is the breakpoint distance where the LoS probability is no longer equal to 1,andD2=36 m is a decay parameter that controls the decreasing rate of the LoS probability with distance.Based on Eq.(1),Samimi et al.(2015)proposed the New York University (NYU) LoS probability model and improved the accuracy of the model by squaring the above formula as a whole.In particular,this model was constructed using a higher resolution intersection test,compared with the 3GPP model based on the real database of New York City.The NYU LoS probability model can be expressed as Eq.(2) (see the bottom of this page),whereD1andD2are 27 m and 71 m,respectively.
2.2 New multi-height LoS probability model
In this subsection,we propose an altitudedependent empirical LoS probability model with three parameters.Current LoS probability models fit only the measurement data well when the altitude of the platform is about 10 m.Thus,the scope of application of these models is limited.The expression of our model is given by Eq.(3) (see the bottom of this page),wherehTRis the height from the transmitter to the receiver,andD3is a new auxiliary parameter that balances the influence ofD1andD2.Considering the flexible model architecture and extensive data,ML is employed in this study for LoS probability prediction because it shows excellent ability to improve the performance on parameter estimation(Li et al.,2019;Yang WF et al.,2019;Huang C et al.,2020;Huang J et al.,2020;Zheng et al.,2020;Yang M et al.,2021).In our method,we introduce the altitude factor to the parameters of the LoS probability model.
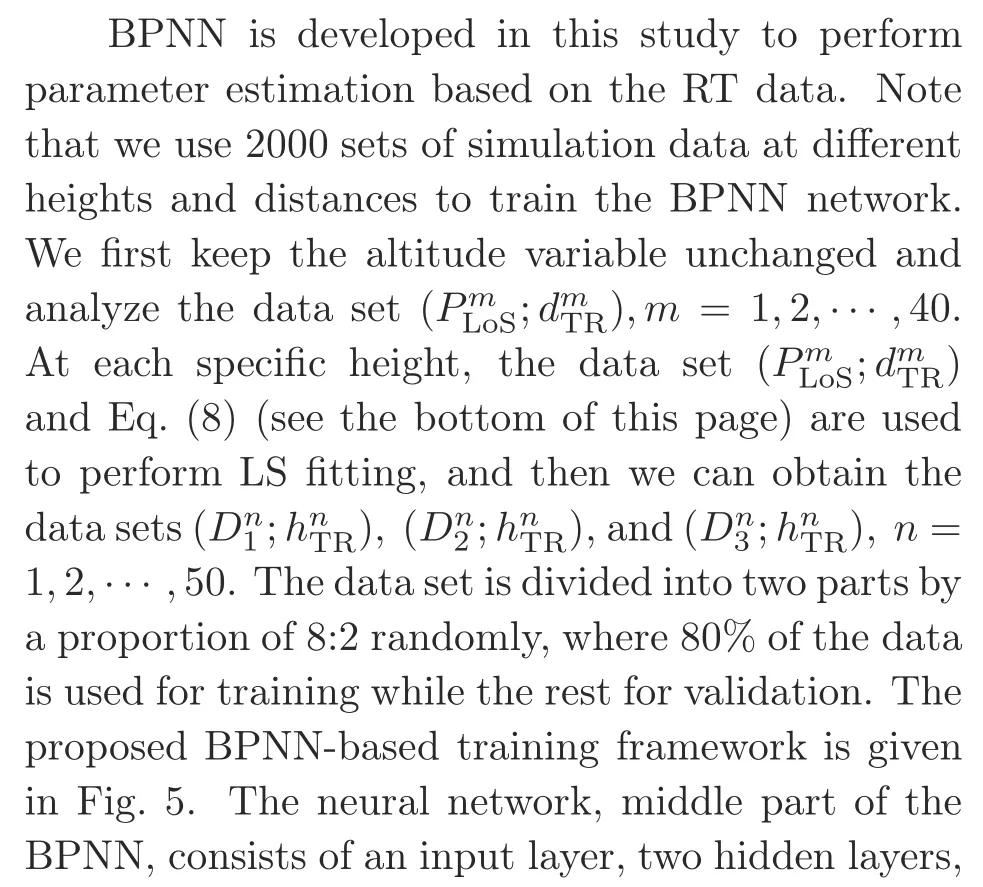
The process of our proposed ML-based parameter estimation is shown in Fig.1.Since field measurements for A2G channels are difficult and costly,the RT simulation data is adopted as the training data.We first carry out scenario reconstruction and RT simulation for four typical urban scenarios to obtain the required data for parameter estimation.Then,we classify the simulated or measured input data as LoS and NLoS data.Note that in this study,we develop a modified KNN algorithm to perform LoS/NLoS classification.The ratio of the LoS path number to the total path number with respect to thenthheight andmthdistance is.The LoS probability at a specific height with different distances can be denoted as,m=1,2,···,40.Moreover,the LS method is adopted to fitD1,D2,andD3atndifferent heights(n=1,2,···,50)as the BPNN training data sets,and.Finally,a part of the data sets is used to perform BPNN training and obtain the parameters ofD1(hTR),D2(hTR),andD3(hTR),which are altitude dependent.
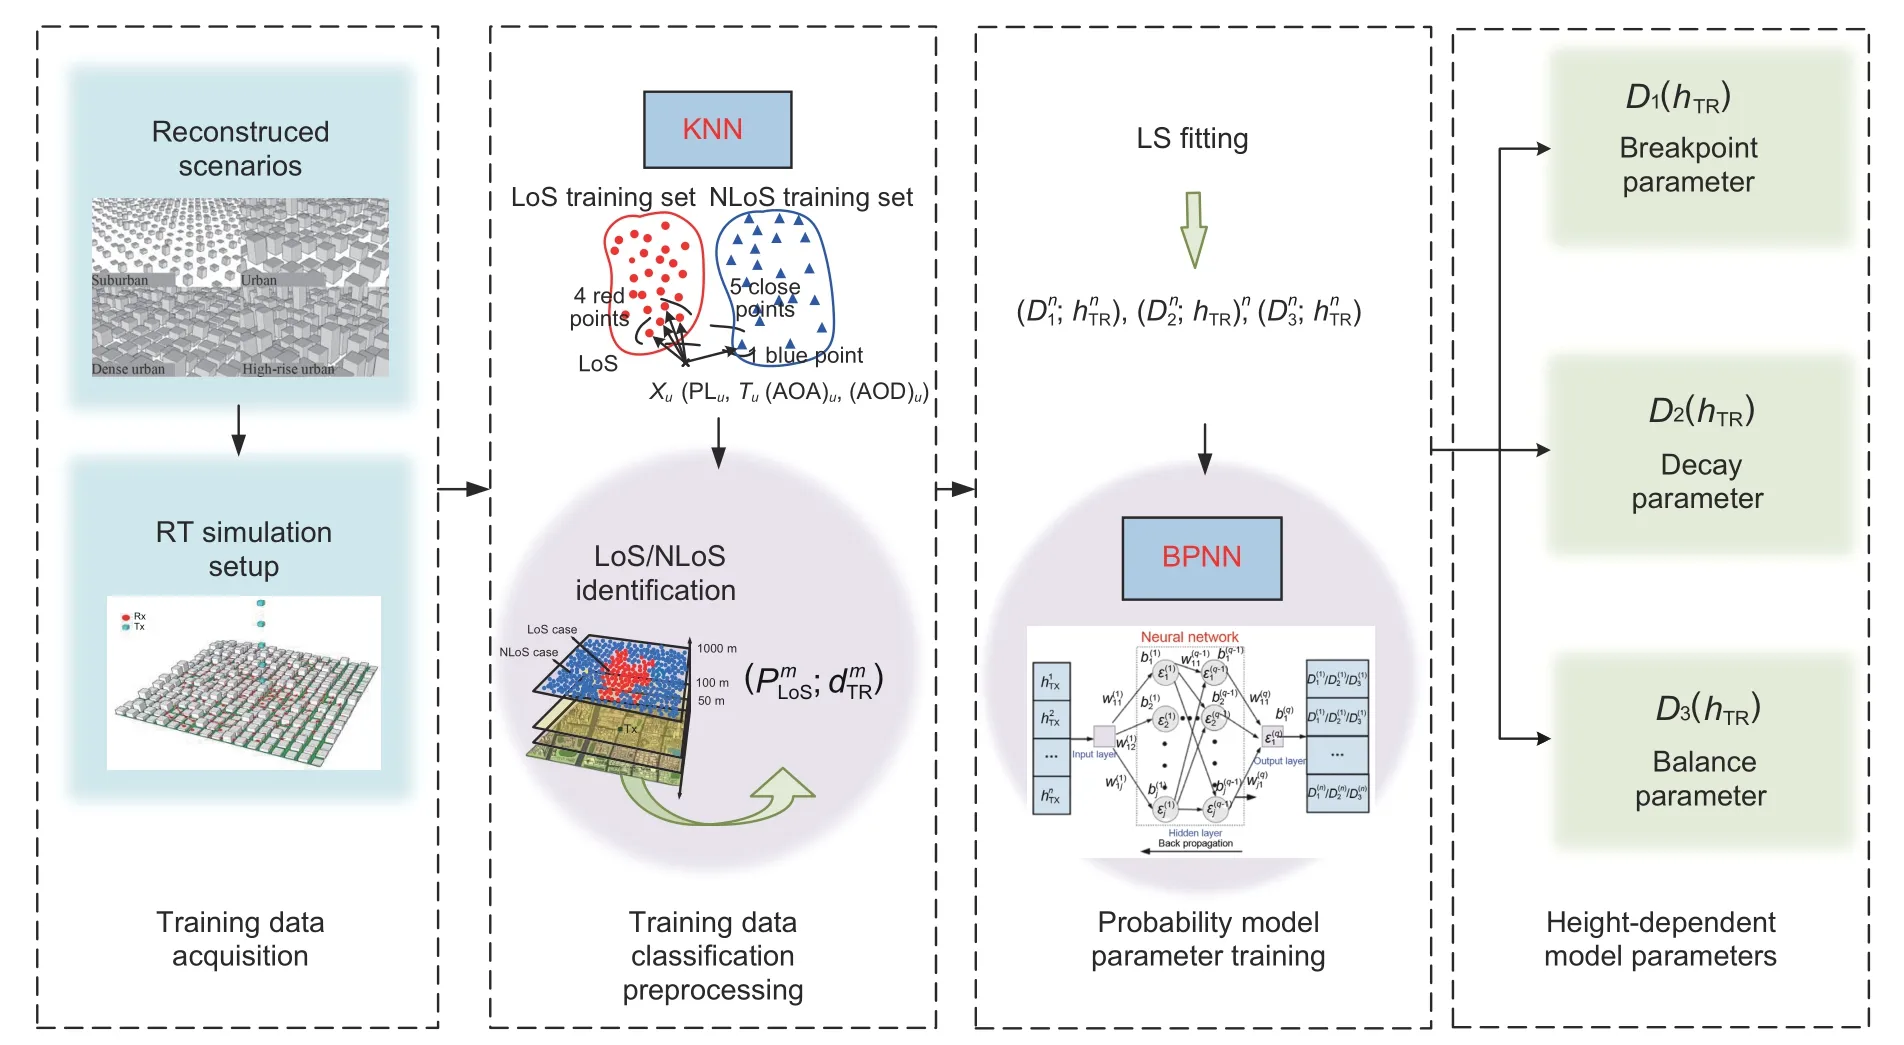
Fig.1 A flowchart of parameter estimation
3 ML-based estimation for model parameters
3.1 RT-based channel data
The RT technique has been widely used in channel modeling and verification to deal with the
inconvenience and high cost of field measurement(Holis and Pechac,2008;Samimi et al.,2015;Khawaja et al.,2018;Lee et al.,2018;Mao et al.,2020;Zhu et al.,2021b).In RT simulations,the electromagnetic wave radiating from the source is considered as a bunch of rays using a ray-optic approximation,and thus a geometric solution can be obtained based on the uniform theory of diffraction and geometric optics.By tracking all rays with the forward or reverse technique,the propagation parameters can be calculated.
When the RT technique is applied,accurate and detailed geometric and electromagnetic descriptions of the scattering environment are required.In this study,we reconstruct four typical urban scenarios according to the statistical characteristics of buildings (ITU-R,2003).The locations of buildings and streets follow a uniform distribution and the heights of buildings follow a Rayleigh distribution.The environment-dependent statistical parameters are shown in Table 1,whereαis the percentageof the land area covered by buildings,βrepresents the mean number of buildings in the unit area,γis a random variable denoting the random building height with the probability density function (PDF)as

Table 1 Environment-dependent parameters of four scenarios

Wis the width of the building,andSis the width of the street(ITU-R,2003;Holis and Pechac,2008;Al-Hourani et al.,2014).Fig.2 shows the four typical reconstructed scenarios,i.e.,suburban,urban,dense urban,and high-rise urban,and the area of each scenario is 4 km2.
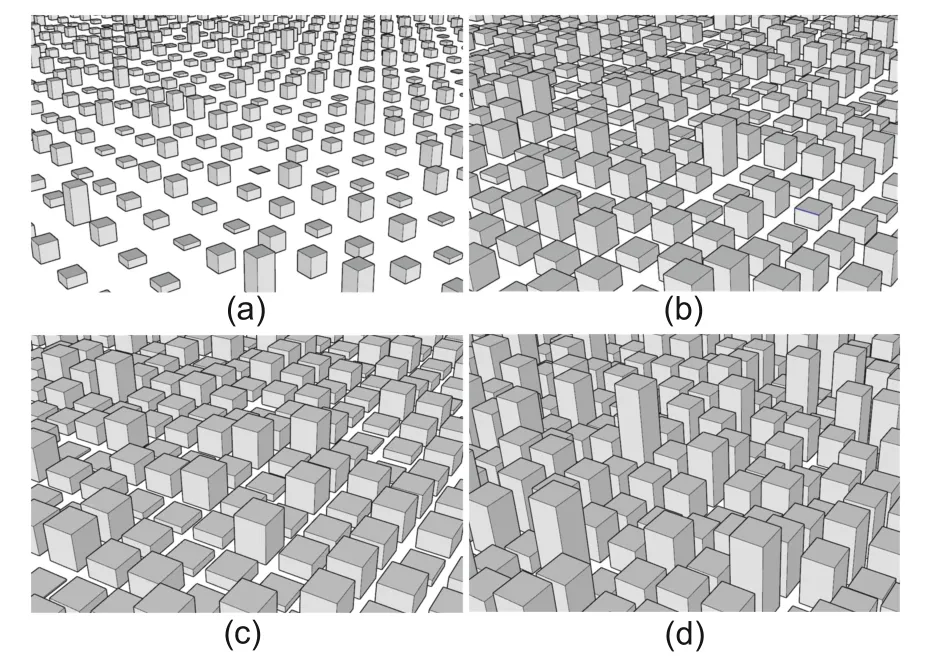
Fig.2 An illustration of the reconstructed scenarios:(a) suburban;(b) urban;(c) dense urban;(d) highrise urban
We perform the RT technique on the reconstructed scenarios and obtain the characteristic parameters,including the path loss (PL),delay,angle of arrival(AoA),and angle of departure(AoD).The simulation scenario setting is illustrated in Fig.3.The blue squares represent the locations of transmitters,whose heights are from 5 to 1005 m with an interval of 20 m.The red points are the positions of receivers distributed in concentric circles with the transmitter as the center.The radii of concentric circles are from 5 to 1000 m with an interval of 25 m,and the number of receivers on each concentric circle is around 200.To avoid contingency,we repeat the simulation five times and calculate the average values of the four characteristic parameters.The total number in the data set is about 10 000,and the simulation parameters are shown in Table 2.
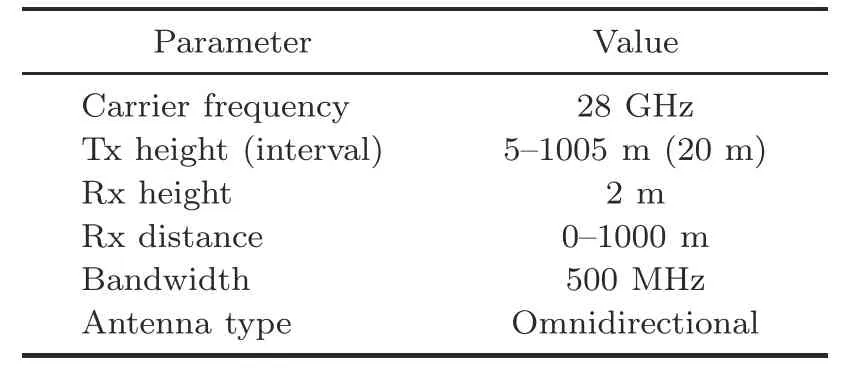
Table 2 Simulation parameters
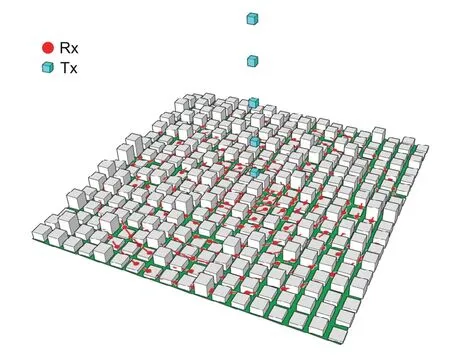
Fig.3 An illustration of data acquisition setup (References to color refer to the online version of this figure)
3.2 KNN-based LoS/NLoS classification
To calculate the LoS probability,we develop a KNN-based LoS/NLoS classifier to carry out the classification of the massive data obtained from the RT simulation.Based on the raw data set of PL,delay,AoA,and AoD,the classifier can identify the new input data as the LoS or NLoS condition.
In the KNN algorithm,the distance refers to the difference between two samples.Typical distance metrics include the Euclidean distance,Minkowski distance,Manhattan distance,and Chebyshev distance (Zhang Y et al.,2018;Yang GS et al.,2019).The KNN-based classifier in this study is based on the Euclidean distance.As shown in Fig.4,Xudenotes the new input data with four characteristic elements,the red dots represent the pre-labeled LoS data set,and the blue dots represent the pre-labeled NLoS data set.The KNN network obtains the LoS or NLoS status of the five points closest toXuby calculating the Euclidean distance betweenXuand the pre-labeled data.If the proportion of the LoS status in the five points is larger than that of the NLoS status,the new input data will be judged as LoS,and vice versa.
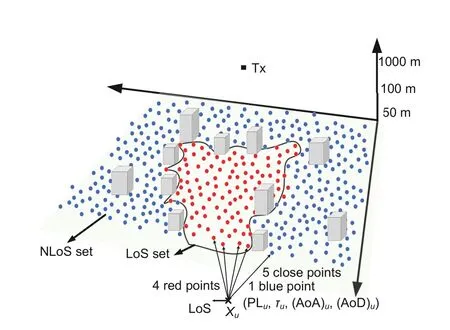
Fig.4 Diagram of the KNN network (References to color refer to the online version of this figure)
When we calculate the Euclidean distance,there is a problem that different characteristic elements have significantly different orders of magnitude.For fairness,the samples are normalized before model training.In this study,the linear normalization method is adopted for sample normalization,given by

wherexis the input value of each feature andx′is the normalized value.The distance calculation formula can be expressed as Eq.(6) (see the bottom of the next page),where PLu,τu,(AoA)u,and (AoD)u∈Xuare the four characteristic element values of the new input data,and PLv,τv,(AoA)v,and (AoD)vare the four characteristic element values of thevthlabeled data in the KNN network.
In this study,740 sets of simulation data at different heights and distances are used to train the KNN network.Note that there exists a data matrix for each height with a certain distance,and there are 200-700 collections of four different characteristic elements in each data matrix.Subsequently,80% of the characteristic elements in each matrix are randomly selected as the training set,whereas the remaining 20%are selected as the validation set.
To evaluate the network performance on classification,we can obtain the judgement error as

whereNiis the number of data points with incorrect judgments in the validation set,andis the total data point number in the validation set.
After using the KNN classifier to identify the new input data,we can obtain the LoS probabilitycorresponding to a specific height and distance,denoted as
3.3 BPNN-based parameter estimation

The output loss function is important in BPNN.When the network parameters are adjusted to minimize the value of the loss function,we can obtain the best fitting result.The loss function is expressed as

The learning rate used by the algorithm is 0.1,the momentum parameter is 0.9,and the number of training times is 40 000.After training and improvement,the neuron weights for four scenarios can be found in the supplementary materials (Tables S1-S4).

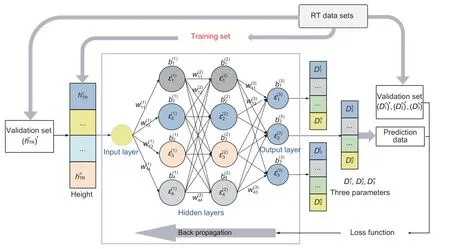
Fig.5 An illustration of the BPNN-based framework
Most urban scenarios can be approximately represented by one of these four typical scenarios,so the trained parameters in Tables S1-S4 can be used directly for prediction.For the high-precision application,we can calculateψ ∈{α,β,γ},W,andSof the new scenario,and retrain the neuron parameters using the BPNN-based estimation method.
4 Simulations and validation
4.1 Path classification validation
Taking the dense urban scenario as an example,we perform numerical simulations and comparisons to verify the proposed classifier.For the UAV altitudes of 200 m and 400 m,we can obtain the communication statuses between the receiver and the transmitter at different distances.As shown in Fig.6,the red points are the LoS paths,and the blue points are NLoS paths.We can see that the number of LoS paths decreases as the distance increases,while the number of LoS paths increases when the UAV altitude increases.Note that some square areas close to the center are still NLoS,because they are blocked by buildings in the scenario.Fig.6 also demonstrates the scientific nature of the KNN-based classification method.
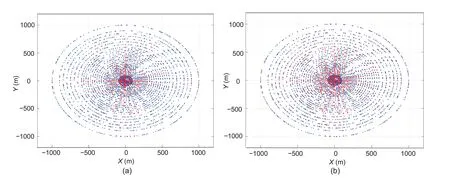
Fig.6 Judgment results under the dense urban scenario: (a) hTR=200 m;(b) hTR=400 m (References to color refer to the online version of this figure)
The judgment error calculated using Eq.(7) is shown in Fig.7a.As we can see,the judgment error of the KNN-based classifier is below 0.0005.In other words,the accuracy of LoS/NLOS classification is over 0.995,which is practical for further processing,and the accuracy of our classifier is higher than that of the classification method in Huang C et al.(2020).In addition,we use other ML classification methods,such as decision trees(DT),to build classifiers.Specifically,we use the classification and regression tree (CART) method,in which the Gini index is adopted to select the optimal division point of the optimal feature,each feature is divided recursively,and the feature space is divided into finite units.The error of the DT method is shown in Fig.7b.Comparing the error results in Fig.7,it can be seen that the performance of the KNN-based classification method is better than that of the DT-based method.This is because the KNN-based classification method can best reveal the data characteristics and balance the weight of each element.
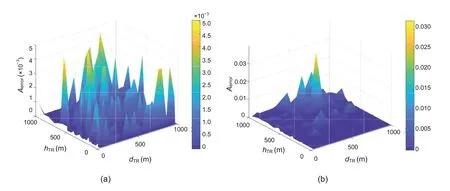
Fig.7 Judgment errors at different heights and distances under the dense urban scenario: (a) KNN;(b) DT
4.2 Parameter estimation validation
To evaluate the BPNN-based parameter estimation method,the training results of the training set and validation set on the three parameters are shown in Fig.8.It can be seen that parameterD1increases as the height increases.This means that the distance range continues to increase when the LoS probability is 1.Since the two parametersD2andD3jointly control the variation curve trend,they present a state of undulations within a certain range.Note that the results are in line with the theoretical derivation and objective laws.As shown in Fig.8,the neural network is well trained and the prediction values are in good agreement with the original values in the validation set.It also demonstrates that the prediction framework has good performance and describes the relationship between each parameter and UAV height.
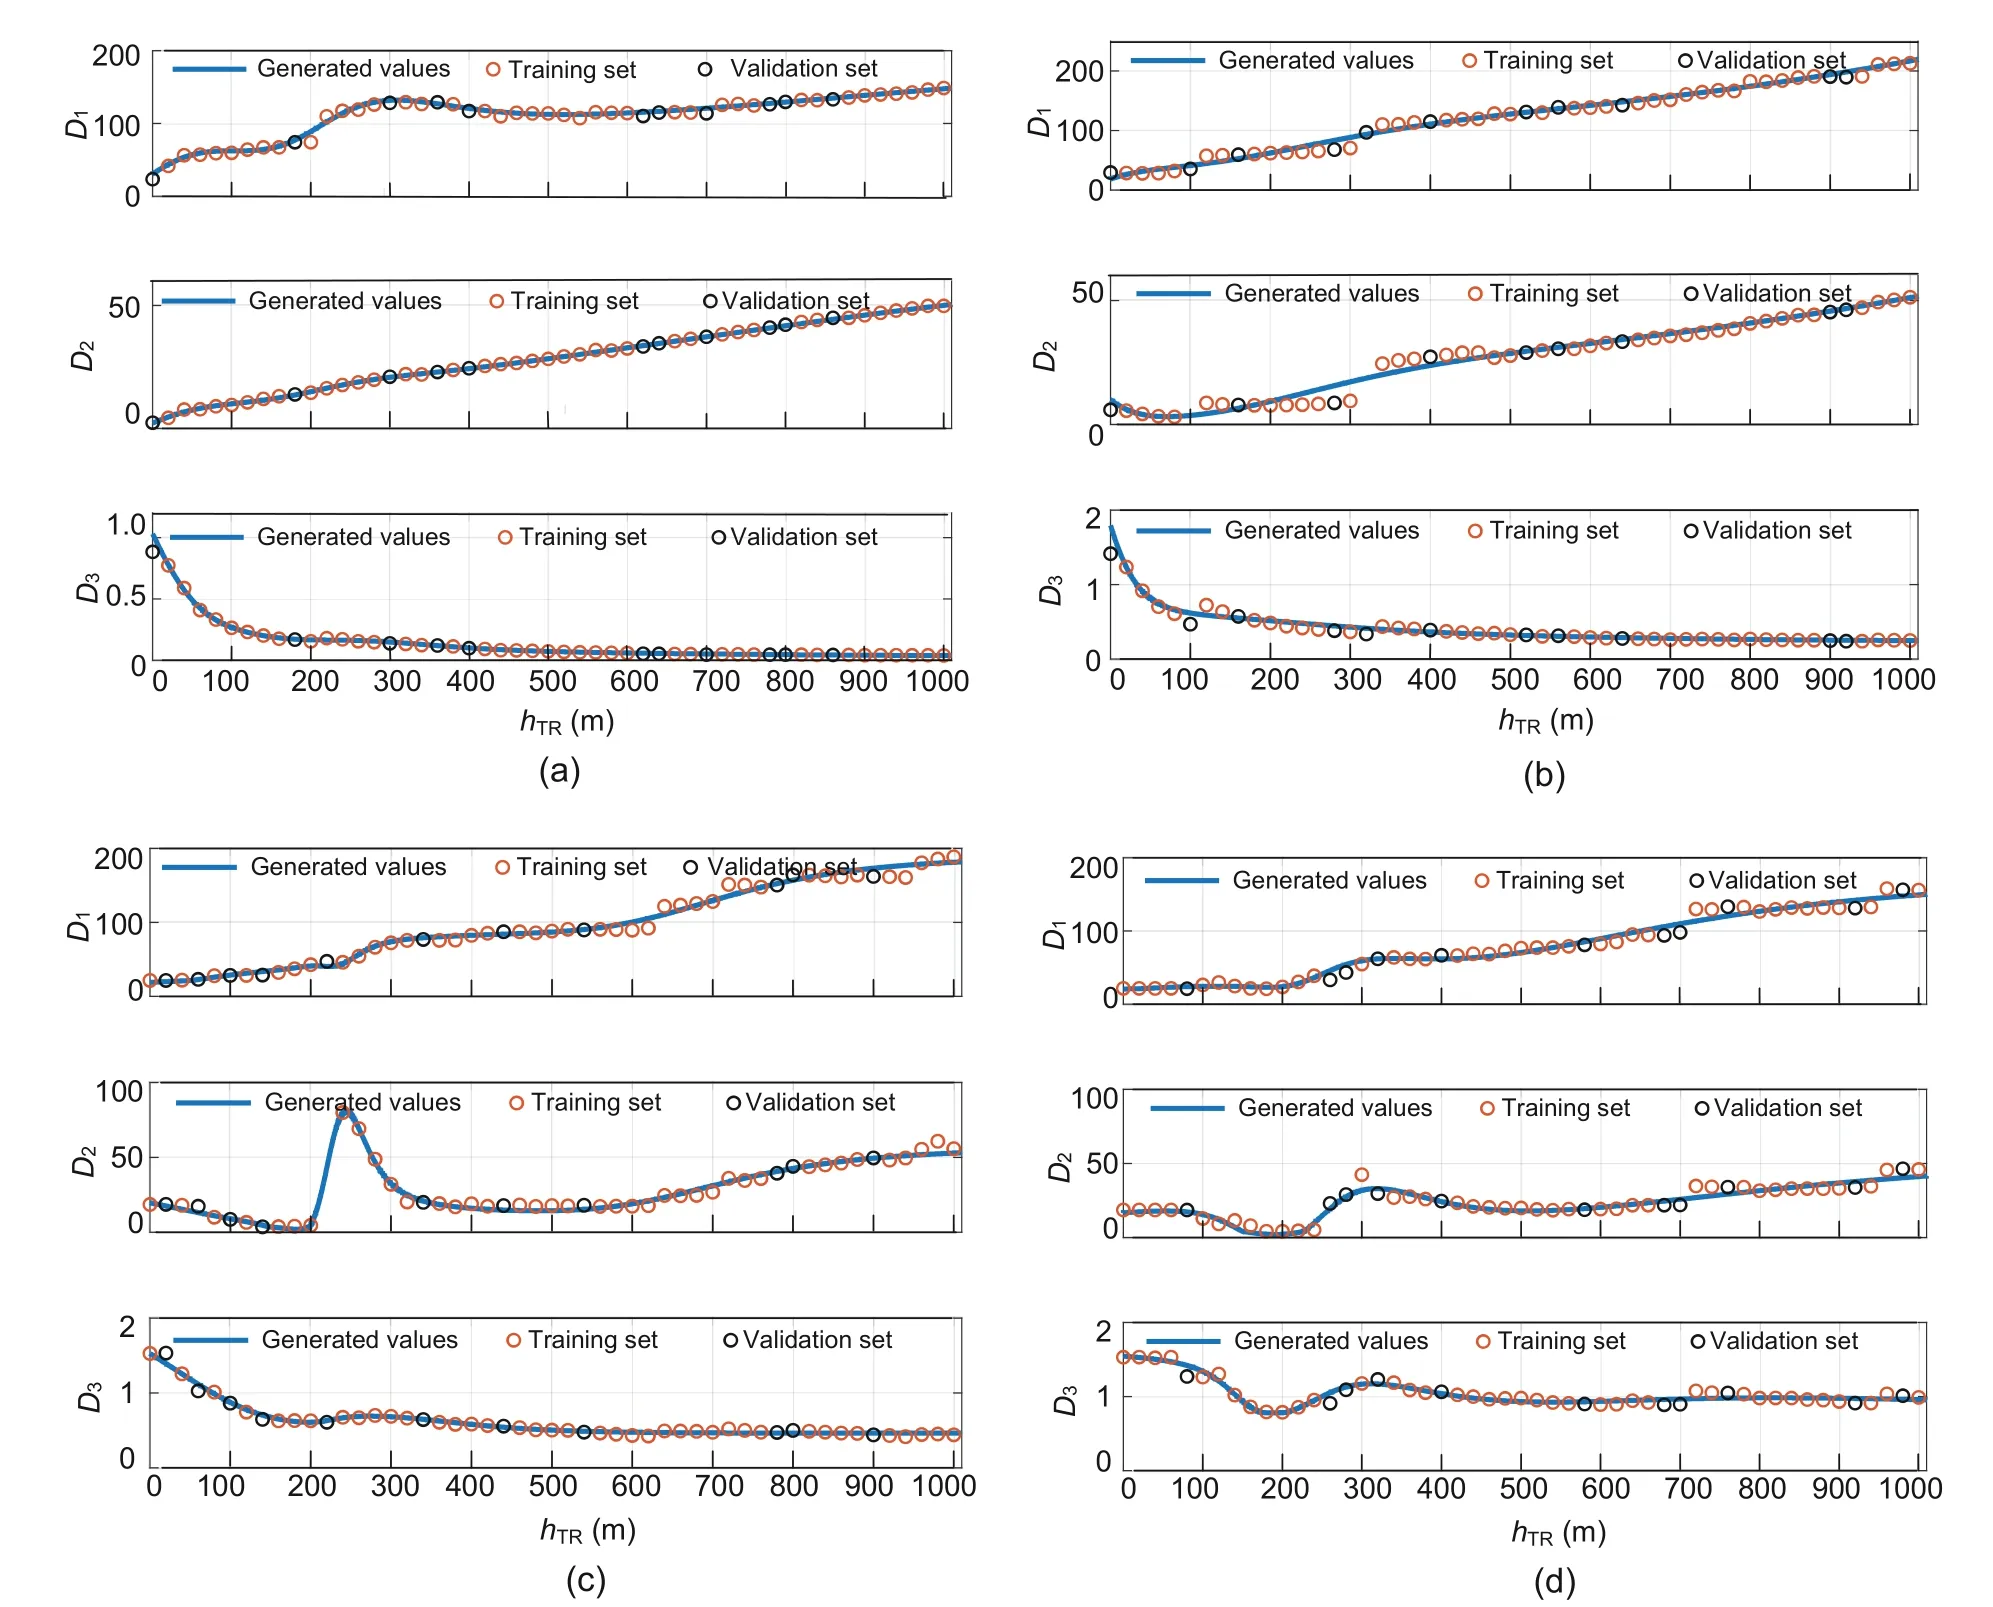
Fig.8 Training results for height-dependent parameters under different scenaries: (a) suburban;(b) urban;(c) dense urban;(d) high-rise urban
We also use other ML methods for parameter estimation,and the mean square errors (MSEs) of altitude-dependent parameters in the prediction set and validation set are used to evaluate the training performance.Fig.9 shows the MSEs of DT,BPNN,support vector regression(SVR),and Gaussian process regression (GPR).Among them,DT and BPNN have good performance on parameter estimation.For the DT method,the MSEs under the high-rise urban and suburban scenarios are larger than those under other scenarios,showing poor robustness in our application.The BPNN method achieves low MSE under each scenario and shows good robustness.For the SVR and GPR algorithms,due to the complex network parameters,it is diffi-cult to achieve a good fitting state in a short period of time.When the DT method is used for regression,only one factor can be considered at each node,and the contribution of each element cannot be balanced according to the weight of multiple elements.Considering performance and robustness,we choose the BPNN method to estimate the model parameters in this study.Note that it is convenient for BPNN to further modify the network parameters with new data sets from measurement and simulation.
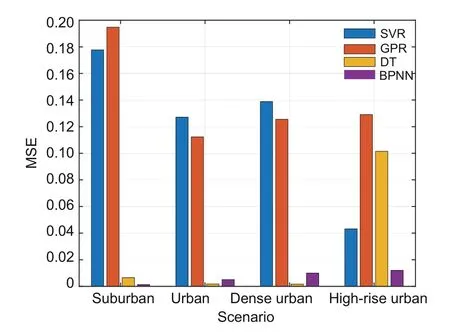
Fig.9 Comparison of other ML methods for parameter estimation
4.3 Prediction results and analysis
Different scenarios and UAV height factors have a great influence on the LoS probability.Fig.10 shows the LoS probability when the UAV altitudes range from 0 to 1000 m and the communication distance is 150 m.It can be seen that the LoS probability varies greatly at a certain height under different scenarios.The LoS probability decreases as the density of urban buildings increases,which conforms to the objective laws.
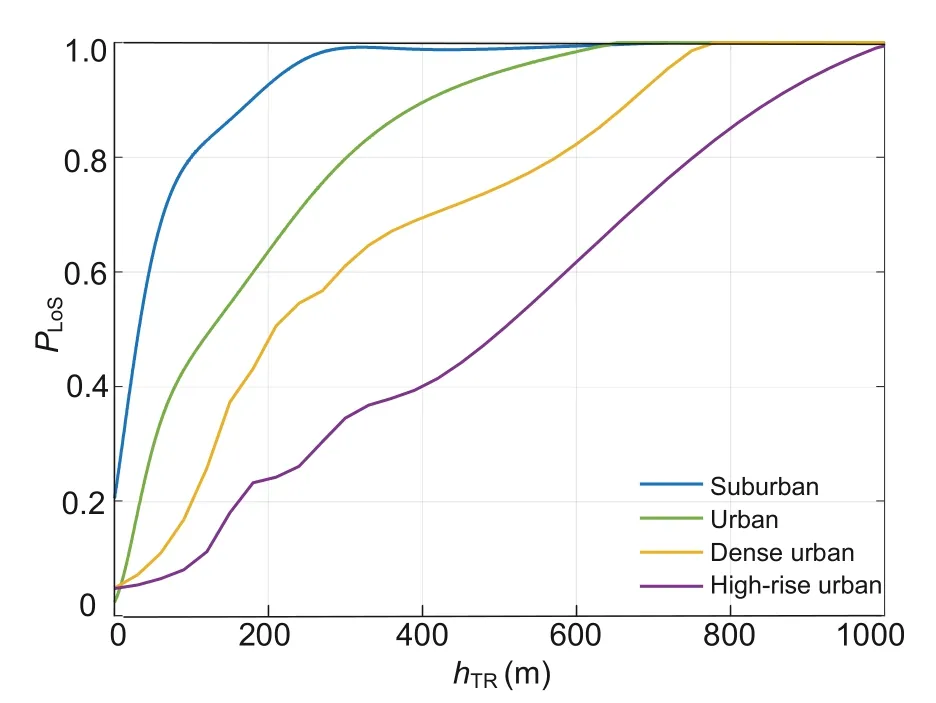
Fig.10 LoS probability vs.height in different scenarios (References to color refer to the online version of this figure)
To demonstrate the accuracy of the proposed LoS probability model,we take the urban scenario as an example,and compare the results obtained using our proposed ML-based empirical model(3)with those obtained using representative models,the RT simulation data,and the measurement data.For the low-altitude cases (Fig.11a),we set the communication height as 40 m.We can see that the performances of the proposed model and the RT simulation data are very similar to those of other representative standard models (Samimi et al.,2015;3GPP,2016a,2016b).The prediction results of our model also agree with the measurement data in Sun et al.(2015).Moreover,when the communication altitude is high,the standard models are no longer suitable for LoS probability prediction.As shown in Fig.11b,the standard models deviate and cannot describe the real situation at the altitude of 600 m.Our proposed model is in agreement with the analytical model in Al-Hourani (2020).Moreover,the RT data agrees with the prediction results.Our model can achieve good prediction at both low and high altitudes.
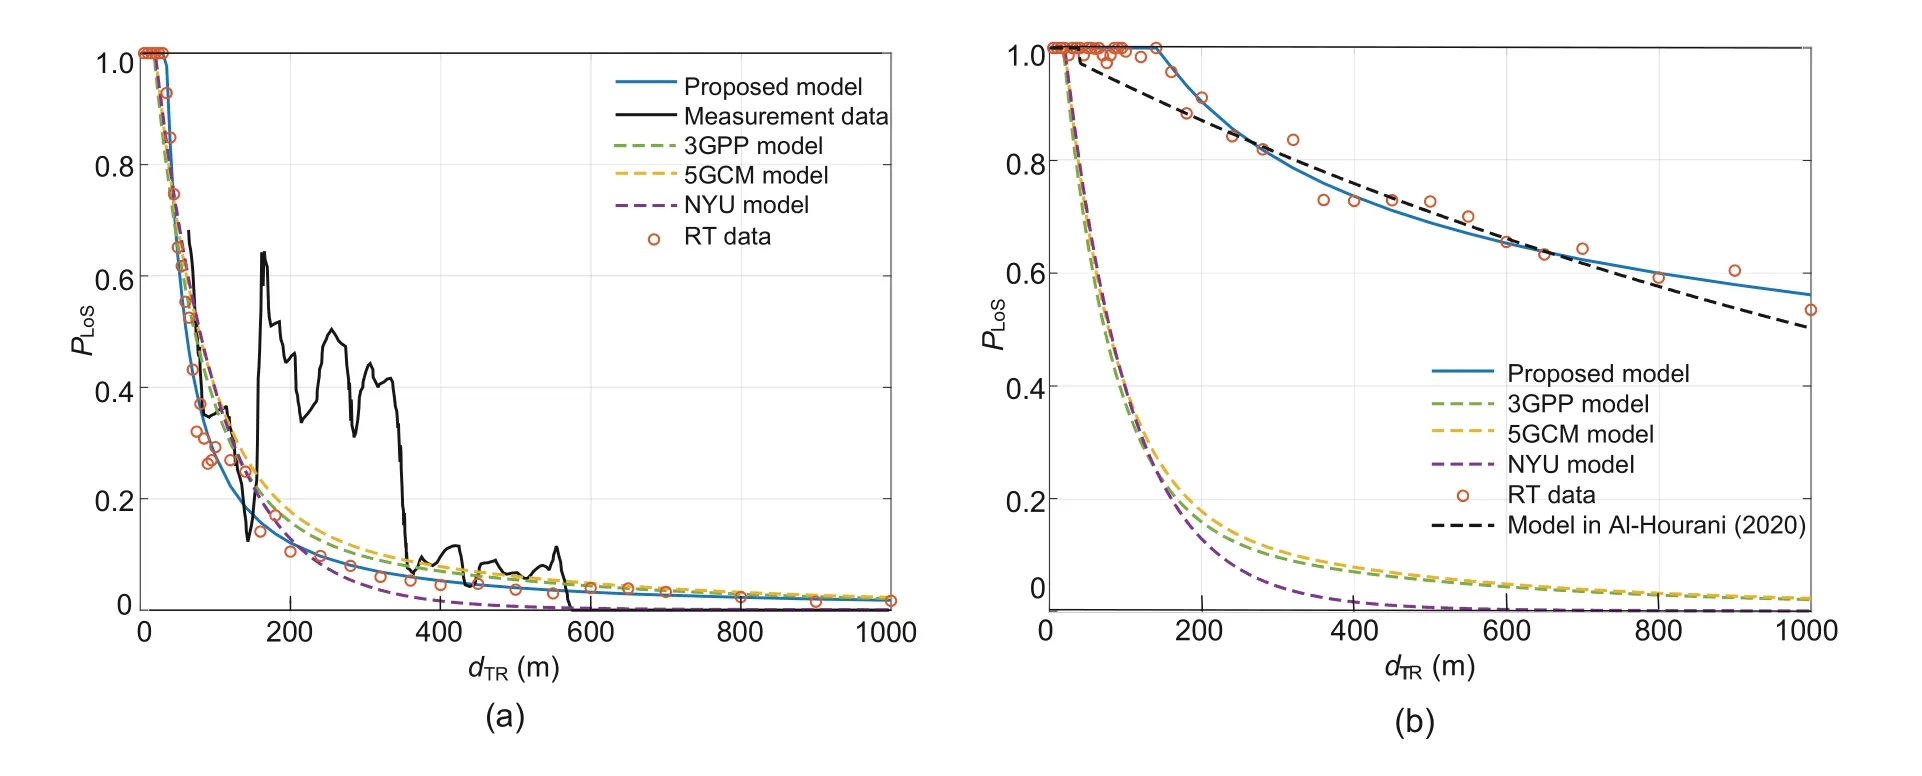
Fig.11 Comparisons of different models at different altitudes: (a) low altitude(hTX=40 m);(b) high altitude(hTX=600 m)
5 Conclusions
In this paper,we have proposed the altitudedependent empirical LoS probability model based on ML for A2G scenarios.First,we have applied the KNN to classify the LoS and NLoS paths according to the RT simulation data with the recognition accuracy rate as high as 0.995.Then,to introduce the factor of height to the LoS probability,we have developed a two-layer BPNN to estimate the parameters of the proposed LoS probability model,which has better performance than other regression algorithms.Simulation results have demonstrated that the prediction results of our proposed LoS probability model can achieve good versatility at both low and high altitudes and have good agreement with RT simulation and measurement data.In future work,we will improve the accuracy of LoS probability prediction by more measurement data and expand the model to various scenarios.
Contributors
Minghui PANG and Qiuming ZHU designed the research.Zhipeng LIN and Fei BAI processed the data.Minghui PANG drafted the paper.Qiuming ZHU and Zhipeng LIN helped organize the paper.Yue TIAN helped train the data.Zhuo LI and Xiaomin CHEN revised and finalized the paper.
Compliance with ethics guidelines
Minghui PANG,Qiuming ZHU,Zhipeng LIN,Fei BAI,Yue TIAN,Zhuo LI,and Xiaomin CHEN declare that they have no conflict of interest.
List of supplementary materials
Table S1 Trained parameters of the suburban scenario
Table S2 Trained parameters of the urban scenario
Table S3 Trained parameters of the dense urban scenario
Table S4 Trained parameters of the high-rise urban scenario
 Frontiers of Information Technology & Electronic Engineering2022年9期
- Frontiers of Information Technology & Electronic Engineering的其它文章
- On visual understanding
- Phase synchronization and energy balance between neurons*
- Competitive binary multi-objective grey wolf optimizer for fast compact antenna topology optimization*#
- Certificateless broadcast multi-signature for network coding*
- A power resource dispatching framework with a privacy protection function in the Power Internet of Things*
- A novel grey wolf optimizer and its applications in 5G frequency selection surface design*#
