Design and Implementation of a Network Performance Analysis System for Space Network Emulation Platforms
Dongxu Hou,Fa Chen,Chengpeng Kuang,Yuhang Du,Qi Zhang,Kanglian Zhao,Wenfeng Li,Sidan Du,Yuan Fang
School of Electronic Science and Engineering,Nanjing University,Jiangsu 210023,China
Abstract: Emulation platforms are critical for evaluation and verification in the research of networking technologies and protocols for space networks (SN).High fidelity emulating technologies have been extensively studied for SN in earlier work, while little emphasis has been placed on the performance evaluation part.In this paper, the design of a network performance analysis architecture is presented, with which high-speed network traffic can be captured and indexed,and the performance of the emulated SN can be well analyzed and evaluated.This architecture comprises three components, namely capture layer, storage layer and analysis layer.Analytic Hierarchy Process(AHP)and several analysis methods are adopted to evaluate the network performance comprehensively.In the implementation of the proposed architecture,configuration optimization and parallel processing are applied to handle large amount of high-speed network traffic.Finally, experiment results through the analysis system exhibits the effectiveness of the proposed architecture.
Keywords:space networks;emulation platforms;network performance analysis
I.INTRODUCTION
Space networks(SN)are emerging as important parts of national infrastructure construction and global research frontier.However, network features of SN deviate significantly from that of terrestrial networks.The terrestrial network technologies cannot work effectively when directly employed in SN.To overcome this problem, network researchers propose various new network protocols and technologies.Meanwhile, the process of designing and developing network protocols and technologies is complex,in which experiment phase plays an important role to decipher the performance and make helpful suggestions for improvement.
Network emulation is a popular method that can carry out reliable research on basic theory and key technologies without considerable economic costs[1].Compared with the general network emulation, the space network emulation uses static hardware devices to perform a complicated task that requires systematic designs for emulating the features (especially, timevarying link quality and dynamic link connection) of dynamic space network.Previously, we have constructed a laboratory scale SN emulation platform[2],which adopts hierarchical structure, suggesting that each functional layer is isolated from each other, realizes dynamic communication environment and supports arbitrary network topologies.The platform implements various network protocols as real deployments,and generates real data flow.
But inadequate emphasis has been placed on the performance evaluation of protocols and technologies in specific network scenarios tested on the platform.Due to changeable emulation scenarios and diverse network protocols supported by the SN emulation platform, network measurement points cannot be fixed and analysis methods of different protocols cannot be unified.Therefore, general measurement and analysis methods are unfitted.To solve this issue, the key and difficult points of this paper are to develop a network analysis architecture and construct a corresponding system to perfect the function of network measurement and evaluation on the SN emulation platform.When designing the analysis architecture,we focus on the following four goals:
· to support link measurement and full packet capture.According to different target networks and researcher’s concerns, the network measurement can be configured flexibly.
· to separate each function plane, that is, when adopting full packet capture,data exchanging can work without influence on the platform.
· to possess the capability of further analysis of captured data and present metrics for relevant network performance.
· to establish a network evaluation index system and propose a performance evaluation method on the basis of network performance metrics.
To meet our goals, emulation nodes are adopted as measurement points to support flexible and configurable network measurement.Combined with virtualization technology,big data analysis,Analytic Hierarchy Process (AHP) [3] and parallel processing, the analysis architecture provides data process and network performance analysis for large-amount of highspeed network traffic in various scenarios.
In summary,this paper makes four contributions:
· We present a network analysis architecture and build an analysis system for proposed platform to evaluate the network performance of different emulation scenarios.
· On the basis of captured network traffic,analysis methods are described for various network metrics through big data technologies.
· Combining with AHP, a comprehensive evaluation method for the whole emulation network performance is presented.
· Configuration optimization and parallel processing are studied to improve the performance of the analysis system.
The structure of the paper is presented as follows.Section II provides an overview of our previous works and related studies.Section III and Section IV provide the architecture of network performance analysis system as well as the network analysis and evaluation method, respectively.In Section V, factors which affect the performance of analysis system are explored and parallel processing is used for optimizing the performance.Section VI presents the experiment and discussion.The last section concludes this paper and identifies future research directions.
II.RELATED WORK
2.1 Overview of Previous Work
In previous work, a SN emulation platform has been constructed.This platform supports the emulation of target network with hundreds of nodes.The accuracy of the emulation system has been validated in [2].It has following characteristics:
· The networking of platform can change automatically like that of a real-world space communication environment.
· Emulation nodes have the same functionality as physical hardware and can execute exactly the same code in a real deployment.
· The architecture of platform has extendibility including the horizontal expansion of hardware resources and the access of external physical emulation devices.
· Various network experiments can be flexibly deployed on the platform.The platform consists of three planes: logical plane,control plane,and data plane,as outlined in Figure 1.
A particular network scenario, including specific network topology, network protocols of each layer,traffic generating configuration and etc., is set on demand at logical plane.The configuration parameters are stored in database.Control plane,with a main controller, reads information and parameters of network scenarios set by logical plane,then produces command and flow tables to drive the emulations in data plane.
Data plane is constructed by switches, servers and emulation devices.It provides basic emulation elements for the platform, including emulation nodes,links and services.Emulation nodes(container-based virtual nodes and physical nodes) are actual carrier of various new network protocols or communication technologies.Based on the network scenario,emulation nodes are created and connected to SDN switches.Emulation nodes read configuration parameters in database and perform self-configuration before the experiment starts.Dynamic link connection between nodes is realized by deploying flow tables to SDN switches, while time-varying link quality is achieved by traffic control mechanism in Linux.
Predominated in emulation nodes and focusing on the network layer and above layers, container-based virtual nodes are to support large-scale emulation scenarios with reasonable economic costs.Depending on the experimental requirement, physical nodes, as key hosts and real physical channels,can also be accessed to provide the emulation of all layers.
2.2 Network Measurement and Analysis
Network measurement and analysis has long been used to characterize network usage,user behaviors and network performance.The typical methods of network measurement cover two types, active measurement and passive measurement.Active measurement monitors the change of networks by sending test packets from the measurement points and observing the response of networks, e.g.Ping [4] and traceroute [5].Passive measurement monitors traffic without injecting new traffic or affecting the existing one, and provides a detailed set of information about the specific point in the network,e.g.port mirroring[6].But these typical measurement methods can only monitor a certain aspect of network and are deficient in analyzing the measurement results.
With the popularity of big data analysis framework,various new measurement manners are proposed to settle this matter.Gupta[7]uses Spark to analyze the network data stream in real time.But it is unable to obtain details of network packets besides IP address and service ports for analyzing.In[8],an online Internet traffic monitoring system based on Spark Streaming is proposed and the TCP performance monitoring is considered relied on this system.Lee [9] presents a Hadoop-based traffic monitoring system which performs TCP, HTTP and NetFlow analysis of multiterabytes of traffic.But these options are inflexible because researchers have to convert the raw data format of packet trace files before subsequent analysis.
Moreover, with the extensive use of SDN in recent years,diverse SDN-based measurement methodsare also presented.Huang [10] has built a SketchVisor prototype on top of Open vSwitch (OVS).It is a sketch-based measurement in the data plane with a fast path and provides high-performance local measurement with high traffic load.[11] designs FlowRadar,a new way to maintain flows and their counters that extends to a large number of flows with small memory and bandwidth overhead.[12] presents a system,named Software Defined Network Measurement System(SDNMS),to facilitate design,evaluate and manage of Network Functions Virtualization (NFV) networks.These methods in fact take SDN switch as the measurement entity and are implemented on SDN switch which increases the traffic load of SDN switch.SDN switch is the key element to realize dynamic topology and serves for data exchange on the proposed platform, therefore, these measurement methods significantly influence the performance of platform.
Furthermore, in the proposed platform, different emulation scenarios have different network topologies and the network topology may also change dynamically at different times in the same scenario.Abovementioned methods which adopt traffic collector with fixed positions to conduct network monitoring in static networks,cannot work effectively.
III.ARCHITECTURE OF NETWORK PERFORMANCE ANALYSIS SYSTEM
On the basis of the proposed platform, the network performance analysis system is constructed.As illustrated in middle and right part of Figure 1, this system comprises three components, namely capture layer, storage layer and analysis layer.Related softwares are listed in Table 1.
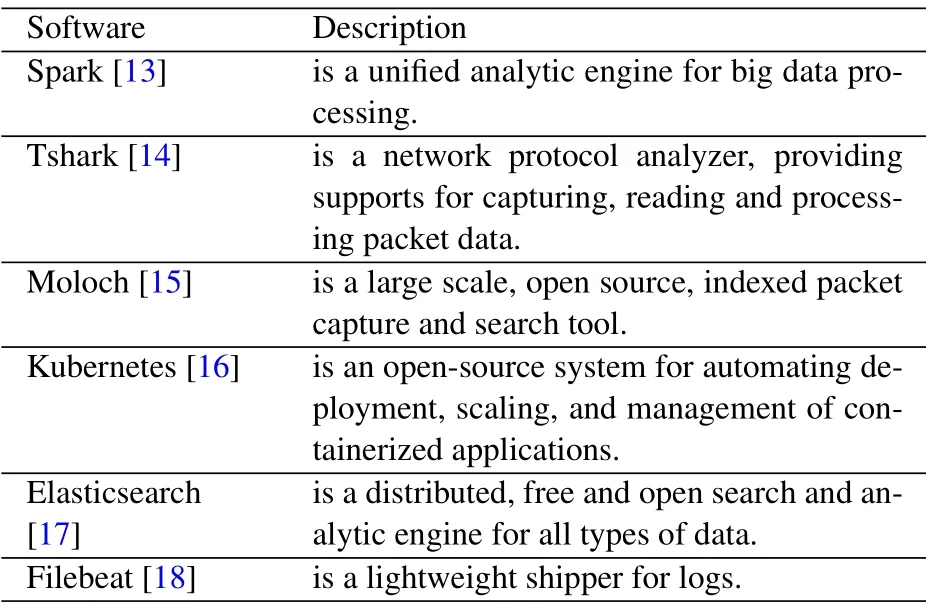
Table 1.Related softwares list.
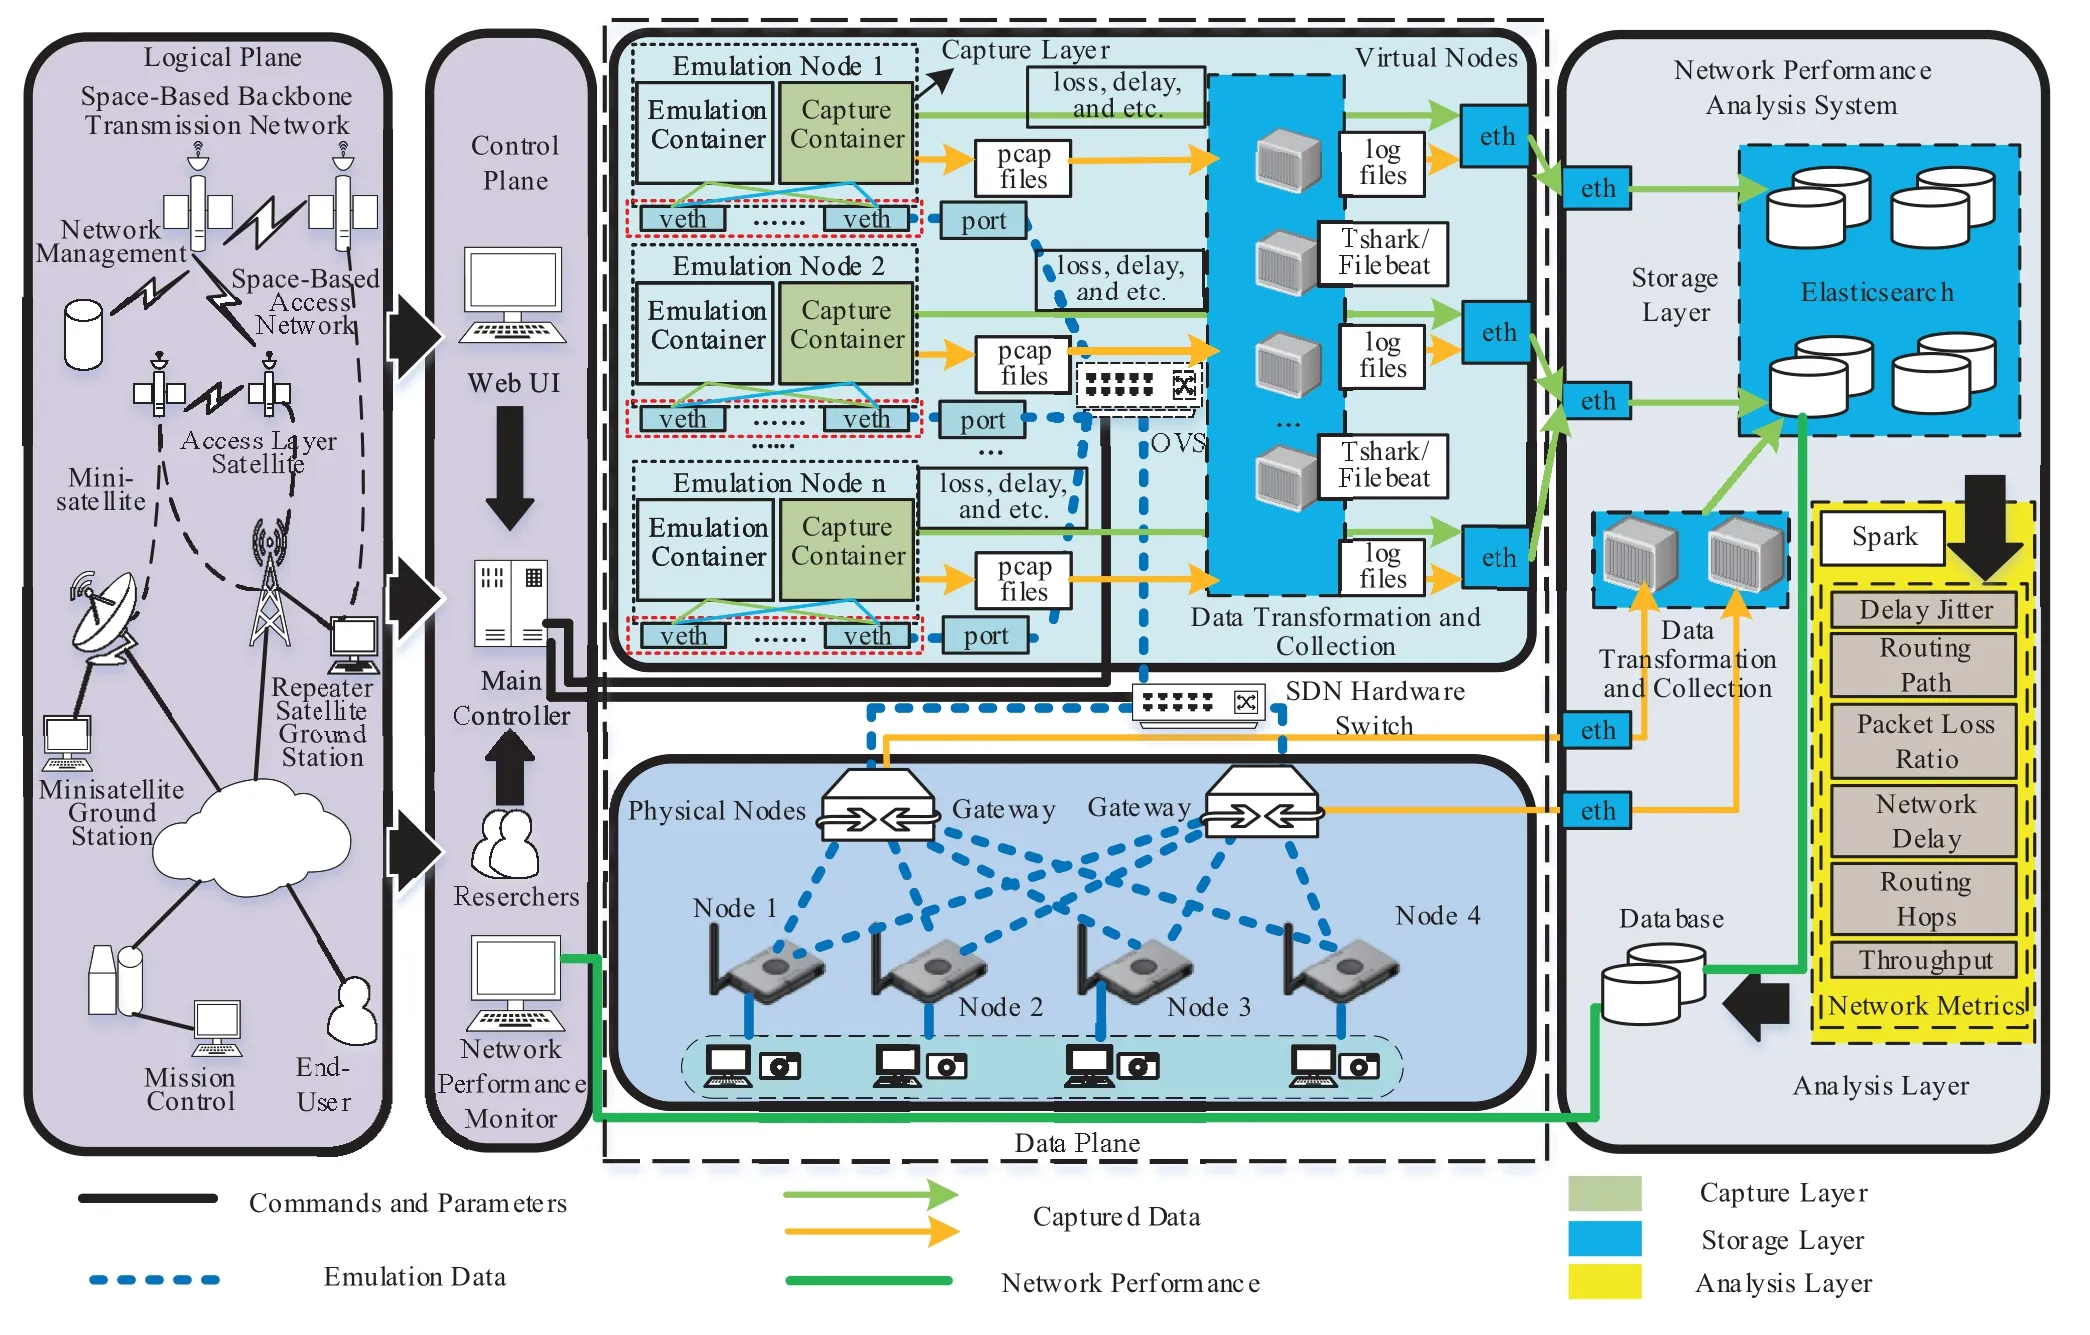
Figure 1.Architecture of emulation platform integrated with network performance analysis system.
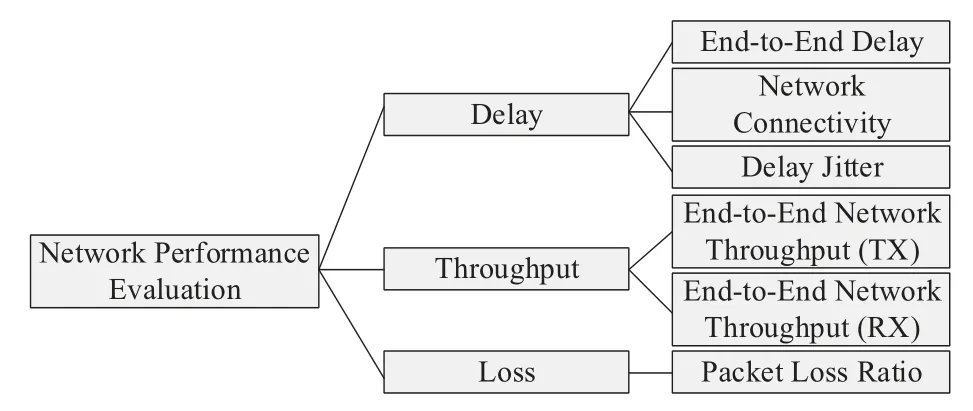
Figure 2.Selection of network performance metrics.
3.1 Capture Layer
The capture layer has two functions, i.e.link information collection and full packet capture, which are realized at each emulation node.Since the dynamic implementation on the proposed platform is only related to the connection and link quality between emulation nodes, integrating network measurement with emulation nodes can effectively ensure the flexibility of network measurement.
Virtual nodes are arranged in the form of Pods which are the fundamental deployable units that can be created and managed backed by container management application,e.g.Kubernetes.A virtual node covers two containers, emulation container and capture container, with shared network resources.The capture container covers a Python-based daemon which realizes real-time network information collection, including end-to-end packet loss ratio,end-to-end delay,port throughput, and etc.Moreover, the capture container also supports full packet capture.Because containers in the same Pod share network resources with each other,network traffic,processed by the emulation container,is visible for the capture container.Based on this feature, network traffic is captured without influencing the performance of emulation platform.Considering handling Gbps-level traffic, multi-threadingbased capture software is used to monitor a certain port at each capture container,e.g.Moloch.Captured traffic is saved in pcap format and awaits the storage layer for subsequent processing.
Physical nodes do not have the same features as virtual nodes,the functions of network measurement and node emulation are all undertaken by physical nodes.The network measurement method on physical nodes is similar to that on virtual nodes for the network layer and above layers.For the physical layer,special measuring instruments are needed to monitor corresponding network metrics,e.g.the signal measuring instrument.As long as these metrics are measured,they can be processed and analyzed in the same way as follows.
3.2 Storage Layer
The storage layer, getting data from the capture layer and providing data source for the analysis layer,can be divided into two parts,i.e.data transformation,collection and storage.The network information collected in real time is directly stored by the storage layer.Captured traffic cannot be directly used and not all the information stored in pcap files is useful for further resolution in the analysis layer.So,depending on analysis requirements of researchers,critical information fields of each packet are extracted from original captured traffic and transformed into json format files first.This service can be backed by a libpcap-based[19]application,e.g.Tshark.Then Filebeat forwards transformed files into a non-relational indexing database which is beneficial for data analysis,e.g.Elasticsearch.
3.3 Analysis Layer
The analysis layer consists of a cluster of Spark and provides the ability of network performance analysis.The packet records in transformed files,storing at the storage layer,are queried by the analysis layer according to different information fields of packet, such as ACK in Transmission Control Protocol (TCP), Hello in Open Shortest Path First protocol (OSPF), IPN in Bundle Protocol (BP) and etc.Then, through Spark APIs and corresponding analysis methods, the network performance metrics are obtained.Some useful transformation APIs are listed in Table 2.
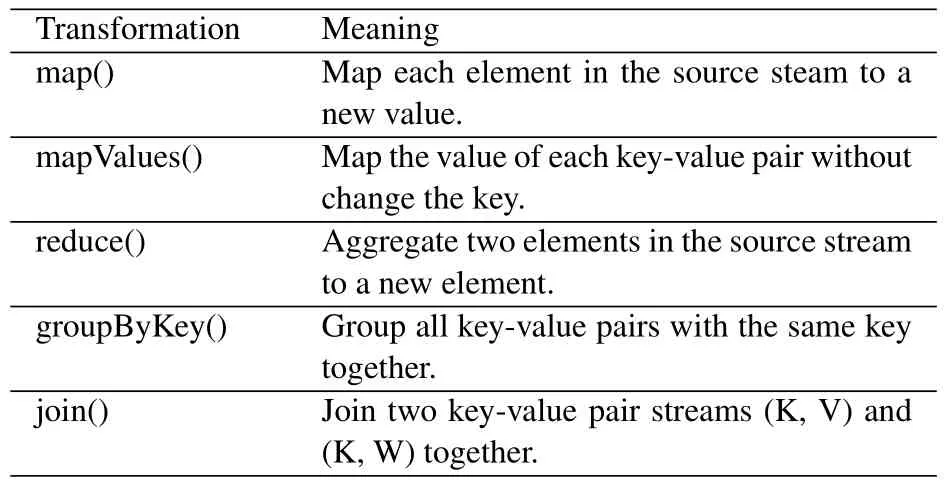
Table 2.Various useful transformation Spark APIs.
IV.ANALYSIS METHODS
Based on the analysis system, we could analyze network metrics and evaluate corresponding network performance after emulation.In this case, we focus on TCP/IP,and take the analysis methods of network delay, throughput, packet loss rate and routing hops in the proposed analysis system as examples.The other protocols can be dealt in a similar way.Capture containers are set to capture all packets exchanged among emulation nodes.And then each packet is transformed and recorded as an event log.This log covers following important information fields, including timestamp,source MAC address,destination MAC address,source IP address,destination IP address,packet length, network protocol type, IP identification, TCP sequence number and etc.
4.1 Preprocessing
All emulation nodes are connected to SDN switches.The same packet can be forwarded on switches and captured several times by capture containers during the emulation period.Therefore,the identification approach for the same packet which is transferred from source node to destination node is the primary issue which must be taken into consideration before calculating the network metrics.
We use the tuple of [source MAC address, source IP address,destination IP address]as a key to identify the packets sent by source node and[destination MAC address, source IP address, destination IP address]to distinguish the received packets at destination node,then IP identification and TCP sequence number guarantees the unique identification of packets sent from source node to destination node.
4.2 Network Metrics Analysis
4.2.1 Network Delay Calculation
To calculate the one-way network delay of a certain end-to-end link,we use[source MAC address,source IP address, destination IP address, IP identification,TCP sequence number]as keys to query stored packet records, then we get two packet records of the same packet which is written down at the source and destination separately.The network delay of this end-toend link is defined as the difference of timestamp between these two records.
4.2.2 Throughput Calculation
To calculate the end-to-end link throughput,we use the tuple of[destination MAC address,source IP address,destination IP address,timestamp]as a key to map the records of packets which are received at destination from timet1to timet2and the value of timestamp is betweent1andt2.Then,the mapped records are transformed in a Spark RDD and we use reduce()transformation API to sum up the values of packet length field of these mapped results,namedmwhich unit is byte.Finally, we can get the throughput which should satisfy the equation:B=m/(t2-t1).
4.2.3 Packet Loss Ratio Statistics
To calculate the end-to-end link packet loss rate, the tuple of [source MAC address, source IP address,destination IP address, timestamp, network protocol type]as a key is used to map all the records of packets which are sent from source to destination.The mapped records are transformed in a Spark RDD and the number of these records, namedx, are measured by reduce() transformation API.Then, source MAC address is replaced by destination MAC address in the tuple and the same process is implemented to calculate the number of packet records which are received at destination,namedy.We query the records of packets sent at source from timet1to timet2, the period of time which are queried at destination should be from timet1+Tto timet2+Taccordingly.Tis defined as network delay of this end-to-end link and the packet loss rate can be calculated by the equation:Rloss=(x-y)/x.
4.2.4 Routing Hops Calculation
To calculate the routing hops, we first map all packet records of the same packet transforming from end to end during a period time by the key,including source IP address, destination IP address, IP identification and TCP sequence number.All the outbound packets are captured by capture containers, so the number of packet records equal to the routing hops.Then,reduce() is used to count the number of recordsnand the routing hops equal ton.
According to these basic network metrics which are mentioned above, we can obtain more information about the network performance, such as routing convergence time,link expiration time,end-to-end transfer routes and so on.
4.3 Network Performance Evaluation Index System
As network scenarios emulated on the platform are specific,the key network links and nodes concerned by researchers in emulated networks are clear.Via measuring or analyzing the network traffic of the key links and nodes, corresponding network metrics which reflect network performance can be obtained.However,these metrics only describe one aspect of network performance respectively and there is no comparison between them.For evaluating the comprehensive performance of emulated networks, AHP is adopted and network metrics are regarded as its decision criteria.
When selecting metrics,following aspects should be considered.
· Representativeness: The chosen metrics should show the network performance effectively.
· Measurability: The selected metrics should be easy to measure.
· Relativity: The relativity between the selected metrics should be as low as possible.
So we discuss the comprehensive performance of emulated networks from three aspects: delay, loss and throughput.According to the need of researchers,we can further clarify different performance metrics on the basis of these three aspects presented in Figure 2.
Due to different dimensions of different metrics and the diversity of their values,processing and comparing these metrics directly has no practical meaning.Normalization,following Eq.(1),is first adopted to make performance metrics dimensionless.

Then, individual experts’ experiences are utilized to estimate the weight of different metrics through pairwise comparisons and each metric is summed by multiplying its corresponding weight via Eq.(2).
The Fairy, however, left him there, promising86 to do her very best for him, and commanding all her swallows and butterflies to wait upon him and do his bidding

By this way, the performance of target networks could be described by a comprehensive index.As for the suggestion towards developing satellite communication networks, based on this index, the system can validate the performance of different network protocols under the same network scenario,evaluate the effect of different satellite link establishment strategies when other conditions are the same,and so on.
V.PERFORMANCE OF ANALYSIS SYSTEM
The analysis system should provide not only reliable data capture,but also efficient data processing.In this section, corresponding experiments are conducted to validate abilities.Parallel processing is implemented to improve the performance of analysis system.
5.1 Validation of Reliable Data Capture
Following the deployment step, mentioned in section IV, a test scenario is built on the emulation platform.As shown in Figure 3, this scenario contains 6 GEO satellites which are uniformly distributed in geostationary orbit, and each GEO satellite covers 2 LEO satellites.The orbit parameters of 12 LEO satellites are listed in Table 3.Different RAANs represent different satellite orbits, while distinct true anomalies refers to different initial position of satellites in the same orbit.GEO satellites constitute a backbone link which provides communication links for LEO satellites.The maximum port bandwidth of GEO satellite is set as 1Gbps.
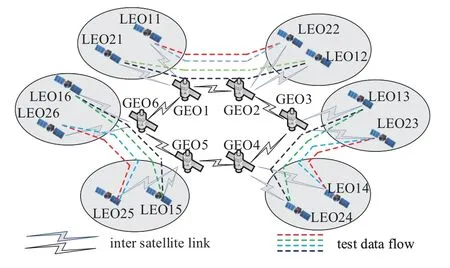
Figure 3.Experimental scenario.
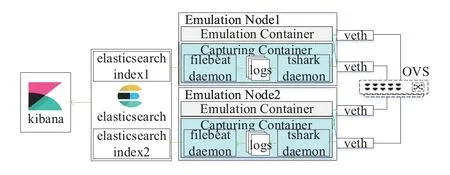
Figure 4.Topology of test experiment.
The main characteristic of measurement is the maximum of capture bandwidth to verify the data capture ability of the capture container.The capture container is configured to monitor the access port of GEO1 for the increasing bidirectional traffic between LEO11 and LEO21.If the number of test data packets is no more than the amount of captured data packets, we deem the data capture is reliable.The experimental result, shown in Table 4, illustrates that the capture container supports bidirectional 1Gbps capture capability at least.
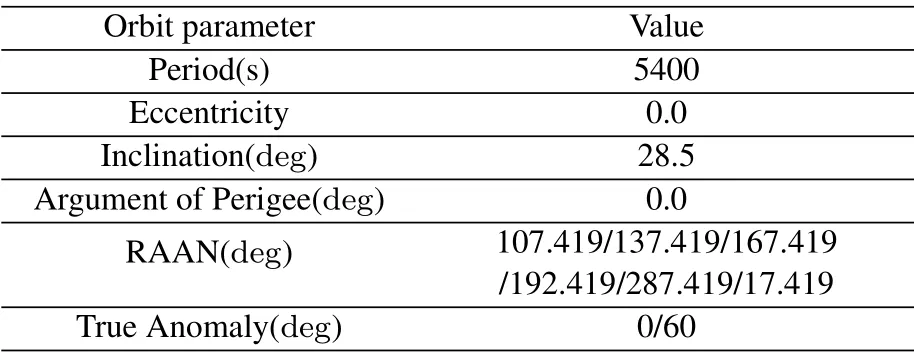
Table 3.LEO satellite parameters and corresponding values.

Table 4.Capture ability of single capture container.

Table 5.Capture ability of multiple capture containers.
Then, we expand the number of capture containers to monitor access ports of other GEO satellites via 2 to 6.Each access port has bidirectional 1Gbps traffic.As shown in Table 5, the total capture bandwidth can reach 6Gbps at least.The maximum of capture bandwidth is satisfied with the need of capturing all the packets among the emulation process.Furthermore,PF_RING could be implemented to attain a better performance.
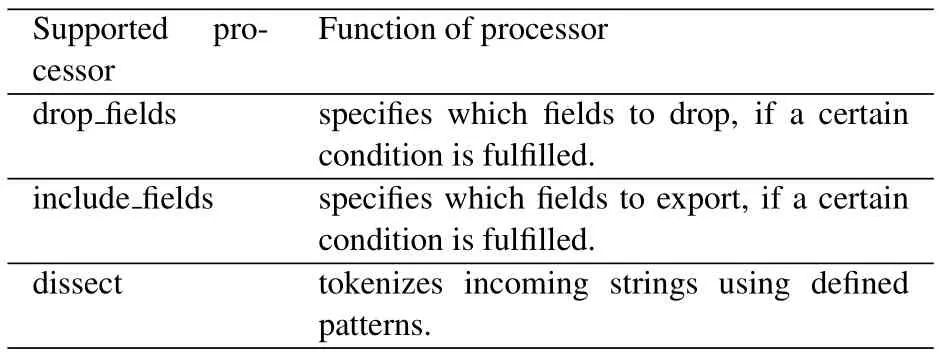
Table 6.Important processors in Filebeat.
5.2 Improving the Performance of Data Cleaning and Storage
Filebeat and Elasticsearch are the core elements for realizing the function of data cleaning and storage.The higher processing speed of Filebeat and Elasticsearch have,the higher efficiency the analysis system can achieve.Filebeat and Elasticsearch provide various of configuration parameters to improve their performance on the basis of users’need.But performance tuning is an iterative process without a certain formula.Therefore, comprehensive experiments are conducted to explore the optimal setting of Filebeat and Elasticsearch in our analysis system.
The experimental scenario is shown in Figure 4,we build two emulation nodes,named Node1 and Node2.Each emulation node has a network interface, connected to OVS, to ensure communicating with each other, and Node1 continuously sends UDP packets to Node2 at 1Gbps.Tshark and Filebeat are installed in the capture container previously which transforms captured data packets to log files depending on the user requirement and then forwards these to Elasticsearch.Elasticsearch receives log files and writes these to corresponding indexes for subsequent analysis.The performance of Elasticsearch and Filebeat, under different configurations,is taken into consideration.
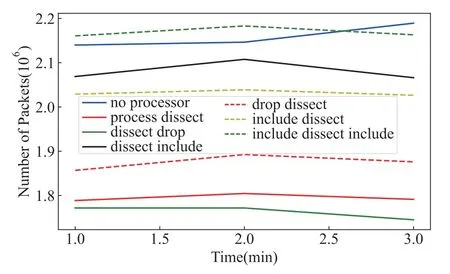
Figure 5.Performance of different combinations.
On the basis of user preference, Filebeat transforms captured data packets to log files which contain packet information,such as source IP and destination IP,and then write them to Elasticsearch as pieces of documents in appropriate indexes.However,there are two main problems which need to be solved:
· The packet information in each piece of logs is placed at the “message” field by default which makes subsequent analysis difficult.So the log data of each packet should be preprocessed first.
· Owing to the extra preprocessing, the forwarding throughput of Filebeat may be affected.So we should choose an appropriate data processing scheme which has the least impact on throughput performance.
Processors in FilebeatThe function of processor in Filebeat provides a couple of processors for filtering and enhancing exported data.The combinations of different processors can satisfy the various needs of data preprocessing.Several main types of processors are shown in Table 6.
As shown in Figure 5, different combinations of processors influence the forwarding throughput performance.Filebeat has the best performance, when the combination is deployed as include,dissect and include.Under this configuration,the processing speed of Filebeat keeps up with the transformation rate of Tshark,as presented in Figure 6.
Number of FilebeatsMultiple files can be monitored via a single Filebeat.Or each Filebeat is only responsible for a file when there are multiple files need to be read and written into several indexes in Elasticsearch.As shown in Figure 7, multiple Filebeats have better total forwarding speed than a single Filebeat when several files are required to process.
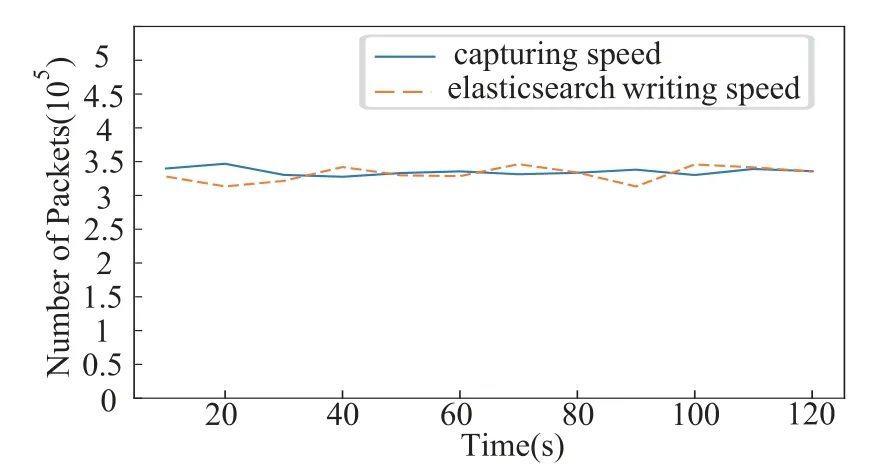
Figure 6.Capturing performance.
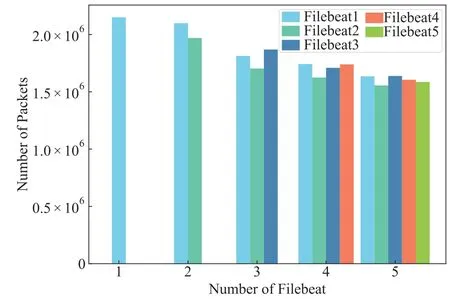
Figure 7.Number of Filebeats.
5.2.2 Tuning Elasticsearch Performance
Storage Path and Writing Method ConfigurationStorage paths used for storing data in Elasticsearch could locate at different physical disks, under which configuration, the data is written in parallel.The default configuration is a single storage path.The parameter of index.translog.durability represents the writing method which could be set as synchronization or asynchronization.Different configuration types of storage path and writing method are compared under previous experimental scenario.As shown in Figure 8, double storage paths has a better writing throughput.It should also be noted that asynchronization writing method has a better performance than synchronization mode.If a higher throughput is needed,the number of physical disks should be increased and more writing paths should be added to further improve the performance.
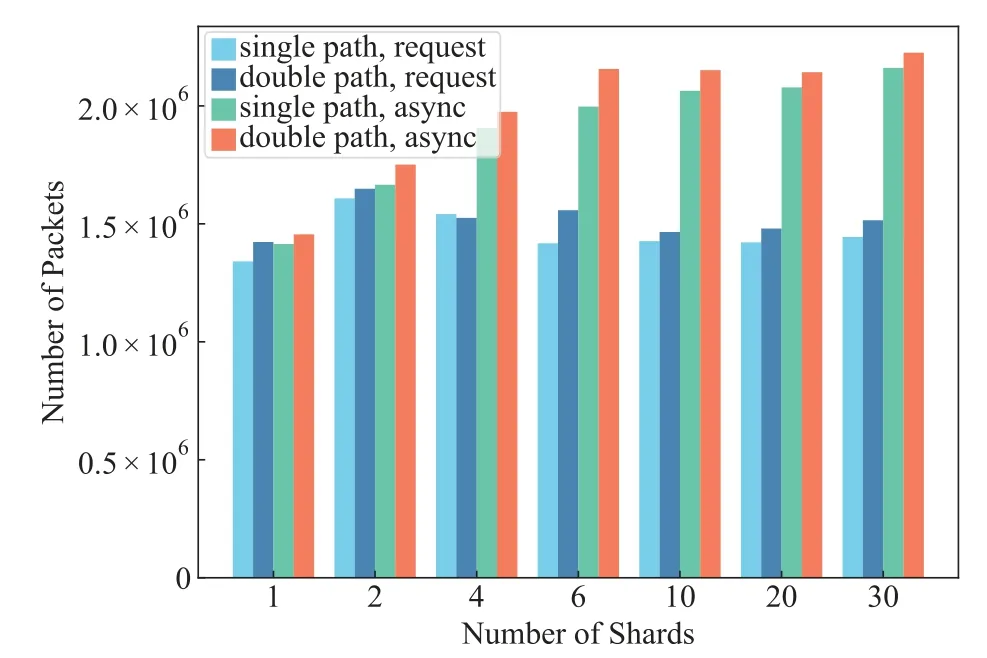
Figure 8.Storage paths, writing method and number of shards.
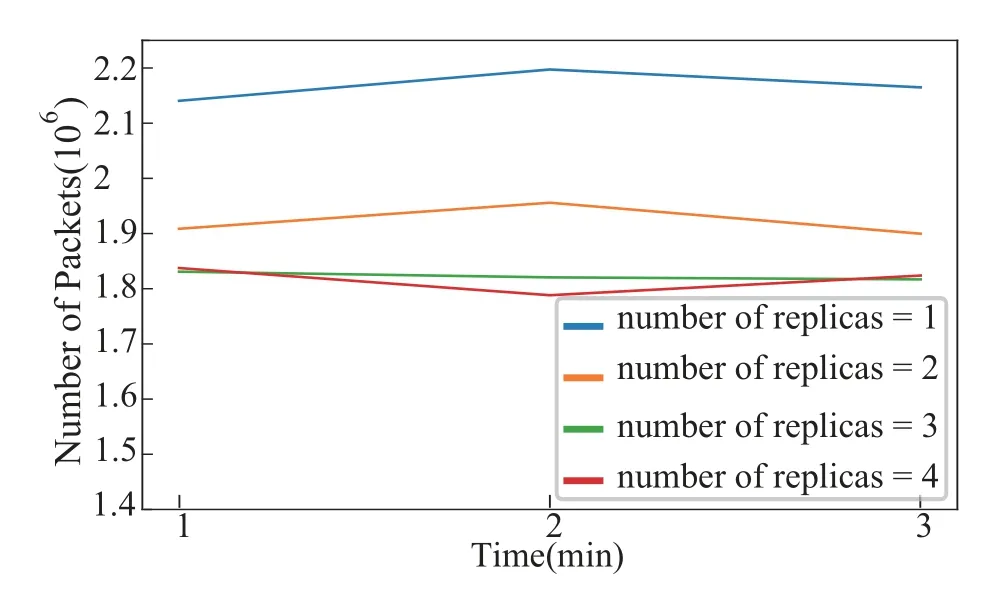
Figure 9.Number of replicas.
Number of ShardsIn Elasticsearch, a document is the basic unit of index.A Elasticsearch cluster could have several indexes,which are stored into shards.The parameter of index.number_of_shards in Elasticsearch represents the number of index main shard.Elasticsearch official documentation recommends to set this value according ton= 2×num_of_nodes+1.In our experiment, a Elasticsearch cluster has 4 nodes.So index.number_of_shards should be set as 9.However, when the number of main shards equals to 20,the maximum writing throughput of 4 nodes can be reached,as shown in Figure 9.
Number of ReplicasEach shard has multiple copies to support reliable data storage.These copies are known as replicas.When an index is created, the parameter of index.number_of_replicas is configured to define the number of replicas which are used for storing data copies.If the data can be stored reliably,this value could be set as 0.As shown in Figure 9,the best performance is achieved as index.number_of_replicas equals to 0.

Figure 10.Structure of serial processing.

Figure 11.Structure of parallel processing.
To summarize, the following parameters has a definite improvement on the writing throughput of Elasticsearch and the setting value is shown in Table 7.

Table 7.Parameters and corresponding values in Elasticsearch.

Table 8.Data compression during data transformation.
5.3 Parallel Processing of Data Cleaning and Storage
Figure 10 describes the serial processing structure of data cleaning and storage.The capture container captures and records packet data in a raw pcap file.Then Tshark is deployed to transform a raw file into a log file.With the increasing of raw files,the time used to transform makes the analysis system inefficiently.To solve this issue,we design a parallel processing structure which is shown in Figure 11.
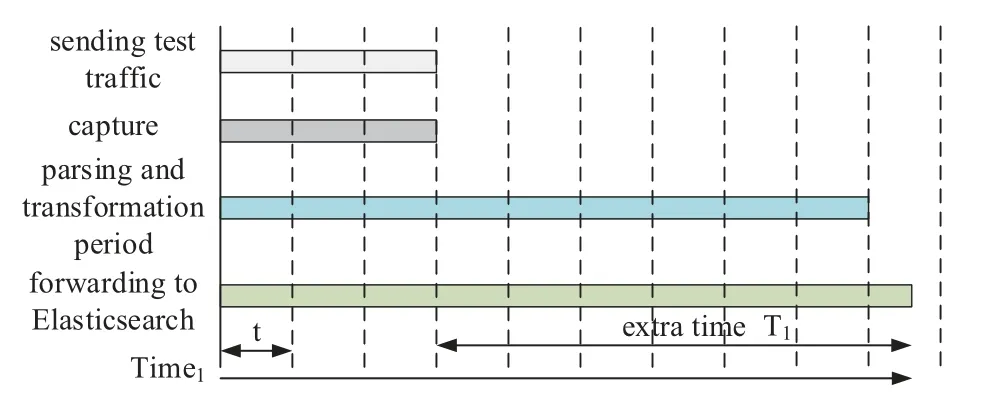
Figure 12.Serial processing.
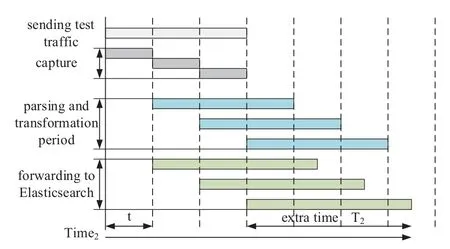
Figure 13.Parallel processing.
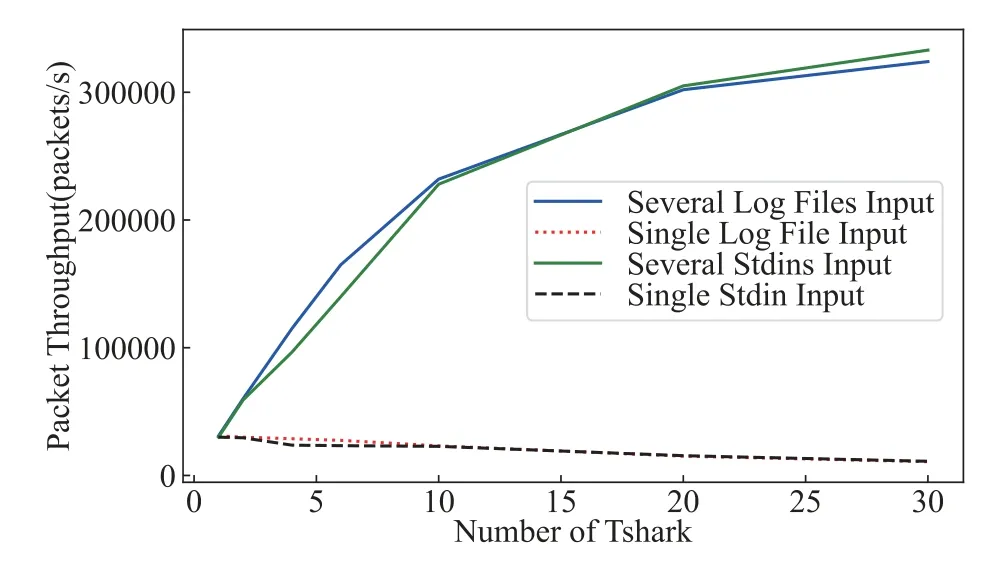
Figure 14.Writing throughput with different number of Tshark.
Under the parallel processing structure, each capture container collects packet data in raw files with a fixed size.If the length of capture files exceeds the fixed size,a new raw file is created to record following packet data.For each captured raw file, Tshark and Filebeat are activated to convert the raw file and forward the data to Elasticsearch.The maximum number of Tshark and Filebeat running at the same time is specified in a thread-pool like approach to avoid the server breakdown caused by excessive resource occupation.
1Gbps bandwidth generates about eighty-three thousand packets per second with each packet has 1500 bytes.The pcap format transformation speed of single Tshark, running on our sever, can reach twenty-seven thousand packets per second.Previous experiments show that Filebeat forwarding speed and Elasticsearch writing throughput could keep with this speed.Even though the transformation speed would decrease with the increasing number of simultaneously running Tsharks, we assume that converting a pcap file into json format takes three times as much as capturing 1Gbps bandwidth.Figure 12 describes parallel processing of data cleaning and storage in detail.A 3tsending test traffic produces three pcap files and the size of each pcap file ist.For each pcap file,Tshark would run accordingly to parse and transform the raw file.Corresponding Filebeat is responsible for forwarding transformed files to Elasticsearch.After capturing traffic, extra timeT2is needed to process and store data while serial processing has extra timeT1,as shown in Figure 13.
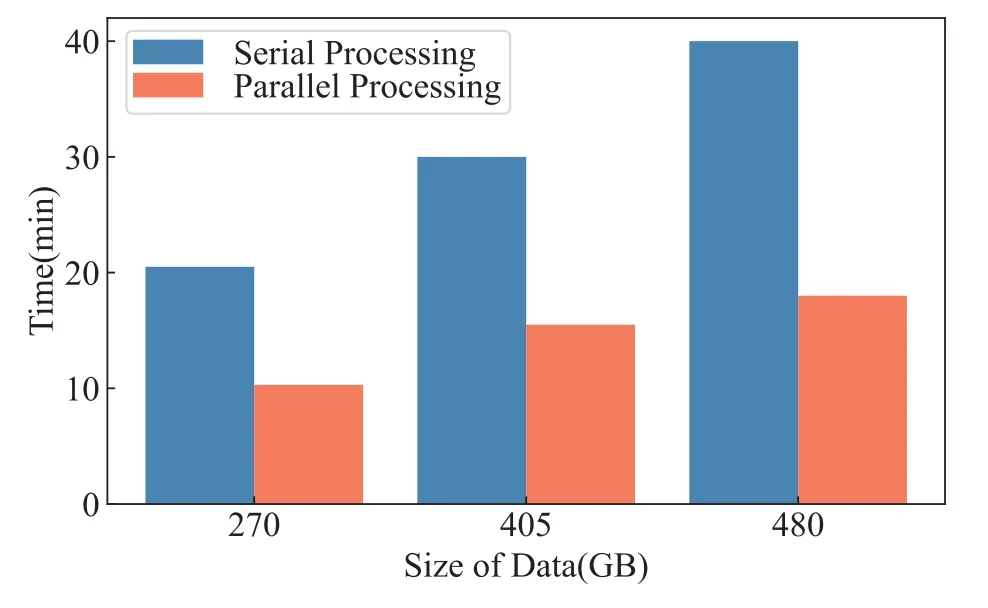
Figure 15.Writing time of different methods.
For further verification, we design experiments to compare these two schemes.Iperf is adopted to produce test traffic, including 270GB, 405GB and 480GB.Comparing with single Tshark and Filebeat in serial scheme, 24 Tsharks and 12 Filebeats are deployed in parallel scheme to process test traffic.As shown in Figure 15, parallel scheme has a significant improvement compared to serial scheme.
The process of data transformation brings data compression, reducing the storage space in Elasticsearch.Table 8 presents the amount of different data formats,compared to pcap file, Elasticsearch index has a definite data compression ratio.
VI.EXPERIMENT AND DISCUSSION
In this section, we first briefly describe the experiment deployment process among the proposed platform.Then,experiments are designed to verify the effectiveness of the proposed analysis system and analysis methods for network metrics.
6.1 Deployment
As shown in Figure 16,the working flow of the experiment approach can be divided into three phases, including preparatory phase,implementation phase,data collection and analysis phase.
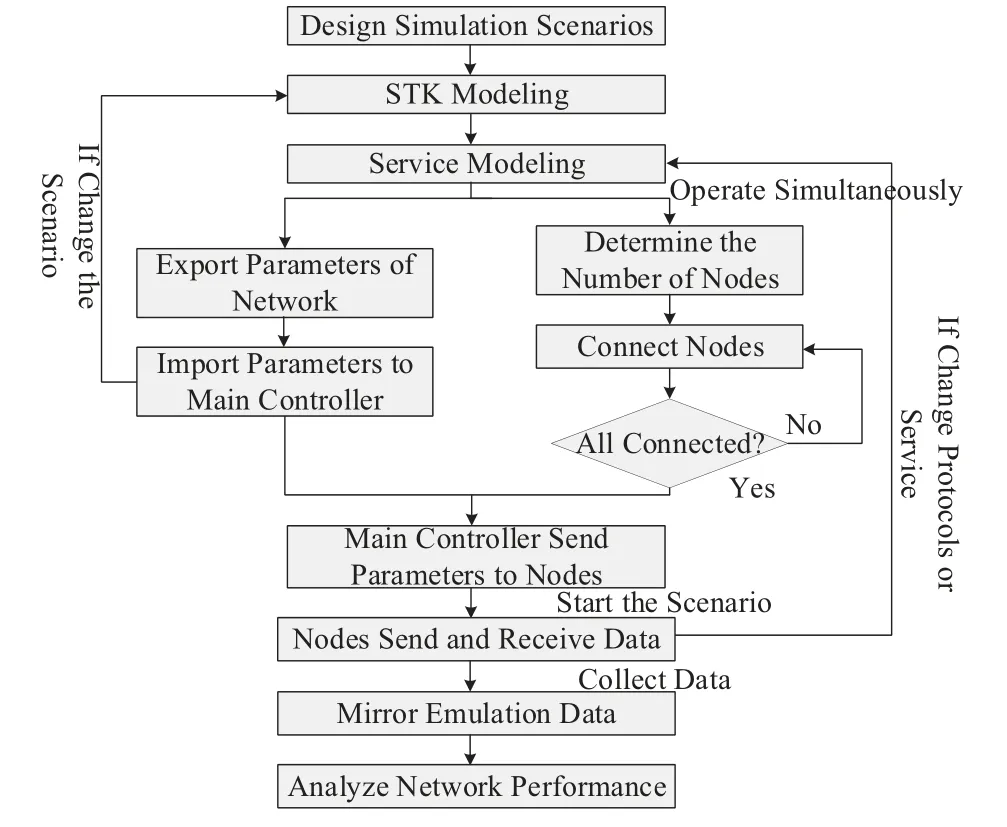
Figure 16.Experiment working flow.
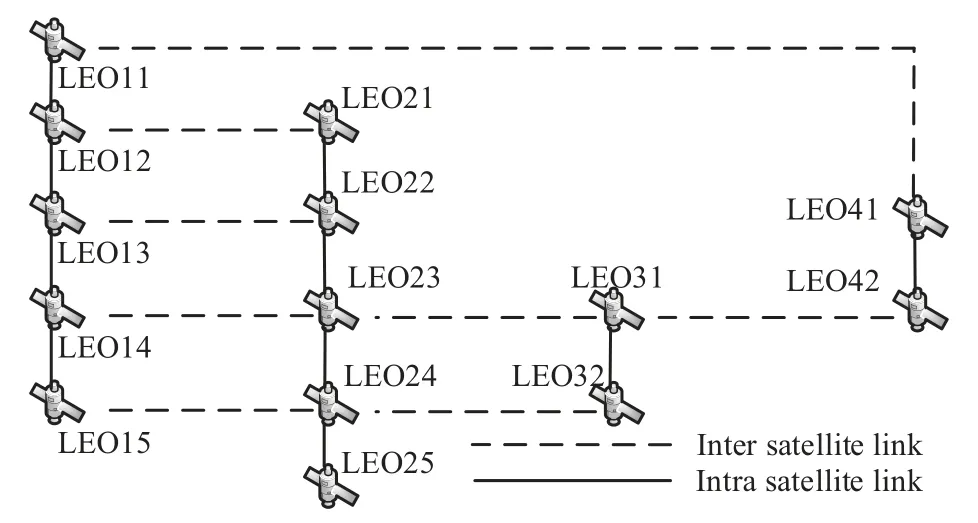
Figure 17.Network topology in experimental scenario.
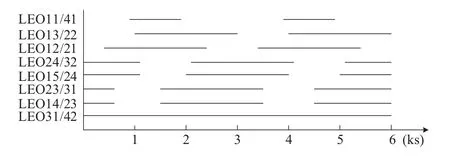
Figure 18.Inter-satellite link connection relationships.
6.1.1 Preparatory Phase
In logical plane, a particular network scenario of SN is designed.Researchers should build the whole network architecture,decide the number and the types of emulation nodes.Besides, a specific network service is determined.Researchers decide which network protocol to be used,and define the specific size of packets and the scheme of data communications.Furthermore,key nodes which support real-time network measurement or full packet capture are configured.Hereto,the preparatory phase is done.
6.1.2 Implementation Phase
In control plane, the main controller manages all devices and computing resources in data plane.According to network parameters defined by researchers,the main controller creates emulation nodes and generates control commands.After researchers send the start signal to the main controller, it will send the operation schedule to every switches and nodes,and inform them what to do at any given time during the emulation.Then, real traffic will be generated and transferred among the network scenario.
If researchers want to change the network scenario,they can go back to the scenarios modeling step.If they need to change protocols and services, they can return to the service modeling step.It is flexible and easy to change the scenario by emulation parameters reconfiguration.
6.1.3 Data Collection and Analysis Phase
Whether a capture container implements full packet capture and real-time network measurement or not could be set at preparatory phase.Captured traffic is first transformed and then stored with measurement data in the storage layer.The analysis layer queries these data and calculates network metrics by Spark.
6.2 Specific Emulation Scenario
Based on the deployment approach mentioned above,we construct an experimental scenario which contains 14 LEO satellites for space Internet working and these LEO satellites are distributed in four polar orbits with a height of 776 km.The angles between four polar orbits and the 0°longitude are 43°, 106°, 169°, and 201°.The numbers of LEO satellites in each orbit are 5,5,2 and 2.The duration of emulation is 6000s.The network topology and the connection relationships of inter-satellites are shown in Figure 17 and Figure 18 respectively.
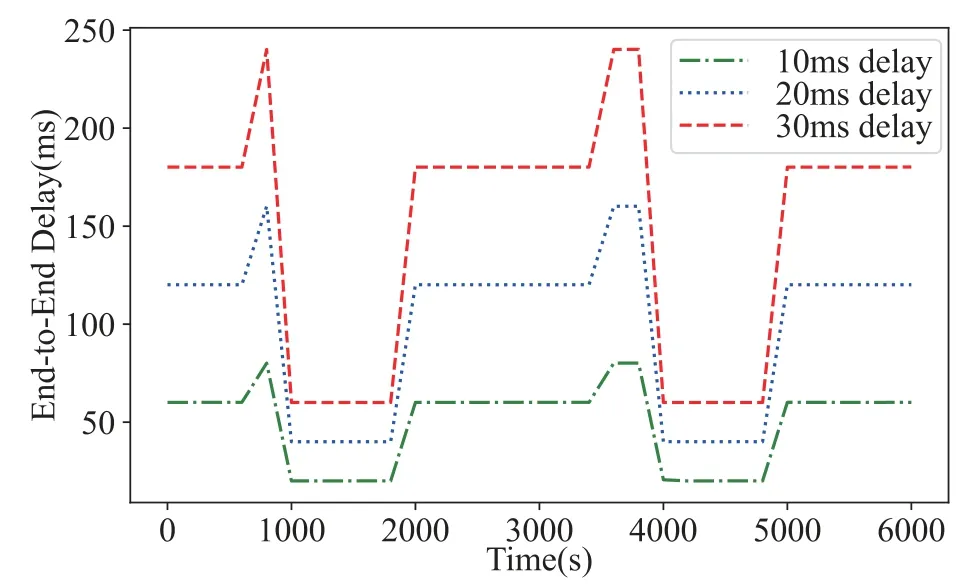
Figure 19.End-to-end network delay.
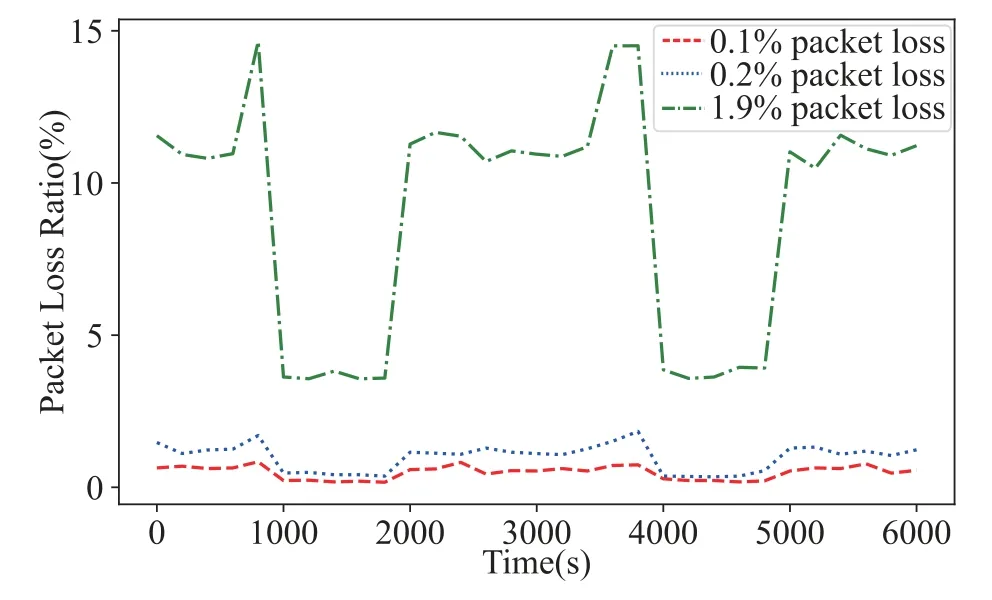
Figure 20.End-to-end packet loss ratio.
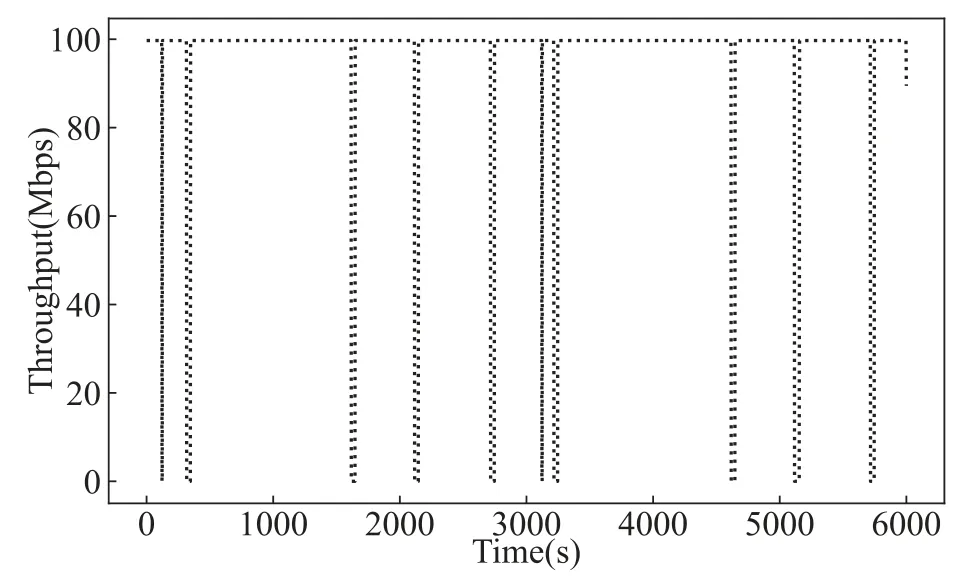
Figure 21.Throughput during emulation period.
To study the performance of OSPF (Open Shortest Path First) in this experimental scenario, 14 emulation nodes are employed to emulate LEO satellites.TCP/IP and Quagga, which are used for supporting OSPF routing protocol, are dedicated and installed in emulation containers.All capture containers are configured to capture full packets.We set the maximum link bandwidth as 100Mbps, link delay of each hop as 10ms, 20ms, and 30ms, and packet loss ratio of each hop as 0.1%, 0.2%and 1.9%in order.It should be noted that the bit error rate (BER) is converted to packet loss ratio in our platform according to the formula mentioned in[20].
6.3 Network Performance Evaluation
6.3.1 Network Delay,Packet Loss Ratio,and Routing Hops
We focus on network delay, packet loss ratio, routing hops and throughput of the end-to-end link between LEO11 and LEO42.For network delay, packet loss ratio and routing hops, we adopt 200s as interval to evaluate the variation of network performance.For throughput, we concentrate on the change within the whole 6,000s.
As presented in Table 9,our proposed system yields the same routing hops between LEO11 and LEO42 with the result measured by traceroute.The maximum of routing hops is 8 and the minimum is 2.So we consider the analysis result of routing hops convincing.
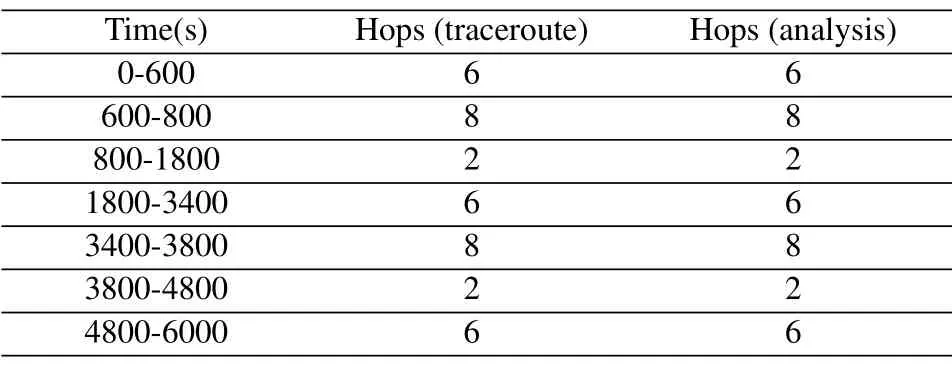
Table 9.Routing hops.
On the basis of routing hops and certain link characteristics between each hop,we could estimate the variation of link delay and packet loss ratio which are consistent with the analysis results given in Figure 19 and Figure 20.
6.3.2 Throughput
LEO11 continuously sends UDP data to LEO42 at the rate of 100Mbps during the whole emulation process.The default OSPF dead-interval setting is 40s while the default OSPF hello-interval setting is 10s.
Due to the dynamic change of connection relationships between different emulation nodes, the condition of link expiration and OSPF rerouting happen from time to time.It can be seen from Figure 21 that there are 10 times link disruptions between LEO11 and LEO42.Some details are shown in Figure 22.When the link expiration happens, OSPF rerouting takes about 40s to recover transmission within 310s to 350s.
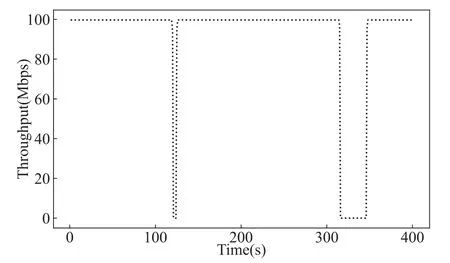
Figure 22.Throughput from 0s to 400s.
The above emulation results have been confirmed in [21], and proves the validity and accuracy of the proposed analysis system.
VII.CONCLUSION
To assess the comprehensive performance of target networks among the proposed SN emulation platform,this paper describes a network performance analysis architecture.Based on this architecture, an analysis system which adopts virtualization technologies, parallel processing, and big data technologies, is built.This system supports the analysis of various network metrics and a AHP-based comprehensive evaluation method for emulated networks.Furthermore, configuration optimization and parallel processing are studied to improve the performance of the analysis system.Experimental results suggest that the system can not only capture high-speed network traffic reliably, but also provide the effective ability for massive data processing and analysis.The analysis architecture is beneficial for the proposed emulation platform and related researches in SN.It should be noted that even though this analysis architecture is designed for our emulation platform,but it could also meet requirements of other similar testbeds.
ACKNOWLEDGEMENT
This work is supported by the National Natural Science Foundation of China under Grant 62131012 and the Fundamental Research Funds for the Central Universities under Grant 021014380187.
- China Communications的其它文章
- GUEST EDITORIAL
- Reducing Cyclic Prefix Overhead Based on Symbol Repetition in NB-IoT-Based Maritime Communication
- Packet Transport for Maritime Communications:A Streaming Coded UDP Approach
- Trajectory Design for UAV-Enabled Maritime Secure Communications:A Reinforcement Learning Approach
- Hybrid Satellite-UAV-Terrestrial Maritime Networks:Network Selection for Users on A Vessel Optimized with Transmit Power and UAV Position
- Energy Harvesting Space-Air-Sea Integrated Networks for MEC-Enabled Maritime Internet of Things

