A Novel User Behavior Prediction Model Based on Automatic Annotated Behavior Recognition in Smart Home Systems
Ningbo Zhang,Yajie Yan,Xuzhen Zhu,Jing Wang
1 Key Laboratory of Universal Wireless Communications,Ministry of Education,Beijing University of Posts and Telecommunications,Beijing 100876,China
2 School of Artificial Intelligence,Beijing Normal University,Beijing 100875,China
Abstract: User behavior prediction has become a core element to Internet of Things(IoT)and received promising attention in the related fields.Many existing IoT systems (e.g.smart home systems) have been deployed various sensors and the user’s behavior can be predicted through the sensor data.However,most of the existing sensor-based systems use the annotated behavior data which requires human intervention to achieve the behavior prediction.Therefore, it is a challenge to provide an automatic behavior prediction model based on the original sensor data.To solve the problem, this paper proposed a novel automatic annotated user behavior prediction (AAUBP) model.The proposed AAUBP model combined the Discontinuous Solving Order Sequence Mining(DVSM)behavior recognition model and behavior prediction model based on the Long Short Term Memory(LSTM)network.To evaluate the model, we performed several experiments on a real-world dataset tuning the parameters.The results showed that the AAUBP model can effectively recognize behaviors and had a good performance for behavior prediction.
Keywords: Internet of Things; behavior recognition;behavior prediction;LSTM;smart home systems
I.INTRODUCTION
With the rapid development of IoT and Artificial Intelligence(AI),the number of IoT devices sharply increases [1].Intelligent Internet of everything has become an inevitable trend in the development of IoT in the future.This paper takes the smart home system as an example, showing a behavior prediction model based on automatic annotated behavior recognition in IoT systems.The model can be extended to other IoT applications.As a core component of IoT, the intellectualization of smart homes attracted serious concerns [2].In order to improve convenience and userfriendliness, a number of researches are devoted to the development of technologies required in the smart home environment, such as behavior recognition and behavior prediction [3].By the user’s operation data from an intelligent household environment, the smart system can predict the user’s behavior.Then the prediction results can be used to enhance the energysaving and intelligent degree of the system and also can be applied to the service recommendation system[4].The structure of a smart home system is schematically shown in Figure 1.
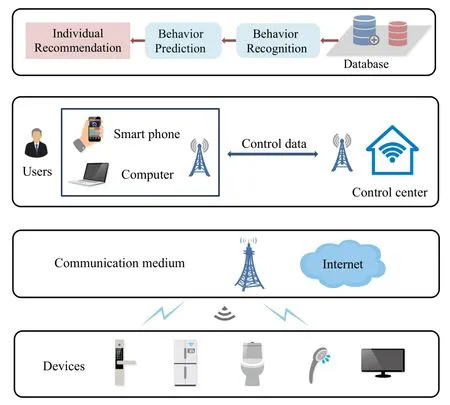
Figure 1.Structure of smart home systems.
The usage of smart home systems can be divided into three types in general.The first type is to monitor the life pattern and health status of the user,detect abnormal behaviors in time and help users maintain an independent and healthy life.The second type is applied for storing and retrieving multimedia captures to improve the user’s life experience.The third type is designed to protect the user from hazards such as theft and natural disasters.In this paper, we focus on the first type of smart home which is used to monitor the daily life of the residents.User behavior pattern recognition is an essential part of a smart home system.The major existing smart home systems implement user behavior recognition in many ways, either based on vision, or based on wearable devices[5], or based on home sensors,or based on WiFi signals[6],or based on the smartphone carried by the user [7],etc.Among them, the camera and video data need to use technology related to computer vision to identify the user’s behavior, and there are certain disputes on user privacy[8].Wearable devices and mobile phone sensors are suitable for monitoring the user’s exercise,health, safety status, as well as individual application recommendations for the user.However, the user behavior recognition system based on wearable devices has some limitations[9].For example,the elderly may forget to wear the wearable devices and the user may feel uncomfortable wearing the device for a long time which may also cause certain harm to the body.While environmental sensors are widely used in smart home systems attributed to their simple and diversified deployment,low cost,efficient collection of users’operation events,and no privacy security issues[8].
Nowadays, the advanced development of sensing and communication technology makes it possible to collect a large amount of sensor data.However, due to the fact that individuals probably perform the same behavior in different ways and human inherent uncertainties,it is still a formidable and complex challenge to identify user’s behaviors accurately [10].A wide range of supervised machine learning methods have been commonly used for behavior pattern mining and recognition.But supervised methods have certain limitations because they require a complex feature extraction process and a number of human-annotated data which consumes lots of human resources and time cost[11, 12].Therefore, obtaining detailed, high-quality,and continuous annotations is a primary task in smart home systems.At present,many researchers have applied various machine learning algorithms to predict the next behavior of users in the smart environment.The data used in these prediction models are not the original sensor operation sequences, but the behavior data that have been labeled artificially, that is, human intervention is required to predict the user’s behavior.The workload of labeling will grow greatly when the scale of sensor data becomes very large,which is unfriendly to experts and related personnel in the field of behavior annotation.In addition, the accuracy of annotating may not be guaranteed at the same time.Thus,these behavior prediction models still have room for further automation and intelligence.To solve the above problems,this paper proposes a novel behavior prediction model based on automatic annotated behavior recognition in smart home systems.
The contributions of this paper are summarized below:
· Proposing a novel automatic annotated user behavior prediction (AAUBP) model.The proposed method combines the behavior prediction model with the frequent sequential pattern discovery model.The automatically labeled behavior data is given as input of the prediction model based on the LSTM networks.
· Proposing an automatic annotation method instead of human annotation operation.The realization of automatic annotation acquires three modules that are respectively frequent behavior pattern mining module, behavior pattern clustering modelue based on the K-means,and behavior recognition module based on the HMM.
· Validating the AAUBP model on a real-world dataset.To prove the effectiveness of our approach, several comprehensive experiments were performed on the CASAS dataset.We adjusted the parameters for the automatic annotation model and evaluated the effects of altering the length of input behavior sequence and the optimization method for the prediction model.The experimental results show that the AAUBP algorithm can identify high-level patterns (behavior patterns)from continuous low-level data(sensor data)intelligently,which can reduce the labor workload and time costs for sensor data annotation.It has the capacity to predict user’s behavior without human intervention in the smart home scenario.
This work is structured as follows.Section II reviews the related work and demonstrates our contributions.Section III presents a detailed and theoretical description of the proposed AAUBP model.In Section IV, we provide experiments on the CASAS dataset and discuss the experimental results.Finally,Section V concludes the paper.
II.RELATED WORK
2.1 Behavior Recognition Model
Statistical models have been developed for behavior recognition systems, such as Hidden Markov Models, Naive Bayes, and Dynamic Bayesian Networks[13].However,the standard HMM lacks a hierarchical model for representing human behaviors[14].To deal with this problem, an application of the hierarchical HMM model has been proposed to recognize the current behavior where the hidden states can be regarded as a spontaneous statistical model on their own [15].The proposed model can infer the interrupted behavior labels and utilized statistical features such as happened time of a day and the duration of the behavior to correct the recognized label.
Discriminative models that can learn about the boundaries between different classes are also commonly used for behavior identification and most of them are supervised [16].Decision trees and Knearest Neighborhood(K-NN) are common discriminative model classification methods.In [17], Lombriser et al.evaluated the performance of the K-NN method in mining people’s daily activities.The results indicated that K-NN was robust to noisy training data, but the algorithm ran slowly.Mehr et al.used the MIT smart home dataset and applied the Artificial Neural Network (ANN) to mine and identify the daily behaviors of residents[18].ANNS included three parts that were training, cross-validation, and testing.In [19], Krishnan et al.combined support vector machine(SVM)with Naive Bayes classifier to perform the modeling of behavior recognition in the smart home environment.Instead of using a single plane classifier to distinguish numerous activities,the model designed a hierarchical classifier based on SVM that reduced the training time but had no influence on the recognition performance.
Some of the recent sequence mining approaches for the behavior recognition model are presented by many researchers.Liu et al.have proposed a discrete behavior pattern mining algorithm based on support degree,which used low-level operations to identify higherlevel behaviors[20].The algorithm first estimated the support level of each action, then removed the less supported pattern and generated the remaining data into a 2-pattern.After several iterations,the algorithm created a range of discrete frequent k-patterns with different dimensions.Rashidi et al.[21]proposed a behavior recognition model via the Discontinuous Solving Order Sequence Mining(DVSM)algorithm which consists of three parts that were frequent behavior pattern mining, clustering, and HMM recognition.With regard to the dataset with predefined behavior patterns,this algorithm identified frequent patterns and recognized behaviors effectively.
Due to the rapid increase of the number of smart home devices,deep learning methods have been more widely applied for activity recognition systems [22,23].According to [22], Singh et al.proposed a behavior recognition model based on the recurrent neural network (RNN).The model evaluated and validated the algorithm performance on three real-world smart home datasets.The experimental results indicated that the proposed method achieved better performance in terms of accuracy than other methods such as HMM, Naive Bayes, and Conditional Random Field(CRF).In [23], a new approach that combined the attention mechanisms and convolutional neural networks (CNNs) has been presented to detect human behaviors.The model added attention to the neural network to extract and select features in a better way,thereby improving the accuracy of the behavior recognition process.The researchers implemented an experiment on a public dataset to prove the performance of the proposed method and the results showed that it had higher accuracy than the existing methods.
However,the models above focus on the offline activity recognition scene and they are not suitable for the online activity recognition systems.In[2],Hu Y et al.proposed a real-time activity recognition approach based on the genetic algorithm-optimized SVM classifier where the genetic algorithm was applied to choose the optimal parameters for the support vector machine model automatically.Many experiments were conducted on free data and the results demonstrated that the proposed model had the ability to achieve real-time behavior recognition with high quality for elderly people.
Knowledge-driven learning models had an effective application in the domain of behavior detection in smart home environments.Juan Ye et al.proposed a Slearn model to perform the behavior recognition [24].This model solved the scarcity of behavior annotations by sharing the datasets with the same tasks for the smart home systems with different sensor deployments and different users.There were two methods presented to achieve the model that the one was sharing training data and the other was sharing classifiers.The researchers validated the proposed method on several datasets and proved the ability of the proposed method for behavior recognition when behavior annotations were scarce.Hooda et al.have proposed an ontology-based knowledge model to identify human behavior which conceptualized the activity recognition process by capturing the relationships between low-level actions(simple activities) and high-level (complex behavior) [25].In addition,the model has the ability to reuse,interoperate and exchange.The comprehensive validation on the extrasensory dataset showed that the ontology model provided effective results.
2.2 Behavior Prediction Model
A wide range of algorithms for behavior prediction have been studied in the past years.A method to mine frequent behaviors of users in daily life has been proposed based on the Apriori algorithm by Channon et al in [26].The method discovered discrete frequent behavior sequences that did not contain time features.The repetition rate of the user’s operating behaviors in a day is high and if time information is not included, the manipulation behaviors in different periods may be disordered.These factors lead to large errors in the prediction results.Choi et al.proposed a deep learning framework to predict various activities in the family and used DBN-ANN and DBN-R algorithms to mine user behavior [27].The accuracy performance is not good and the learning ability of the framework needs to be improved.Each behavior record of the user was equally important in the DBNR algorithm.Taking into account that the user’s behaviors change dynamically over a period of time, T.Liang et al.proposed an unsupervised user behavior prediction (UUBP) algorithm, which introduced the Ebbinghaus forgetting curve and the forgetting factor based on the equal probability model [28].These factors helped the model to distinguish which behavior records of the user were more important and thus eliminated the influence of outdated behavior records to some extent.Experimental results showed that the UUBP algorithm had better performance compared with the previous DBN-R prediction algorithm.
Ehsan et al.proposed a behavior prediction model based on the Bayesian network which predicted user’s behaviors in two steps [29].The first step predicted relevant features of the next behavior, and the second step predicted the next behavior according to the features predicted in the first step and the current behavior.In the paper, the authors also presented a method to predict the time of the next behavior which modeled the relative start time of the prediction activity based on the continuous normal distribution and outlier detection.Casagrande et al.proposed the behavior prediction model by combining the Speed algorithm with LSTM neural network [30].Compared with the SPEED-PPM algorithm, the running speed of the LSTM-SPEED algorithm was greatly improved.However, when the dataset size was small,the SPEED-PPM algorithm had higher accuracy and a better performance.
In[31],Aitor et al.used the Word2Vec algorithm to represent the word vectors of user’s behaviors and then embedded them into the RNN prediction network.Semantic meaning is provided by the word vector embedding for the representation of behaviors where each behavior is represented as a point in a multidimensional plane and the distance between each behavior and the others represents their relevance.The experimental results indicated that the predictive network structure with the behavior word vector embedding layer modeled user’s behaviors better.On the basis of word vector embedding, Zhan et al.proposed a behavior prediction model based on time dynamics[32].Timestamp information of user’s behavior was added in the model, and the framework of two parallel LSTM layers was proposed, where one for word vector embedding and the other for adding timestamp information.The research results highlighted that appropriate temporal information helped the model with timestamp information outperform the model without the information.The above behavior prediction models for smart space basically used behavior data which was artificially annotated to carry out the next behavior prediction and time prediction and thus required human intervention.Therefore,these prediction models still have room for further intelligence.
III.THE AAUBP MODEL
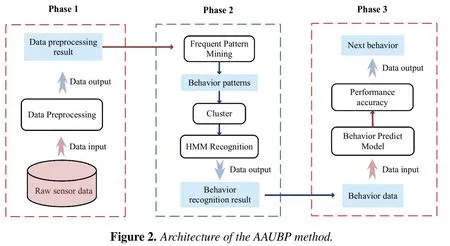
To a large extent, the resident’s behaviors determines the success of deployment and applications of a smart home.Therefore, knowing what behaviors the resident will do and not do at a certain time and location enables providing the smart home environment as the resident hopes [33].In order to find behavior patterns and predict the behaviors of the resident in a smart home without human intervention, we propose a new joint behavior model to solve the problem of automatic data annotation for the behavior prediction model in this paper.The AAUBP model combines the behavior recognition model with the prediction model and is composed of three phases that are described in Figure 2.
Phase 1 of the method is devoted to preprocess the raw sensor data and filter frequent sensor events.In phase 2, the DVSM algorithm which combines data mining, machine learning, and statistical model discovers frequent sequential behavior patterns from sensor event sequences and conduct behavior recognition.The reason why the DVSM model is used to perform the high-level behavior pattern mining and recognition from the low-level sensor data is that the model can not only identify the continuous behavior sequences but also mining the discontinuous behavior pattern by controlling the self-defined continuity parameter.In phase 2,we use the DVSM model to mine and recognize continuous behavior patterns so that the labeled data can be time-continuous, and a string of continuous sensor data will be mapped into a behavior.The corresponding relationship between sensor sequences and behavior sequences is shown in Figure 3.The sequences of sensors are temporally short operations made by the users(e.g., toilet door, toilet flush, bathroom door etc.).Behaviors describe how users trigger different sensors at different time.Behaviors are temporally longer but finite and are composed of several sensors(e.g.,prepare breakfast,take shower,etc.).The user may trigger several sensors when performing a behavior, that is, the relationship between sensors and behaviors is many to one.One of the characteristics of our algorithm is that it works on the sensorspace to model the behavior-space.The pattern mining step discovers the most frequent pattern sequences from the sensor event data.In the next step,the pattern mining step’s output is fed to a clustering algorithm to cluster the behavior patterns into behaviors.Based on the clustering step,the behaviors corresponding to the sensor events data are labeled and identified via a statistical model.K-means clustering algorithm and Hidden Markov Model are applied in clustering method and recognition model, respectively.The Viterbi algorithm is used for behavior recognition corresponding to the decoding problem of HMM.After behavior recognition,sensor data will be automatically converted into behavior sequences which is convenient for the following phase.Phase 3 of the method is the user’s behavior prediction module based on LSTM neural network.Based on the RNN,LSTM adds a forgetting gate to filter the past state, so that it has the capacity to choose which state has more influence on the current state,rather than to choose the recent state simply.Therefore, LSTM neural network is suitable for modeling problems with time correlation and unknown time intervals.The output of phase 3 enables determining which behavior will occur next timestep.We illustrate each phase in detail in the sequel.

Figure 3.Elements of the user behaviors.
3.1 Phase 1 Data Preprocessing
The data preprocessing phase helps to improve ease,efficiency,and the quality of data of the following mining phase and then enables improving the performance of the mining results [34].We need sequential sensor data and the sequence is depicted by sensor ID,time feature, and the corresponding behavior.Thus,we expect the raw sensor data to be represented in the form of [Date, Time, Encoded Sensor ID, Behavior]where the behavior has been already annotated to be compared with the results for the behavior recognition model.
3.2 Phase 2 Behavior Pattern Mining and Recognition
3.2.1 Frequent pattern mining
Frequent sequential patterns are several subsequences of the sensor data whose frequency is greater than or equal to a specific threshold[35].First,the DVSM discovers the frequent and repeated sequential patterns.And then a model is created to perform the behavior recognition process.Frequent pattern mining is mainly carried out through three stages.The first stage is using the sliding window to find the non-repeated general behavior patterns with the length of“L”.The second stage is a merging process aimed to determine whether the behavior pattern with the length of“L+1”is a variation of the general behavior pattern with the length of“L”or a new general behavior pattern.The final stage is the pruning operation,which cuts out the non-interesting general behavior patterns and the variations of general behavior patterns to discover the frequent behavior patterns to the maximum extent and remove the redundancy.The process of frequent pattern mining is depicted in Figure 4.
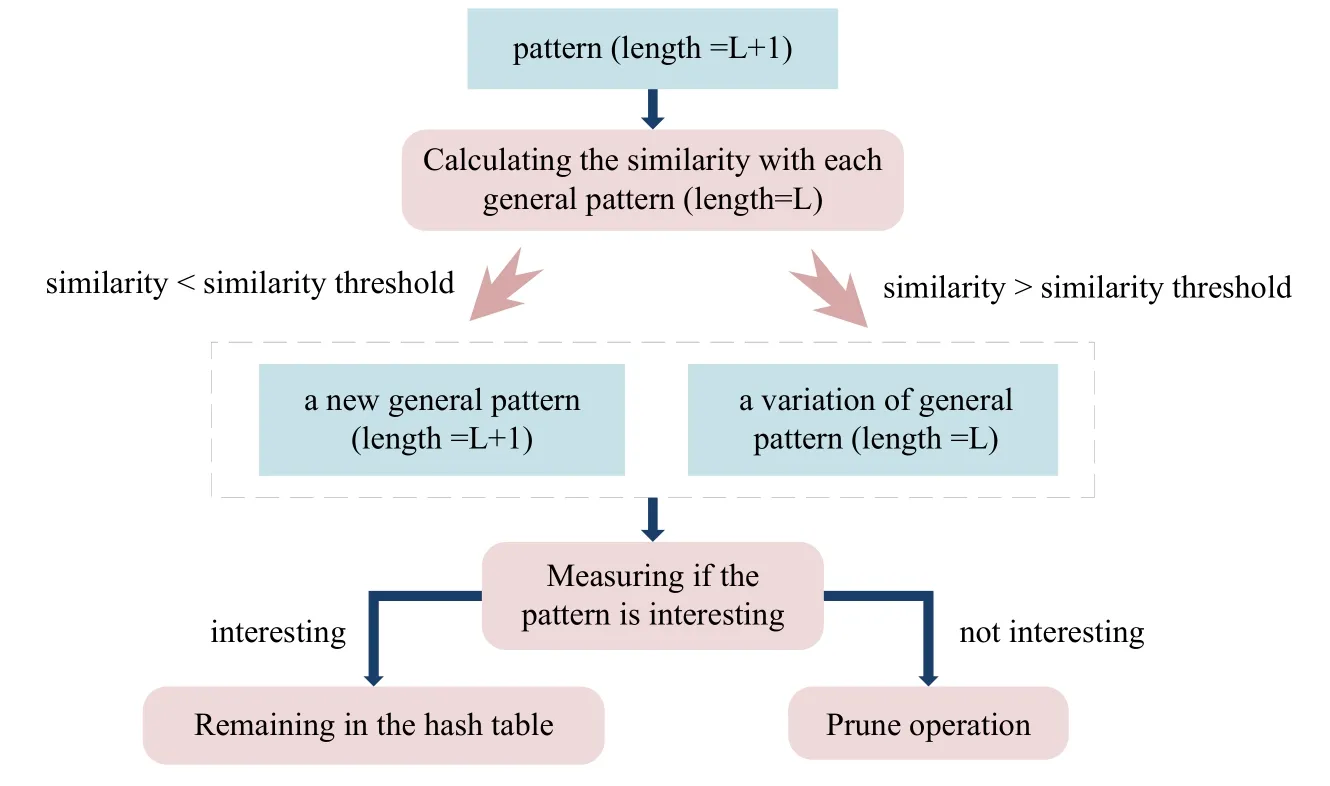
Figure 4.The process of frequent pattern mining.
Stage 1:The initial iteration number is set to 1 and the initial size of the sliding window is set to“L”which is set to 2 in the first stage.The behavior patterns with the length of“L”are searched for under the settings above.And then the repeated behavior patterns are combined as the initial general behavior patterns.
Stage 2:In the second iteration, the similarity between each behavior pattern with the length ofL+1 and each general pattern with the length ofLis compared.The similarity between two discovered patterns is calculated as Eq.(1):

wheree(A,B) represents the Levenshtein (edit) distance between the two patternsAandB[21].If the similarity is greater than the given threshold, the behavior pattern with the length ofL+1 is considered to be a variation of the general pattern,otherwise,it is considered to be a new general pattern.To facilitate comparison and improve query efficiency,the general behavior patterns and their corresponding variations are stored in a hash table.
Stage 3:With regard to the discovered behavior patterns and their corresponding variations, we perform the pruning operation.A general behavior pattern is considered to be interesting when it satisfies Eq(2)in[21]:

whereDLrepresents the description length andDrepresents the input data.For the general patterna,theith variation of the general patternais denoted asai.Crepresents the compression thresholds of the general pattern.And if it does not satisfy, the general pattern is pruned,that is,the key corresponding to the general pattern in the hash table is deleted.Similarly,the same pruning operation on the variations of the general behavior pattern is calculated as Eq(3)in[21]:

whereCvis the compression thresholds of the variation of the general pattern.If a variation of the general pattern is not interesting, that is, we need to remove the value corresponding to the variation of the general behavior pattern in the hash table.The method used to identify interesting general patterns conforms to the principle of minimum description length.The redundancy in the behavior patterns can be eliminated by pruning for several iterations.The condition for stopping iteration is that interesting general behavior patterns can no longer be found.
3.2.2 Behavior pattern cluster
The behavior pattern cluster consists of the following two stages:
Behavioral pattern preprocessing.User’s behavior patterns detected by frequent pattern mining stage consist of sensor events.However,patterns should be composed of states that are corresponding to the sensor events of patterns in a clustering algorithm.The states also contain additional information,such as the type of the sensor,the location of sensor deployment,and the duration of each sensor event.The extended state sequence of a behavior patternpis calledE(p).We combine all the continuous states corresponding to the same sensor to form an extended state.For example, repeated sensor events will be substituted by a new sensor event whose duration state is longer if the sensor is triggered repeatedly several times without another sensor event interrupting it.The duration,that is,the number of repeated triggers will be recorded as a state attribute.After this preprocessing, each sensor event sequence will be converted into an extended state sequence and a sample of them is shown in Figure 5.The representation of the behavior pattern will be more concise and compact,which enables comparing whether the two behavior patterns are similar easier and helps to reduce the computation complexity as well.

Figure 5.A sample of extended state.
Cluster.In the cluster stage, we use the K-means clustering algorithm.The distance between two extended state sequences needs to be defined in order to calculate the similarity between two behavior patterns.The sensor sequences are not numerical sequences,but class sequences whose data represent the categories of different behaviors and do not represent the actual position in the coordinate space.Therefore, measuring the similarity between two sequences of behaviors can’t use the common scalar measure distance,such as Euclidean distance, Manhattan distance, and Minkowski distance,etc.Instead,it is measured by the edit distance(Levenshtein distance) that is commonly used to compare the similarity between two strings.Edit distance is the minimum number of edit operations required to convert one string to the other between two strings so that the greater the distance between them,the more different they are.Edit distance permits editing operations that involve replacing one character with another,inserting a character,and deleting a character.Edit distance is properly applied to compare the distance between the extended sequences of states (sequences of categories).When calculating the edit distance between the extended state sequenceE(X)andE(Y)the state information and order mapping will be taken into account.We calculate the number of the editing operations needed to makeXthe same asY.Edit operations include the insertions, deletions, substitutions, reordering steps,and the steps of changing attributes which include sensor event duration, etc.The steps of insertion, deletion,and substitution correspond to the traditional edit distancee(X,Y) while the steps of reordering correspond to the order distanceeo(X,Y)and the steps of changing attributes correspond to the attribute distanceea(X,Y).The redefined distance between the behaviorXandY,eg(X,Y),is given by Eq.(4):

The order distance is defined by Eq.(5):

The attribute distanceea(X,Y)between two statesxandywhich is defined as the sum of the individual attribute distances is given by Eq.(6)in[21]:

At the initial stage,clustering centers are randomly selected.For the distance calculation in behavior pattern clustering, a self-defined distance given by Eq.(4) in [21] is adopted.Based on the given distance formula,the clustering center will be iteratively updated until convergence.Clustering centers can be obtained and the category of each behavior pattern can be known after the process of clustering.
3.2.3 Behavior recognition
We used the Hidden Markov Model to achieve the behavior recognition module.The variables in the HMM are shown in the Table 1.The HMM model is determined by the initial state probability vectorπ, the state transition probability matrixAand the observation probability matrixBwhereπandAdetermine the state sequence andBdetermines the observation sequence [34].Therefore, the HMM modelλcan be represented by a ternary symbol as Eq.(7):

The definitions or calculation formulas of the variables in Table 1 are given by Eq.(8)-Eq.(19).The recursiveformula of variableδcan be obtained by definition and is given by Eq.(19).
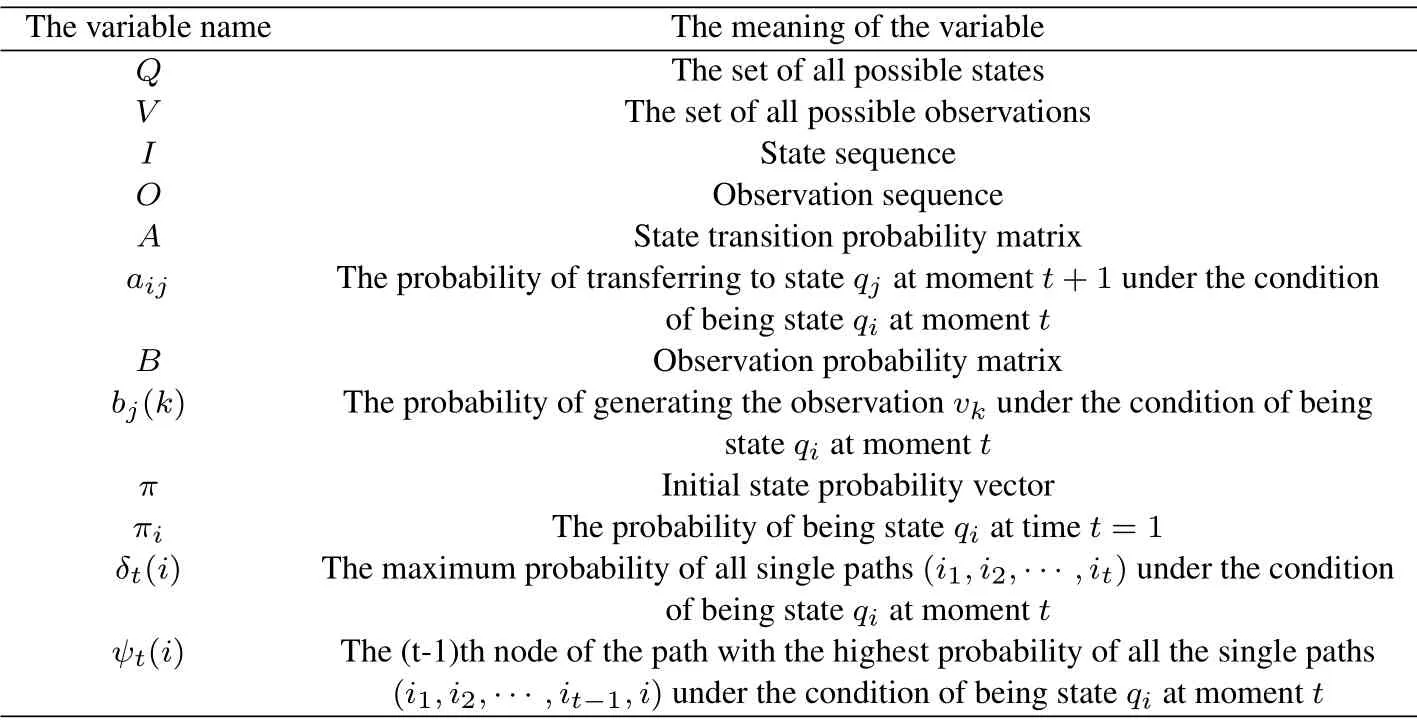
Table 1.The information of the variables in the HMM.
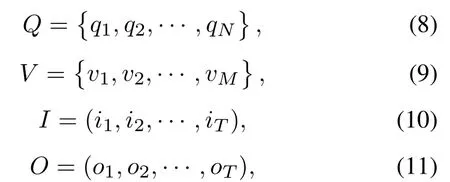
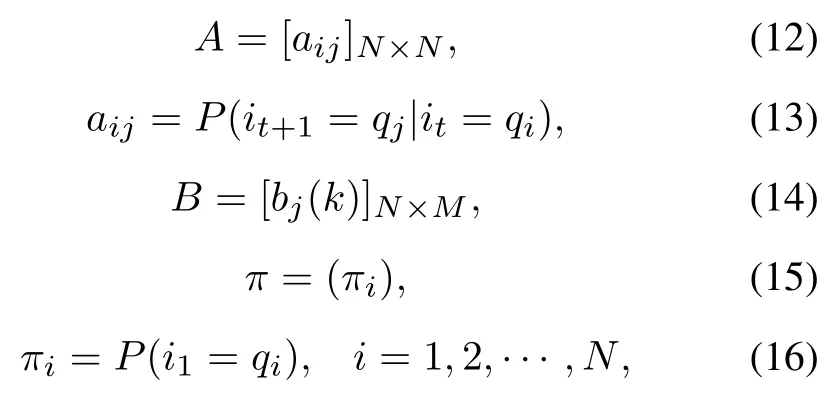

Behavior recognition corresponds to the decoding problem of the HMM model is solved by the Viterbi algorithm.We subsequently describe the detail of the Viterbi algorithm and how it is applied to the AAUBP model.In the HMM model,the sensor sequence is regarded as the observation sequenceOwhile the output of the clustering stage is considered as the hidden state.The category of each behavior pattern will be known after the clustering processing and thus the calculation of observation probability matrix, initial state probability matrix, and state transition probability matrix can be consequently performed.For each class(each cluster), the initial state probability(πi) is defined as the total number of occurrences of all behavior patterns in a class divided by the total number of occurrences of all behavior patterns in all classes.The transition probability(aij) of each class transferring to another class is derived through a complex process.The starting and ending positions (subscripts)of each behavior pattern corresponding to the sensor data are marked and recorded during the extraction process of the behavior patterns.And the category of each behavior pattern can be known from the results of the clustering process.Therefore, for each behavior pattern in a class,comparing the recorded starting and ending subscripts with those of each behavior pattern in each other class.If these subscripts don’t exist inclusion relationship, the number of the transferred states will be added by one.Then the transition probability of each class to each other class is obtained by dividing the number of transferred states of each class by the total number of transition states.The observation probabilitybj(k) is calculated by the total number of occurrences of each sensor divided by the total number of occurrences of all sensors in each cluster.For the Viterbi algorithm, dynamic programming is generally applied to solve the decoding problem of HMM model and it can find the path with maximum probability(optimal path)where a path corresponds to a hidden state sequence in the HMM model.The steps of the Viterbi algorithm are shown as follows:
Input:the modelλ= (A,B,π) and the observationO=(o1,o2,··· ,oT).
Output:the optimal pathI*=(i*1,i*2,··· ,i*T).
(1)Initialization

First,the Viterbi algorithm needs to start at timet=1.
(2)Recursion fort=2,3,··· ,T

This step recursively calculates the maximum probability of each path at timetwith the state value ofiuntil getting the maximum probability of each path at timeTwith the state value ofi.
(3)Termination
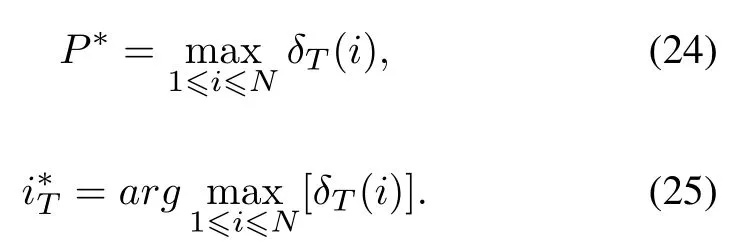
In the termination step, the maximum probabilityP*at timeTis the probability of the optimal path and the endpoint of the optimal pathi*Tis also obtained at the same time.
(4) Optimal path traceback fort=T -1,T -2,··· ,1

In order to find out the optimal nodes, starting from the endpointi*T,the nodesare gradually obtained from back to front.Then the optimal pathI*=(i*1,i*2,··· ,i*T)corresponding to the recognized behavior sequence is generated subsequently.
3.3 Phase 3 Behavior Prediction
After phase 1 and phase 2,sensor data is labeled into corresponding behaviors without artificial annotation and verification so that the sensor sequence will be automatically converted into a behavior sequence.There are six kinds of different behaviors in the behavior sequence.A network training with high accuracy should be selected as the model to make the predictions.The LSTM networks have three types of layers which are respectively input layer,hidden layer,and output layer.Each layer of the LSTM network is composed of several unit memory blocks with three gates that are input gate,output gate,and forget gate.These gates are activated by the sigmoid function and the output value of the gate is between 0 and 1, deciding the information to be discarded or stored.As a prominent variant of recurrent neural networks (RNN), LSTM introduces cell states and adds filtering of past states on the basis of RNN,so as to select which states should be remembered and which states should be forgotten.Therefore,the LSTM network is effective at solving the problem of sequence data, especially for time series data with long-term dependencies.
In our model,the LSTM network is suitable for the annotated behavior data, because they are a long series of time-varying sequential data and the prediction process of behavior labels depends on previous behaviors.The prediction model utilizing LSTM networks has the ability to remember input values over a long period of time, making it possible to remember data sequences and perform accurate predictions.The architecture of the behavior prediction model based on LSTM networks is shown in Figure 6 and the configuration parameters of the LSTM prediction model are shown in Table 2.First, the labeled behavior data is fed into an embedding layer.The behavior embeddings obtained by the embedding layer are then processed by the LSTM layer which is the core element of the prediction model.The LSTM layer is set to a size of 128 network units.Then we use one dense layer with rectified linear unit (ReLU) activations.ReLU activations are one of the most widely used activations for intermediate dense layers in prediction problems.The dense layer has a size of 256 network units.Then the dropout regularization is applied to prevent the issue of overfitting with the value of 0.2.Finally, we use a dense layer that has the ability to learn to predict the next behavior based on the model generated by the previous layers.The last dense layer defines the number of outputs which represent the different behavior classes.The prediction process is actually considered as a multi-classification problem and thus, softmax is chosen as the activation function for the output layer properly and categorical cross-entropy is used as the loss function.In Section IV,we describe and analyze the different architectures and configurations that we have evaluated.
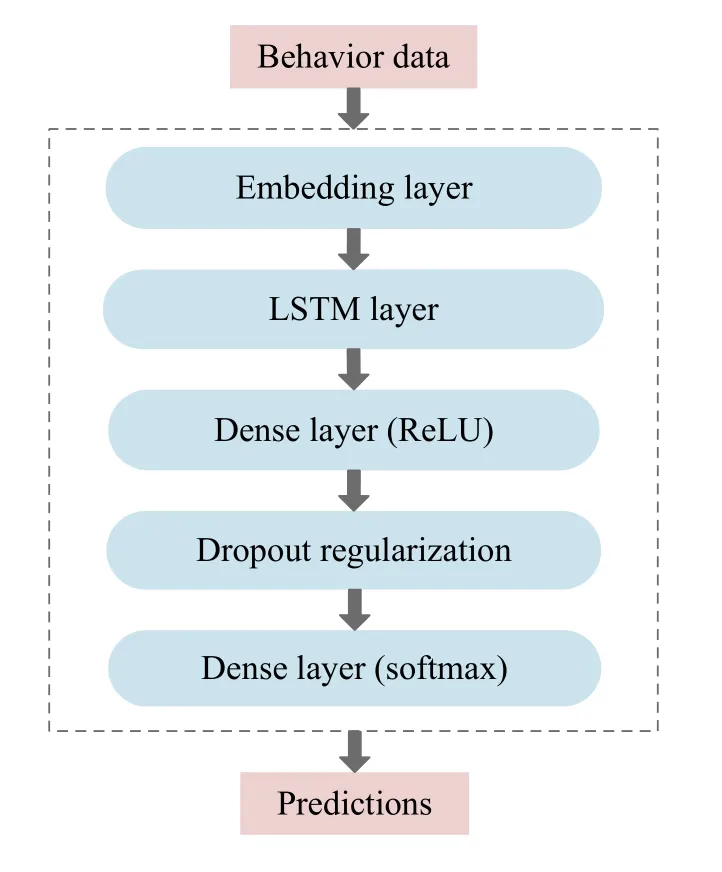
Figure 6.Architecture of prediction model based on LSTM networks.
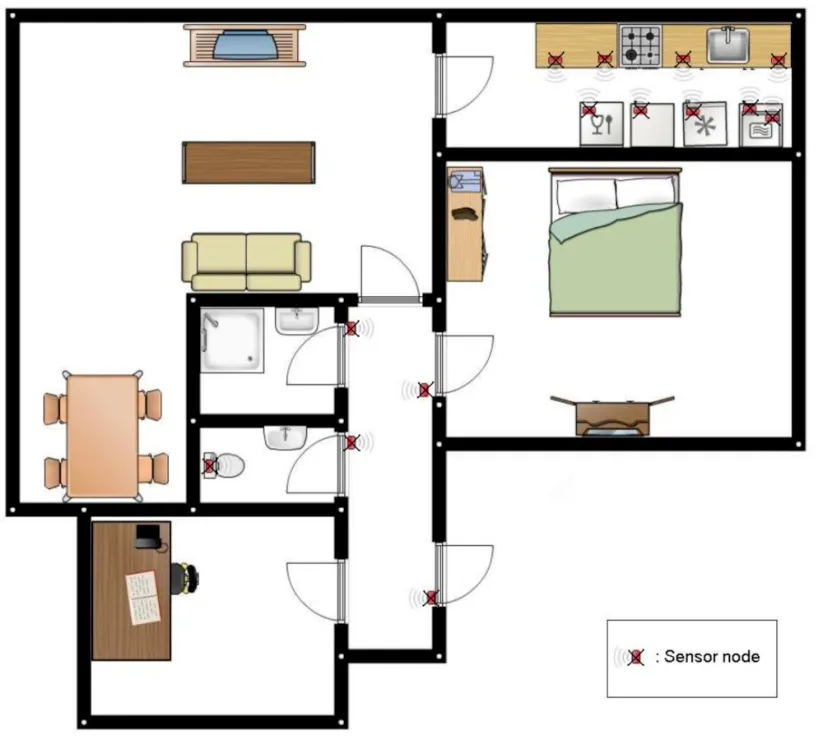
Figure 7.Layout of the apartment.
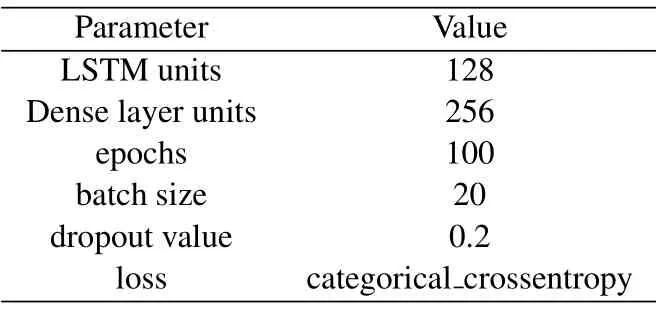
Table 2.Implementation parameters of the LSTM prediction model.
IV.EXPERIMENTS
4.1 Dataset
To validate the AAUBP model, we use the dataset provided by the Centre for Advanced Studies in Adaptive Systems (CASAS).The dataset was created by the Department of Electrical Engineering and Computer Science at Washington State University’s School.CASAS contains more than 60 datasets, and we use the Kasteren dataset because this dataset is widely used in the literature of smart home environment and behavior recognition.The Kasteren dataset monitored the daily life of a 26-year-old man for 28 days [36].Fourteen binary sensors were installed on doors, cabinets, refrigerators, or toilets of the man’s apartment and the locations of the sensors can be seen in Figure 7 where red rectangle boxes indicate the positions of the sensors.There are 2120 sensor events and 245 behavior instances in the dataset.The annotated activities were the following: “Leave house”,“Use toilet”, “Take shower”, “Go to bed”, “Prepare breakfast”,“Prepare dinner”and“Get drink”.Sensor data gathered in the Kasteren dataset were tagged with the start time,the end time,sensor ID,and the value of the sensor.Sensor ID is directly given by the dataset and is coded for different numbers and the value of sensors is basically“1”.Behavior data were annotated by the subject himself.Table 3 depicts some records of the dataset as an example.
4.2 Setup
The numbers of different sensors in the Kasteren dataset are unbalanced.The numbers of “Dish washer”, “Microwave” and “Washingmachine” are much less than other sensors.In addition, the corresponding annotated activity of “Washingmachine”is “none”.These infrequent sensor events which are noises for the behavior recognition model were filtered from the sensor sequence to avoid the effect of overly unbalanced dataset on the experimental results.Similarly,the number of the“Prepare dinner”behavior ismuch less than other behaviors and the infrequent behavior was also removed in the phase of data preprocessing.After the above step, there were 11 kinds of sensors that remained in the dataset which were corresponding to 6 kinds of behaviors.We processed the time column where the End time was ignored and the Start time was divided into two columns according to date and specific time.The time features were consequently converted to the standard format and the behavior labels were integrated into the sensor sequence to form the complete labeled data.A sample of preprocessed data is shown in Table 4.For the clustering process of behavior recognition,the number of Kmeans clustering is specified as six, that is, there are six kinds of behaviors to be predicted.The distance was calculated by the self-defined distance formula in Section 3.2.2 and the maximum number of iterations is set to 300.

Table 3.A part of sensor data for the Kasteren dataset.

Table 4.A sample of preprocessed data.
For the training process of behavior prediction, the behavior sequences labeled were divided into a training dataset(80 % of the behavioral data) and a test dataset(20%of behavioral data).The prediction model described in Section 3.3 is performed for the training set and test dataset to predict the behavior at the next moment.To do the training, we use n(the sequence length) behaviors as the input to predict the next behavior.That is, the training examples are the sequences of behaviors,and the label is the next behavior that follows that sequence, being a supervised learning problem.Keras which is a Python Deep Learning library was used to implement the prediction model based on the LSTM networks.Each of the experiments was trained for 100 epochs, with a batch size of 20,using categorical cross-entropy as the loss function.After the 100 epochs,we selected the best model using the validation accuracy as the fitness metric.To validate the effectiveness of our network structure,we performed several experiments on network architecture,optimizer and sequence length.We evaluated different architectures varying the number of fully connected dense layers and LSTMs units.The parameter setup for different network structures is shown in Table 5.

Table 5.Different architectures of LSTM based algorithms.
4.3 Discussion
We adjusted each parameter to the most appropriate value through several comprehensive experiments.The similarity threshold is set to 0.6, and the compression thresholdsCandCvare set to 0.3 and 0.1 respectively.The compression thresholdsCandCvcontrol the way that the behavior patterns are mined.Behavior pattern extraction, clustering, and recognition were carried out for different compression thresholds.By comparing the number of behavior patterns and the accuracy of behavior recognition under different compression thresholds,the influence of compression thresholds on behavior pattern mining can be obtained.The relationship between the number of behavior patterns discovered and the compression threshold as well as the relationship between the number of behavior patterns pruned and the compression threshold is shown in Figure 8.Figure 9 shows the relationship between the recognition accuracy and the compression threshold.
As can be seen from Figure 8, the lower the compression thresholdCis set,the more behavior patterns will be discovered and the number of behavior patterns pruned increases with the increase of compression thresholdC.This is because the lower compression threshold allows relatively infrequent patterns to be included in interesting patterns.Figure 9 shows that when the compression thresholdCis set to 0.3, 0.4,and 0.5 respectively, the accuracy of behavior recognition for the sensor data is the highest and the over-all recognition accuracy of the six kinds of behaviors reaches 89.3%.Referencing the setting of parameters in[21],0.3 is considered to be an appropriate value for the compression thresholdC.
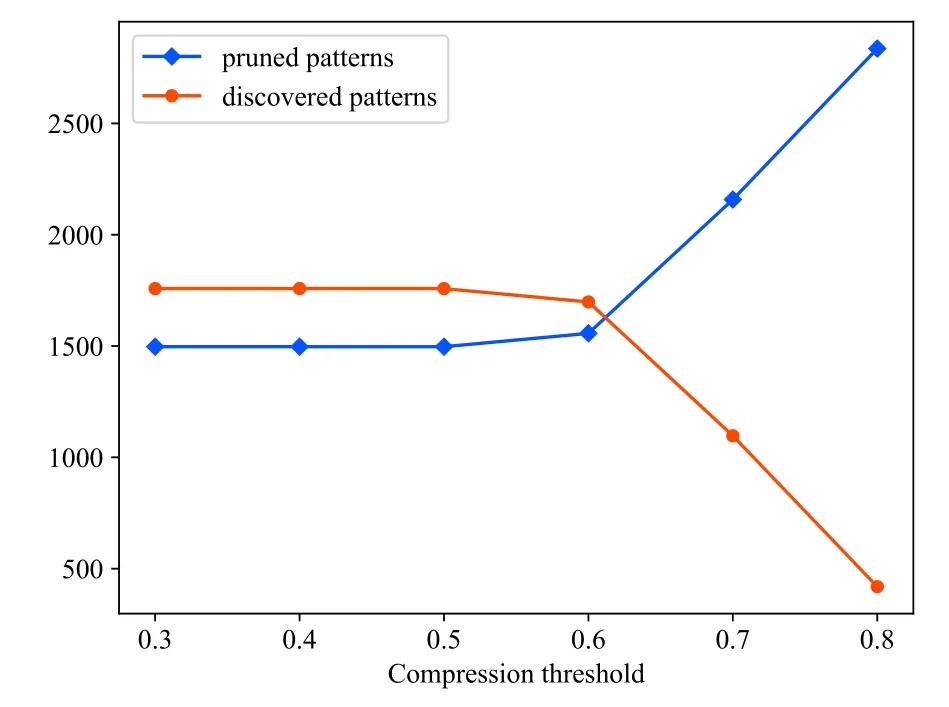
Figure 8.Number of discovered patterns vs.number of pruned patterns.
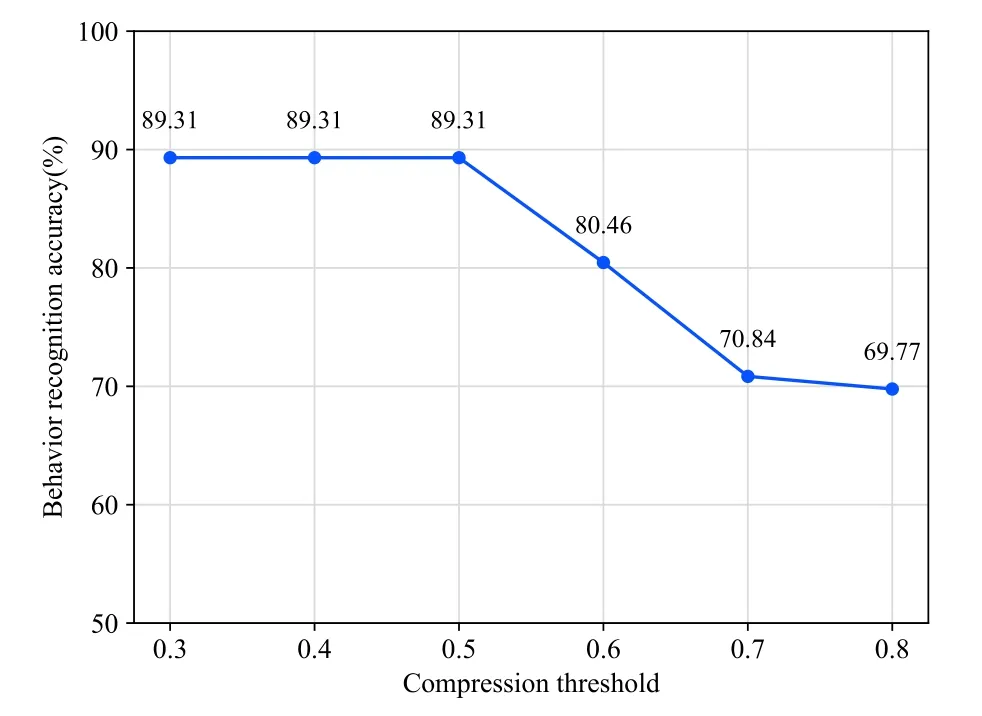
Figure 9.The accuracy of behavior recognition vs.compression threshold.
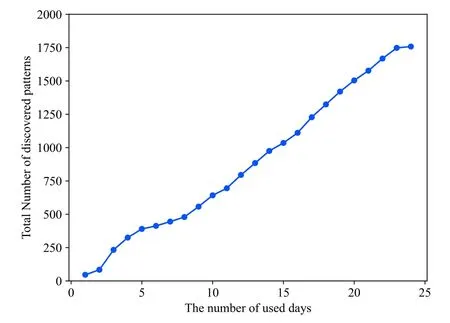
Figure 10.Total Number of discovered patterns vs.the number of used data.
After the compression thresholdCwas set to the appropriate value of 0.3, the frequent pattern mining,clustering,and HMM recognition steps were performed on the dataset.And we also performed an experiment to observe the effect of changing the sensor data used days.The relationship between the total number of behavior patterns mined and the number of used days is shown in Figure 10.The total number of behavior patterns mined increases with the increase of the number of used days, that is, the more days of data are used, the more behavior patterns will be discovered.It is a definite fact that the more days of data used, the greater the amount of data.For example,compared to using the data from the first day, there will be more possibilities to mine behavior patterns of different types and lengths when using the data from the first two days to discover behavior patterns.Therefore, the accumulated number of behavioral patterns mined from the first two days is higher than from the first day.
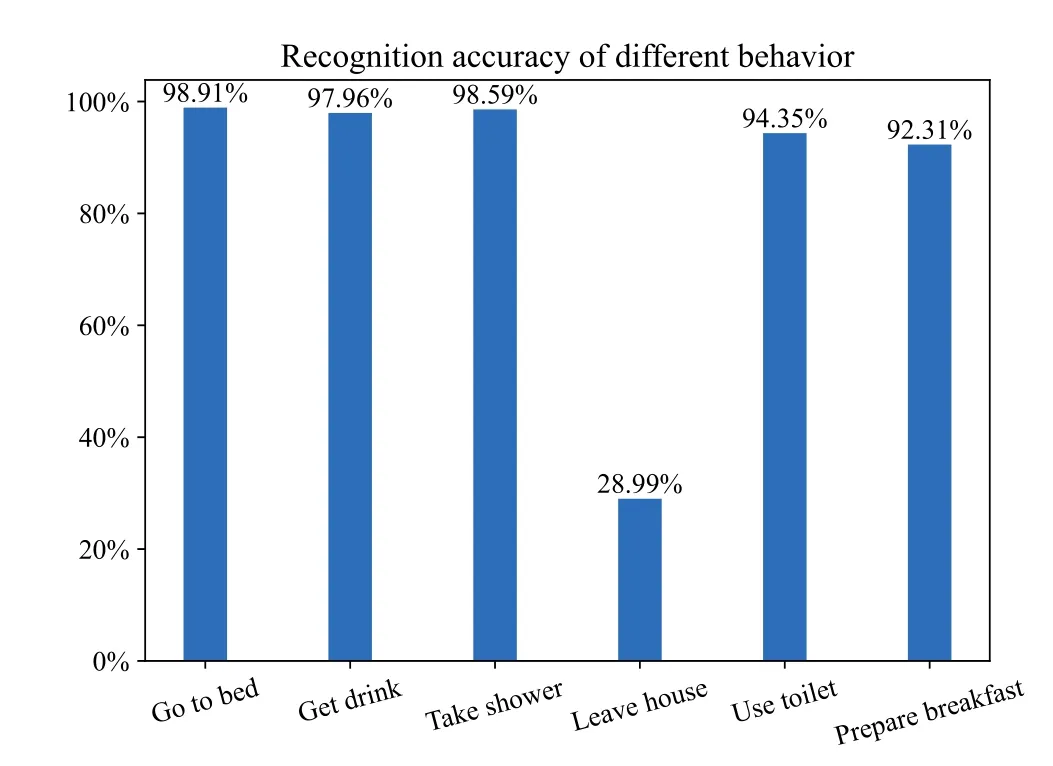
Figure 11.The recognition accuracy for each behavior.
The recognition accuracy of different kinds of behaviors is shown in Figure 11.In addition to the“Leave house” behavior class, the accuracy of other behavior classes (“Go to bed”, “Get drink”, “Take shower”, “Use toilet”, “Prepare Breakfast”) all reach over 92%.The reason for the low recognition accuracy of “Leave house” is that this behavior is easily recognized as “Take shower”.When performing the behavior pattern mining process,the behavior patterns of “Leave house” and “Take shower” are both identified as “Take shower” sometimes.In other words,several behavior patterns of “Take shower” contains not only itself but “Leave house”.Therefore, “Leave house”is easily identified as“Take shower”in the subsequent process of behavior recognition.
We conducted several experiments evaluating the effects of altering the length of input behavior sequence and we focused on the accuracy performance.The sequence lengths are set to 2,4,6,8,10 respectively.The optimization methods used in the neural network such as SGD, AdaGrad, RMSProp, AdaDelta, and Adam optimize the network to obtain better results [37].Thus, various optimization methods were used to optimize the LSTM based model in this work.The results can be compared to identify the best optimizer for the proposed behavior prediction model.In addition,we performed several experiments on network architecture varying the number of fully connected dense layers and LSTMs units to prove the effectiveness of our network structure.The results for the various experiments are shown in Figure 12- 16.Noted that all the experiments use the same number of epochs,same activation function, and same loss as depicted in Table 5.
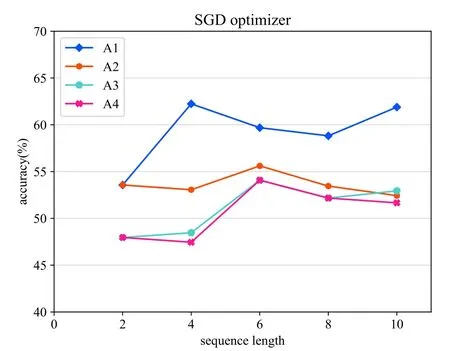
Figure 12.SGD optimizer.
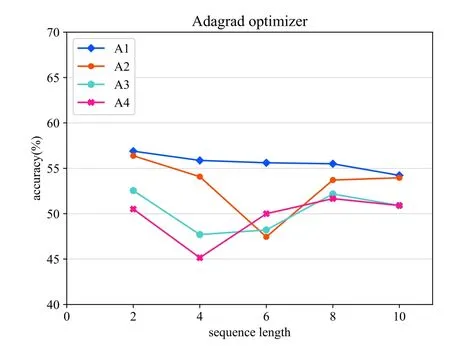
Figure 13.Adagrad optimizer.
In the case of the architecture experiments, adding more units of the LSTM layer(A3) or more densely connected layers (A2) reduces the overall accuracy of the model.As can be seen from Figure 12- 16,compared with other architectures,the proposed architecture(A1) achieves the best performance when the lengths of the input behavior sequences and the optimizer are set to the same.For the optimization experiments,in general,the Adam optimization method achieves the best performance and the Adadelta optimizer’s performance is the poorest based on the results in a comprehensive way.
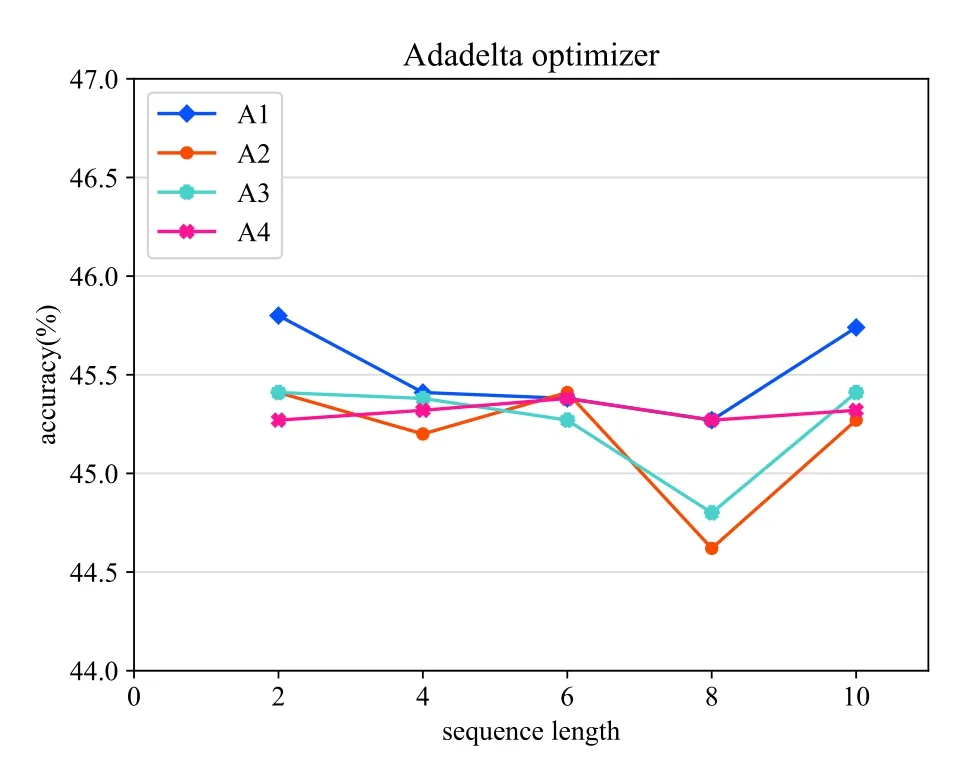
Figure 14.Adadelta optimizer.
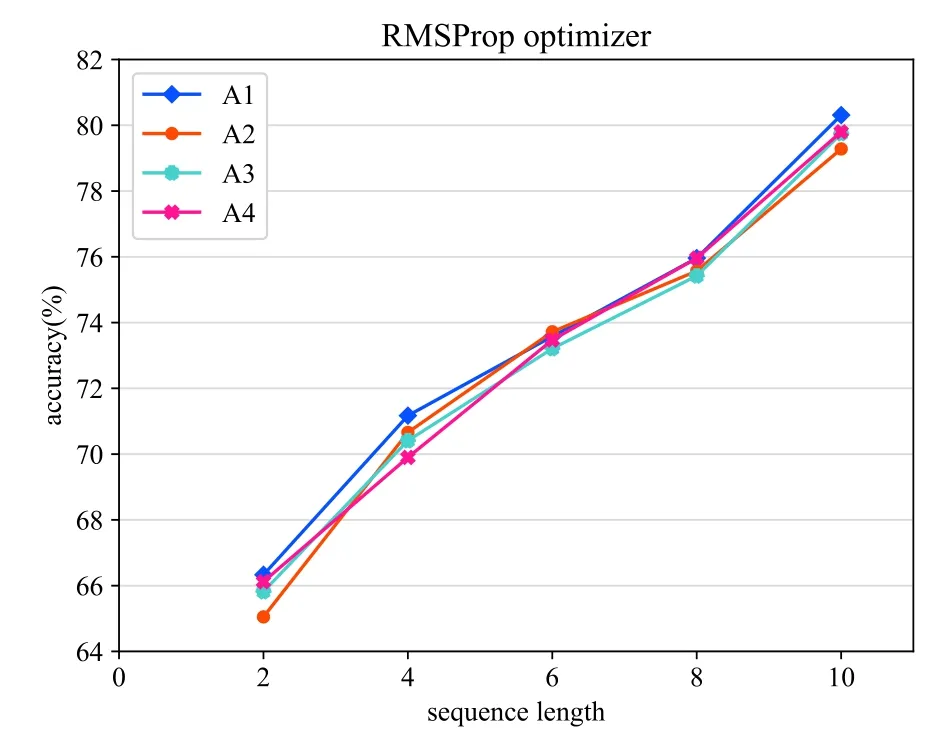
Figure 15.RMSProp optimizer.
With regard to the experiments on the length of the input behavior sequences,we compared the results using the same network architecture which is our proposed architecture.Figure 12 shows that when using SGD optimizer,the prediction model achieves the best accuracy with the input behavior sequence length of 10.As can be seen from Figure 13,applying the Adagrad optimizer reaches the best accuracy when the input sequence length is set to 2.Figure 14 shows that the prediction model used Adadelta optimizer reaches the best accuracy result when the input behavior sequence length is 2.For the results of the evaluation experiment using RMSProp optimizer which can be seen from Figure 15,the best accuracy is performed when the input sequence length is set to 10.In Figure 16,the best result for the proposed predict model used Adam optimizer is obtained when the sequence length is 10.The optimal sequence length is related to several factors,such as the average sensor length of the behavior in each scene.Therefore, in order to achieve the best performance, the value of the sequence length cannot be generalized and should conversely be adjusted in the specific environment.
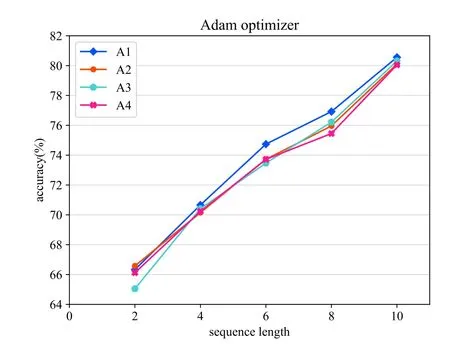
Figure 16.Adam optimizer.
V.CONCLUSION
In the existing smart home scenarios, the labeled behavior datasets which require human intervention are adopted when predicting the user’s behavior.In this paper, we propose a novel automatic annotated user behavior prediction(AAUBP)model which combines behavior mining recognition with behavior prediction to achieve automatic behavior prediction without human intervention.The AAUBP method is composed of three phases that are respectively data preprocessing,behavior pattern mining and recognition,and behavior prediction.Data preprocessing helps improving the ease and efficiency of the mining process.The DVSM algorithm is used to discover and recognize frequent behavior patterns so that automatically mapping the sensor dataset to the behavior dataset and then the predictive model is applied to predict the next behavior.We have applied the AAUBP method on the CASAS dataset.The AAUBP model works effectively and achieved an overall accuracy of 89.3%for behavior recognition after the training of model parameters.The results show that the AAUBP model can automatically and effectively identify the corresponding time-continuous behavior from the real sensor dataset and saves the time and labor cost of behavior annotation.For the annotated behavior dataset, the prediction model based on the LSTM network proposed in this paper has the ability to predict the user’s behavior accurately, which realizes the integration of behavior recognition and behavior prediction in the smart home as well as the further intelligence of the smart home system.
ACKNOWLEDGEMENT
This work was supported by the National Natural Science Foundation of China(62071069).
- China Communications的其它文章
- GUEST EDITORIAL
- Reducing Cyclic Prefix Overhead Based on Symbol Repetition in NB-IoT-Based Maritime Communication
- Packet Transport for Maritime Communications:A Streaming Coded UDP Approach
- Trajectory Design for UAV-Enabled Maritime Secure Communications:A Reinforcement Learning Approach
- Hybrid Satellite-UAV-Terrestrial Maritime Networks:Network Selection for Users on A Vessel Optimized with Transmit Power and UAV Position
- Energy Harvesting Space-Air-Sea Integrated Networks for MEC-Enabled Maritime Internet of Things

