
Role of Intraseasonal Oscillation in a Compound Drought and Heat Event over the Middle of the Yangtze River Basin during Midsummer 2018
2022-09-05 03:05ChuhanLUYichenSHENYonghuaLIBoXIANGandYujingQIN
Chuhan LU, Yichen SHEN*, Yonghua LI, Bo XIANG, and Yujing QIN
1 Key Laboratory of Meteorological Disaster, Ministry of Education, Nanjing University of Information Science & Technology, Nanjing 210044 2 Chongqing Climate Center, Chongqing 401147
ABSTRACT In late July 2018, a compound drought and heat event (CDHE) occurred in the middle of the Yangtze River basin(MYRB) and caused great damage to the national economy.The CDHE over the MYRB has been documented to be linked with intraseasonal oscillations (ISOs) from different regions.However, specific roles of different ISOs on the development of the CDHE cannot be separated in the observational analysis.By using partial lateral forcing experiments driven by ISO in the Weather Research and Forecasting (WRF) model, we found that the midlatitude ISO generated by a westerly wave train in the upper troposphere played an important role in this heatwave and drought event in the northern MYRB, causing a regional average temperature rise of 1.65°C and intensification of drought over 23.49% of the MYRB area.On the other hand, the ISO associated with the Pacific−Japan (PJ)-like teleconnection wave train in the lower troposphere induced a more pronounced impact on the event, causing an average temperature rise of 2.44°C, intensifying drought over 29.62% of the MYRB area.The MYRB was mainly affected by northward warm advection driven by the westward extension of the western North Pacific subtropical high in the early period of the CDHE development.In the late period, because of the establishment of a deep positive geopotential height field through the troposphere leading to intensive local subsidence, there was a remarkable temperature rise and moisture decrease in the MYRB.The results will facilitate a better understanding of the occurrence of CDHE and provide empirical precursory signals for subseasonal forecast of CDHE.
Key words: partial lateral forcing experiment, compound drought and heat event, meteorological drought composite index (MCI), middle of the Yangtze River basin (MYRB)
1.Introduction
The latest sixth Assessment Report of the Intergovernmental Panel on Climate Change (IPCC AR6) documents that global surface temperature has increased faster since 1970 than in any other 50-yr period over the past 2000 years (IPCC, 2021).Among all countries,China has a sensitive and significantly affected area in regard to global climate change, with temperature rising at a rate obviously higher than the global average during the same period.From 1951 to 2020, the annual average surface temperature in China rose significantly at a rate of 0.26°C per decade.In this context, the frequency, intensity and affected area of extreme heatwave events have shown a significantly increasing trend in many places in China (CMA, 2021).At the same time, atmospheric evaporation triggered by high temperature causes an increasing number of compound drought and heat events (CDHEs) in China.Among them, the occurrence probability of CDHEs in the middle of the Yangtze River basin (MYRB), especially in Southwest China, is evidently increasing (Ye et al., 2019; Yu and Zhai, 2020).As CDHEs have been impacting agricultural production and the national economy worldwide (Yuan et al., 2016; Brás et al., 2021), it is of great scientific and actual importance to study the mechanisms of the occurrence of CDHEs and to make reliable predictions.
A recent study showed that regional heatwave events result from both global warming and atmospheric circulation anomalies and that atmospheric circulation anomalies driven by factors such as El Niño-Southern Oscillation (ENSO) are the main cause of regional CDHEs (Zou and Gao, 2007; López-Moreno et al., 2011; Feng et al.,2014; Hao et al., 2019; Qi et al., 2019).In the MYRB, a large-scale atmospheric anomaly caused by the eastward and northward anomaly of the South Asian high (SAH)and the northward anomaly of the subtropical high ridge is one of the main factors for regional CDHEs in this area(Zou and Gao, 2007).The subseasonal atmospheric system is an important factor leading to the continuous circulation anomaly.In southern China and the MYRB, intraseasonal oscillations (ISOs) have proven to be connected to heatwave events and precipitation anomalies (Li et al., 2003; Hong et al., 2021).
The MYRB is one of the places where low-frequency fluctuations from mid-high latitudes and subseasonal fluctuations from tropical areas converge (Qi et al.,2019).At the same time, the CDHEs over the MYRB are influenced by both types of fluctuations (Yang et al.,2014; Wang and Liao, 2015).For example, Gao et al.(2018) revealed that ISOs from mid-high latitudes have imposed an important influence on the occurrence of heatwave events over the MYRB.Huang et al.(2019)discovered that persistent extreme precipitation in the Sichuan Basin has low-frequency characteristics of 15-30 and 30-60 days (mainly 15-30 days) oscillations.This kind of oscillation is mainly generated by the convergence of the 15-30-day low-frequency fluctuation from the low trough east of Lake Baikal and the Okhotsk cyclone in mid-high latitudes and the low-frequency fluctuation from the subtropical high and South China Sea.
One of the key questions in the study of subseasonal continuous CDHEs over the MYRB is the interaction between atmospheric subseasonal fluctuations from different latitudes, and how to distinguish the respective contributions made by ISOs from different latitudes to CDHEs requires further study.Compared with global climate models, regional climate models use dynamical downscaling methods to take local terrain information into consideration and have become an effective way to study subseasonal climate systems (Abhik et al., 2017).By comparing the results of simulations with ISO signals that have specific periods filtered out, numerical simulation manages to quantify the influences that different signals have on regional climate anomalies.For example, Cao et al.(2014) compared the differences in tropical cyclone (TC) generation in the Weather Research and Forecasting (WRF) model with ISO signals in active and inactive periods and found that ISOs can affect TC development through a dynamic process of the interaction of mid- and low-level cyclonic vorticity and the thermal process of convection-circulation-moisture feedback.Ching et al.(2015) used the WRF model and the wavenumber-frequency spectrum analysis method to carry out a series of filtering sensitivity experiments and determined the effects of tropical fluctuations, including MJO and equatorial Rossby waves, on TC development.There have also been studies examining the mechanism of the occurrences of regional extreme events by filtering out ISO signals on different lateral boundaries (Yang and Wang, 2015; Qi et al., 2019).
In mid- and late-July 2018, large-scale continuous high-temperature weather occurred in the mid-lower reaches of the Yangtze River.The area with temperatures over 35°C reached 1.598 × 10⁶km2and that with temperatures over 38°C reached 1.34 × 10⁵km2.Affected by high temperatures, droughts occurred in five provinces, including Fujian, Jiangxi, Hubei, Sichuan, and Guizhou.The area of affected crops reached 7.927 × 10⁵hectares (NDRCC, 2018).Did different ISOs from tropical areas and mid-high latitudes affect the occurrence of this CDHE and how did they occur? How can the contributions made by different ISOs be distinguished? This paper attempts to combine dynamic diagnostic analysis and numerical simulation methods and to discuss the development mechanism of this event.Specifically, referring to the partial lateral forcing (PLF) experiment in WRF designed by Yang and Wang (2015), this paper compares different outcomes produced from a control experiment and sensitivity experiments with ISOs on different lateral boundaries removed to analyze the influences of the ISOs inside and outside the tropical area in different phases of heatwave development.
The following parts of this paper are organized as follows.A description of the datasets and the methodology is provided in Section 2.An overview of the CDHE is given in Section 3.The results of the PLF experiment are analyzed in Section 4.The conclusions and discussion are included in Section 5.
2.Datasets and methodology
The dataset used in this study includes the CN05.1 grid data provided by NCC, which includes daily maximum temperature (Tmax), daily average temperature (Tm), and daily precipitation with grids of 0.25° × 0.25° (Wu and Gao, 2013).We also used ERA5 reanalysis data provided by ECMWF, with grids of 2.5° × 2.5°, 37 pressure levels in the vertical direction, and 4 levels of soil data (Hersbach et al., 2020).
The drought data were obtained from the daily meteorological drought composite index (MCI) station data provided by NCC, and we chose 523 stations in the MYRB and used their respective data for analysis (Fig.1).We calculated the MCI with reference to the Grades of Meteorological Drought 2017 edition (General Administration of Quality Supervision, Inspection and Quarantine of the People’s Republic of China and Standardization Administration of the People’s Republic of China, 2017), and the formula is shown as follows:
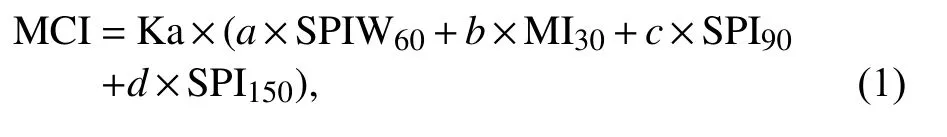
where MI30represents the moisture index for the last 30 days, with the intermediate variable PET (potential evapotranspiration), calculated with the Thornthwaite method (Thornthwaite, 1948); SPI90and SPI150represent the standardized precipitation index for the last 90 and 150 days, respectively; SPIW60is the standardized weighted precipitation index for the last 60 days;a,b,c,anddare weighting coefficients, and in this study,a=0.5,b= 0.6,c= 0.2, andd= 0.1 for Southwest China;and Ka is the seasonal adjustment coefficient, and Ka =1.2 for Southwest China in July.To evaluate the simulation of drought conditions for each experiment, the daily MCI was calculated grid by grid according to the above definition.The drought levels corresponding to different MCIs are shown in Table 1.

Table 1.Different MCIs and their corresponding drought level (General Administration of Quality Supervision, Inspection and Quarantine of the People’s Republic of China and Standardization Administration of the People’s Republic of China, 2017)
In this study, we mainly focus on the MYRB in Southwest China (26°-36°N, 104°-116°E).According to previous studies (Qi et al., 2019), a heatwave event over the MYRB can be identified if there are two consecutive days with area averageTmsurpassing the 95th percentile of the daily climatology (defined over 1981-2010).Moreover, we adopted the following criterion for drought event.If more than 50% of the stations have an MCI less than −0.5 (having a light drought or more severe), a drought event is identified.As a CDHE event has its heatwave event part and its drought event part, in identifying an event, we combined the two criteria together that in any consecutive 7 days, a heatwave event and a drought event happen, a CDHE event is identified, and the start and end dates are determined by the start and end of both events.
Referring to the method by Hong et al.(2021), the ISO component in this study was extracted by first removing the series mean of summer from the ERA5 meteorological reanalysis data and CN05.1 temperature data and then removing synoptic fluctuations by taking a 5-day running mean.
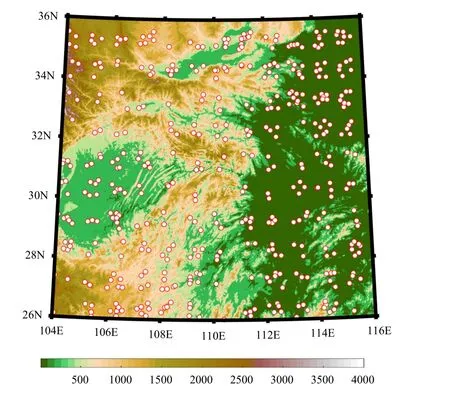
Fig.1.Topography over the study area (26°−36°N, 104°−116°E,shading; m).The dots denote the stations chosen for MCI data.
Wavelet analysis, which is a common tool for diagnosing time-frequency variations of a time series, has the ability to identify the dominant ISO modes (Mao and Wu, 2006).In this study, we used the Morlet as the wavelet basis function and the χ2test for statistical significance to obtain the dominant periodicity of the ISO component.
To examine the propagation of intraseasonal wave trains as the basis for numerical experiments, the TN wave flux was calculated phase by phase at 200 and 850 hPa, and the formulation is expressed as (Takaya and Nakamura, 2001):

whereWdenotes the TN wave flux,Uis the wind velocity, andu¯ andv¯ are the zonal and meridional winds, respectively.The parameter ψ represents the stream function, and the subscript indicates the partial derivative.

To determine the contribution of different physical processes to the development of this event, we calculated the temperature budget at 925 hPa phase by phase.According to a previous study, the temperature tendency is modulated by horizontal temperature advection, adiabatic processes induced by vertical motion, and the atmospheric apparent heat source, and the formulation can be written as (Yanai et al., 1973):where the four terms represent the temperature tendency,horizontal advection of temperature, vertical transport,and diabatic heating, respectively.The first three terms are calculated based on ERA5 meteorological data, and the fourth term is obtained from the first three terms(Wang et al., 2017).In Eq.(3),denotes the static stability withRas the gas constant andcpas the specific heat at constant pressure, andQ1denotes the diabatic heating containing radiative heating, latent heating,surface heat flux, and subgrid-scale processes.
The Weather Research and Forecasting (WRF) model(version 4.0) is used to carry out the simulation and the PLF experiment in this study.WRF-Advanced Research WRF (WRF-ARW) is developed by NCAR’s Mesoscale and Microscale Meteorology Laboratory and has been widely used in regional climate simulations (Skamarock et al., 2019).All experiments were initiated on 7 July and ended on 30 July.According to previous studies on simulations of drought events in Southwest China (Wang and Liao, 2015), the following physical parameterization packages were used: the WRF Single-Moment 3-class(WSM3) scheme for microphysics (Hong et al., 2004),CAM3 (Community Atmosphere Model version 3) longwave and shortwave schemes (Collins et al., 2004), Mellor-Yamada-Janjić scheme for the planetary boundary layer and surface (Janjić, 2002), Noah’s land surface model (Chen and Dudhia, 2001), and Betts-Miller-Janjić cumulus parameterization scheme (Janjić, 1994, 2000).The simulation area approximately covers a region(23°-38°N, 100°-120°E) and with a horizontal resolution of 30 km.The width of the buffer zone was set to five grid points.The model initial and lateral boundary conditions were obtained from the ERA5 dataset with 6-h intervals and 37 vertical pressure levels up to 1 hPa, including geopotential height, horizontal wind, vertical velocity, and specific moisture.The soil data consisted of 4 levels down to a depth of 289 cm underground, and included soil moisture and soil temperature.
To identify the specific roles of the different propagating ISOs in the HW development stage, we introduced PLF experiments and carried out control and sensitivity runs.The boundary forcing and initial field of the control run used real data, while the boundary forcing for the sensitivity run was obtained by removing ISOs from some direction(s) of the original boundary forcing.Based on observational results, we performed three experiments: RMV-N, RMV-SE, and RMV-NSE, representing removing ISOs from the northern, eastern and southern,and all three boundaries, respectively.According to the instructions provided by Dr.Qi Xin, the ISO signals are removed by modifying the wrfbdy file generated in the initialization period.In this file, all the boundary conditions of the four directions throughout the period of the experiment are provided, including wind, temperature,water vapor mixing ratio, etc., and when removing ISO signals from one boundary, all the variables on that boundary should be removed out of ISO.Also, in order to rule out the possible influence from the initial field, we performed 10 extra runs for each of the four experiments using initial fields with some perturbations.The average results of these ensemble runs, which are shown in this paper, were compared to the original run and no obvious deviation was found.The difference between the control run results and the sensitive run results was compared by using the Student’sttest.The physical options and model configuration were kept the same for both the control run and PLF experiments.
3.Overview of the event
A heatwave event with a long duration occurred from 7 to 26 July 2018.During this period, a high temperature of 35°C continuously occurred in the MYRB, especially on the Jianghan Plain, south of the Yangtze River, and Chongqing.From 15 to 30 July, the daily maximum temperature (Tmax) over this area remained above 32.5°C(Fig.2a).Compared with historical data in the same period, the temperature anomaly reached 4°C.The continuous high temperature enhanced the evapotranspiration process, and because of the lack of precipitation during this period, a regional CDHE occurred in the MYRB.According to the drought levels defined by the MCI, over 25% of stations experienced moderate drought (II) during the event.
Through the wavelet analysis of the area average temperature at 2 m (Tm), we found that the fluctuation had a dominant periodicity of 16−30 days (Fig.2b) above the 95% confidence level, which shows an obvious ISO characteristic.To determine the mechanisms of how ISOs affected the occurrence and development of this event, we separated the process into eight phases.Phases 1 and 5 represented the valley and peak phases of the intraseasonal cycle of average temperature.Phase 6 corresponded with the peak of the drought event.When the average temperature reached 25%, 50%, and 75% of its maximum, it denoted Phases 2, 3, and 4, respectively.In this study, we mainly focused on the development stage of the CDHE (Phases 1-6), and we defined Phases 1-3 as the early period of development and Phases 3-5 as the late period.
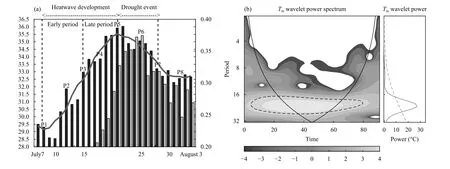
Fig.2.(a) Time series of area-average Tmax (black bars; °C), its 5-day running mean (black line; °C), and the percentage of stations with MCI not larger than −1.0 (having a moderate drought or more serious) (gray bars; %).(b) Wavelet spectrum (left-hand panel) and power spectrum(right-hand panel) for the ISO portion of the Tm anomaly.The dashed line denotes the results that are significant at the 95% confidence level.The solid line denotes the cone of influence, outside which the data are out of consideration.
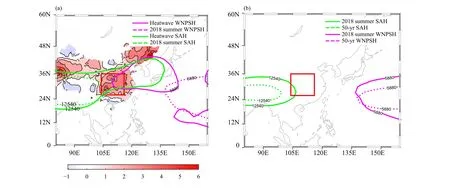
Fig.3.(a) Temperature anomaly (shading; °C) during the heatwave event and the heatwave mean (solid lines) and the 2018 summer mean geopotential height (dashed lines; gpm) at 200 and 500 hPa.Purple (green) lines are the 200- (500-) hPa geopotential height contours at 12540(5880) gpm representing SAH (WNPSH).(b) The 2018 summer mean (solid lines) and 50-yr (1961−2010) mean (dashed lines) geopotential height (gpm) at 200 and 500 hPa.Green (purple) lines are the 200- (500-) hPa geopotential height contours at 12540 (5880) gpm representing SAH (WNPSH).The red box denotes Southeast China.Summer means 1 June to 31 August.
Previous studies have shown that atmospheric circulation anomalies, northward movement of subtropical high ridge lines, and control of stable continental highs suppress convection and lead to high temperatures and less rain (Zou and Gao, 2007).The main systems influencing this CDHE are shown in Fig.3, with the locations of SAH and western North Pacific subtropical high (WNPSH) during the heatwave event and 2018 summer mean.During this event, the SAH extended significantly eastwards compared with its summer mean, and the ridge point could reach 135°E, which covered the MYRB in China, the Korean Peninsula, and southern Japan.At the same time, a strong regional high appeared across the mid-lower reaches of the Yangtze River, East China Sea,and Korean Peninsula, which was favorable for the rise in ground temperature.Comparing the location of the SAH and WNPSH of the 2018 summer mean to that of the 50-yr (1961-2010) mean, we can see that there was no significant movement of the SAH and WNPSH from the aspect of the summer mean, but their affected areas enlarged during the heatwave event, which showed the characteristics of intraseasonal variations.
As shown in Fig.4, after P2 at 200 hPa, a positive geopotential height anomaly gradually formed and was enhanced in Northeast China.In the late period of the event, the MYRB was persistently influenced by the east wind anomaly south of this positive anomaly area.The east wind anomaly conveyed negative vorticity advection to Southwest China and caused the eastward extension of the SAH and its control over the MYRB.At 200 hPa, from the Mediterranean Sea, a series of alternative positive and negative geopotential height anomalies appeared over the Black Sea, east of the Caspian Sea,southwest of the Baikal Sea, Northeast China, and the Northwest Pacific Ocean.Distributed along the midlatitude westerlies near 45°N over the Eurasian continent, the anomalies showed an obvious characteristic of a wave train accompanied by the zonally eastward propagation of the wave flux.The northern MYRB (northern boundary) was clearly affected by this zonal wave train and the positive anomaly in Northwest China.At 850 hPa, in the early period of the event (P1-P2), a positive anomaly arose over the Korean Peninsula and Japan.Under the effect of this anomaly, the southerly and southeasterly winds were prevalent over the MYRB, bringing strong warm advection.During P3-P4, influenced by the eastward migration of the SAH and the strengthening of the anomaly high at 200 hPa, the positive anomaly over the Korean Peninsula extended significantly westward.Meanwhile, a negative geopotential height anomaly formed over the eastern cost of the Philippines, which formed a “negative-positive” dipole anomaly similar to a Pacific-Japan (PJ) pattern.Alongside the dipole anomaly, a northward propagation of wave flux was detected.Due to the extension of the northern positive anomaly toward southeastern MYRB and southeastern lateral boundary, a deep positive anomaly took shape and contributed to regional subsidence.
To further show the evolution of ISO characteristics of this event, we present the 10-30-day ISO component in the upper and lower troposphere in Fig.5.In the upper troposphere, the eastward migrating intraseasonal wave train could be identified roughly along the westerly jet,with a notable anticyclonic anomaly in an eastward wave train migrated from the Balkhash Lake to the north of MYRB gradually.In particular, a negative geopotential height anomaly area can be observed to the northeast of MYRB at 200 hPa in the beginning periods of the event(P1 and P2).At 850 hPa in P2, influenced by an obvious anticyclone anomaly, the area is controlled by southeastern and southwesterly.Taking Fig.6 into consideration,we can see that in this period, the temperature advection brought by the wind anomaly and positive geopotential height anomaly at lower troposphere play a dominant role in temperature budget.In P3 and P4, the positive anomaly enhanced and continued stretching southeastward at 200 hPa and the controlling southerly at 850 hPa maintained.In this period, the favorable conditions for subsidence were formed by the corresponding anticyclone anomaly both in the upper and lower levels, and therefore,adiabatic heating in the temperature budget turned positive and started to become the major contributor of the rising temperature.In the next two phases, the temperature reached the peak and a negative geopotential height anomaly moved eastward arriving the north of MYRB,leading to a decrease of temperature.In correspondence with this, the anticyclone anomaly at 850 hPa turned into a cyclone anomaly.In the final period (P7 and P8), another positive geopotential height anomaly controlled the MYRB at 200 hPa as it moving eastward, and the lowlevel cyclone anomaly remained.Due to this, the temperature dropping halts and area averageTmaxmaintained around 32.5°C instead of returning to its bottom as P1.
4.Evaluation of the CDHE in the control run
In the above sections, we discussed that different ISOs from tropical and extratropical areas participating in the development of a heatwave event, but there is still the question of how the ISO-associated teleconnection over Eurasia in the upper troposphere and the PJ-like signal in the lower troposphere over Northwest Pacific influenced the MYRB.Additionally, we need to know which part of the area they influenced and how much contribution they made the temperature rise and regional drought.To address these problems, we introduced PLF experiments into the study and simulated the atmospheric evolution over the MYRB in the absence of different ISOs.

Fig.4.Temporal evolutions of geopotential height anomalies (shading; gpm) and TN wave flux (vectors; m2 s−2) at (a, c, e, g, i) 200 hPa and (b,d, f, h, j) 850 hPa, and (b, d, f, h, j) wind anomalies (streamlines; m s−1) at 850 hPa during P1-P5.The red box denotes Southwest China.
According to the comparison of the results of the control experiment and reanalysis data (Fig.7a), the control run indicated that the characteristics of the evolution were well captured.The phases in its development were consistent with the observation data, although the amplitude of the temperature was 1-2°C lower than the observation, especially at the peak period of the event.The temporal evolution of MI30was highly consistent with that calculated by observation data, with a notable decrease in values after 17 July, and there was also a decreasing tendency for the regional soil moisture (Fig.7b).Consequently, an obvious characteristic of a regional drought appeared with the increase in the percentage of stations having a light drought or more serious drought after July 17.In particular, stations affected by drought accounted for 55%, with 12% of the stations having a moderate drought on July 26.
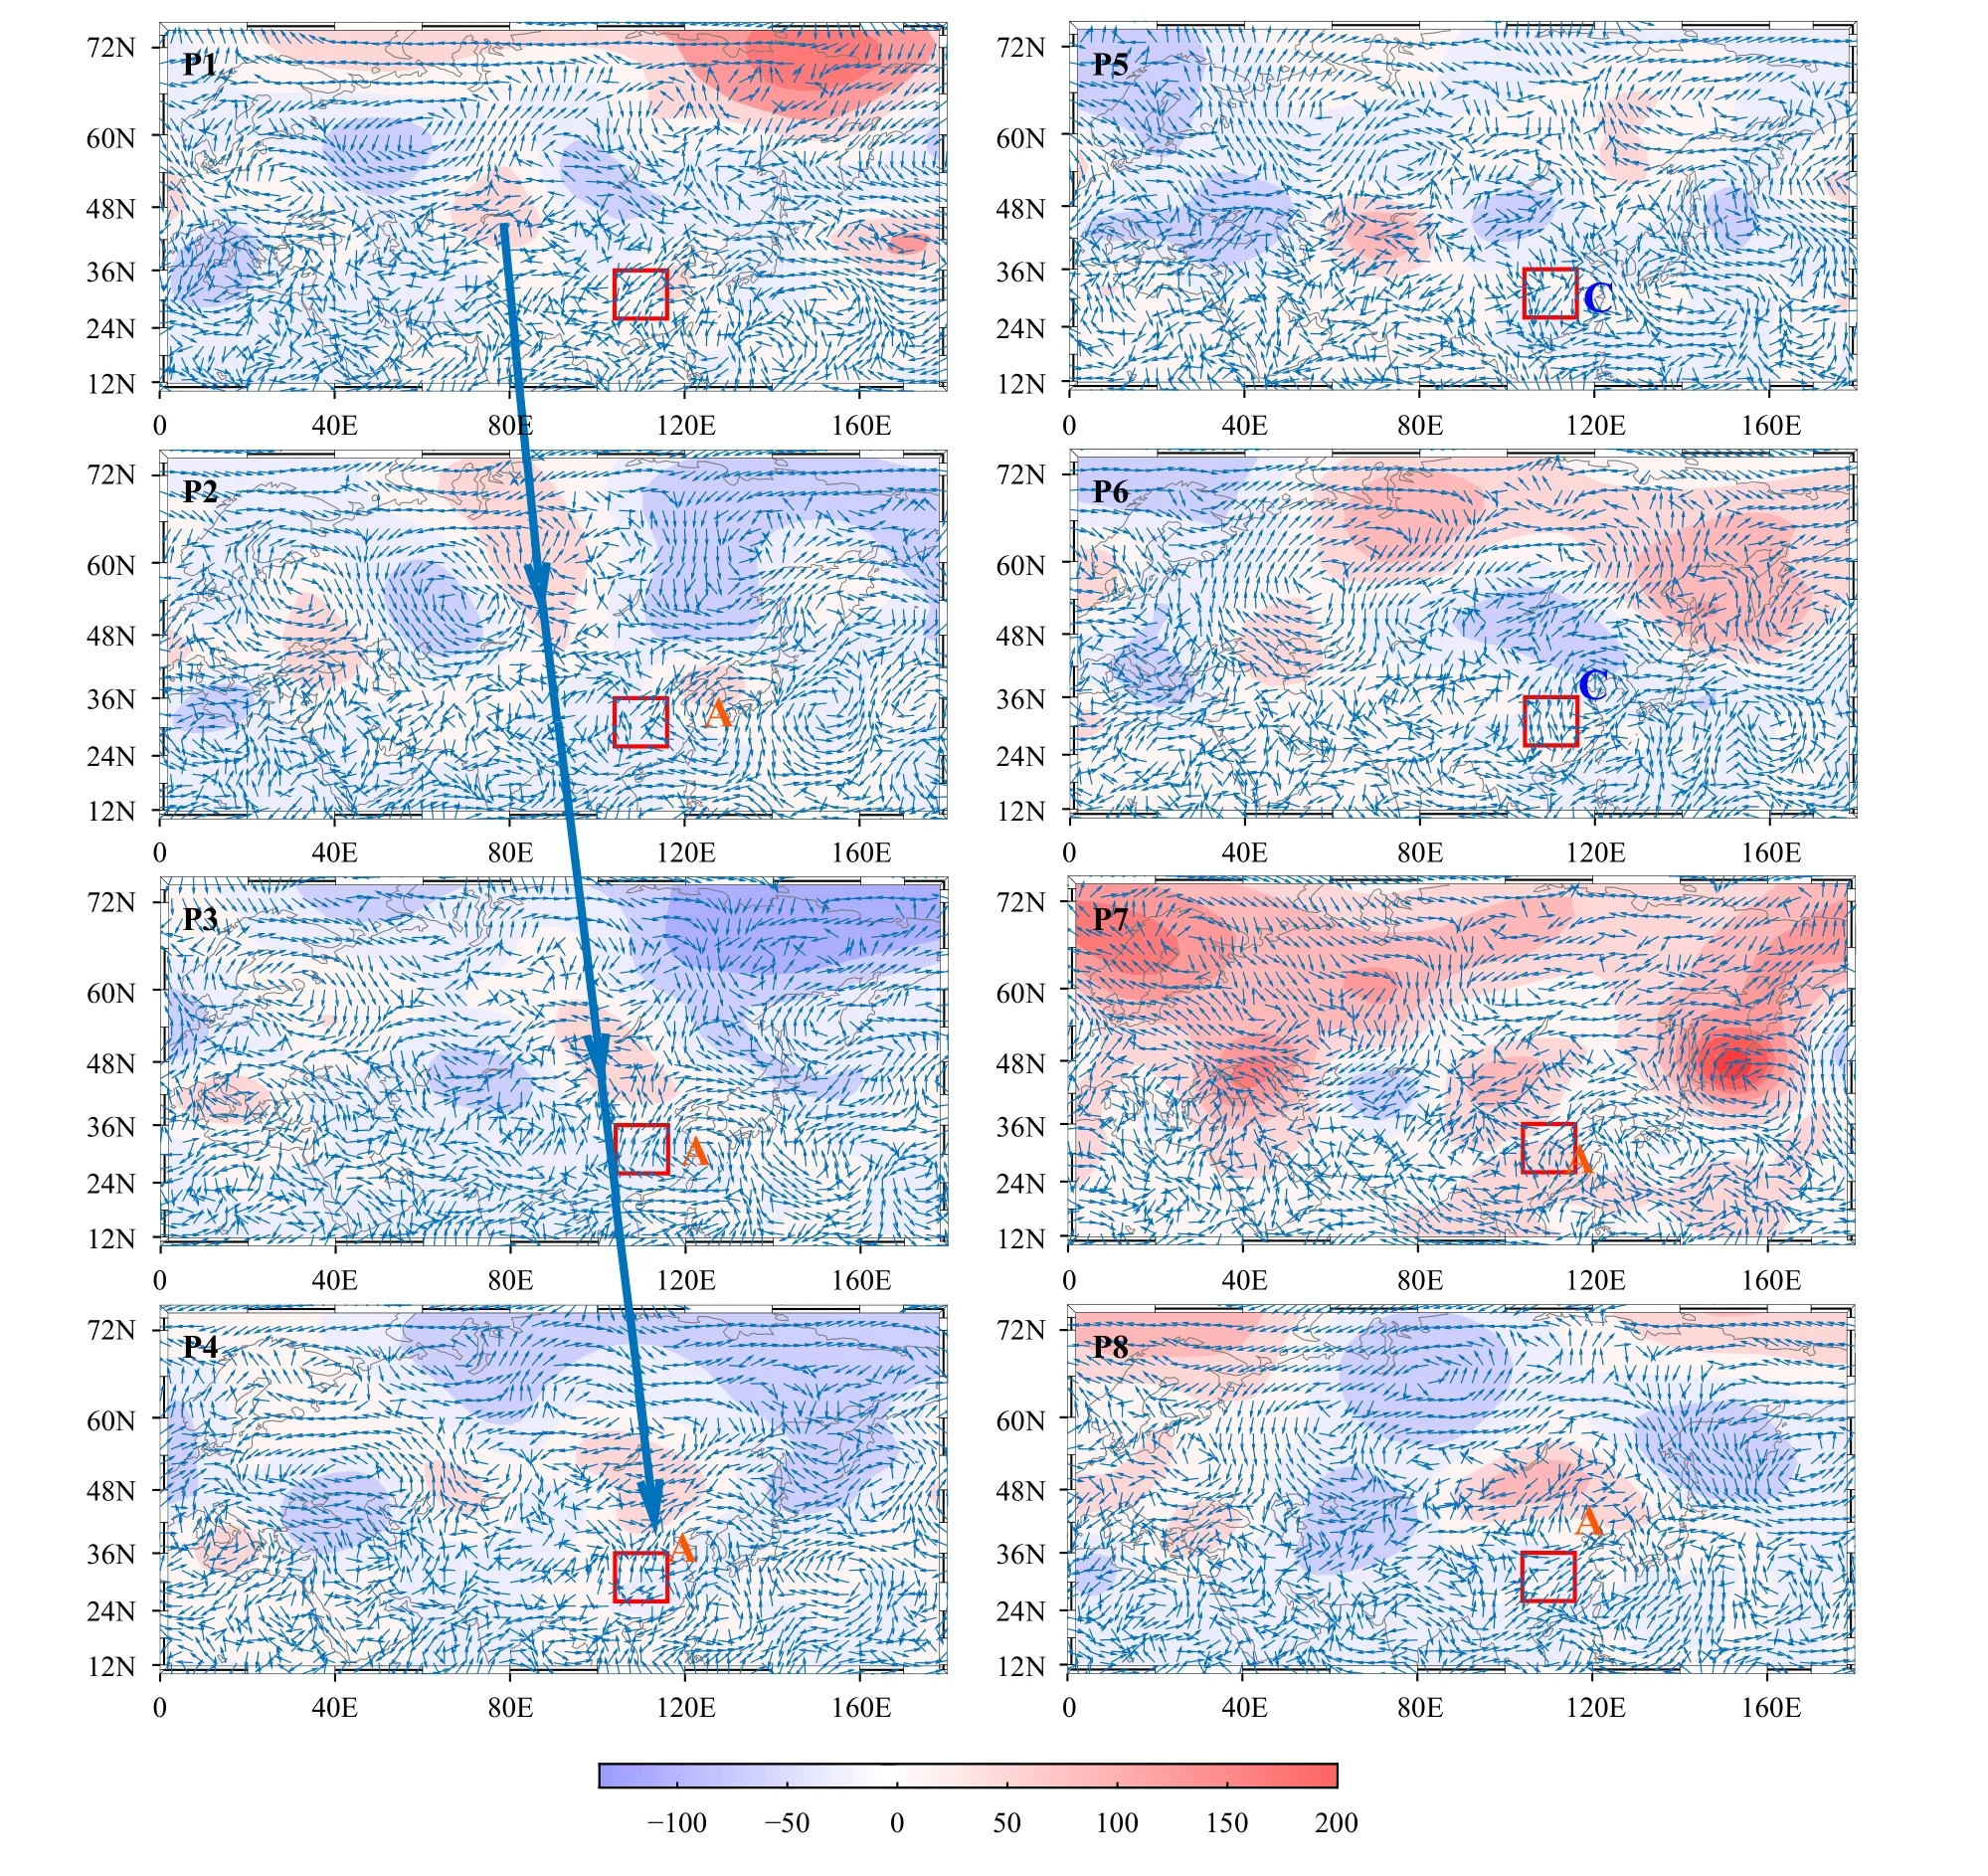
Fig.5.Temporal evolutions of the ISO component of geopotential height (shading; gpm) at 200 hPa and ISO component of wind (vector; m s−1)at 850 hPa during P1-P8.The red box denotes Southwest China.The blue thick arrow indicates the propagation of the positive geopotential height anomaly affecting the MYRB.The letters A and C denote the anticyclone and cyclone wind anomaly at 850 hPa.
As shown in Fig.7c, the heatwave event mainly affected the Sichuan Basin and the plain area to the east.The model demonstrated the high temperature area over 35°C in Sichuan, Chongqing, and the eastern part of the area while weakening the heatwave degree in the southeastern part (Fig.7d).Generally, the core region of the high-temperature distribution and the prevalent wind flow in the control run over the MYRB were consistent with the observational results.
From the changes in soil moisture in each phase (Fig.8), we can see that compared with P1, the moisture decreased notably in P3-P5 except for some areas north of 34°N that had an increasing tendency.Among all, soil moisture in the eastern part tended to decrease most significantly, at a rate of 0.06 m3m−3.The continuous decrease in soil moisture corresponded well with the temporal evolution of MI30, which resulted in regional drought over the MYRB.
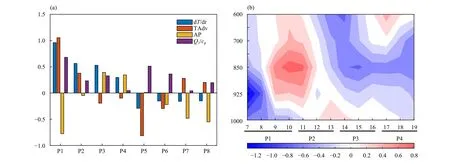
Fig.6.(a) The area average temperature budget terms over the MYRB at 925 hPa during P1-P8.Blue column: temperature tendency; red column: horizontal advection of temperature; yellow column: adiabatic heating; and purple column: diabatic heating (K day−1).(b) Temporal evolution of the temperature advection (shading; K day−1) over the MYRB during P1-P4 .
5.Role of ISOs on the CDHE in the PLF experiments
To quantitatively assess the influence of different ISOs from tropical and extratropical areas, we carried out sensitivity runs including RMV-N, RMV-SE, and RMVNSE, which removed specific ISOs.
According to the comparison ofTmaxbetween the control and sensitivity runs, the area average maximum temperature of all three sensitivity runs declined to some extent, indicating the influence of ISOs on this CDHE.However, the extent to whichTmaxdecreased differed between the three runs.In particular,Tmaxin the RMV-N experiment slightly decreased, with the maximum difference reaching 3°C during 18-24 July.The average temperature difference was 1.65°C during P5.The affected area was concentrated north of 34°N and in the Sichuan Basin, with other parts of the area decreasing modestly(Figs.9a, d).The RMV-SE experiment had a larger affected area and was mainly concentrated in the middle and eastern parts during 17-26 July, with a maximum difference of 4.5°C (Figs.9b, e).The average temperature difference was 2.44°C during P5.As shown in Figs.9c, f, when considering both ISOs from all three lateral boundaries, the RMV-NSE experiment presented the sharpest decline rate in the area average maximum temperature, with the difference averaging 3.47°C during P5 and in some parts reaching 6°C.
Figure 10 shows the changes in soil moisture and MI30between the control and sensitivity runs, which resembles those in regional temperature.Among the three runs, MI30in the RMV-N experiment started to decrease after 18 July.Compared with the control run, after removing the ISO from the northern boundary, MI30increased 0.25 during 18-30 July (Fig.10a).At the same time, the decreasing value in soil moisture in the RMV-N experiment was also notably smaller than that in the control run.Additionally, there were sporadic grid points with reduced drought levels in the entire area in P6,mainly to the east of 110°E in northeastern MYRB.Most grids only had one level reduced (23.49% of total grids)(Fig.10d).In the RMV-SE experiment, both soil moisture and MI30rose significantly.MI30was maintained within 0.75-0.95, and soil moisture increased 0.02 m3m−3after P6 (Fig.10b).This indicates that this drought event was more influenced by the ISO from the southern and eastern lateral boundaries.According to the changes in drought level in P6, most grids in eastern MYRB had one level reduced (29.07% of total grids), and more grids had a two-level reduction (0.55% of total grids).In the RMV-NSE experiment, MI30increased significantly with an increase of 0.6 in the late period of the experiment.The soil moisture also had a greater increase than the other runs with the degree of humidification reaching 0.03 m3m−3(Fig.10c).Simultaneously, most grids had one level reduced in eastern MYRB (39.27% of total grids), and grids with two levels reduced took 4.28% of the total (Fig.10f).
In summary, both the ISO from the northern boundary and that from the southern and eastern boundaries played an important role in CDHE development, while the discrimination between them lies in the fact that the extratropical ISO from the northern boundary mainly influenced northern MYRB.On the other hand, the tropical ISO from the southern and eastern boundaries mainly affected the eastern part and generated a more significant impact and influenced a much wider area than the extratropical ISO.It is worth noting that when considering both of the ISOs from the northern boundary and the southern and eastern boundaries, the impact of the CDHE became more serious, indicating that the interaction between tropical and extratropical ISOs may have contributed to this CDHE.

Fig.7.(a) Temporal evolution of the area average Tmax over Southwest China of the control experiment (blue line; °C) and CN05.1 data (red line; °C); (b) temporal evolution of soil moisture (SMOIS) of ERA5 data (blue line; m3 m−3) and control experiment (red line; m3 m−3), and MI30 of CN05.1 data (yellow line) and control experiment (purple line); (c) CN05.1 average Tmax data (shading; °C) and average ERA5 wind data at 850 hPa (streamline; m s−1) during heatwave event; and (d) average Tmax (shading; °C) and average wind at 850 hPa (streamline; m s−1) of control experiment during heatwave event.The green box denotes Southwest China.MI30 denotes moisture index for the last 30 days.
To further explore how ISOs participated in the formation mechanism of the CDHE, Fig.11a shows the difference between the control and RMV-NSE runs in terms of the temperature budget equation.It shows that during P1,the warm advection triggered by the ISO was the dominant factor in rising temperature.In the late period of heatwave development, vertical transport played a more driven role.Additionally, according to Fig.11b showing the difference in vertical speed, in the late period in the control run over the MYRB, uniform subsidence occurred throughout the whole troposphere, and a large value area of omega appeared in the middle and upper troposphere.In other words, ISOs favored regional subsidence and the associated adiabatic heating.The significant subsidence mentioned was closely linked with the changes in divergence fields in both the upper and lower troposphere(Fig.11c).In the late period, divergence motion emerged below 700 hPa, while strong convergence motion occurred in the upper troposphere.This “pumping effect”physically led to strong uniform subsidence over the MYRB, which was induced by a tropospheric lift in the geopotential height field in the late period.In particular,the troposphere over the MYRB was dominated by a positive anomalous geopotential height distribution (Fig.11d), which was possibly associated with the eastern extension of the SAH caused by the midlatitude wave train.At 500 hPa, due to the westward extension and northward movement of the WNPSH, the geopotential height rose significantly over the MYRB, especially in its middle and eastern parts (Fig.11f).At 850 hPa, there were also significant positive anomalous geopotential heights despite smaller values than those at 200 and 500 hPa.This vertically consistent uplift in the troposphere together with upper convergence and lower divergence resulted in strong regional subsidence in the late period of heatwave development and the occurrence of the CDHE.

Fig.8.(a-d) Differences in soil moisture between P1 and P3-P6 in control run (shading; m3 m−3).The data have been smoothened with convolution using a 3-by-3 kernel.
6.Conclusions and discussion
This study investigated the mechanism of how ISOs from tropical and extratropical areas influenced a CDHE in the MYRB in July 2018.This investigation showed that the midlatitude ISO generated by westerly wave trains in the upper troposphere played an important role in the heatwave and drought event in the northern MYRB.By comparing the results of the control run and PLF experiment with ISOs removed from the northern lateral boundary, we found that the midlatitude ISO from the northern boundary caused an average temperature increase of 1.65°C and intensification of drought in 23.49% of the MYRB.

Fig.9.(a-c) Time series of Tmax averaged in the control run (black line; °C) and sensitivity runs (gray line; °C).(d-f) Differences in the average Tmax (contour; °C) during the heatwave between the control run and sensitivity runs.Slash shadows indicate the significant areas with 95%confidence level.The gray box denotes the location of Southwest China.

Fig.10.(a-c) Time series of soil moisture and MI30 in the control run (plus sign line for MI30 and circle sign line for soil moisture; m3 m−3) and sensitivity runs (dot sign line for MI30 and square sign run for soil moisture; m3 m−3).(b-f) Differences in drought level in P6 between the control and sensitivity runs (shading; gray block means one-level reduction, and black block means two-level reduction).
On the other hand, the ISO resulting from the PJ-like teleconnection wave train in the lower troposphere also impacted the event.By comparing the results of the control run and PLF experiment with the ISO removed from the southern and eastern lateral boundaries, we found that the tropical ISO from the southern and eastern boundaries caused an average temperature increase of 2.44°C and intensification of drought in 29.62% of the area, with the affected area mainly lying in the middle and eastern parts of the MYRB.

Fig.11.Differences between RMV-NSE and control runs in P1-P5 in (a) temperature budget at 925 hPa including temperature tendency (blue),horizontal advection of temperature (red), adiabatic heating (yellow), and diabatic heating (purple; K day−1); (b) horizontal divergence on isobaric surfaces (shading; s−1) with black line indicating horizontal divergence in the control run (lines smoothened by using convolution; s−1); (c) omega on isobaric surfaces (shading; Pa s−1) with black line indicating omega in the control run (lines smoothened by using convolution; Pa s−1); and geopotential height (shading; gpm) at (d) 200, (e) 500, and (f) 850 hPa, with blue line and slash shadows indicating the significant areas with 99% confidence level and yellow line indicating geopotential height (gpm) in control run.The green box denotes Southwest China.
Under the combined effects of ISOs from tropical and extratropical areas, in the early period of heatwave development, the MYRB was mainly affected by northward warm advection driven by the westward extension of the western North Pacific subtropical high.In the late period,because of the establishment of the deep tropospheric positive geopotential height field and associated intense subsidence, there was an increase in temperature and a decrease in moisture in the MYRB.
This paper attempts to quantitatively analyze the impacts of ISOs from different latitudes on local high temperature and drought by designing PLF experiments.However, because of the possible interactions between tropical and extratropical ISOs (Ralph et al., 2011; Wang et al., 2013; Samanta et al., 2016), the total impact cannot be viewed as simply the linear accumulation of different ISO impacts.Therefore, the influence of the interactions between ISOs on local severe weather/climate anomalies deserves further study.In addition, since the western ISO from the Tibetan Plateau could also contribute to high-temperature events over the MYRB (Wei et al., 2021), further research can be conducted on the influence of the ISO from the western boundary and the possible connection and propagation characteristics of the ISO signal from the Tibetan Plateau.
Acknowledgments.We are truly grateful to the two reviewers for providing professional comments and suggestions to this study.The authors would like to thank Dr.Qi Xin from Beijing Normal University for the design of the PLF numerical simulation.
 Journal of Meteorological Research2022年4期
- Journal of Meteorological Research的其它文章
- Cause–Effect Relationship between Meso-γ-Scale Rotation and Extreme Short-Term Precipitation: Observational Analyses at Minute and Sub-Kilometer Scales
- Updated Simulation of Tropospheric Ozone and Its Radiative Forcing over the Globe and China Based on a Newly Developed Chemistry–Climate Model
- Identifying Supercooled Liquid Water in Cloud Based on Airborne Observations:Correlation of Cloud Particle Number Concentration with Icing Probability and Proportion of Spherical Particles
- Heavy Precipitation over the Jing–Jin–Ji Region in Early October: What Controls Its Interannual Variability?
- Height Variation in the Summer Quasi-Zero Wind Layer over Dunhuang, Northwest China:A Diagnostic Study
- Simulations of a Persistent Heat Wave Event in Missouri in Summer 2012 Using a High-Resolution WRF Model