Simulations of a Persistent Heat Wave Event in Missouri in Summer 2012 Using a High-Resolution WRF Model
Lili ZHU, Fengpeng SUN, and Tim LI
1 Key Laboratory of Meteorological Disaster, Ministry of Education (KLME)/Joint International Research Laboratory of Climate and Environmental Change (ILCEC)/Collaborative Innovation Center on Forecast and Evaluation of Meteorological Disasters (CIC–FEMD),Nanjing University of Information Science &Technology, Nanjing 210044, China 2 Department of Earth and Environmental Sciences, University of Missouri–Kansas City, Kansas City, Missouri 64110, USA 3 International Pacific Research Center and Department of Atmospheric Sciences, School of Ocean and Earth Science and Technology, University of Hawaii at Manoa, Honolulu, Hawaii 96822, USA
ABSTRACT An extreme and persistent heat wave event hit Missouri in summer 2012.Current operational forecast models failed to predict such an event at a long lead.The objective of the current study is to simulate this extreme event using a high-resolution Weather Research and Forecasting (WRF) model with eight combined physical (including longwave/shortwave radiation, microphysics, and planetary boundary layer) parameterization packages.Integrated for one month, the model successfully simulates the spatial pattern and temporal evolution of surface air temperature, compared to in-situ observations.The interesting feature is an oscillatory development of the surface air temperature, with a pronounced synoptic timescale.Such a temperature evolution is consistent with the local zonal wind fluctuation,implying the important role of anomalous temperature advection.
Key words: 2012 US summer heat wave, Missouri, model evaluation/performance, parameterization
1.Introduction
Heat waves have gained wide attention among extreme weather events because they have widespread impacts on human health, society, economy, and ecosystems (e.g., Easterling et al., 2000; Luber and McGeehin,2008; Peterson et al., 2013).In many places, such as North America, extreme heat waves are related to morbidity and mortality, and are the leading weather-related killer and more people in the United States die annually from heat waves than from hurricanes, lightning, tornadoes, floods, and earthquakes combined (Pengelly et al., 2007; Peterson et al., 2013).Heat waves and associated droughts can cause problems anywhere, but they are particularly critical in important agricultural regions,such as the US Midwest, which contains some of the most productive farmlands in the world.In the US Midwest, heat waves/droughts can have perilous consequences for the cultivation of crops and the regional economy.
The 2012 US summer heat wave was one of the most severe heat waves in modern North American history.Extreme heat broke thousands of temperature records and resulted in July 2012 as the second hottest month on record for the contiguous United States.During mid-July,the peak of the heat wave, maximum observed temperatures ranged from 35.6 to 40.5°C, with a strong synoptic high-pressure system located over the Northern Plains.In addition, long-term drought conditions also led to dry soil moisture content, which reduced the latent heat cooling of the surface, contributing to further persistent drought that affected large areas of the country and resulted in more than 100 deaths (Hoerling et al., 2014).As seen from the spatial pattern of June-July averaged surface air temperature anomalies in 2012 (Fig.1), the positive anomalies covered the whole US Midwest.Most of Missouri was covered with positive temperature anomalies exceeding 2°C.
Current operational models failed to predict extreme,long-persisting heat wave events like the one in summer 2012 (Hoerling et al., 2014; Wang et al., 2014).To accurately predict a regional extreme event, a high-resolution regional weather and climate model is typically required.However, such a high-resolution regional model requires substantial computational source, and consequently the high-resolution regional model can only be applied for short-range (typically 3-5 days) forecast.
The objective of the current study is to conduct longterm (30 days) simulations of the 2012 summer heat wave event with a focus in Missouri using the Weather Research and Forecasting (WRF) model.As simulated surface air temperature associated with heat waves is greatly affected by model radiation, microphysics, and planetary boundary layer (PBL) parameterizations, we will particularly examine the impact of model physical parameterization schemes on the forecast skill.It is practically useful to reveal the best choice of the combined physical parameterization schemes in capturing the extreme heat wave event.In addition, we will pay a special attention to the thermal difference between city and rural area and associated diurnal cycles relevant to the urban heat island (UHI) effect, which typically exacerbates heat-related morbidity and mortality for those living in the cities.
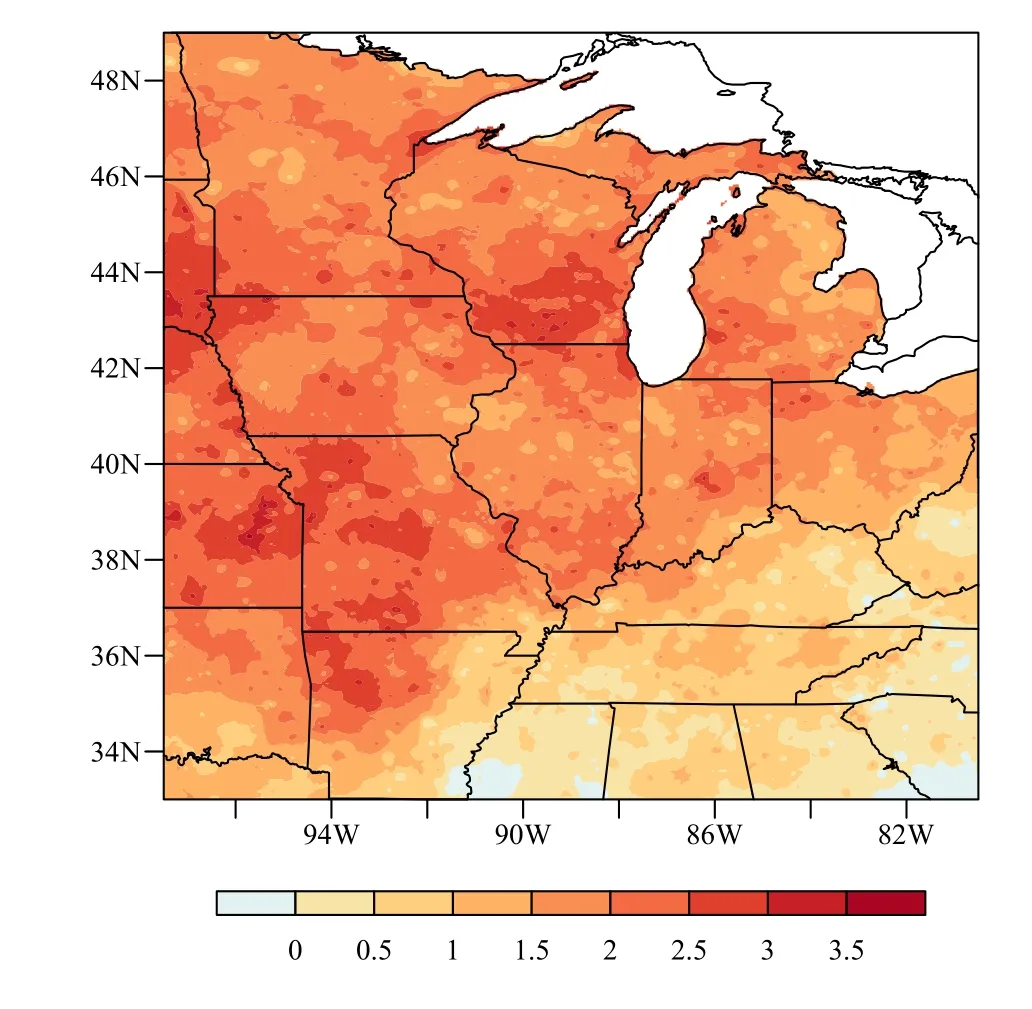
Fig.1.June-July surface air temperature anomaly (°C) over the US Midwest in 2012 relative to the 1981-2010 climatology.
The remaining part of this paper is organized as follows.Section 2 introduces the model configuration, experimental design, and validation datasets.Simulated temperature evolution features and the overall skill assessment of the model performance with different combined physical parameterization packages are described in Section 3.In Section 4, we further analyze the UHI effect in the Kansas City Metropolitan Area in Missouri and the diurnal variation during the extreme event in the presence of the best choice of the physical parameterization package.Finally, the conclusions are presented in Section 5.
2.Data and methods
2.1 Model and experimental design
This study used the WRF model version 3.9.1.1(Skamarock et al., 2008), a fully compressible, nonhydrostatic model that uses a mass-based terrain-following vertical coordinate, to simulate this extreme weather event continuously for a one-month period (from 11 June to 10 July 2012).Three nested domains for the simulations are shown in Fig.2a.The outermost domain has a coarse resolution of 9 km and is centered at Kansas City,Missouri (39°N, 94.5°W).The middle domain covers roughly the entire state of Missouri at a horizontal resolution of 3 km.The innermost domain uses a fine resolution of 1 km to resolve the Kansas City Metropolitan Area and surrounding rural regions.A total of 44 sigma levels from the surface to 100 hPa are used, with the highest resolution near the surface to provide a better representation of surface and boundary layer processes.The initial and lateral boundary conditions are from NCEP North American Regional Reanalysis (NARR;Mesinger et al., 2006) at a horizontal resolution of 32 km.The land-use data are taken from the Moderate Resolution Imaging Spectroradiometer (MODIS) land-use dataset.Model outputs are saved every 6 hours.

Fig.2.(a) Three nested WRF domains (d01, d02, and d03) at horizontal resolutions of 9, 3, and 1 km.Topography (m) is shown in color.(b)WRF resolved topography of the innermost 1-km resolution domain.Red dots indicate the locations of stations used for validation.
The WRF model offers a suite of physical parameterization options that can be combined in many ways.Given that near-surface air temperature simulation is mostly sensitive to the model longwave/shortwave radiation,planetary boundary layer (PBL), and microphysics schemes, a total of eight experiments were designed with combinations of the microphysics, radiation, and PBL schemes.Table 1 lists the eight experiments.The following physical schemes are particularly examined: WRF Single-Moment 6-class (WSM6) microphysics scheme(Hong and Lim, 2006), Thompson microphysics scheme(Thompson et al., 2008), Rapid Radiative Transfer Model(RRTM) longwave radiation scheme (Mlawer et al.,1997) in combination with the Dudhia shortwave radiation (Dudhia, 1989), Rapid Radiative Transfer Model for GCMs (RRTMG) radiation scheme (Iacono et al.,2008), Mellor-Yamada-Janjić (MYJ) PBL scheme(Janjić, 1994), and Mellor-Yamada-Nakanishi-Niino level-3 (MYNN3) PBL scheme (Nakanishi and Niino,2006).Other physical parameterization schemes, such as the Eta surface layer scheme (Janjić, 1994), Noah land surface model (Chen and Dudhia, 2001), and Kain-Fritsch (KF) cumulus scheme (Kain, 2004) were kept same in all simulations.Note that no cumulus parameterization was used in the innermost 1-km domain, as convection was explicitly simulated at the fine grid.

Table 1.List of experiments (Exp) with different schemes
The WSM6 and Thompson schemes prognose the mixing ratios of water vapor, cloud water, cloud ice, rain,snow, and graupel.In addition, the Thompson scheme has the double-moment cloud ice variable and predicts the number concentration of cloud ice.The RRTM and RRTMG longwave radiation schemes both interact with resolved clouds, while only RRTMG includes interactions with trace gases and aerosols.The Dudhia scheme is a simpler option than RRTMG shortwave radiation scheme including interactions with aerosols, ozone, carbon dioxide, and other trace gases.The MYJ scheme is a local turbulent kinetic energy (TKE), 1.5-order closure scheme, while the MYNN3 is a local TKE, 2.0-order closure scheme.
2.2 Validation datasets
Local Climatological Data (LCD) hourly observations obtained from the National Centers for Environmental Information (NCEI) are used here to evaluate model’s simulation skill.The LCD dataset provides surface meteorological observations including air temperature and relative humidity.Observations are taken from 6 selected LCD stations (red dots in Fig.2b): (1) Kansas City Downtown Airport (MKC; WBAN: 13988), (2) Kansas City International Airport (MCI; WBAN: 03947), (3)Lee’s Summit Municipal Airport (LXT; WBAN: 53879),(4) Lawrence Municipal Airport (LWC; WBAN: 03997),(5) Olathe Johnson County Executive Airport (OJC;WBAN: 03967), and (6) Olathe Johnson County Industrial Airport (IXD; WBAN: 93909).To compare model values with the LCD point measurements, the model data are interpolated to the LCD sites using the nearest grid point technique.
In addition, the Parameter-elevation Regressions on Independent Slopes Model (PRISM) gridded dataset(Daly et al., 2008) is also used for model validation.The PRISM dataset calculates a linear climate-elevation regression for each digital elevation model (DEM) grid cell, and stations entering the regression are assigned weights based on several factors including distance, elevation, coastal proximity, topographic facet orientation,vertical atmospheric layer, topographic position, and orographic effectiveness of the terrain.The PRISM dataset provides daily temperature, dew point temperature, and precipitation fields at a horizontal resolution of 4 km,comparable to the grid spacing used in the simulations.The PRISM data are bilinearly interpolated to the WRF innermost domain for point-to-point spatial comparison.
3.Results
3.1 Comparison with the LCD observations
The results are evaluated againstin-situmeasured surface air temperature and relative humidity.Table 2 shows the average root-mean-square error (RMSE) for all six stations between the simulations and measurements.For 2-m surface air temperature, the Thompson-RRTMGMYNN3 experiment has the smallest RMSE followed closely by the Thompson-RRTM&Dudhia-MYNN3 and WSM6-RRTM&Dudhia-MYNN3 experiments.The combinations with MYNN3 present lower RMSE, meaning better performance than those with MYJ.
For 2-m relative humidity, the Thompson-RRTMGMYNN3 experiment performs the best with respect to RMSE.Again, the simulations with the MYNN3 scheme produce lower RMSE than those with the MYJ scheme.It is thus concluded that the Thompson-RRTMGMYNN3 experiment is the best combination scheme compared to the station data.
One way to check whether the model simulations capture the observed temperature and relative humidity fluctuations is to compare the RMSE values to the standard deviations ofin-situmeasured surface air temperature and relative humidity averaged over these stations.Our calculation shows that they are 5.54°C and 17.36%, respectively.These values are much greater than the RMSE values listed in Table 2, indicating that the simulations are capable of reproducing the observed temperature and relative humidity evolutions.
3.2 Comparison with the PRISM data
The spatial distribution of simulated surface air temperature averaged during the entire one-month period is evaluated in Fig.3 against the PRISM data.In all WRF simulations, the mean 2-m temperature field averaged over the simulation period displays a consistent horizontal distribution, with the highest temperature in the Kansas City Metropolitan Area.This pattern compares well to the PRISM data.
Most of the simulations overestimate the warming intensity.The amplitude of simulated near surface warming is sensitive to the choice of PBL scheme.The combinations with MYJ produce higher temperature than those with MYNN3.The performance of each different experiment in simulating surface air temperature is compared based on RMSE and pattern correlation coefficient(PCC) in Table 3.The WSM6-RRTMG-MYNN3 experiment has the smallest RMSE, followed closely by the Thompson-RRTM&Dudhia-MYNN3 and Thompson-RRTMG-MYNN3 experiments.Consistent with the comparison againstin-situmeasured surface air temperature, the simulations with the MYNN3 scheme produce lower RMSE than those with the MYJ scheme.While there are clear differences in the warming amplitude, all simulations show similar PCCs of the mean 2-m temperature compared to the PRISM data.The WSM6-RRTM&Dudhia-MYNN3 experiment turns out to have the highest PCC, followed closely by other experiments.

Table 3.RMSE and PCC of the mean simulated surface air temperature (°C) compared with the PRISM data over the innermost domain(d03)
Figure 4a shows the time evolutions of daily 2-m temperature averaged over the innermost domain for all experiments.All the simulations reproduce a similar temporal fluctuation, in good agreement with the PRISM data.It is obvious that the simulations with the MYJ scheme (solid color lines in Fig.4a) produce generally higher surface air temperature than those with the MYNN3 scheme (dashed color lines in Fig.4a).
It is worth mentioning that the area-averaged surface air temperature in the region does not show a continuous increase, rather an oscillatory growth.The average oscillation period is around 4-5 days.This implies that the warming was an accumulated effect of a number of synoptical-scale disturbances.The temperature evolution is consistent with that of the area-averaged 925-hPa zonal wind, which displays a similar temporal fluctuation (Fig.4b).In fact, the correlation coefficient between the ensemble means of the 2-m temperature and 925-hPa zonal wind time series is 0.58, which exceeds a 95% confidence level.As seen later, there was a clear background zonal temperature gradient in the region during the period.This implies that anomalous zonal temperature advection associated with the synoptic-scale wind perturbation contributed greatly to the observed temperature oscillatory development.

Fig.3.Spatial distributions of the time-mean surface air temperature (°C) over the innermost domain (d03) derived from (a) the PRISM data and (b-i) numerical experiments with different physics parameterization schemes.Note that the 4-km resolution PRISM data are bilinearly interpolated to 1-km resolution WRF for comparison.
The examination of temporal evolutions of the simulated vertical velocity averaged in the innermost domain(d03) showed that there was weak descending motion in the middle troposphere during the later integration period.This suggests that adiabatic warming due to the subsidence might play a role in the later period.However, the temporal correlation between the simulated surface air temperature and the mid-tropospheric vertical velocity during the entire period is weak (−0.18), which is statistically insignificant.

Fig.4.Time series of (a) simulated daily surface air temperature (°C) and (b) 925-hPa zonal wind (m s−1) with different physics parameterization schemes, averaged over the innermost domain (d03).The black curve in (a) denotes the counterpart from the PRISM.
The simulated 30-day-average surface air relative humidity is validated against the PRISM data in Fig.5.All simulations display a similar spatial pattern, with the low relative humidity in the Kansas City Metropolitan Area where temperature is the highest across the domain as shown in Fig.3.The simulated 2-m relative humidity is also sensitive to the choice of PBL scheme.The combinations with MYJ produce lower surface air relative humidity than those with MYNN3.Table 4 shows the RMSE and PCC of the simulated 2-m mean relative humidity compared with the PRISM data.The WSM6-RRTM&Dudhia-MYJ experiment has the lowest RMSE,followed closely by the Thompson-RRTMG-MYNN3 and Thompson-RRTM&Dudhia-MYJ experiments.

Table 4.As in Table 3, but for the mean simulated surface air relative humidity (%)
Different from the comparison againstin-situmeasured surface air relative humidity, most simulations with the MYNN3 scheme produce higher RMSE than those with the MYJ scheme, except the Thompson-RRTMGMYNN3 experiment.All experiments show similar PCCs of the mean 2-m relative humidity compared to the PRISM data.The WSM6-RRTM&Dudhia-MYNN3 experiment has the highest PCC, followed closely by other experiments.Compared to the temperature, precipitation is more difficult to capture.Figure 6 presents spatial distributions of the 30-day accumulated precipitation from the PRISM and all WRF simulations.It is clearly seen that there are substantial cross-configuration variations and most of the configurations tested overestimated the total precipitation by PRISM.Most of the simulations also failed to capture the mean precipitation pattern.It is noteworthy that the statistical regression-based PRISM dataset has a relatively coarse resolution of 4-km compared to the model resolution in the domain d03, which might inadequately underestimate precipitation intensity and homogenize its spatial distribution.By eye, one can see that the most reasonable simulation compared to PRISM is from the Thompson-RRTMG-MYNN3 experiment.
Table 5 shows the RMSE and PCC of the accumulated precipitation between the simulations and the PRISM data.Indeed, the Thompson-RRTMG-MYNN3 experiment shows the lowest overall errors in both the RMSE and PCC, followed by the Thompson-RRTM&Dudhia-MYJ experiment.Thus, the Thompson-RRTMGMYNN3 experiment presents the best precipitation simulation.
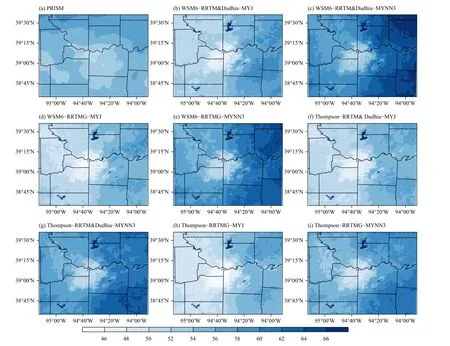
Fig.5.As in Fig.3, but for the time-mean surface air relative humidity (%).

Table 5.As in Table 3, but for the simulated total accumulated precipitation (mm)
The RMSE values in Tables 3-5 represent the spatial pattern biases of the time-mean fields between the simulations and the PRISM data.To reveal how well the experiments capture the observed temporal evolutions derived from PRISM, we calculated the temporal standard deviations of the PRISM and the model RMSEs averaged over the domain d03 (Table 6).The area-averaged standard deviations of the surface air temperature, relative humidity, and precipitation derived from PRISM are 3.30 °C, 8.99 %, and 7.34 mm, respectively.Comparing them with the model RMSE counterparts, it is clear that the model simulations are to a large extent capable of reproducing the observed 2-m air temperature and relative humidity temporal fluctuations, but are much less so in capturing the observed precipitation variation.
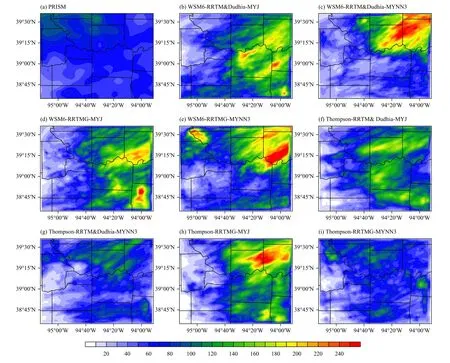
Fig.6.As in Fig.3, but for the accumulated precipitation (mm).

Table 6.Area-mean RMSEs of the simulated daily 2-m air temperature (T2; °C), 2-m relative humidity (RH2; %), and precipitation (PR;mm) compared with the PRISM data averaged over the innermost domain (d03)
To illustrate the large-scale environmental conditions associated with the month-long heat wave event, Fig.7a shows the simulated 850-hPa temperature and wind in the outermost domain (d01) averaged for the entire integration period.All the simulations show a remarkably consistent large-scale pattern, with pronounced southwesterly winds that advect warm air into the region.The temperature fields exhibit a zonal distribution characteristic, with higher (lower) temperature in the west (east).The persistent warm advection maintained and enhanced the heat wave in the region.
Figure 7b further shows the horizontal patterns of 500-hPa geopotential height anomalies relative to the 1981-2010 climatology in d01, averaged over the integration period.Note that the 1981-2010 climatology here is calculated from NARR, from which model initial and boundary conditions are derived.The presence of positive 500-hPa geopotential height anomalies during the entire period implies a persistent descent in the region,which is consistent with the observations described in Hoerling et al.(2014) and PaiMazumder and Done(2016).The positively anomalous 500-hPa geopotential height over the Great Plains and Midwest in June inhibited the southward penetration of cold fronts from the north (Hoerling et al., 2014; PaiMazumder and Done,2016), leading to continuous warming.
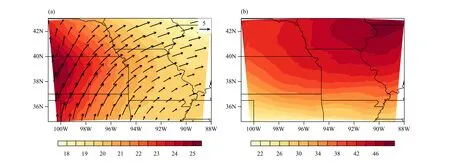
Fig.7.Composite horizontal distributions over the outermost domain (d01) of (a) simulated 850-hPa air temperature (shading; °C) and wind(vector; m s−1) and (b) 500-hPa geopotential height anomalies (m) relative to the 1981-2010 climatology averaged during the entire integration period, derived from all the sensitivity experiments.
To rank the model’s performance against the PRISM data, a combined skill score that includes all three variables (2-m air temperature, 2-m relative humidity, and precipitation) is defined.Each of the statistics has values ranging from 1 for the worst (the highest RMSE or lowest PCC) to 8 for the best, so the scores for each of the three given variables range of 2-16.The physics combination of Thompson-RRTMG-MYNN3 is ranked highest with the combined statistics of 2-m air temperature, 2-m relative humidity, and precipitation equally weighted to give a score out of 48 (Table 7).Therefore, the current long-term simulations provide a practical guidance for the best choice of the physics packages in reproducing the observed extreme heat wave event.It demonstrates that real-time operational forecast of such a long-persistent extreme event at a one-month lead is possible as long as realistic lateral boundary conditions from a global model are available.

Table 7.Skill scores for each statistic of 2-m air temperature, 2-m relative humidity, and precipitation, and the overall scores of all experiments
4.Urban heat island (UHI) effect and diurnal cycle
The phenomenon of UHI refers to a higher temperature in urban areas, compared with that in their surrounding rural and suburban areas (Oke, 1982; Rizwan et al.,2008).In some metropolitan regions, the UHI effect is preeminent, with intensity exceeding 10°C (Huang et al.,2005).In this section, we will examine the Kansas City Metropolitan Area UHI effect and its diurnal variation based on the best simulation with the combined Thompson-RRTMG-MYNN3 physical package.
The Kansas City Downtown Airport station is chosen to represent the urban area of Kansas City, while the Olathe Johnson County Industrial Airport station, which is about 30 miles to the southwest of the Downtown Airport station, represents the non-urban area.As seen in Fig.8a, the difference of simulated surface air temperature between the urban and non-urban areas at night is larger than that during the daytime.With the intensification of the heat wave in the later period (late June to early July),the model simulates a greater UHI effect at night in the Kansas City Metropolitan Area.In the daytime, the simulated 2-m temperature does not show a significant difference between the urban and non-urban areas.The temperature in the urban area at some time is even slightly cooler than that in the non-urban area (Fig.8b), forming an “urban cool island.” This agrees with the theory of UHI formation and the UHI diurnal variation, partially due to the higher thermal inertia in urban areas than rural areas (Oke, 1982).In general, the simulation successfully reproduced the region’s UHI effect.
In addition to the UHI effect, the simulation also captures the diurnal variation of 2-m air temperature, as seen from Fig.8a.A scatterplot comparison of surface air temperature from LCD observations and the simulation is shown in Fig.9.It is clearly seen that most of the red circles (representing 1800 UTC, corresponding to 1200 LST) lie above the diagonal (i.e., the black line).This implies that the simulation overestimated slightly the 2-m air temperature at noon (1200 LST).In general, the WRF simulation agrees well within-situmeasurements with an RMSE in the range of 1.5-2.6°C for all times of day.The RMSE is largest at noon (1200 LST), while the simulation performs the best at 0600 LST.Table 8 displays the mean diurnal variations of simulated 2-m air temperature in the urban and non-urban stations and their difference.As expected, the temperature difference is generally larger at nighttime than during the daytime.The maximum of the temperature difference between urban and non-urban stations happens at 0000 LST, and the minimum at 1200 LST.

Table 8.Mean diurnal variations of simulated urban and non-urban surface air temperature (°C) and their difference
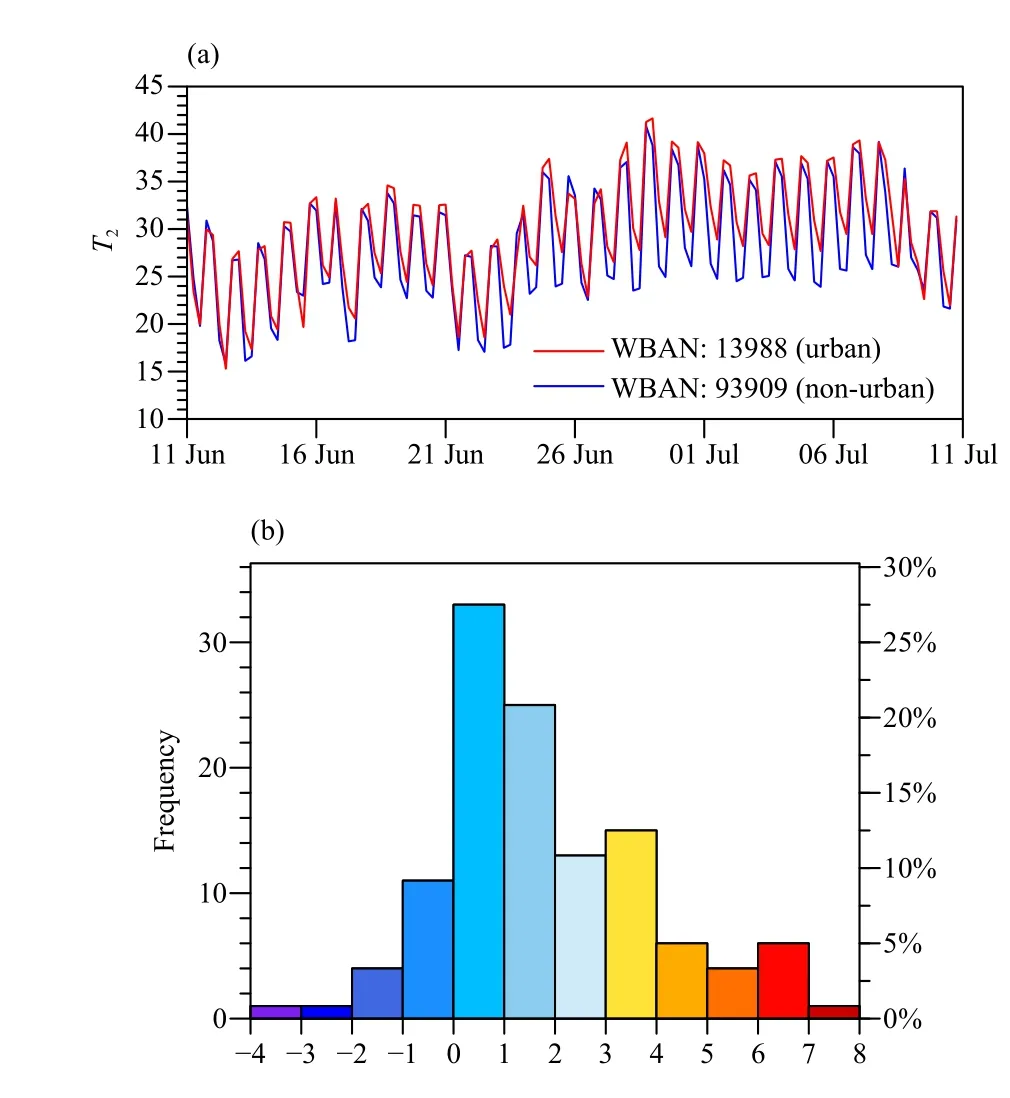
Fig.8.(a) Time series of simulated urban and non-urban surface air temperature (°C) from 11 June to 10 July 2012, and (b) histogram of their differences (urban minus non-urban).

Fig.9.Scatter plot of simulated versus observed surface air temperature (°C) for all stations.Root-mean-square errors (RMSE) in different colors show for different times of day.
5.Conclusions
A high-resolution WRF model is used to simulate an exceptionally strong and persistent heat wave in Missouri in summer 2012.To reveal the dependence of the model performance on physical scheme, a total of eight combinations of microphysics, radiation, and PBL schemes are investigated.The WRF simulations are validated against ground-based station observations and the PRISM dataset.
All the experiments simulated, to a large extent, the spatial pattern of surface air temperature during the onemonth integration period.The simulated maximum temperature appears in the Kansas City Metropolitan Area,being consistent with the observation.It is found that the area-averaged warming exhibits an oscillatory growth,with a pronounced synoptic-scale period of 4-5 days.The simulations with different physics parameterization schemes are all capable of reproducing the observed oscillatory development and large-scale environmental conditions with pronounced southwesterly wind and background zonal temperature gradient.The result indicates that the persistent heat wave arose from accumulation of a number of synoptic events that advected warm temperature eastward in the presence of the background mean zonal temperature gradient and the warm advection was likely enhanced by the adiabatic compression as air flows from the elevated terrain of the Rocky Mountains, which is to the west of the simulation domain.
It is found that simulated 2-m surface air temperature and relative humidity fields are in particular sensitive to the choice of the PBL scheme.The combinations with MYJ produce a higher temperature and a lower relative humidity than those with MYNN3.In general, the MYNN3 scheme presents a better performance in the surface air temperature than the MYJ scheme.Most of the configurations overestimated the precipitation.
An overall skill score that combines the performance of all three key variables (2-m air temperature, 2-m relative humidity, and precipitation) and two statistics(RMSE and PCC) is introduced.Our calculation result shows that the combination of Thompson, RRTMG, and MYNN3 schemes presents the best WRF simulation of this exceptionally strong and persistent heat wave event.The best-performing simulation also successfully reproduced the UHI effect between the Kansas City Metropolitan Area and the surrounding rural and suburban areas.In addition to the UHI effect, the best simulation also well captures the larger nighttime UHI effect than the daytime, highlighting UHI’s diurnal variation, thanks to more thermally massive materials thus higher thermal inertia in urban area, which stores heat during the day and is slow to release the heat over night.
It is worth mentioning that in the current study, we did not test the land surface model options and only one land surface scheme (i.e., Noah land surface model) was used.To reproduce the correct surface temperature patterns and air temperatures in the urban areas, the urban canopy model was activated in the current WRF simulations.Note that the urban canopy model only works with the Noah land surface model.Recent studies by Ford and Schoof (2017) and Benson and Dirmeyer (2021) suggested that heat wave simulations might be sensitive to the choice of the land surface model and associated land-atmosphere coupling.Therefore, a further sensitivity modeling study is needed to evaluate and compare the performance of different land surface schemes coupled with the WRF model in the multiple heat wave simulations.
While the current work is confined in North America,the model framework can be easily implemented to the East Asian domain, in order to investigate and predict extreme heat waves and droughts in the East Asian monsoon region.The sensitivity experiments used in the current study can serve as a benchmark to understand the model’s sensitivity to various physics options in the East Asian monsoon domain.There is urgent need in understanding the change of extreme events under global warming and the adverse impacts of heat waves, especially those excessive and prolonged events exacerbated by the UHI effect.The current model framework can be implemented to reveal the long-term statistical behaviors of extreme heat wave events under the present-day climate and future change projections under global warming using a dynamical downscaling approach.Such a work is currently under way and will be reported elsewhere.
Acknowledgments.Comments provided by three anonymous reviewers are greatly appreciated.The computation is performed on the high-performance computing infrastructure provided by Research Computing Support Services and in part by the National Science Foundation under Grant No.CNS-1429294 at University of Missouri, Columbia MO.
 Journal of Meteorological Research2022年4期
- Journal of Meteorological Research的其它文章
- Cause–Effect Relationship between Meso-γ-Scale Rotation and Extreme Short-Term Precipitation: Observational Analyses at Minute and Sub-Kilometer Scales
- Updated Simulation of Tropospheric Ozone and Its Radiative Forcing over the Globe and China Based on a Newly Developed Chemistry–Climate Model
- Identifying Supercooled Liquid Water in Cloud Based on Airborne Observations:Correlation of Cloud Particle Number Concentration with Icing Probability and Proportion of Spherical Particles
- Heavy Precipitation over the Jing–Jin–Ji Region in Early October: What Controls Its Interannual Variability?
- Height Variation in the Summer Quasi-Zero Wind Layer over Dunhuang, Northwest China:A Diagnostic Study
- Role of Intraseasonal Oscillation in a Compound Drought and Heat Event over the Middle of the Yangtze River Basin during Midsummer 2018
