
Heavy Precipitation over the Jing–Jin–Ji Region in Early October: What Controls Its Interannual Variability?
2022-09-05 03:05JingFENGTimLIJiWANGandLinnaZHANG
Jing FENG, Tim LI, Ji WANG, and Linna ZHANG
1 Key Laboratory of Meteorological Disaster, Ministry of Education (KLME), Nanjing University of Information Science & Technology, Nanjing 210044, China 2 Beijing Meteorological Information Center, China Meteorological Administration, Beijing 100089, China 3 International Pacific Research Center and Department of Atmospheric Sciences, University of Hawaii, Hawaii 96822, USA 4 Beijing Municipal Climate Center, Beijing 100089, China 5 Beijing Meteorological Observatory, Beijing 100089, China
ABSTRACT Heavy regional precipitation (HRP) over Beijing, Tianjin, and Hebei Province (the Jing-Jin-Ji region or JJJ) in early October (1-10 October) is a high-impact climate event because of travel and outdoor activities by exceptionally large population during the Chinese National Day Holidays (CNDH).What causes the year-to-year variation of the HRP during early October is investigated through an observational analysis.It is found that the HRP arises from moisture transport by southerly anomalies to the west of an anomalous low-level anticyclone over the subtropical northwestern Pacific (SNWP).Sensitivity numerical experiments reveal that the low-level anticyclonic anomaly is caused by a dipole heating pattern over tropical western and central Pacific associated with a La Niña-like SST anomaly (SSTA) pattern in the Pacific and by a negative heating anomaly over North Europe.The latter connects the SNWP anticyclone through a Rossby wave train.Anomalous ascent associated with a positive heating anomaly over the tropical western Pacific may strengthen the local Hadley Cell, contributing to maintenance of the low-level anomalous anticyclone over SNWP and extending westwards of the western Pacific subtropical high (WPSH).Therefore,both the tropical Pacific and midlatitude heating signals over North Europe may be potential predictors for HRP forecast in the JJJ region in early October.
Key words: heavy regional precipitation (HRP) in Jing-Jin-Ji (JJJ; Beijing, Tianjin, and Hebei Province), water vapor (WV) transport, Rossby wave train, diabatic heating anomalies, La Niña-like SST anomaly
1.Introduction
A heavy regional precipitation (HRP) event over Beijing, Tianjin, and Hebei Province (called in Chinese the Jing-Jin-Ji region and abbreviated as JJJ in this paper) in early October (1-10 October) is a high-impact climate event because of massive population activities (e.g., traveling) during the Chinese National Day Holiday (CNDH)in this time period.Known as a “tourism golden week,”the CNDH attracts numerous tourists to JJJ, especially Beijing.According to statistics by the Chinese Tour Research Institute, about 9.2 million tourists visited Beijing during the CNDH in 2019.Therefore, it is of urgent need to understand and predict the HRP in JJJ during the CNDH.
The JJJ region over 32°-43°N, 113°-121°E lies in North China.It is located in the northern edge of the East Asian monsoon regime (Chu, 1934; Barnett et al., 1994;Webster, 1998; Wang and Lin, 2002; Ding and Chan,2005; Huang et al., 2007; Li et al., 2011).In East China,air temperature and precipitation exhibit an obvious annual cycle (Chu, 1934; Tu and Huang, 1944; Chen and Jin, 1984; Chen et al., 1992; Tao and Zhang, 1998; Webster et al., 1998; Wang and Lin, 2002; Ding and Chan,2005; He et al., 2007; Huang et al., 2007; Ren et al.,2010; Li et al., 2011; Zhu et al., 2011; Zhu and He,2013), with dry and cold winter in December-January-February (DJF) affected by the East Asian winter monsoon (EAWM) but wet and hot summer in June-July-August (JJA) affected by the East Asian summer monsoon (EASM).About 70% of the annual precipitation in the JJJ region occurs in summer.As the EASM rainband penetrates northward to about 40°N from July to August,southerlies to the south of the EASM front bring abundant moisture into JJJ, leading to HRP events in-situ (Tu and Huang, 1944; Zhu and He, 2013).The EASM retreats southward after August.October is regarded as a transition period between EASM and EAWM.During the period, the local climate in JJJ is in general cool, dry,and less rainy because the EASM recedes.However, in some years, abnormal large-scale circulation may cause the occurrence of HRP in JJJ in early October.
So far, it is not clear what causes the year-to-year variation of regional mean precipitation (RMP) in JJJ during early October.The El Niño-Southern Oscillation (ENSO)is likely a major predictor.As the most dominant mode of interannual variability, ENSO may affect global climate and weather (Bjerknes, 1966, 1969; Rasmusson and Carpenter, 1982; Ropelewski and Halpert, 1987, 1989;Smith and Ropelewski, 1997; Webster et al., 1998; Shi et al., 2002; Chen et al., 2006; Ren et al., 2020).Although its main circulation and convection systems are located in the tropics, ENSO may exert remote forcing to higher latitudes through atmospheric Rossby wave energy propagation and via various teleconnection patterns such as the Pacific-North America pattern (Horel and Wallace, 1981; Hoskins and Karoly, 1981), the Pacific-Japan pattern (Nitta, 1987; Huang and Lu, 1989; Huang and Wu, 1989; Tao and Zhang, 1998; Gong and Wang,1999), and the Pacific-East Asia teleconnection pattern(Zhang et al., 1999; Wang et al., 2000; Chang et al.,2000a, b; Zhang and Sumi, 2002; Lu, 2005).Previous studies revealed that precipitation in North China, especially in autumn, is to a certain extent correlated to the ENSO (Shi, 1990; Zhang et al., 1996, 1999; Gong and Wang, 1999; Zhang and Akimasa, 2002; Chen and Shi,2003; Chen et al., 2006; Fan et al., 2009; Gu et al., 2012;Han et al., 2013; Zhao et al., 2017).
The objective of the present study is to investigate the cause of the interannual variation of RMP in the JJJ region during early October.Firstly, we will unveil the large-scale circulation and sea surface temperature (SST)patterns associated with a high RMP index during 1979-2019.Then, physical mechanisms responsible for the JJJ HRP events are analyzed.It is anticipated that the physical mechanisms thus obtained would help to improve the extended-range forecast of the HRP in JJJ.
2.Data, method, and model
The datasets used in this study include (1) daily precipitation at 179 national weather stations within JJJ, (2)daily gridded precipitation in China on a horizontal resolution of 0.5° × 0.5° (Hutchinson et al., 1998a, b), (3)Global Precipitation Climatology Project (GPCP)monthly precipitation on a 1° × 1° horizontal resolution(Adler et al., 2003), (4) daily three-dimensional atmospheric fields from NCEP reanalysis data provided by NOAA including geopotential height (GPH), zonal wind,meridional wind, vertical velocity, air temperature, and specific humidity at 13 vertical pressure levels extending from the surface to 100 hPa on a 2.5° × 2.5° horizontal resolution (Kalnay et al., 1996), and (5) Met Office Hadley Centre monthly SST on a 1° × 1° horizontal resolution (Rayner et al., 2003).All analyses in this study share a common period of 1979-2019.
At first, linear trends have been removed from all the datasets.A RMP index is introduced.It is defined as the area-average rainfall amount in the JJJ region (32°-43°N,113°-121°E) during 1-10 October each year.Meanwhile, a regional precipitation event (RPE) index is also introduced, which is defined as the number of days during early October when more than 50% of the weather stations in JJJ see more than 0.1 mm daily rainfall.The years with both a high RMP index and a high RPE index over 0.5 standard deviations are then selected for composite analysis.Furthermore, a Student’sttest is employed to reveal the statistical significance of the composite fields.
Wave activity flux is used to analyze the propagation of tropospheric Rossby wave activity.Following Takaya and Nakamura (2001), a generalized wave activity flux is defined in Eq.(1):
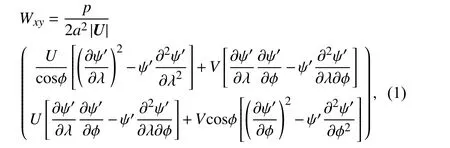
whereais the earth’s radius,φrepresents latitude andλlongitude,Uis a steady horizontal inhomogeneous basic flow,ψ′ is the perturbation stream function, andp= pressure/1000 in hPa is the atmospheric pressure.
Horizontal temperature advection is calculated based on Eq.(2):

whereTadvis air temperature horizontal advection,Vrepresents vector of the wind,uandvrepresent zonal and meridional wind components, and ∇ represents the operator of horizontal gradient.
The vertically integrated divergence of horizontal water vapor (WV) flux from the surface to 300 hPa is employed to measure the effect of moisture convergence on precipitation, which is calculated based on Eq.(3):

whereqdenotes specific humidity, andpsrepresents the surface air pressure.
An atmospheric general circulation model—ECHAM version 4.6 developed by the Max Planck Institute for Meteorology (Roeckner et al., 1996)—is employed to examine the role of tropical and midlatitude heating anomaly in causing atmospheric circulation anomalies.ECHAM4.6 is a state-of-the-art global atmosphere model,which is based on primitive equations and has a 2.8 × 2.8(T42) horizontal resolution with 19 vertical levels in a hybrid sigma pressure coordinate system (from surface to 10 hPa).By designing sensitivity experiments, we aim to understand the relative contributions of different heat sources in causing the formation of the low-level anomalous anticyclone over SNWP.The three-dimensional heating anomalies are added to the original heating rate in the temperature equation at every time step without interaction with other dynamic or thermodynamic fields(Xiang et al., 2014).The vertical profile of the heating is specified as a linear function of pressure with a maximum heating rate at 250 hPa.With a specified anomalous heat source, the model is integrated for 30 yr and the last 15-yr output is used to represent the steady atmospheric response to the specified heating anomaly.
3.Interannual variations of the RMP and RPE indices over JJJ
As stated in the Section 2, an RMP index is introduced.The blue curve of Fig.1a shows the time series of the RMP index.It illustrates a great interannual variation with a maximum of 7.2 mm day−1and a minimum of 0 mm day−1.
While the RMP index uses a time-space average amount of precipitation, it is useful to compare it with the number of the regional precipitation event (RPE) in order to focus on the years with heavy regional precipitation.Regional weather or climate event is usually identified by some threshold values.Here the number of the RPE is counted daily between 1 and 10 October when daily rainfall exceeds 0.1 mm over 50% of 179 weather stations in the JJJ region.Thus, in theory the maximum number of the RPE index is 10 and the minimum is 0.
According to the statistics, a total of 60 RPEs have happened during early October of 1979-2019 and they account for 15% of the total days.
The red curve in Fig.1a shows the time series of the RPE index.It should be noted that the maximum RPE number is 7, whereas the minimum RPE number is 0.The blue and red curves in Fig.1a show a consistent evolution feature.To compare the two time-series better,we plotted their normalized series in Fig.1b.They show similar year-to-year changes.In fact, the time series of the RPE index is significantly correlated with the time series of the RMP index with a correlation coefficient of 0.78, which exceeds the 1% significance level.
An HRP year is defined when both the RMP and RPE indices are over 0.5 standard deviations.There are a total of 5 HRP years, which are 1988, 1996, 2000, 2007, and 2017 (Fig.1b).These years represent extreme precipitation years in the JJJ region during early October.Before the two series are detrended, the number of the RPEs within the HRP years is ranged from 3 to 7, and the RMP index is from 1.4 to 7.2 mm (figure omitted).
Figure 2 shows the distribution of the composite precipitation anomaly percentage for the five HRP years relative to the long-term mean climatology in early October,which is calculated based on the gridded precipitation in China.Note that the rainfall amount during the five HRP years in JJJ is about 5 times as large as the climatological amount during the same period with an statistically robust significance.In the following section, we will analyze anomalous circulation and moisture flux patterns associated with the five HRP years.
4.Circulation anomalies in the HRP years
Figure 3 shows the composite wind and moisture anomaly fields averaged in 700 and 850 hPa.An anomalous anticyclone denoted by the red “A” is centered around 30°N, 130°E over the subtropical northwestern Pacific (SNWP).Accompanied with the anomalous lowlevel anticyclone is the westward extending western Pacific subtropical high (WPSH).A significant positive moisture anomaly appears to the south of the JJJ region.In consequence, both the climatological mean southerly and the anomalous southerly bring the extra anomalous moisture northward, which leads to HRP in the JJJ region.

Fig.1.(a) The detrended time series of yearly RPEs frequency (orange line; mm) and yearly RMP (blue line; mm) and (b) their normalized time series over the JJJ region in early October from 1979 to 2019.The gray dashed line in Fig.1b denotes the 0.5 standard deviation.

Fig.2.The composite precipitation anomaly percentage during HRP years of 1979-2019 (shade, %; the cross denotes the distinctly anomaly values at the 5% significance level).The yellow square denotes JJJ over 32°-43°N, 113°-121°E.
Figure 4 shows the WV flux divergence field vertically integrated in the whole troposphere.The vertically integrated WV flux shows a marked convergence center over JJJ, which is consistent with the anomalous wind and moisture patterns shown in Fig.3.The accumulated low-level moisture due to the WV flux convergence causes the convectively unstable stratification, and thus anomalous ascending motion over about 30°-40°N, as seen from the latitude-height cross-section of composite vertical velocity in Fig.5.

Fig.3.The composite specific humidity anomaly [shade, g kg−1; the red (blue) shade denotes the positive (negative) anomaly, and the red cross denotes the distinctly positive anomaly at the 5% significance level], the wind anomaly averaged at 700 and 850 hPa (vector; m s−1;the red “A” denotes the anticyclonic anomaly), the composite 5880-geopotential meter (red line; gpm) in HRP years of JJJ in early October during 1979-2019, and the climatic mean of 5880-geopotential meter (blue line; gpm) in early October during 1979-2019.JJJ is denoted by the yellow square.
The anomalous southerly to the west of the anomalous anticyclone flows not only moisture but also warm air northward.As a consequence, there are positive temperature advection anomalies in south of JJJ, while there are negative temperature advection anomalies in north of JJJ.Such a dipole pattern of the temperature advection anomaly implies a strengthened front over JJJ, which is favorable for enhanced frontal precipitation in the JJJ region (Fig.6).
Figure 7 shows the composite temperature anomaly vertically integrated from surface to 200 hPa and the 200-Pa zonal wind anomaly fields.The warm temperature anomalies to the south and the cold temperature anomalies to the north enhance the meridional temperature gradient.According to the thermal wind relation, the strengthened temperature gradient favors the amplification of the westerly jet, which is clearly seen in the local anomalous zonal wind field in Fig.7.Both the temperature and zonal wind anomaly signals are statistically significant at a 95% confidence level.It is expected that the strengthened jet would enhance the atmospheric baroclinic instability, which will result in a strengthened synoptic disturbance in-situ favoring regional precipitation.
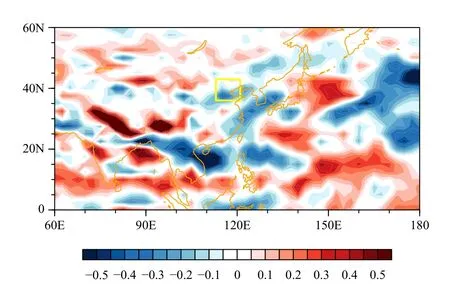
Fig.4.The composite the WV flux divergence anomaly [shade; 105 kg s−1 m−2, the blue (red) shade denotes the convergence (divergence)anomaly] vertically integrated from surface to 300 hPa in the HRP years of JJJ in early October during 1979-2019.JJJ is denoted by the yellow square.

Fig.5.The latitude-high section of composite vertical velocity anomaly [contour, 10−3 Pa s−1; the solid (dotted) line denotes positive (negative) anomaly area, and the shade denotes the distinctly ascending motion anomaly at the 5% significance level] averaged from 113° to 121°E in the HRP years of JJJ in early October during 1979-2019.
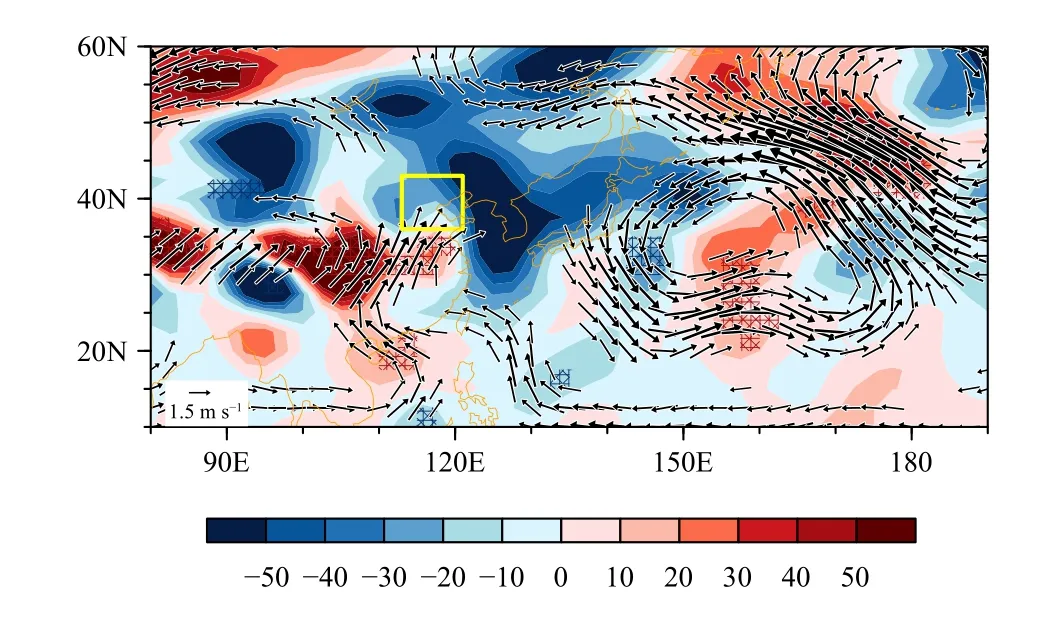
Fig.6.The composite horizontal temperature advection [shade, 10−6 K s−1; the red (blue) shade denotes the positive (negative) horizontal temperature advection, and the red (blue) cross shade denotes the distinctly positive (negative) anomaly at the 5% significance level] and the wind anomaly (vector; m s−1) at 700 hPa in the HRP years of JJJ in early October during 1979-2019.JJJ is denoted by the yellow square.
5.Mechanism for the regional circulation and precipitation anomalies
According to the analysis in Section 4, the moisture transport by the southerly anomaly along periphery of the low-level anomalous anticyclone over SNWP is essential to the HRP over JJJ.What causes the low-level anomalous anticyclone over SNWP? To address this question, the Rossby wave train patterns at 700, 500, and 200 hPa in midlatitudes of the Northern Hemisphere are shown in Figs.8a-c, and the SSTA pattern in the tropics is shown in Fig.8d.
It is interesting to see from Figs.8a-c that along the latitude band of 30°-60°N, there is a circumglobal Rossby wave train throughout the troposphere, with horizontal wave flux (green vectors in Figs.8a-c) representing Rossby wave energy propagation.

Fig.7.Composite temperature anomaly pattern integrated vertically from surface to 200 hPa [shade, 10−2 K hPa; red (blue) shaded area denotes positive (negative) temperature anomaly], zonal wind anomaly[contour, m s−1; the solid (dotted) line denotes positive (negative) anomaly, and the gray shaded area denotes distinctly zonal wind anomaly at the 5% significance level] at 200 hPa in the HRPs years of JJJ in early October during 1979-2019 and the climatological mean westerly jets (blue contour; m s−1) in early October during 1979-2019.JJJ is denoted by the yellow square.
The wave train is the most pronounced in the upper troposphere (Fig.8c), with a positive geopotential height(GPH) anomaly center (representing an anomalous anticyclone) at around 40°N, 120°E over North China (denoted by a red “A”).This positive GPH anomaly center is statistically significant from the climatological mean at the 5% significance level.It exhibits an equivalent barotropic structure.A corresponding positive GPH (anticyclonic) anomaly centered around 30°N, 130°E in the lower troposphere appears over SNWP (denoted by the red “A” in Fig.8a), which shifts slightly southeastward compared with the upper-tropospheric center (denoted by the red “A” in Fig.8c).It is the low-level anticyclonic anomaly that causes the HRP through anomalous moisture transport.
According to the wave activity flux direction, the anticyclonic anomaly at 200 hPa over North China (denoted by the red “A” in Fig.8c) results from upstream Rossby wave energy dispersion, and the origin of the wave train appears over northern Europe around 60°N, 50°E, denoted by the black “A” in Fig.8c.Figure 9 shows the vertical profiles of both the composite GPH and temperature fields over the anticyclonic anomaly region of 60°-80°N, 20°-80°E over northern Europe.The maximum GPH anomaly appears at 250 hPa (Fig.9b), with a warm(cold) temperature anomaly below (above) the pressure level following the hydrostatic relationship (Fig.9a).
An interesting feature in the composite tropical SSTA field (Fig.8d) is the occurrence of a La Niña-like SSTA pattern in the Pacific, which is characterized of a cooling pattern in the equatorial centeral to eastern Pacific and a horseshoe-like warm pattern in the western Pacific (WP).In fact, it should be noted that four out of five selected HRP years belong to officially declared La Niña years.
In association with the La Niña-like SSTA pattern is the precipitation anomaly pattern with a positive precipitation anomaly in tropical western Pacific (WP) and a negative precipitation anomaly in tropical central to eastern Pacific as shown in Fig.10.Does the precipitation(or heating) anomaly pattern in the tropical Pacific cause the low-level anomalous anticyclone in the SNWP?
On the one hand, Fig.11 shows the meridional circulation of vertical velocity averaged in the band of 120°-140°E, with air rising in the band of 10°-20°N over tropical WP warm pool and air sinking in the band of 20°-30°N over SNWP.As we know, the anomalous meridional circulation of vertical velocity could contribute to WPSH extending westward (as shown in Fig.3),which is beneficial to much more moisture transport into JJJ.The result is consistent with the previous studies(Huang and Li, 1988; Gu et al., 2012; Han et al., 2013).
On the other hand, according to the Gill (1980) model,the 200-hPa positive GPH (anticyclonic) anomaly centered around 40°N, 120°E (denoted by the red “A” in Fig.10) could be directly forced by a positive precipitation anomaly over tropical western Pacific (WP, denoted by the red No.1 box marked over 0°-20°N, 110°-140°E in Fig.10).Similarly, the 200-hPa negative GPH (cyclonic) anomaly centered around 40°N, 160°E (denoted by the red “C” in Fig.10) might be a direct response to the negative heating anomaly to its southeast over the tropical central Pacific (CP, denoted by the blue No.2 box over 0°-20°N, 150°E-180° in Fig.10).In addition to the tropical heating, a negative heating anomaly over North Europe (EU, denoted by the blue No.3 box over 50°-70°N, 30°-70°E in Fig.10) might make partly contribution to trigger the Rossby wave train and affect the development of the downstream anomalous anticyclone(denoted by the red “A” in Fig.10) over North China.
To examine the relative roles of the anomalous heat sources, a number of idealized numerical model experiments are designed with the vertical profile of the heating specified as a linear function of pressure, as many recent researches did (Xiang et al., 2014; Zhu et al., 2014;Wang et al., 2017; Zhu and Li, 2017; Jiang and Li, 2019;Pan et al., 2021).The maximum heating rate of the vertical profile is at 250 hPa with its top level at 100 hPa and its bottom level at 950 hPa.Table 1 describes each of these sensitivity experiments.
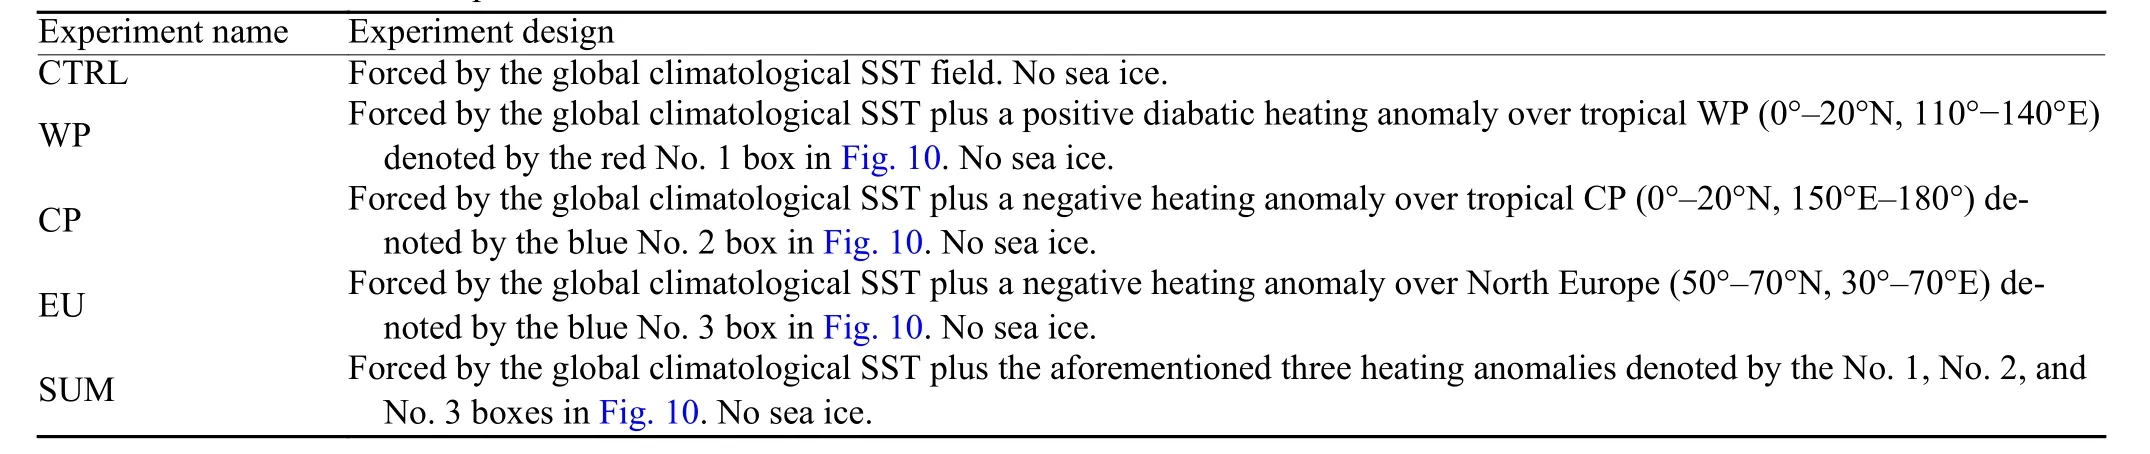
Table 1.List of numerical experiments with ECHAM4.6

Fig.8.The composite anomaly fields of GPH [contour, gpm; the solid (dashed) line denotes the positive (negative) GPH anomaly with crosses denotes the statistically significant anomaly at the 5% significant level; an “A” (“C”) denotes the anticyclonic (cyclonic) anomaly], horizontal wave flux (green vector; m−2 s−2), and wind vector (black vector; m s−1) at (a) 700 hPa, (b) 500 hPa, (c) 200 hPa, and (d) SSTA [shade, K; the blue (red) shade denotes the negative (positive) SSTA with the square shadow area denoting the statistically significant anomaly at the 5% significant level] in the HRP years of JJJ in early October during 1979-2019.JJJ is denoted by the yellow square.
Figure 12 shows the response to tropical WP heating anomaly in the WP experiment.It indicates that in the band of 30°-60°N, there is a Rossby wave train response throughout the troposphere traveling around the earth.At 200 hPa, there is an anomalous anticyclone response centered around 40°N, 120°E over North China denoted by the red “A” in Fig.12a.According to the Gill (1980)model, it should be directly induced by the tropical WP heating anomaly (denoted by the red box in Fig.12a).At 700 hPa, there is an anomalous anticyclone response centered around 10°N, 130°E of tropical WP (denoted by the red “A” in Fig.12b).To the west of the anomalous anticyclone at 700 hPa, the WV is transported by southerly to north.Additionally, it should be noted that enhanced local meridional cell induced by the diabatic heating over WP could contribute to WPSH extending westward (as shown in Fig.3) and the low-level anomalous anticyclone over SNWP maintenance or increasing (as shown in Fig.11), which leads to the positive precipitation anomaly in the JJJ region.
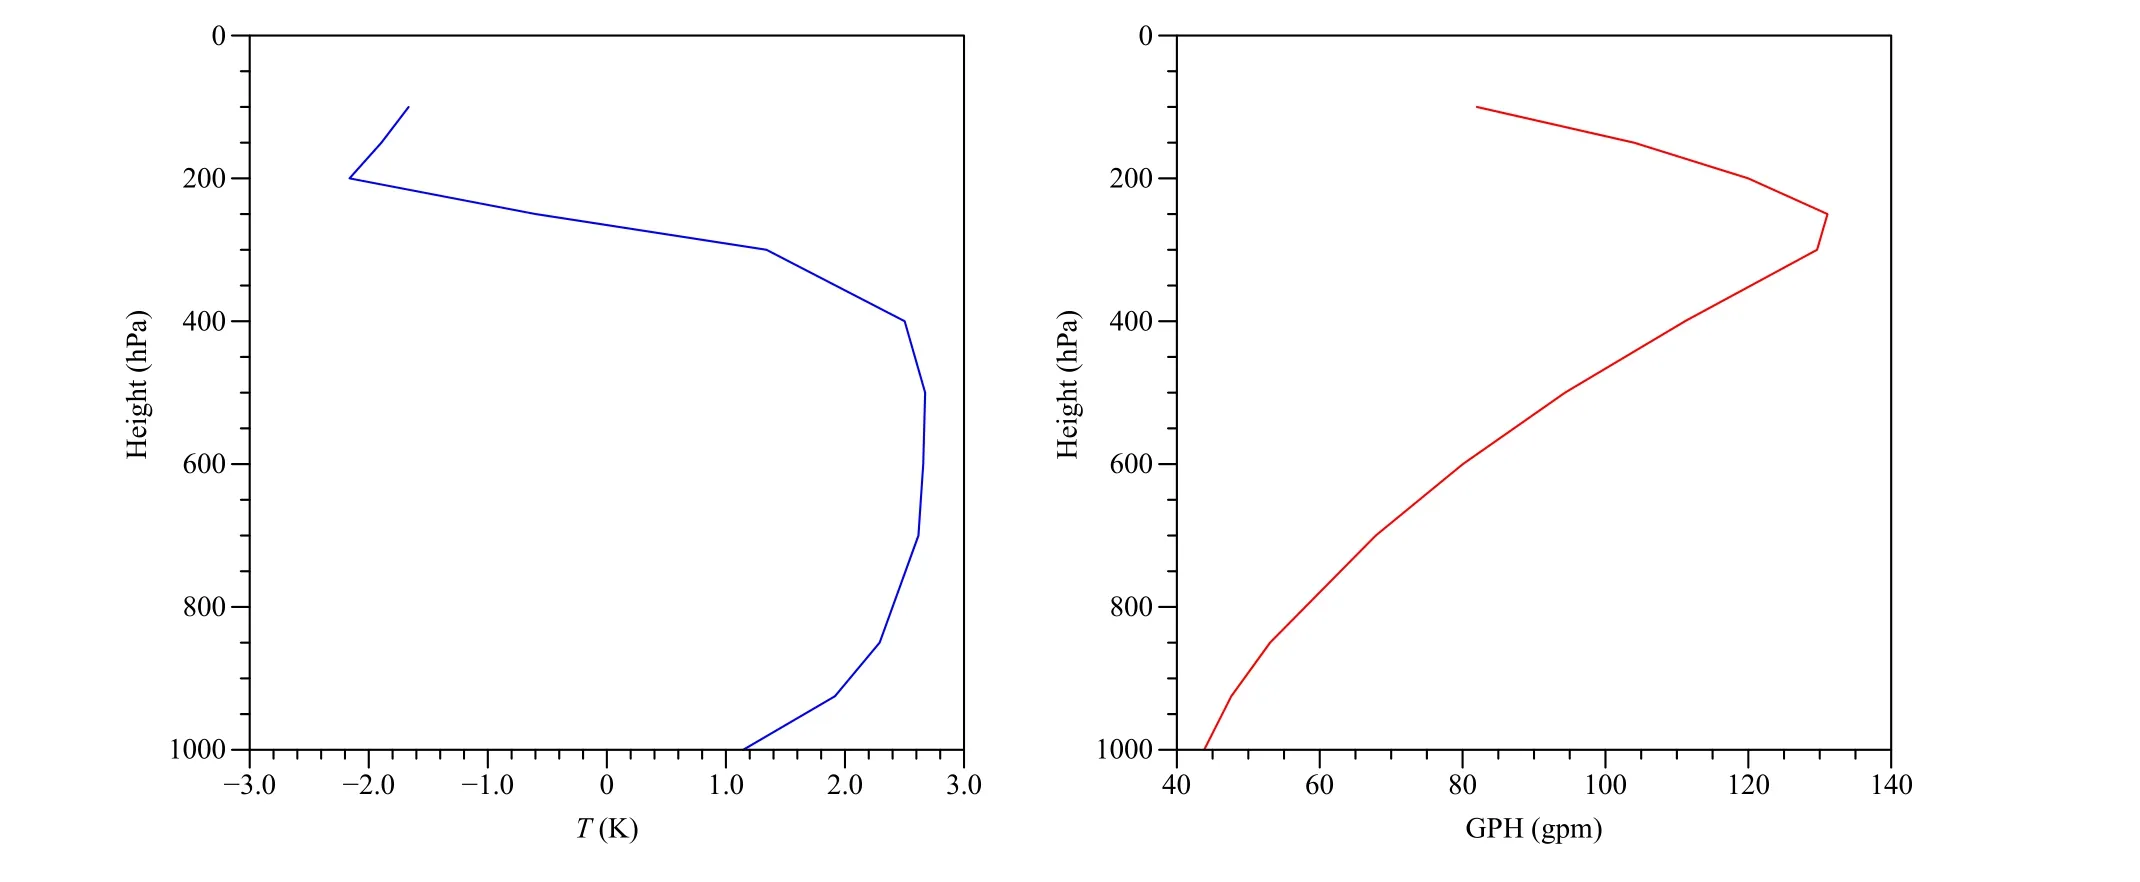
Fig.9.The composite (a) temperature anomaly (blue line; K) and (b) GPH anomaly (red line; gpm) averaged in the area of 60°-80°N, 20°-80°E in HRP years of JJJ in early October during 1979-2019.

Fig.10.The composite GPH anomaly [contour, gpm; solid (dashed) line denotes the positive (negative) GPH area; “A” (“C”) denotes the anticyclonic (cyclonic) anomaly], wind vector (black vector; m s−1) at 200 hPa, and precipitation anomaly [shaded, mm; yellow (green) shade denotes the negative (positive) precipitation] in the HRP years of JJJ in early October during 1979-2019.The red (No.1), blue (No.2), and blue(No.3) boxes denote the diabatic heating, cooling, and cooling areas.JJJ is denoted by the yellow square.
Figure 13 shows the response to the cooling anomaly in the CP experiment.It indicates that over 30°-60°N,there is a Rossby wave train response throughout the troposphere traveling around the earth.At 200 hPa, there is an anomalous anticyclone response centered around 45°N, 130°E of North China (denoted by the red “A” in Fig.13a).At 700 hPa, there is an anomalous anticyclone response centered around 15°N, 135°E of tropical WP(denoted by the red “A” in Fig.13b).
It is found that the positive precipitation anomaly in CP experiments appears in North China including JJJ.It is mainly caused by the southerly to the west of anomalous anticyclone response at 700 hPa over tropical-subtropical WP as shown in Fig.13b.
The upstream Rossby wave train also contributes to inducing or strengthenning the anticyclonic anomaly at 200 hPa centered around 40°N, 120°E over North China(denoted by the red “A” in Fig.8c), and the anticyclonic anomaly at 700 hPa centered around 30°N, 130°E over SNWP (denoted by the red “A” in Fig.8a), does it? EU experiment will answer the question.Figure 14 shows that in the band of 30°-60°N, there is a Rossby wave train throughout the atmosphere response to the cooling anomaly over North Europe.There is an anomalous anticyclone response at 200 hPa centered around 40°N,135°E over North China—SNWP denoted by the red “A”in Fig.14a.There is also an anomalous anticyclone response at 700 hPa centered around 45°N, 135°E over North China—Japan denoted by the red “A” in Fig.14b.It is found that the positive precipitation anomaly (green shade in Fig.14) appears in North China including JJJ,which is caused by the WV transport by southerly to the west of the anomalous anticyclone response at 700 hPa over North China to Japan.

Fig.11.The latitude-height cross-section of composite vertical velocity anomaly averaged from 120° to 140°E in HRP years of JJJ in early October [contour; 10−2 Pa s−1; solid (dotted) line denotes positive(negative) anomaly area; red (blue) shading denotes positive (negative)statistically significant velocity anomaly at the 95% confidence level].
It should be noted that the Rossby wave train response (as shown in Fig.14a) of EU experiment at 200 hPa is not exactly same with the observational one as shown in Fig.8c, especially over Eurasia.But the EU experiment indicates that the cooling anomaly over North Europe plays a part in inducing both the anticyclonic anomaly at 200 hPa over JJJ and the anticyclonic anomaly at 700 hPa over SNWP, and then the positive precipitation anomaly over JJJ.Thus, it is suspected that the cooling anomaly over North Europe only partly contributes to the triggering of the Rossby wave train over Eurasia.There still are other unknown factors such as atmosphere baroclinic disturbance and heating anomaly in mid-high latitudes contributing to triggering of the anticyclone anomaly over North Europe and the Rossby wave train.There should be another special study to confirm the source of the anticyclone anomaly over North Europe and the Rossby wave train over Eurasia.
The response to above the combined heating anomaly over tropical WP, the cooling anomaly over tropical CP,and the cooling anomaly over North Europe is investigated by an SUM experiment.Figure 15 shows that there is a Rossby wave train throughout the atmosphere in the band of 30°-60°N traveling around the earth.There is an anomalous anticyclone response at 200 hPa centered around 40°N, 135°E over North China-Japan denoted by the red “A” in Fig.15a.There is a huge anomalous anticyclone response at 700 hPa centered around 15°N,145°E over tropical WP denoted by the red “A” in Fig.15b, extending northward near 50°N.The positive precipitation anomaly appears in North China including JJJ.It should be noted that the precipitation in the SUM experiment is smaller than the observation (as shown in Fig.10).Thus, it can be inferred that smaller precipitation might lead to the positive precipitation anomaly in the SUM experiment appearing only in the east of JJJ but not the whole area.
The respective contribution to the anticyclone anomaly at 700 hPa over SNWP by WP heating anomaly, CP cooling anomaly, EU cooling anomaly, and combined the three heating anomalies has been quantitatively analyzed through an introduced GPH anomaly index.It has been defined as the mean GPH anomaly at 700 hPa in the range of 0°-40°N, 120°-140°E over SNWP denoted by the gray box as shown in Figs.12b, 13b, 14b, 15b.Figure 16 shows the respective GPH anomaly index over SNWP at 700 hPa respectively contributed by WP heating anomaly, CP cooling anomaly, EU cooling anomaly,and combined the three heating anomalies.It indicates that both the CP cooling anomaly response and the EU cooling anomaly response make positive contributions to the GPH anomaly index over SNWP, while the WP heating anomaly makes a little negative contribution because of the anticyclone anomaly over tropical WP shifting southward and the southerly out of reach of JJJ as shown in Fig.12b.But according to the observational analysis in Section 4, the enhanced local cell with ascending motion over the tropical WP and sinking motion over the SNWP can cause the WPSH to extend westward (as shown in Fig.3) and the anomalous anticyclone to grow over the SNWP, which are very much in favor of precipitation in JJJ.

Fig.12.The simulated GPH anomaly [contour, gpm; solid (dashed) line denotes the positive (negative) GPH area; “A” (“C”) denotes the anticyclonic (cyclonic) anomaly], horizontal wave flux (green vector, m−2 s−2), wind vector (black vector, m s−1), and precipitation anomaly [shaded,mm; yellow (green) shade denotes the negative (positive) precipitation] in October at (a) 200 and (b) 700 hPa.The red box over 0°-20°N,110°-140°E in the tropical WP at 200 hPa denotes the diabatic heating area.The gray box over 0°-40°N, 120°-140°E in the tropical-subtropical WP at 700 hPa denotes the GPH index area.JJJ is denoted by the yellow square.
6.Conclusions
The cause of heavy regional precipitation (HRP) over the JJJ region in early October (1-10 October) is investigated through an observational analysis.It is found that the regional mean precipitation (RMP) index during the period exhibits a great interannual variation.Such a variation is consistent with the frequency of the regional precipitation event (RPE) index.The temporal correlation between the two indices is very high, exceeding the 99%confidence level.
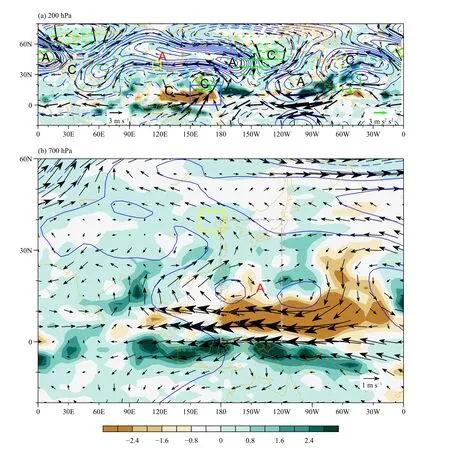
Fig.13.As in Fig.12, but for the blue box over 0°-20°N, 150°E-180° in the CP at 200 hPa, denoting the diabatic cooling area.
A composite analysis based on the high RMP and high RPE indices is carried out.It is found that during the high index years, the atmospheric circulation anomaly field is characterized by a low-level anomalous anticyclone over SNWP and a distinct westward extension of the WPSH.Southerly to the west of the anomalous anticyclone brings high moist air northward into the region of JJJ, leading to HRP events.
In accompanying to the SNWP, low-level anticyclone is a La Niña like SSTA pattern in the tropical Pacific and a distinctive Rossby wave train pattern in the upper troposphere in Eurasia.While a warm SSTA appears in the tropical western Pacific, a cold SSTA appears in the equatorial central and eastern Pacific.Such an SSTA pattern is associated with a dipole precipitation anomaly pattern in the tropical Pacific, with a positive precipitation (heating) anomaly over the tropical WP and a negative precipitation (cooling) anomaly over the tropical CP.The midlatitude wave train is originated from North Europe, and its wave activity flux points toward southeast, connecting a positive GPH (anticyclone) anomaly over North China.
A set of sensitivity numerical model experiments are carried out to understand the cause of the midlatitude wave train and the low-level anomalous anticyclone over SNWP.Individual tropical and midlatitude heating anomalies are specified respectively in the sensitivity experiments.The numerical model experiments indicate that both the cooling source over the tropical CP and the cooling source over North Europe contribute to the anomalous low-level anticyclone in SNWP and then the positive precipitation anomaly over JJJ.The positive heating source over the tropical WP contributes to the negative GPH anomaly index over SNWP because of the anomalous low-level anticyclone shifting southward over tropical WP.But detailed observational analysis indicates that the positive heat source in the tropical WP still plays an important role in maintaining the anomalous low-level anticyclone in SNWP.The arising motion over tropical WP associated with the positive heat source might induce anomalous descent over SNWP through the local Hadley Cell.The anomalous descent in-situ may further induce low-level divergence and thus an anticyclonic anomaly over SNWP.The anticyclonic anomaly makes the WPSH extending westward, which helps the northward moisture transport into the JJJ region.

Fig.14.As in Fig.12, but for the blue box over 50°-70°N, 30°-70°E in North Europe at 200 hPa, denoting the diabatic cooling area.
The observational analysis results suggest that the JJJ region would receive more precipitation in early October when a La Niña condition happens in the Pacific.In fact,80% of HRP years during 1979-2019 are La Niña years.In addition, the northwest-southeast oriented upper tropospheric Rossby wave train in Eurasia is another potential predictor.Based on the current analysis, one may construct a physics-based empirical model to conduct short-range climate prediction over the JJJ region.This will be done in our next endeavor.
Acknowledgments.Comments provided by two anonymous reviewers are greatly appreciated.We acknowledge the high performance computing center of Nanjing University of Information Science & Technology for providing support to this work.

Fig.15.As in Fig.12, but the red (0°-20°N, 110°-140°E), blue (0°-20°N, 150°E-180°), and blue (50°-70°N, 30°-70°E) boxes at 200 hPa denoting the diabatic heating, cooling, and cooling areas.

Fig.16.GPH anomaly index averaged in the area of 0°-40°N,120°-140°E respectively contributed by WP (heating anomaly response), CP (cooling anomaly response), EU (cooling anomaly response), and SUM (combined three anomalies response).
 Journal of Meteorological Research2022年4期
- Journal of Meteorological Research的其它文章
- Cause–Effect Relationship between Meso-γ-Scale Rotation and Extreme Short-Term Precipitation: Observational Analyses at Minute and Sub-Kilometer Scales
- Updated Simulation of Tropospheric Ozone and Its Radiative Forcing over the Globe and China Based on a Newly Developed Chemistry–Climate Model
- Identifying Supercooled Liquid Water in Cloud Based on Airborne Observations:Correlation of Cloud Particle Number Concentration with Icing Probability and Proportion of Spherical Particles
- Height Variation in the Summer Quasi-Zero Wind Layer over Dunhuang, Northwest China:A Diagnostic Study
- Simulations of a Persistent Heat Wave Event in Missouri in Summer 2012 Using a High-Resolution WRF Model
- Role of Intraseasonal Oscillation in a Compound Drought and Heat Event over the Middle of the Yangtze River Basin during Midsummer 2018