
Decadal Change of the Linkage between Sea Ice over the Barents–Kara Seas in November–December and the Stratospheric Polar Vortex in Subsequent January
2022-09-05 03:23HaiboZHOUandKeFAN
Haibo ZHOU and Ke FAN
1 Institute of Atmospheric Physics, Chinese Academy of Sciences, Beijing 100029 2 School of Atmospheric Science, Sun Yat-sen University, and Southern Marine Science and Engineering Guangdong Laboratory (Zhuhai),Zhuhai 519082 3 University of Chinese Academy of Sciences, Beijing 100049
ABSTRACT The linkage between the sea ice concentration (SIC) over the Barents-Kara Seas in November-December(SIC_BKS_ND) and the stratospheric polar vortex (SPV) in subsequent January (SPV_Jan) is investigated.It is found that SIC_BKS_ND is positively (negatively) correlated with SPV_Jan for the period 1979-1995 (1996-2009).Further analyses reveal that, during 1979-1995 (1996-2009), SIC_BKS_ND is relatively higher (lower), accompanied by smaller (larger) interannual variability with its center shifting northwest (southeast).Meanwhile, the polar front jet waveguide is relatively stronger (weaker).The simultaneous anomalous eastward-propagating Rossby waves excited by anomalously low SIC_BKS_ND are stronger (weaker), which results in the stronger (weaker) negativepositive-negative wave-train structure of geopotential height anomalies over Eurasia, with the location of these anomalous height centers shifting remarkably westward (eastward).Such changes tend to enhance (suppress) vertically propagating tropospheric planetary waves into the lower stratosphere at high-latitude via constructive (destructive)interference of anomalous tropospheric wave-train structure with the climatological planetary waves, subsequently weakening (strengthening) SPV_Jan.However, in conjunction with anomalously high SIC_BKS_ND, the interference of the tropospheric wave-train structure anomalies and their climatologies shows an opposite distribution to that of low SIC_BKS_ND anomalies, which leads to a strong (weak) SPV_Jan anomaly during 1979-1995 (1996-2009).
Key words: decadal change, sea ice over the Barents-Kara Seas, stratospheric polar vortex, tropospheric wave-train structure, planetary waves
1.Introduction
During recent decades, the Arctic sea ice concentration (SIC) has declined rapidly and its interannual variability has increased significantly against the background of global warming (Comiso et al., 2008; Zwally and Gloersen, 2008).A growing number of studies have investigated the anomalies of Arctic SIC, particularly over the Barents-Kara Seas (BKS), revealing that they may have a strong impact on Northern Hemisphere (NH) mid- and high-latitude weather and climate, such as Arctic warming, the westerly jet, blocking frequency, and the frequency of cold winters over Eurasia (Screen and Simmonds, 2010; Wu et al., 2011; Tang et al., 2013; Cohen et al., 2014; Mori et al., 2014; Vihma, 2014; Gao et al.,2015; Zhang et al., 2016; Chen and Luo, 2017; McKenna et al., 2018; Cohen et al., 2020; Zhang and Screen,2021), spring dust activity over North China (Fan et al.,2018; Ji and Fan, 2019), haze pollution in East China(Wang et al., 2015) and North China (Li and Yin, 2020),and summer precipitation over Eurasia (Guo et al., 2014;Han et al., 2021).In particular, the focus of many studies has been on the SIC over the BKS during November-December (SIC_BKS_ND), which may exert the greatest impacts upon NH mid- and high-latitude circulation in the subsequent winter owing to the fact that the BKS has lost a significant extent of sea ice while exhibiting pronounced interannual variations during this period (Kim et al., 2014; Koenigk et al., 2016; Yang et al., 2016).
The anomalies of SIC_BKS may affect NH mid- and high-latitude weather and climate through tropospheric and stratospheric pathways.The main tropospheric pathway is as follows: SIC_BKS anomalies generate stationary Rossby waves across Eurasia because SIC_BKS anomalies can directly cause anomalous turbulent heat fluxes through a dynamic process.Besides, thermodynamically, SIC_BKS anomalies can affect teleconnection pattern over Eurasian mid- and high-latitude by altering the distribution of snow-cover anomalies and associated soil-moisture anomalies, and thus affect Eurasian mid- and high-latitude weather and climate (Cohen et al.,2013; Zhang et al., 2018a, b; Zhang et al., 2019).For example, during 1996-2014, light SIC_BKS in winter corresponded to reduced winter and spring snow cover in western Siberia, which thereby contributed to the occurrence of dust weather over northern China by changing the atmospheric circulation and climate conditions.Also,the intensified interannual variability of SIC_BKS since the mid-1990s, with its center shifting eastward, may have induced a stronger southward-propagating Rossby wave-train, thus affecting dust-related atmospheric circulation (Fan et al., 2018).Moreover, reductions in SIC_BKS in June may trigger the “Silk Road” teleconnection wave-train, which can further modulate the precipitation pattern over East Asia (He et al., 2018).Besides, SIC_BKS anomalies in spring may have an important impact on the frequency of high temperatures and drought over northeast China in summer by affecting the snow, soil moisture, and atmospheric teleconnection in spring-summer (Li et al., 2018).
Furthermore, many studies have revealed that a stratospheric pathway might be as important as, or even more important than, the tropospheric pathway, in terms of the influence of SIC_BKS anomalies on NH mid- and highlatitude circulation (Sun et al., 2015; Nakamura et al.,2016; Wu and Smith, 2016; Zhang et al., 2018a, b; Xu et al., 2021).The main stratospheric pathway is as follows:constructive/destructive interference of the anomalous tropospheric wave-train structure triggered by SIC_BKS anomalies with the climatological waves will lead to amplified/weakened meridional heat fluxes, enhanced/weakened upward-propagating tropospheric planetary waves into the lower stratosphere at high-latitude, increased/decreased geopotential height and decelerated/accelerated westerly flow in the stratosphere, and subsequent weakening/strengthening of the stratospheric polar vortex (SPV).The stratospheric circulation anomalies then propagate downward and impact the troposphere and surface (Baldwin and Dunkerton, 2001; Jaiser et al., 2013; Kim et al., 2014; Nakamura et al., 2015,2016; Sun et al., 2015).Interestingly, the latest study points out that planetary wave 2 plays a more important role in the atmospheric response of the troposphere, and the attenuation of the SPV is associated with the anomalously low SIC_BKS (Zhang et al., 2020).This feature is also adapted to the SIC over East Siberian-Chukchi-Beaufort (Ding and Wu, 2021).
It is worth noting that previous studies usually considered recent decades as a whole; the question raised here is whether the linkage between SIC_BKS_ND and the SPV in subsequent January (SPV_Jan) or February varies in different periods.Moreover, only the influence of SIC_BKS anomalies on the SPV is discussed; the impact of the downward propagation of SPV anomalies on the troposphere and surface is beyond the scope of this study.
The rest of the paper is organized as follows: Section 2 describes the data and methods.The decadal change in the linkage between SIC_BKS_ND and SPV_Jan in two different periods is presented in Section 3.1.Section 3.2 analyzes the different features of SIC_BKS_ND and associated tropospheric wave-train structure between the two periods.Section 3.3 reveals the possible mechanisms.A validation using models from the Coupled Model Intercomparison Project Phase 6 (CMIP6) is presented in Section 3.4.Finally, Section 4 provides the conclusions and some further discussion.
2.Data and methods
2.1 Data
The monthly mean large-scale atmospheric circulation variables are from the NCEP/NCAR Reanalysis datasets, with a horizontal resolution of 2.5° × 2.5° and 17 vertical pressure levels (Kalnay et al., 1996).The variables used include geopotential height, air temperature, zonal wind, meridional wind, and sensible and latent heat fluxes.To confirm the results derived from the NCEP/NCAR, the geopotential height derived from the Japanese 55-yr reanalysis (JRA55; Kobayashi et al.,2015), with a horizontal resolution of 1.25° × 1.25°, is adopted.Note that only the geopotential height in Figs.1b, 1c, 5 is derived from JRA55.The monthly SIC is from the UK Met Office Hadley Centre sea ice and sea surface temperature dataset (HadISST), with a horizontal resolution of 1° × 1° (Rayner et al., 2003).In addition,the outputs of historical simulations provided by CMIP6(Eyring et al., 2016) are used.Besides, only the first member (i.e., r1i1p1f1) is selected for each model.Their basic information is listed in Table 1.

Table 1.Basic information regarding the CMIP6 models (https://www.wcrp-climate.org/wgcm-cmip/wgcm-cmip6) used in this study
In addition, two indices are used: the SIC index over the BKS (SICI_BKS) and the SPV index (SPVI).The SICI_BKS is defined as the area-averaged SIC in the domain of 70°-82°N, 15°-90°E.Because the stratospheric height anomaly is negatively correlated to the SPV, the SPVI is defined as a negative sign of the area-averaged polar cap geopotential height at 50 hPa within the area of 65°-90°N, 0°-360° (Woo et al., 2015).Both indices are detrended to focus on year-to-year variability, and then normalized.
2.2 Methods
The quasi-geostrophic Eliassen-Palm (EP) flux is calculated to measure the wave intensity and wave propagation (Andrews et al., 1987).The EP flux (F) and its divergence (∇ ·F; Edmon et al., 1980) are defined as follows:

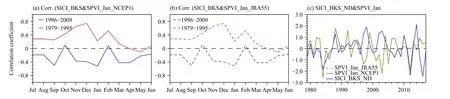
Fig.1.(a) The correlation coefficients between monthly SICI_BKS and SPVI_Jan obtained from NCEP/NCAR for the periods of 1979-1995(red curve) and 1996-2009 (blue curve).(b) As in (a), but for SPVI_Jan obtained from JRA55.(c) The interannual time series of SICI_BKS in November-December (blue curve) and SPVI_Jan obtained from NCEP/NCAR (red curve), and JRA55 (green curve) for the period 1979-2017.
The mean zonal momentum equation is defined as

where ρ is the density of air,ais the radius of the Earth,φ is the latitude, θ is the potential temperature,pis pressure,uandvare the zonal and meridional wind,fis the Coriolis parameter, andv∗is the residual mean meridional circulation.By expanding the Fourier harmonics, we adopt the sum of planetary waves 1 and 2 to denote quasistationary planetary waves.To display the EP flux throughout the stratosphere, the vectors are scaled by(Randel, 1987) and 1 /ρ (Wang et al., 2009).In addition, all vectors above 100 hPa are typically multiplied by 5.According to Eq.(4), the zonal-mean zonal flow is decelerated (accelerated) where there is convergence (divergence) of the EP flux (Hartmann et al.,2000).
Moreover, the horizontal wave activity flux (Takaya and Nakamura, 2001) is calculated to illustrate the flow of energy between SIC_BKS anomalies and the NH midand high-latitude atmosphere.The singular value decomposition (SVD), correlation coefficient (CC), regression analysis, and composite analysis are adopted in analyzing the data.In addition, the significance of all these analyses is determined by using the two-tailed Student’sttest.
3.Results
3.1 Decadal change in the linkage between SIC_BKS_ND and SPV_Jan
It is found that the monthly SICI_BKS is not significantly correlated with the SPVI in subsequent January(SPVI_Jan) for the period 1979-2017 (table omitted).All 13-yr sliding CCs between the two indices exhibit positive-negative-positive change (figure omitted), implying that a decadal change in the linkage between SIC_BKS and SPV_Jan has generally occurred in all months of recent decades.According to the sliding correlation, the SICI_BKS is positively correlated to the SPVI_Jan for the period 1979-1995, whereas the correlation between the two indices is negative during 1996-2009.Furthermore, by calculating the CCs between the monthly SICI_BKS and the SPVI_Jan in the two periods of 1979-1995 and 1996-2009, we find that November and December are the two months that best exhibit the decadal change between SIC_BKS and SPV_Jan (Fig.1a).We repeated the analyses using the SPVI_Jan obtained from JRA55 (Fig.1b) and obtained similar results.Moreover, as mentioned in the introduction, SIC_BKS_ND may exert the largest impact upon NH mid- and igh-latitude circulation in the subsequent winter, and thus our interest lies in SIC_BKS_ND in this study.As shown in Fig.1c, during 1979-1995, the SICI_BKS_ND is positively correlated with the SPVI_Jan (R= 0.78,exceeding the 99% confidence level), whereas a negative correlation is detected during 1996-2009 (R= −0.43).We repeated the analyses using the SPVI_Jan derived from JRA55 and obtained similar results.For the period 2010-2017, the sample size is small and the CCs between the monthly SICI_BKS and the SPVI_Jan are low, so it is no longer considered.In addition, the SICI_BKS_ND and the SPVI in subsequent February are not significantly correlated (R= 0.28), and their 13-, 15-,and 17-yr sliding correlation coefficients both show that there is no significant decadal change in their relationships, and they are not significant throughout the period 1979-2017 (figure omitted).Therefore, this study does not analyze the linkage between SIC_BKS_ND and SPV in subsequent February.
To visualize the decadal change in the relationship,SIC_BKS_ND anomalies in 1984 and 2003 and polar cap geopotential height anomalies at 50 hPa in subsequent January are displayed in Fig.2.The year 1984(2003) is with min (max) SIC value in the context of weak SPV (Fig.1c).The positive anomalies in the stratospheric polar cap geopotential height anomalies at 50 hPa indicate a weak SPV.It can be seen that in 1984, SIC_BKS_ND is anomalously low (Fig.2a), and the SPV_Jan anomaly is weak (Fig.2c).However, during 2003, the SPV_Jan anomaly is weak (Fig.2d), SIC_BKS_ND is anomalously high (Fig.2b).Furthermore, the heterogeneous correlation maps of the first SVD mode (SVD1)between SIC_BKS_ND and the polar cap geopotential height anomalies at 50 hPa in subsequent January for the periods of 1979-1995 and 1996-2009 are applied to reveal the spatial structure of this decadal change (Fig.3).The SVD1 can explain 95% of the covariance and has an out-of-phase pattern for the period of 1979-1995 (Figs.3a, c).However, SVD1 can explain 88% of the covariance and presents a coherent pattern for the period of 1996-2009 (Figs.3b, d).
Figure 4 displays the anomalous polar cap geopotential height at 50 hPa in subsequent January corresponding to light/heavy SICI_BKS_ND anomalies in the two periods of 1979-1995 and 1996-2009.Regression analyses show that a significantly weak SPV_Jan anomaly associated with anomalously less SIC_BKS_ND can be seen during 1979-1995 (Fig.4a); during 1996-2009,however, anomalously low SIC_BKS_ND corresponds to a strong SPV_Jan (Fig.4b).Furthermore, comparing with 1996-009, we can see that the intensity of the SPV_Jan anomaly during 1979-1995 is relatively stronger.To verify the results, the composite analysis is adopted.Taking into account the sample size, the heavy/light sea ice years are defined as when the standardized SICI_BKS_ND is greater/less than +0.3/−0.3.The three heaviest SICI_BKS_ND years (1980, 1982,and 1988) and six lightest SICI_BKS_ND years (1981,1984, 1985, 1986, 1989, and 1993) are selected for the period of 1979-1995, and the six heaviest SICI_BKS_ND years (1997, 1998, 2002, 2003, 2004, and 2008) and four lightest SICI_BKS_ND years (1996, 2000, 2001,and 2007) are adopted for the period of 1996-2009.The results obtained from the composite analysis (Figs.4c, d)are similar to the regression analysis.We repeated the analyses using the JRA55 and obtained similar results(Fig.5).It is well-recognized that SIC_BKS_ND has declined rapidly in recent decades, and this study focuses on analyzing the conditions associated with anomalously low SIC_BKS_ND.Thus, SICI_BKS_ND multiplied by−1 (reversed_SICI_BKS_ND) is adopted in the following analyses.

Fig.2.SIC_BKS_ND anomalies (%) in (a) 1984 and (b) 2003.Anomalies in (a, b) are calculated based on the climatology of 1979-2017.The black frames represent the BKS region.The geopotential height anomalies northward of 65°N at 50 hPa in (c) January 1985 and (d) January 2004(H50_Jan; gpm).Anomalies in (c, d) are calculated based on the climatology of 1980-2018.The geopotential height is obtained from NCEP/NCAR.
In addition to geopotential height, air temperature, and zonal wind in the stratospheric polar region can also describe variations in the strength of SPV.Figure 6 displays the cross-sections of zonal-mean subsequent January geopotential height, air temperature, and zonal wind anomalies associated with reversed_SICI_BKS_ND in the two periods.For the period 1979-1995, anomalously low SICI_BKS_ND corresponds to subsequent January positive geopotential height, weak zonal wind, and positive air temperature anomalies in the stratospheric polar region (Figs.6a, c, e), which all indicate a weak SPV anomaly.By contrast, during 1996-2009, in conjunction with anomalously low SICI_BKS_ND, the anomalous subsequent January negative geopotential height, strong zonal wind, and negative air temperature in the stratospheric polar region (Figs.6b, d, f) are detected, which all indicate a strong SPV anomaly.
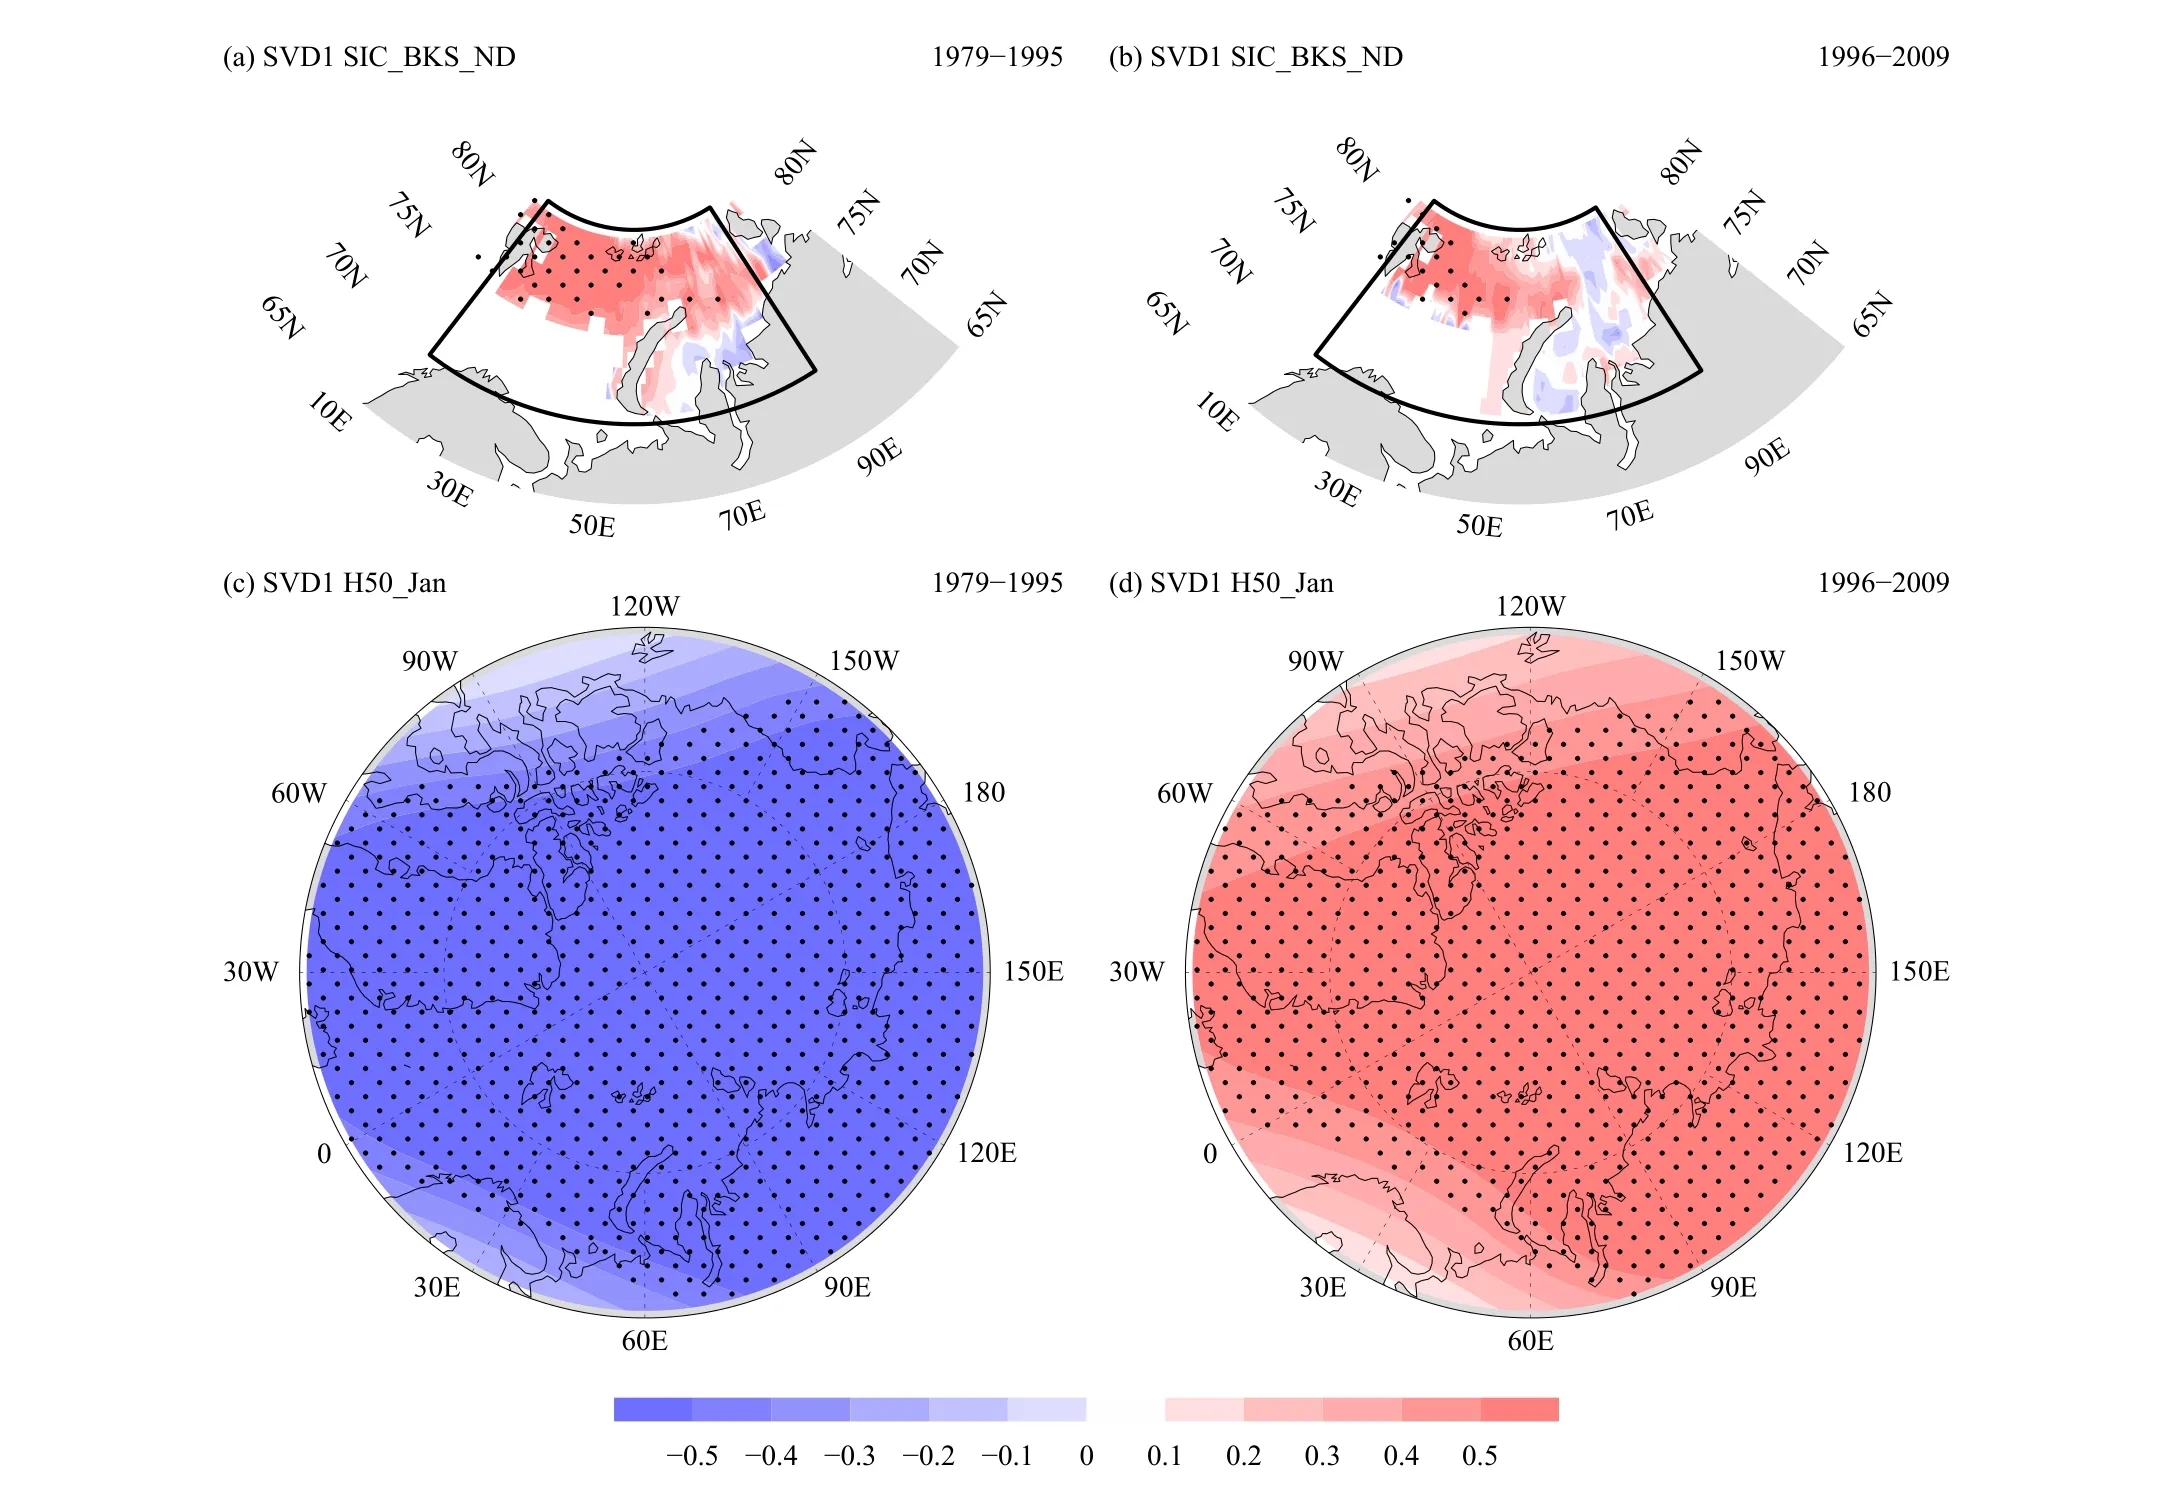
Fig.3.Heterogeneous correlation maps of the first singular value decomposition mode (SVD1) between (a) SIC_BKS_ND and (c) the geopotential height northward of 65°N at 50 hPa in subsequent January (H50_Jan) for the period of 1979-1995.The geopotential height is obtained from NCEP/NCAR.(b, d) As in (a, c), but for the period 1996-2009.The black frames in (a, b) represent the BKS region.The black dotted areas indicate statistical significance at the 90% confidence level based on the Student’s t-test.
3.2 Different features of SIC_BKS_ND and associated tropospheric wave-train structure between 1979–1995 and 1996–2009
All the above analyses show that the decadal change in the linkage between SIC_BKS_ND and SPV_Jan in the periods of 1979-1995 and 1996-2009 is robust.What, therefore, are the differences in SIC_BKS_ND between the two periods, leading to its different linkage with SPV_Jan? To answer this question, we compare the interannual SIC_BKS_ND and the interannual standard deviations (SDs) of SIC_BKS_ND in the two periods(Figs.7a, b).We find that during 1996-2009, SIC over the BKS, especially the northern BKS, is much lighter than that during 1979-1995 (Fig.7a).Besides, the interannual variability of the SDs of SIC_BKS_ND has intensified for the period 1996-2009 (Fig.7b).Furthermore, we also note that the center of SDs of SIC_BKS_ND shifts more southeast during 1996-2009 relative to that during 1979-1995.In addition, the anomalously low SIC_BKS_ND in the two periods corresponds to simultaneous significantly positive turbulent heat flux anomalies over the BKS region (Figs.7c, d), indicating that heat is released from the ocean to the atmosphere—that is, sea ice affects the atmosphere.Compared with 1979-1995, however, the turbulent heat flux anomalies during 1996-2009 are relatively stronger, accompanied by the more southeastern distribution of the BKS region.To verify the results of Figs.7c, d, we repeated the analyses through composite analysis and obtained similar results (figure omitted).
The above analyses reveal that there are significant differences in the features of SIC_BKS_ND in the two periods of 1979-1995 and 1996-2009.Such changes may induce different stationary Rossby waves, thus impacting differently upon the tropospheric circulation through the tropospheric pathway.Furthermore, such tropospheric changes may also exert different effects on the stratospheric circulation through the stratospheric pathway.What, therefore, is the difference in the tropospheric wave-train structure associated with different features of SIC_BKS_ND in the two periods? Figure 8a displays the difference field (1996-2009 minus 1979-1995) of the zonal wind at 200 hPa.Both the climatological polar front jet and the climatological subtropical jet may serve as a waveguide for stationary Rossby waves propagation.Compared with 1979-1995, the November-December polar front jet is weaker; the November-December subtropical jet, however, is stronger during 1996-2009.Based on the geographic location of the BKS, the Rossby waves triggered by SIC_BKS_ND anomalies propagate mainly along the polar front jet waveguide.The Rossby wave activity flux and geopotential height anomalies at 200 hPa associated with reversed_SICI_BKS_ND in the two periods are displayed in Figs.8b, c.The fewer SIC_BKS_ND anomalies during 1996-2009 correspond to stronger turbulent heat fluxes, but the intensity of the polar front jet waveguide is weaker.Thus, the Rossby waves propagate weakly eastward, causing the geopotential height anomalies over Eurasia to exhibit a weak negative-positive-negative wave-train structure from west to east (Fig.8c).In addition to the intensity, the location of the centers of the height anomalies is also different between the two periods.The center of the height anomalies during 1996-2009 moves significantly eastward (by about 30° of longitude) compared to 1979-1995, especially over the BKS.The positive height anomalies corresponding to anomalous decreasing SIC_BKS_ND are distributed relative to the northwest of the BKS during 1979-1995 (Fig.8b), while their distribution is obviously to the southeast during 1996-2009 (Fig.8c).To verify the results, we repeated the above analyses through composite analysis, and obtained similar results(figure omitted).Such changes may have led to the change in the linkage between tropospheric planetary waves anomalies and climatological planetary waves.

Fig.4.The geopotential height northward of 65°N at 50 hPa in subsequent January (H50_Jan; gpm) corresponding to SICI_BKS_ND anomalies for the periods of (a, c) 1979-1995 and (b, d) 1996-2009.The geopotential height is obtained from NCEP/NCAR.Panels (a) and (b) display the regressed anomalies upon reversed_SICI_BKS_ND.Panels (c) and (d) show the composite differences between light and heavy SICI_BKS_ND years.The dotted areas indicate statistical significance at the 90% confidence level based on the Student’s t-test.

Fig.5.As in Fig.4, but for the geopotential height from JRA55.
3.3 Planetary waves anomalies excited by SIC_BKS_ND
Previous studies have illustrated that the SPV anomaly is driven by Arctic SIC anomalies primarily through the vertical flux of the tropospheric wave activity (Kim et al., 2014; Zhang et al., 2018a, b; Xu et al., 2021).The linear interference of planetary waves 1 and 2 largely determines the vertical wave activity of planetary waves(Garfinkel et al., 2010; Nishii et al., 2010; Smith et al.,2010; Fletcher and Kushner, 2011).Besides, both demonstrate an emergence and gradual increase in vertical wave activity prior to the occurrence of the stratospheric polar cap geopotential height anomalies (Polvani and Waugh, 2004; Kim et al., 2014; Dai et al., 2019; Xu et al., 2021).Meanwhile, studies reveal that the tropospheric wave-train structure anomaly is the main driver of the enhanced/weakened upward-propagating tropospheric planetary waves into the lower stratosphere at high-latitude in winter (Kim et al., 2014; Zhang et al.,2018a; Hu et al., 2019; Xu et al., 2021).
To examine the structures of tropospheric planetary waves anomalies induced by anomalously low SIC_BKS_ND that propagate into the lower stratosphere, the wavetrain structure displayed in Figs.8b, c is decomposed by wavenumber using a Fourier transformation along the latitudinal circle.Figure 9 displays planetary waves 1 and 2 of the height anomalies at 200 hPa associated with anomalously low SIC_BKS_ND in the two periods of 1979-1995 and 1996-2009.The regressed planetary waves anomalies (contours) are compared with the climatology (shading).For the period 1979-1995, planetary waves 1 and 2 of the height anomalies connected with diminishing SIC_BKS_ND are approximately in phase with their corresponding climatological planetary waves 1 and 2, especially planetary wave 2 with a stronger magnitude (Figs.9a, c).Figure 10 displays the simultaneous zonal-mean EP flux and EP divergence associated with anomalously low SIC_BKS_ND in the two periods of 1979-1995 and 1996-2009.Since the wave energy is proportional to the square of wave amplitude,the anomalous waves that are in phase with climatological waves constructively interfere with them.Thus, during 1979-1995, the low SIC_BKS_ND anomalies tend to enhance upward-propagating planetary waves into the lower stratosphere at high-latitude (Fig.10a) and the anomalous waves activities can persist into the subsequent January (figure omitted), which contributes to the increase in the stratospheric geopotential height in the polar region (Figs.4a, c; 5a, c; 6a).These positive stratospheric geopotential height anomalies coincide a deceleration of the stratospheric zonal wind (Fig.6c) according to the wave-mean flow interaction and an increase in Arctic stratospheric temperature (Fig.6e), corresponding to a weak SPV_Jan anomaly.
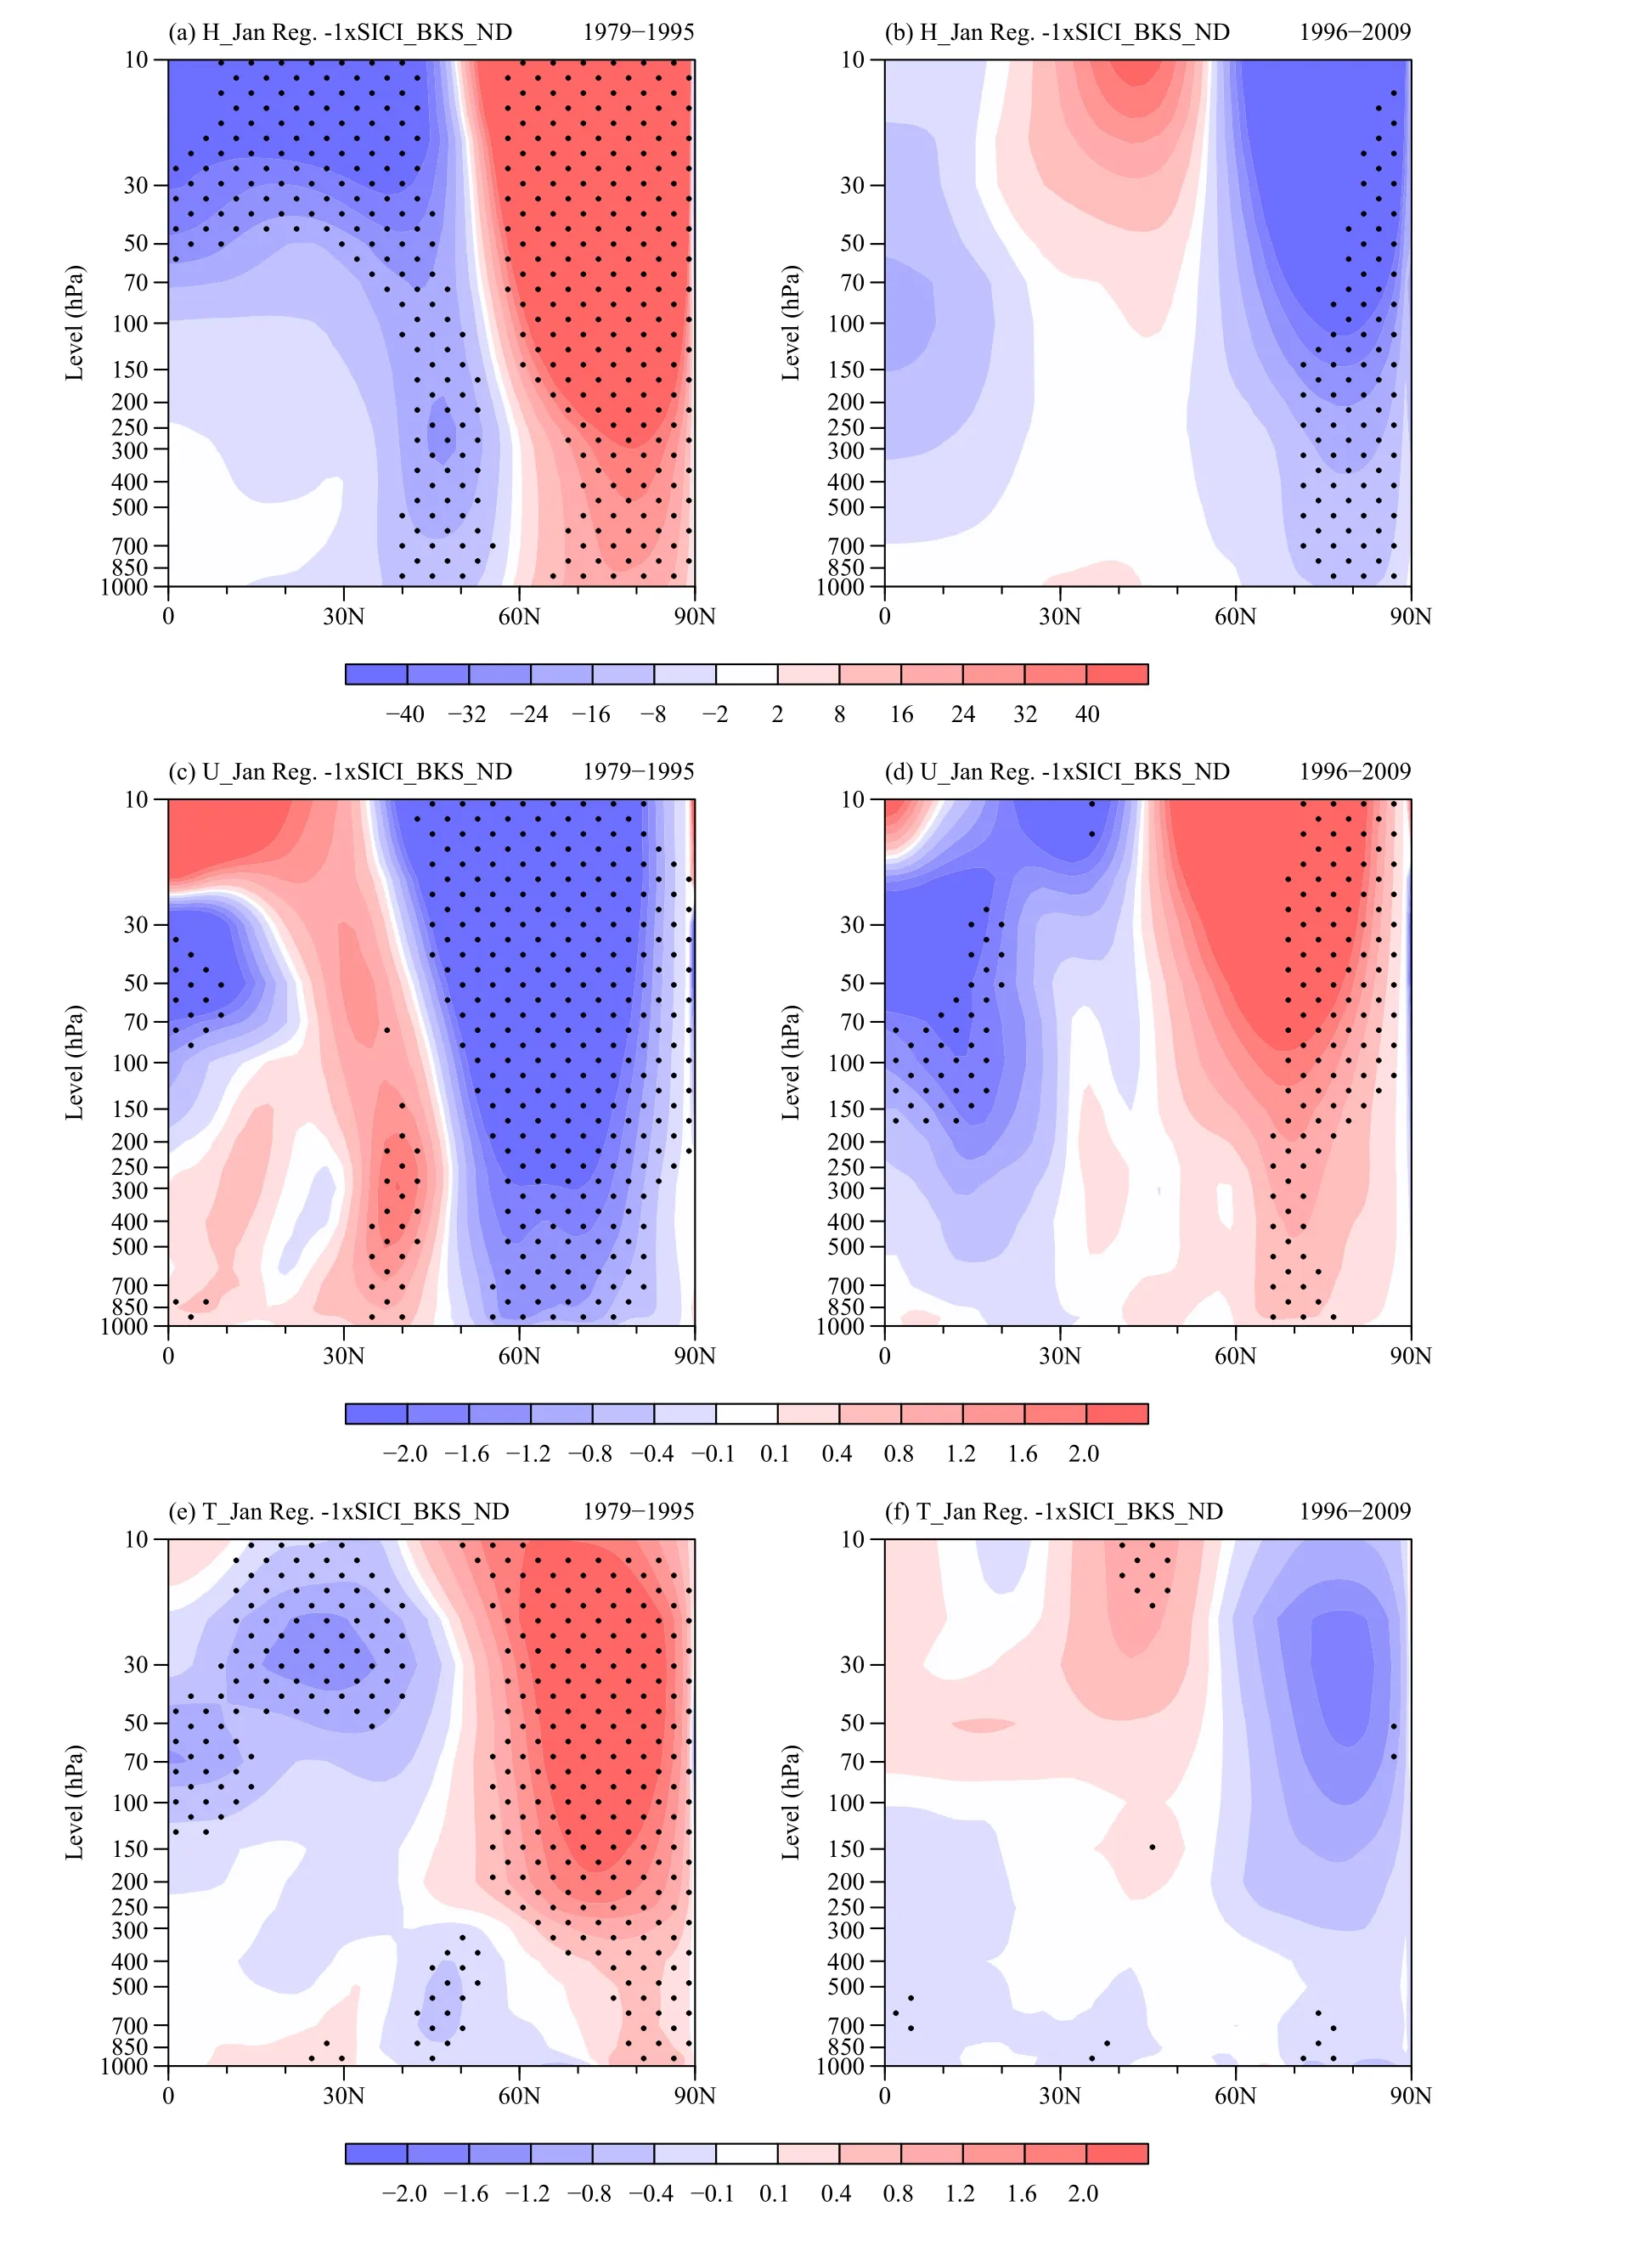
Fig.6.Regression maps of the zonal-mean subsequent January (a) geopotential height (H_Jan; gpm), (c) zonal wind (U_Jan; m s−1), and (e) air temperature (T_Jan; °C) upon reversed_SICI_BKS_ND for the period of 1979-1995.The variables are obtained from NCEP/NCAR.(b, d, f) As in (a, c, e), but for the period 1996-2009.The black dotted areas indicate statistical significance at the 90% confidence level based on the Student’s t-test.
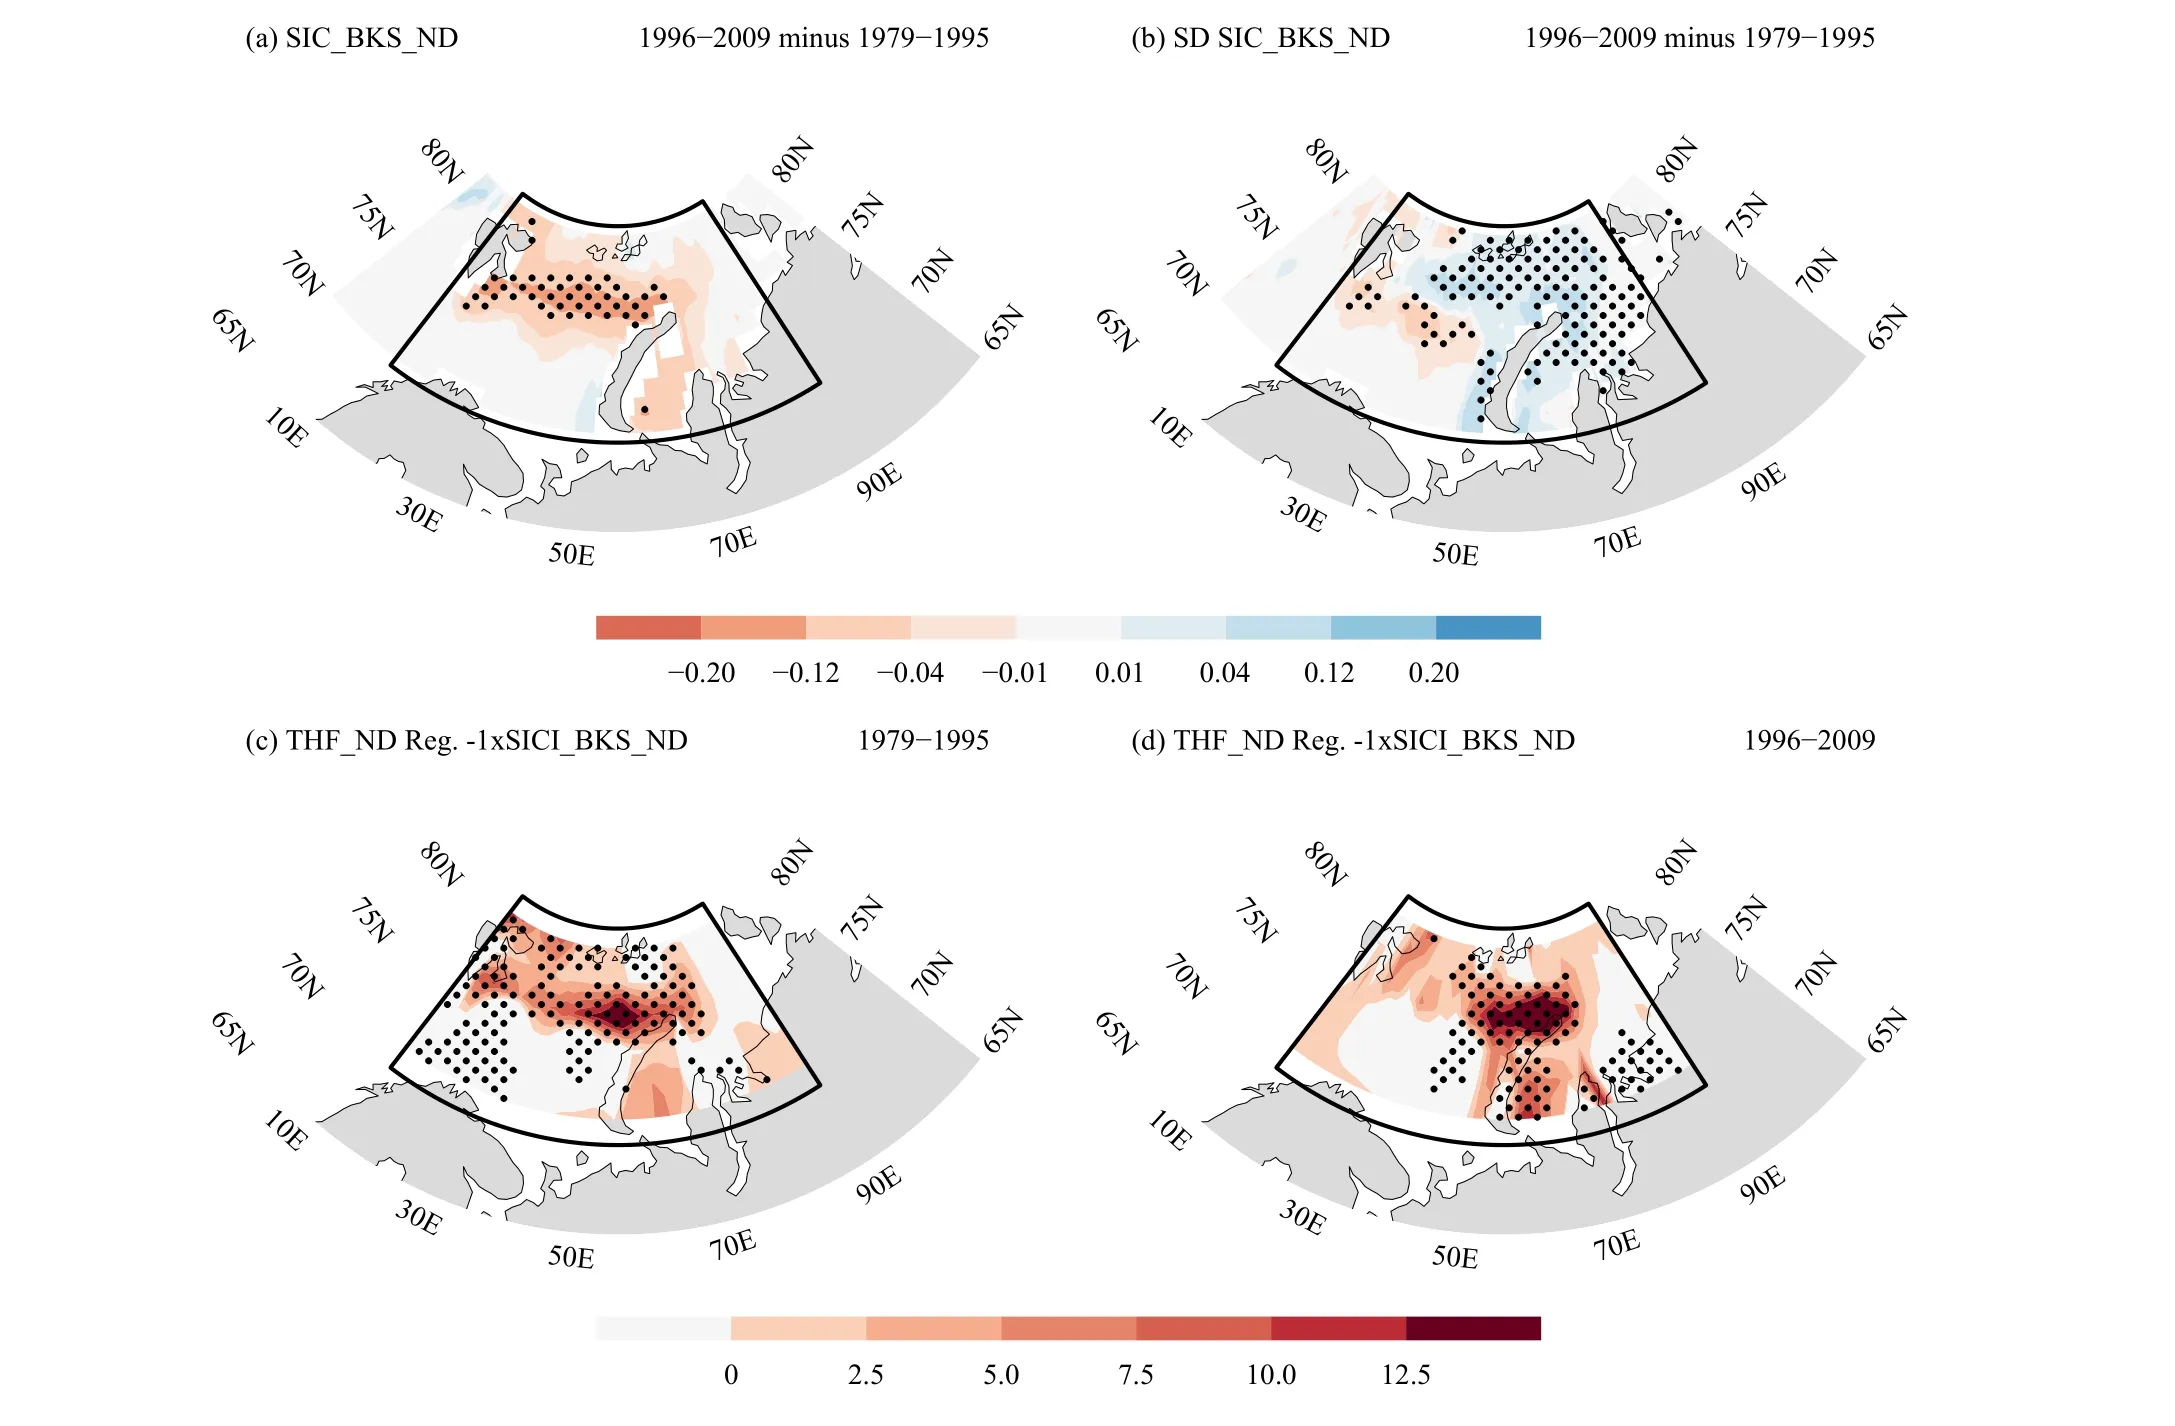
Fig.7.The difference (1996-2009 minus 1979-1995) field of (a) the interannual SIC_BKS_ND (%) and (b) the interannual standard deviations(SDs) of SIC_BKS_ND.Regression maps of the simultaneous turbulent heat flux (THF, the sum of sensible and latent heat flux; W m−2) upon reversed_SICI_BKS_ND for the period (c) 1979-1995 and (d) 1996-2009.Positive values indicate that heat is released from the ocean to the atmosphere.The black frames represent the BKS region.The variables are obtained from NCEP/NCAR.The black dotted areas indicate statistical significance at the 90% confidence level based on the Student’s t-test.
However, opposite changes occur in 1996-2009.Specifically, planetary wave 2 of the height anomalies related to anomalously low SIC_BKS_ND are out-of-phase with its climatology (Fig.9d).Besides, at high-latitudes,planetary wave 1 of the height anomalies associated with anomalously less SIC_BKS_ND are also out-of-phase with its climatology, although its anomalies at mid-latitudes are in-phase with the climatology (Fig.9b).The planetary waves 1 and 2 have similar amplitudes and thus the total response is still linearly destructive.The destructive interference leads to suppression of upwardpropagating planetary waves into the lower stratosphere at high-latitude during 1996-2009 (Fig.10d) and the anomalous waves activities can persist into the subsequent January (figure not shown), which is likely to have decreased the stratospheric geopotential height in the polar region (Figs.4b, d; 5b, d; 6b), strengthened the stratospheric zonal wind in the polar region (Fig.6d), and decreased Arctic stratospheric temperature (Fig.6f), corresponding to a strong SPV_Jan anomaly.Furthermore,comparing with 1996-2009, we can see that the intensity of planetary waves anomalies during 1979-1995 is relatively stronger, which is consistent with their intensity of the SPV_Jan anomaly.To verify the results of Fig.9, we repeated the above analyses through composite analysis and obtained similar results (figure not shown).
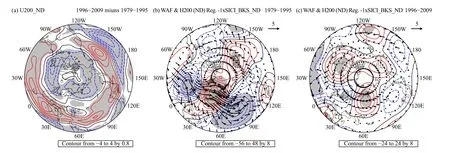
Fig.8.(a) The difference (1996-2009 minus 1979-1995) field of the zonal wind at 200 hPa in November-December (U200_ND; m s−1), and (b,c) regression maps of the simultaneous geopotential height at 200 hPa (H200; contours; gpm) and Rossby wave activity fluxes (WAF; vectors;m2 s−2) upon reversed_SICI_BKS_ND for the period (b) 1979-1995 and (c) 1996-2009.The variables are obtained from NCEP/NCAR.The gray shaded areas indicate statistical significance at the 90% confidence level based on the Student’s t-test.

Fig.9.(a) The planetary wave 1 of geopotential height (gpm) at 200 hPa during November-December for 1979-1995.The anomalies regressed upon reversed_SICI_BKS_ND (contours) are compared with the climatology (shading).(c) As in (a), but for planetary wave 2 (gpm).The variables are obtained from NCEP/NCAR.(b, d) As in (a, c), but for 1996-2009.
Furthermore, we analyze the contribution of planetary waves with distinct wavenumber.For the period 1979-1995, in the lower stratosphere of high-latitude(100-10 hPa, 60°-80°N), the intensity of anomalous EP flux and EP flux convergence of planetary wave 2 is stronger compared with planetary wave 1, and the statistical significance is also mainly from the planetary wave 2(Figs.10a-c), which indicate that the formation of EP flux convergence anomaly during 1979-1995 mainly originates from the contribution of planetary wave 2.The result is consistent with the recent studies (Zhang et al.,2020; Ding and Wu, 2021).For the period 1996-2009, in the lower stratosphere of high-latitude (50-10 hPa,60°-75°N), the formation of EP flux divergence anomaly mainly originates from the contribution of planetary wave 1 (Fig.10e); however, in the lower stratosphere of middle latitudes (100-50 hPa, 50°-65°N), the EP flux divergence anomaly mainly originates from the contribution of planetary wave 2 (Fig.10f).By contrast, the EP flux divergence anomaly caused by planetary wave 1 is relatively stronger.
3.4 Verification with CMIP6 models
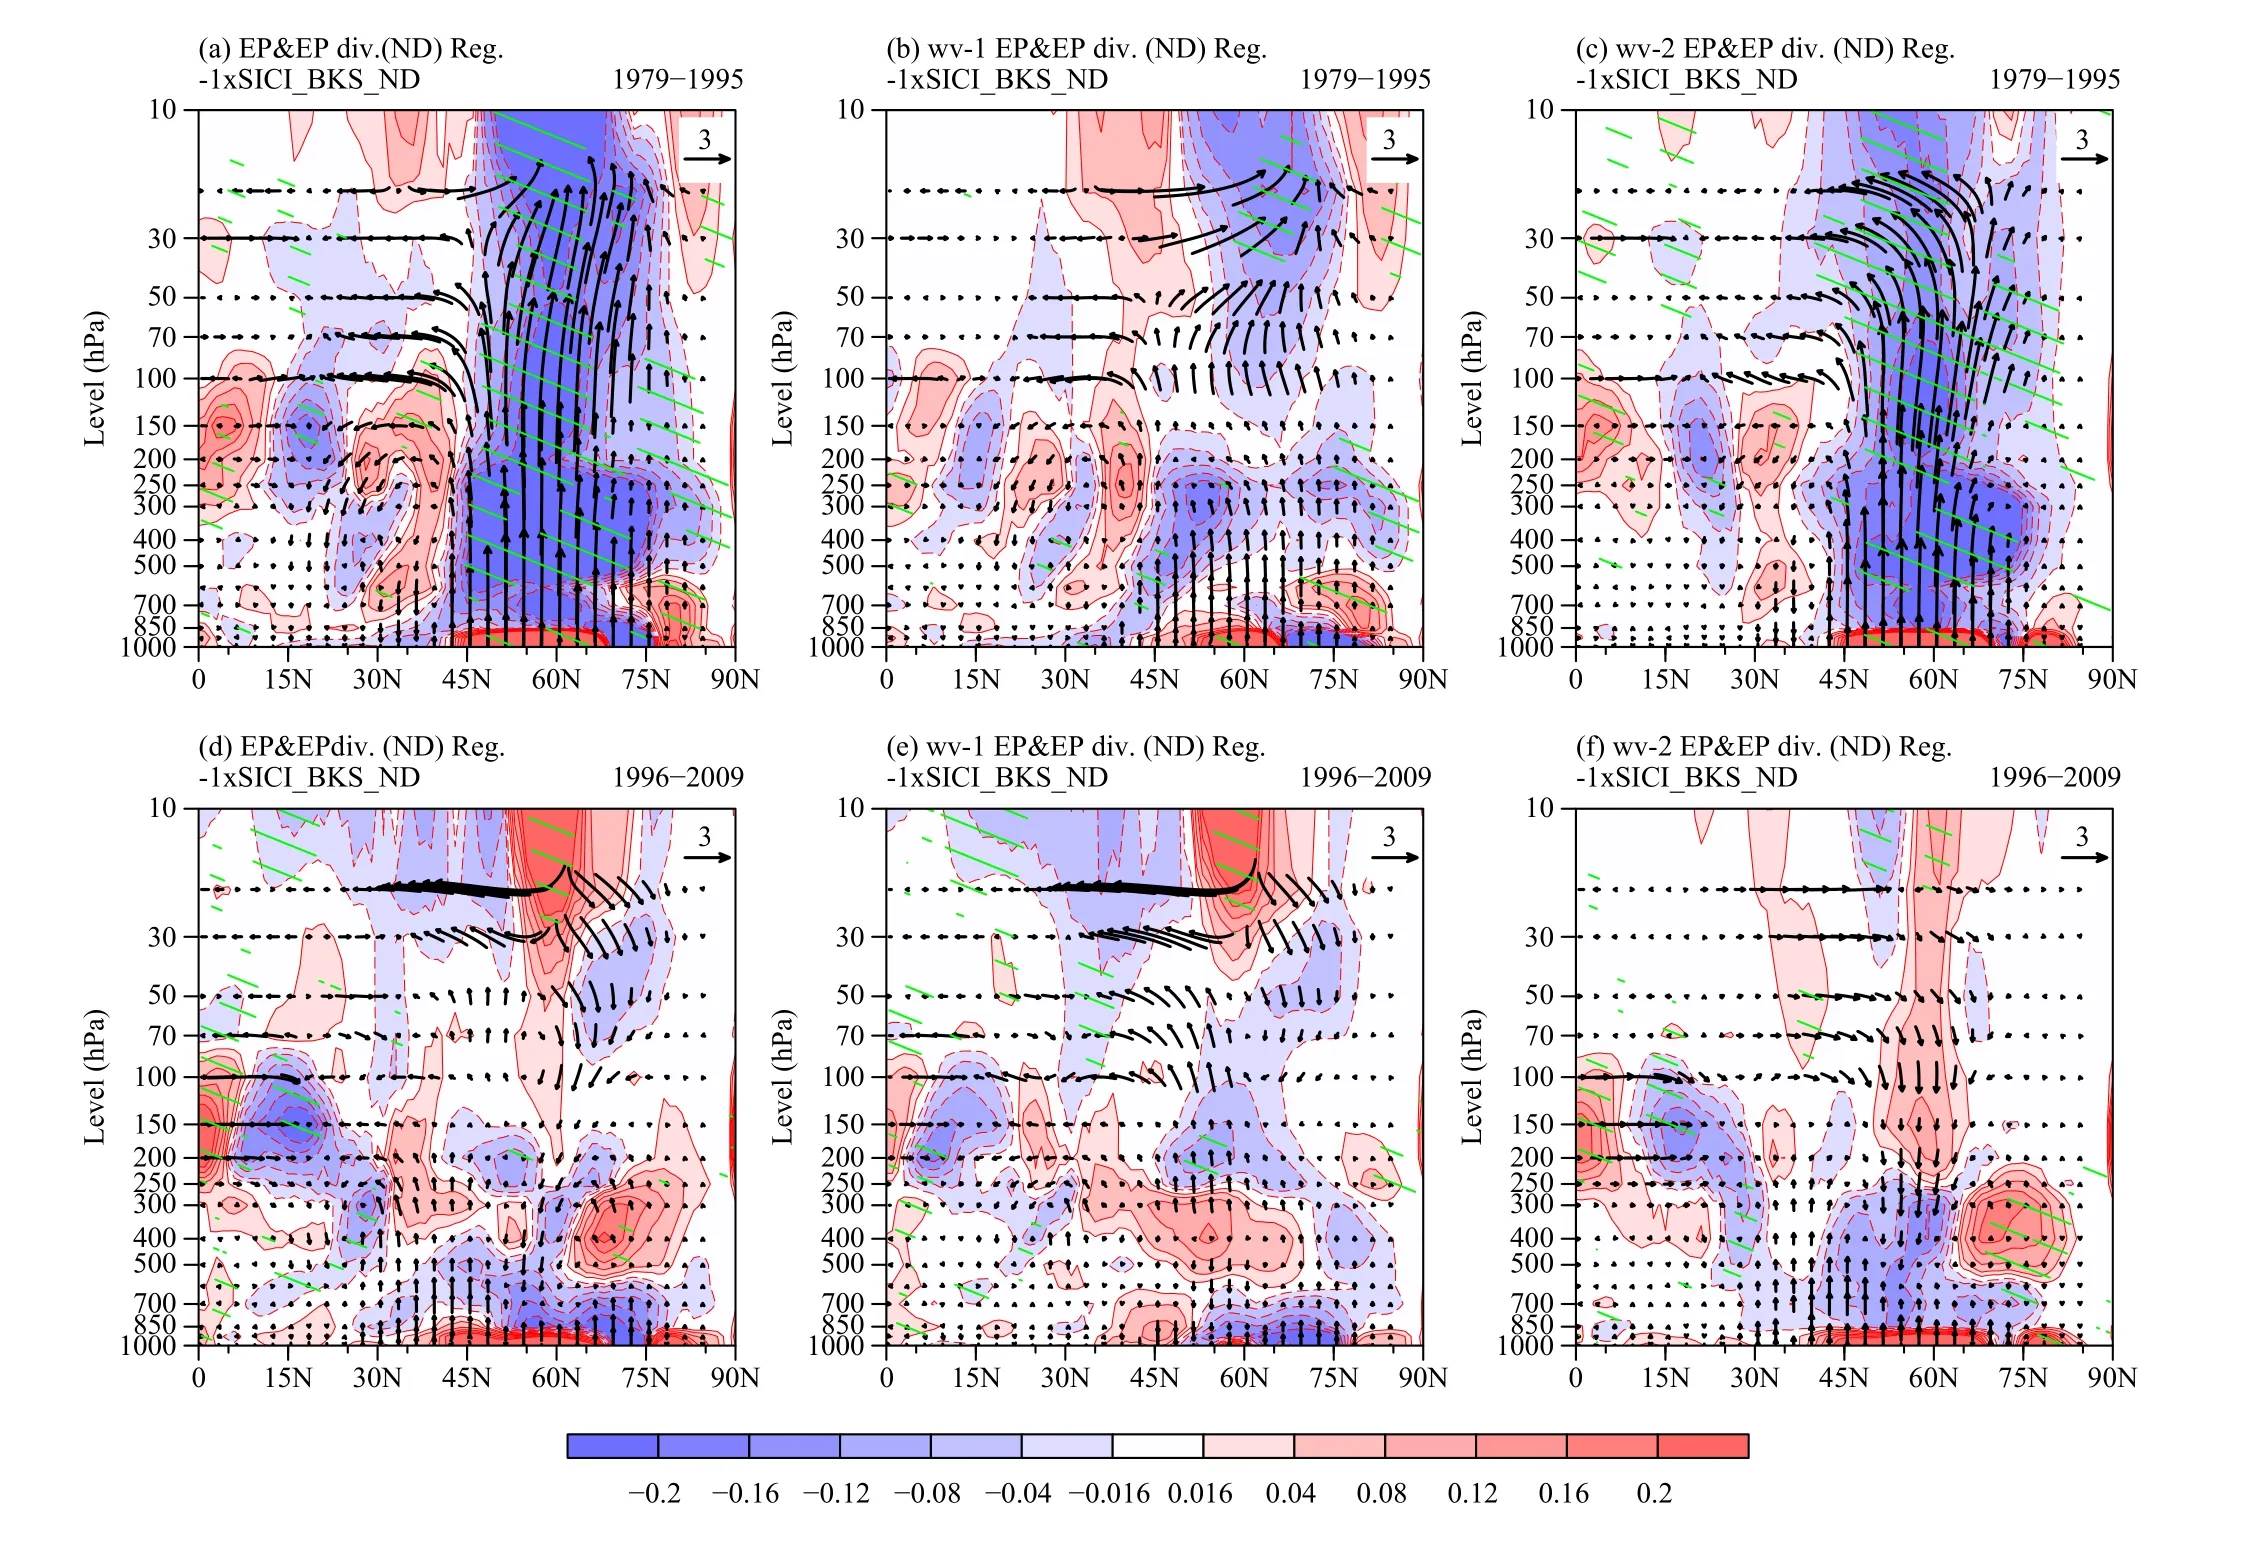
Fig.10.Regression maps of the simultaneous zonal-mean EP flux (vectors; 108 m2 s−2) and EP divergence (shading; m s−1 day−1) upon reversed_SICI_BKS_ND during 1979-1995 for (a) planetary waves 1 and 2, (b) planetary wave 1, and (c) planetary wave 2.The variables are obtained from NCEP/NCAR.(d, e, f) As in (a, b, c), but for 1996-2009.The green slashed areas indicate statistical significance at the 90% confidence level based on the Student’s t-test.
The above analyses reveal the underlyi ng dynamic mechanism that accounts for the decadal change in the linkage between SIC_BKS_ND and SPV_Jan.In this section, we use the outputs of the historical simulations provided by CMIP6 to further verify the mechanisms.By calculating the CCs between SIC_BKS_ND and SPV_Jan during 1979-1995 and 1996-2009, we find that nine models (BCC-CSM2-MR, CESM2, CMCC-CM2-SR5, FGOALS-f3-L, MRI-ESM2-0, GISS-E2-1-H,IPSL-CM6A-LR, MIROC6, and MPI-ESM-1-2-HAM)can reproduce the decadal change.The available variables used include the monthly geopotential height, air temperature, zonal wind, meridional wind, and SIVol(sea ice volume per area).Before performing the analyses, we interpolated all the model simulation data to a horizontal resolution of 1° × 1°.Here, the ensemble mean results of the nine model simulations are provided.
First, to further verify that the CMIP6 models can reproduce the decadal change in the relationship between SIC_BKS_ND and SPV_Jan, the heterogeneous correlation maps of the SVD1 between the CMIP6-simulated SIC_BKS_ND and the CMIP6-simulated polar cap geopotential height anomalies at 50 hPa in subsequent January during 1979-1995 and 1996-2009 are applied (Fig.11).It can be seen that the SVD1 can explain 75% of the covariance and has an out-of-phase pattern during 1979-1995 (Figs.11a, c).However, the SVD1 can explain 78%of the covariance and presents a coherent pattern during1996-2009 (Figs.11b, d).These results are overall consistent with the observations (Fig.3), indicating that the CMIP6 models can capture the decadal change of the linkage between SIC_BKS_ND and SPV_Jan.
Then, we compare the interannual SIC_BKS_ND and the SDs of SIC_BKS_ND during the two periods (Figs.12a, b).It can be seen that the CMIP6 models can reproduce the distribution of less SIC over the BKS region during 1996-2009 compared to 1979-1995 (Fig.12a).Meanwhile, the models can reproduce weak (intensified)interannual variability of the SDs of SIC in the western(central) BKS during 1996-2009 compared to 1979-1995 (Fig.12b).Besides, the CMIP6-simulated geopotential height anomalies associated with anomalously less SIC_BKS_ND present a negative-positive-negative wave-train structure over Eurasia from west to east during the two periods (Figs.12c, d), and the position of the positive height anomaly during 1996-2009 moves eastward, which is consistent with previous analyses.Furthermore, during 1979-1995, the anomalously low SIC_BKS_ND tend to enhance upward-propagating planetary-scale waves into the lower stratosphere at highlatitude (Fig.12e).During 1996-2009, however, the low SIC_BKS_ND anomalies tend to suppress vertically propagating planetary-scale waves into the lower stratosphere at high-latitude (Fig.12f).These CMIP6-simulated results are basically consistent with the observations.

Fig.11.As in Fig.3, but for the ensemble mean results of the nine models in CMIP6.
On the other hand, the CMIP6-simulated results also differ from the observations.First, the CMIP6-simulated anomalous amplitudes of change of SIC between the two periods are smaller than observation (Fig.12a).Then, as shown in Fig.12b, except for the central BKS, the SDs of SIC in the eastern BKS is negative, indicating a weaker interannual variability, which is contrary to the observation.Besides, the intensity of the CMIP6-simulated anomalous height over Eurasia and EP flux in the lower stratosphere at high-latitude is stronger during 1996-2009 compared to 1979-1995 (Figs.12c-f), which is also contrary to the observation.
Although there are differences between the CMIP6-simulated results and observation, to a certain extent, the decadal change in the relationship between SIC_BKS_ND and SPV_Jan, and associated physical linkages can be reproduced by the CMIP6 historical simulations.

Fig.12.The difference (1996-2009 minus 1979-1995) field of (a) the interannual SIC_BKS_ND (m) and (b) the interannual SDs of SIC_BKS_ND.The black frames represent the BKS region.(c) The simultaneous geopotential height at 200 hPa (contours; gpm) and Rossby wave activity fluxes (vectors; m2 s−2), and (e) the simultaneous zonal-mean EP flux for planetary waves 1 and 2 (vectors; 108 m2 s−2) and EP divergence (shading; m s−1 day−1) upon reversed_SICI_BKS_ND for the period 1979-1995.The variables are obtained from the ensemble mean results of the nine model in CMIP6.(d, f) As in (c, e), but for the period 1996-2009.The black dotted areas in (a, b), the gray shaded areas in (c,d) and the green slashed areas in (e, f) indicate statistical significance at the 90% confidence level based on the Student’s t-test.
4.Conclusions and discussion
In this study, the linkage between SIC_BKS_ND and SPV_Jan is investigated.It is found that SIC_BKS_ND is positively (negatively) correlated with SPV_Jan for the period 1979-1995 (1996-2009).We reveal the possible mechanism for the decadal change in the linkage.First of all, we analyze the different features of SIC_BKS_ND in the two periods.During 1979-1995 (1996-2009), SIC_BKS_ND is relatively higher (lower), accompanied by smaller (larger) interannual variability.Furthermore, the center of SDs of SIC_BKS_ND shifts more southeast during 1996-2009 relative to that during 1979-1995.Moreover, compared with 1979-1995, turbulent heat flux anomalies associated with fewer SIC_BKS_ND anomalies during 1996-2009 are relatively stronger, accompanied by the more southeastern distribution of the BKS region.
The different features of SIC_BKS_ND in the two periods may then induce a different stationary Rossby wave-train, thus impacting differently upon the tropospheric circulation and stratospheric circulation.For the period 1979-1995 (1996-2009), the polar front jet waveguide is relatively stronger (weaker), the simultaneous anomalous eastward-propagating stationary Rossby wave-train excited by the fewer SIC_BKS_ND anomalies is stronger (weaker), which causes a stronger(weaker) negative-positive-negative wave-train structure of geopotential height anomalies over Eurasia from west to east, with these anomalous centers shifting remarkably westward (eastward).
Thus, such changes tend to enhance (suppress) upward-propagating tropospheric planetary waves into the lower stratosphere at high-latitude by constructive (destructive) interference of the anomalous wave-train structure with the climatological planetary waves, and thereby suppressing (strengthening) SPV_Jan for the period 1979-1995 (1996-2009).However, in conjunction with anomalously high SIC_BKS_ND, the interference of the planetary waves anomalies and climatological planetary waves shows an opposite distribution to that of anomalously low SIC_BKS_ND, which contributes to suppression (enhancement) of vertically propagating planetary waves and thereby leads to a strong (weak) SPV_Jan anomaly for the period 1979-1995 (1996-2009).
It can be seen that one of the main reasons for the decadal change of the linkage between SIC_BKS_ND and SPV_Jan is the shifts of the center of interannual variability in SIC_BKS_ND between the two periods.In addition, as mentioned in the introduction, previous studies have suggested that the snow-cover anomalies and associated anomalous soil moisture over Eurasia may act as a bridge in the linkage between SIC_BKS and NH midand high-latitude circulation.In this study, however, the region of snow-cover anomalies corresponding to low SIC_BKS_ND anomalies does not overlap with the region of upward-propagating tropospheric planetary waves, indicating that the effect of snow-cover anomalies is relatively small (figure omitted).There may be other climatic factors acting as bridges between SIC_BKS_ND and SPV_Jan.As such, further studies are needed in the future to explore these aspects.
Acknowledgments.The authors are grateful to the editors and anonymous reviewers for their constructive comments.
 Journal of Meteorological Research2022年4期
- Journal of Meteorological Research的其它文章
- Cause–Effect Relationship between Meso-γ-Scale Rotation and Extreme Short-Term Precipitation: Observational Analyses at Minute and Sub-Kilometer Scales
- Updated Simulation of Tropospheric Ozone and Its Radiative Forcing over the Globe and China Based on a Newly Developed Chemistry–Climate Model
- Identifying Supercooled Liquid Water in Cloud Based on Airborne Observations:Correlation of Cloud Particle Number Concentration with Icing Probability and Proportion of Spherical Particles
- Heavy Precipitation over the Jing–Jin–Ji Region in Early October: What Controls Its Interannual Variability?
- Height Variation in the Summer Quasi-Zero Wind Layer over Dunhuang, Northwest China:A Diagnostic Study
- Simulations of a Persistent Heat Wave Event in Missouri in Summer 2012 Using a High-Resolution WRF Model