Determination of Brilliant Blue FCF and Erythrosine B in Beverage and Candy Samples Using In-situ Effervescence Assisted Microextraction Method Based on Acidic Ionic Liquid
WANG Qing,QIU Bin,HE Yan,WANG Lin-juan,ZHANG Hui,YANG Er-ling,ZHANG Xiao-yuan
(1.The College of Pharmacy,Xiangnan University,Chenzhou 423000,China;2.Chenzhou City Center for Disease Control and Prevention,Chenzhou 423000,China;3.Research Institute of Shaoguan Huagong High-Tech Industry,Shaoguan 512000,China;4.Industrial Technology Research Institute,South China University of Technology,Guangzhou 510640,China)
Abstract:The anion of acidic ionic liquid 1-butyl-3-methylimidazole hydrogen sulfate([C4MIM][HSO4])reacted with carbonate to produce carbon dioxide.The extraction process was promoted by carbon dioxide bubbles.Meanwhile,the cation of[C4MIM][HSO4]reacted in situ with ammonium hexafluorophosphate(NH4PF6)to form hydrophobic ionic liquid 1-butyl-3-methylimidazole hexafluorophosphate[C4MIM][PF6].[C4MIM][PF6]was separated from water due to their immiscibility with the water.The extraction phase was collected by centrifugation.An in-situ effervescent assisted microextraction method based on acidic ionic liquid was established for the analysis of brilliant blue FCF and erythrosine B in beverage and candy samples.Effects of the amount of acidic ionic liquid,sodium bicarbonate and salt on the extraction efficiency of the two pigments were investigated.The optimum conditions were as follows:the amount of acidic ionic liquid was 400 mg,the amount of sodium bicarbonate was 0.4 g and the amount of salt was 1.5 g.Under the optimal conditions,there were good linear relationships for brilliant blue FCF and erythrosine B in the range of 0.005-5µg/mL,with their correlation coefficients not less than 0.9933.The limits of detection(LODs)and limits of quantitation(LOQs)were in the range of 0.002-0.005 µg/mL and 0.007-0.017 µg/mL,respectively.Additionally,the recoveries for two synthetic pigments at two spiked levels of 0.05 and 0.5 µg/mL ranged from 92.2% to 107%,with the intra-day and inter-day relative standard deviations(RSDs)both 2.2%-8.7%.The proposed method was successfully applied to the detection of two target pigments in beverage and candy samples.The results showed that the method was environmentally friendly,simple and accurate.It could be used for the determination of brilliant blue FCF and erythrosine B in beverage and candy samples.
Key words:ionic liquid;effervescence assisted microextraction;synthetic pigments;beverage;candy
With the development of the times and the continuous improvement of people's living standards,more and more consumers pay more attention to food quality and safety.However,in recent years,food safety issues have frequently entered the vision of consumers,especially for the over range and illegal addition of food synthetic pigments.Synthetic pigments are often used as food additives play an important role in increasing the visual beauty of food,but they are often used by lawbreakers.Excessive synthetic pigments might have side effects on human health after being ingested and absorbed by the human body[1].It is harmful to the liver and nervous system,and can also become a potential factor of teratogenesis,mutagenesis and carcinogenesis[1-2].Moreover,when it is discharged into the environment,it will interfere with the reoxygenation of the aquatic system which reduces the dissolved oxygen in the water system and inhibits the photosynthetic capacity of hydroponics[3-4].Therefore,it is very important to evaluate the content of synthetic pigments in food.It is necessary to analyze and determine its content and composition in food samples[5].
In the process of establishing analysis methods,researchers had developed many detection methods for food colorant content,such as reverse phase high performance liquid chromatography[6],ion pair liquid chromatography[7],liquid chromatography-tandem mass spectrometry[8-9],and so on.However,the food matrix is complex and the content of pigments is generally low. Thus,the pretreatment of samples has become the key to accurate quantification.Therefore,it is very important to find an efficient enrichment method for the detection of pigments in food.At present,the following enrichment methods had been established,such as solid phase extraction[10],QuEChERS[11]and dispersive liquid-liquid microextraction[12].In addition to some commonly used extraction materials,some new materials were also used in their enrichment,such as graphene aerogel[13],black phosphorus[14],graphene oxide-molybdenum disulfide[15],metal-organic framework[16-17],and covalent organic framework[18].Additionally,magnetic nanomaterials were also used in the pretreatment of pigments because they could omit the steps of the filtration and the centrifugation[19].Among these methods,the traditional enrichment methods had the disadvantages of complex devices and environmental pollution caused by the use of organic reagents.Meanwhile,some new extraction materials had the disadvantages of complex process of preparation or high price.Therefore,the development of green,low-cost and high sensitivity methods is still needed.
Effervescence refers to the release of dissolved gas from aqueous solution,accompanied by bubble and foaming process.In recent years,some studies had combined the effervescence with extraction technology such as hollow fiber liquid-phase microextraction[20]and dispersed solid-phase microextraction[21]. These studies made use of the advantages of the effervescence to enhance the dispersion of the surface or make the extractant evenly distributed in liquid.Recently,Elpa et al.[22]established a method combined with gas chromatography using effervescent tablets. The process of the effervescent promoted the direct injection analysis of volatile solutes.In addition,the effervescence assisted liquid-liquid dispersion method,which had been considered as a green and effective means for the analyzing aqueous sample,was introduced by Lasarte-Aragones[23].Different from former exploited dispersing techniques,such as mechanical agitation,ultrasonication,microwave,and nitrogen foam flotation,target analytes were extracted by a simple chemical reaction without any energy source for the dispersion.In this process,carbon dioxide which was formed by carbonate and acid caused the extraction solvent to disperse in the aqueous media[24-25].It increased the contact area between the extraction agent and target analytes which further leaded to acceleration of the extraction procedure,thus enhancing extraction efficiency[26-27].
Ionic liquids are novel materials developed under the background of green chemistry in recent years.They are salts composed of organic cations and inorganic or organic anions,which are in liquid state at room temperature.Ionic liquid is an excellent green extraction solvent with excellent properties[28].The chemical and physical properties of ionic liquids can be adjusted by selecting appropriate cations,anions and ligands.In recent years,ionic liquids have attracted more and more attention because of their unique physicochemical properties,such as wide liquid range and dissolution range,low vapor pressure,good stability,adjustable acid-base, recyclability and so on. Their applications were all over many fields, such as material chemistry[29],environmental science[30],analysis and testing[31],drug delivery[32].Ionic liquids had excellent extraction properties which could be used directly as extraction materials or combined with other materials.Now they had been successfully used in the extraction of a variety of substances[33-34].
In the present study,we proposed a simple,effective and environment friendly technique using an acidic ionic liquid based on effervescence assisted microextraction method.The acidic ionic liquid[C4MIM][HSO4]was used as an extraction solvent and dispersant.In the process of extraction,the acidic ionic liquid was dispersed by carbon dioxide that was generated by the reaction of bicarbonate with the anion of the ionic liquid in the solution.Meanwhile,the hydrophobic ionic liquid[C4MIM][PF6]was formed in-situ by reacting with the NH4PF6through ion exchange.The[C4MIM][PF6]could be easily separated from the aqueous solution.The main variables investigated in this method were the amount of bicarbonate,acidic ionic liquid and salt addition.Under the optimal conditions,the linear range,the limits of detection(LODs)and limits of quantitation(LOQs),precision and accuracy were calculated to estimate the reliability of the method.Finally,the proposed method was applied to detect the amount of synthetic pigments in beverage and candy samples.
1 Experimental
1.1 Reagents
[C4MIM][HSO4]and NH4PF6were purchased from Shanghai Chengjie Company(Shanghai,China).Standard substances of synthetic pigments were supplied by Beijing Haian Hongmeng reference material technology Co. Ltd.(Beijing,China).Sodium chloride(NaCl),methanol(MeOH)and sodium bicarbonate(NaHCO3)were purchased form Sinopharm Chemical Reagent(Shanghai,China).Beverage and soft candy were obtained from a local supermarket. Ultrapure water was prepared using a PURE-LAB Ultra system(ELGA,UK)and used throughout the analyses.All reagents were of analytical grade unless otherwise stated.The chemical structures of brilliant blue FCF and erythrosine B were shown in the Fig.1.

Fig.1 The chemical structures of erythrosine B and brilliant blue FCF
1.2 Instruments
HPLC analysis was conducted using a 1260 HPLC system(America, Agilent). Chromatographic separations were performed by a Zorbax Eclipse plus C18column(250 mm × 4.6 mm,5.0 µm,Agilent).Mobile phase A was MeOH and B was water with 20 mmol/L ammonium acetate solution.Mobile phases were filtered through a 0.45 µm membrane filter before use.The gradient elute conditions was programmed as follows:0-6 min,10%-70% A;6-8 min,70%-90% A;8-10 min,90% A;10-11 min,90%-10% A;11-14 min,10% A.The flow rate was 1 mL/min and the sample injection volume was 10 µL.The detection wavelength for brilliant blue FCF and erythrosine B were 625 nm and 529 nm,respectively.All operations were performed in triplicate to ensure reliability of the data presented.
1.3 Preparations of standard solutions and real samples
The store solutions of pigments were diluted to required concentrations with water.A beverage and soft candy were purchased from local supermarket.Among them,the beverage was used for extraction directly.5.00 g of soft candy was cut into 1 cm segments and put into a tube,and 20 mL water was added into the tube.After full shaking for 5 min,the soaking solution was filtered through 0.22µm nylon filter and used for extraction.
1.4 In-situ effervescence assisted microextraction procedure
1.5 g of NaCl,0.4 g of NaHCO3and 0.37 g of NH4PF6were added into 10 mL sample solution sequencely.400 mg of[C4MIM][HSO4]was loaded in a 15 mL centrifuge tube.The afore-mentioned sample solution was added into centrifuge tube.As soon as the two kinds of liquids came into contact,they began to release bubbles(carbon dioxide)which filled the entire centrifuge tube from the bottom of the centrifuge tube. Meanwhile,the extraction process for target objects was going.After about one minutes,no more bubbles produced and the extraction completed.The hydrophobic ionic liquid which was produced by the in-situ reaction was deposited at the bottom of the centrifuge tube.In order to collect all the ionic liquid phase,the centrifuge tube was centrifuged under 10000 r/min for 5 min.The supernatant was discarded.Subsequently,200µL methanol was added to the tube to dissolve the ionic liquid phase.Subsequently,the solution was injected into the HPLC for analysis.The procedure of the in-situ effervescence assisted microextraction was shown in Fig.2.
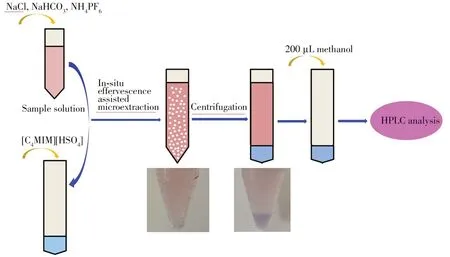
Fig.2 Schematic of the extraction procedure
2 Results and discussion
2.1 Optimization of extraction conditions
Different extraction conditions,such as amount of acidic ionic liquid,amount of NaHCO3,and amount of salt were evaluated.Spiked concentration in sample solution was 0.5µg/mL.The conditions which effected on peak area were investigated.
2.1.1 The amount of acidic ionic liquidThe acidic ionic liquid[C4MIM][HSO4]was used as acid source of effervescent reaction and also supplied cation for extraction phase. Thus, the amount of acidic ionic liquid is very important for extraction efficiency.The peak area was studied with acidic ionic liquid amounts ranging from 200 mg to 600 mg.As shown in Fig.3,from 200 mg to 400 mg,the peak area of target compound was increased.After 400 mg,the peak area was decreased.The acidic ionic liquid was used as both a dispersant and extraction solvent.Thus, the amount of ionic liquid was enough to disperse all over of sample solution and meanwhile,the volume of the extractant cannot too bigger to ensure the enrichment factor. With the increase of the amount of ionic liquid,the extraction efficiency increased.When the amount reached 400 mg,the extraction efficiency increased very little. However, the volume of extraction phase kept increasing so that the enrichment factor increased firstly and then decreased which showed that the peak area increased firstly and then decreased.Therefore,400 mg of acidic ionic liquid was chosen in following experiments.
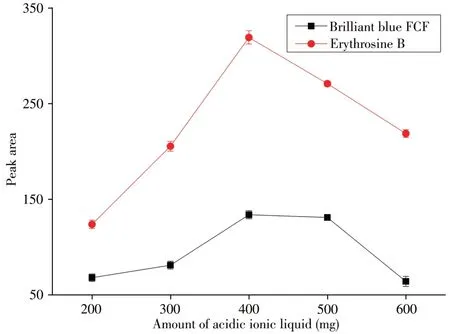
Fig.3 Effect of amount of acidic ionic liquid on peak area amount of NaHCO3:0.4 g;amount of salt:1.5 g
2.1.2 The amount of NaHCO3 NaHCO3was a source of carbon dioxide.To obtain a plenty of carbon dioxide, the amount of NaHCO3was necessary to make a detailed investigation.As shown in Fig.4,for erythrosine B,when the amount of NaHCO3was very low,the acidic ionic liquid provided an acidic environment so that the analytes were in the form of a molecule.The erythrosine B could be well extracted by hydrophobic ionic liquids. As the amount of NaHCO3increases,the alkalinity increases slightly.The erythrosine B gradually became to the form of ions so that the extraction efficiency also gradually decreased.However,with the increase of the amount of NaHCO3after 0.3 g, the peak area began to increase.The reason might be that the carbon dioxide bubbles were more abundant and the mass transfer between the target compound and the extractant was more favorable.Nevertheless,with the amount of NaHCO3further increase after 0.4 g,there was more erythrosine B in the ionic state.The overall effect was that the peak area began to decline again.This was because NaHCO3affected the pH of the solution and the degree of the dissociation of the target,thus affecting the peak area.In the case of brilliant blue FCF,there was nitrogen-containing group in its molecule.With the increase of the amount of NaHCO3,the nitrogen-containing group was uncharged and the increase of the bubbles was favorable for the extraction of brilliant blue FCF.When the amount was over 0.4 g,too much NaHCO3could decrease the peak area due to the high ionic strength of the sample solution.We observed that the biggest peak area for the majority of analytes was when the amount of NaHCO3was 0.4 g.Therefore,0.4 g of NaHCO3was used in subsequent experiments.
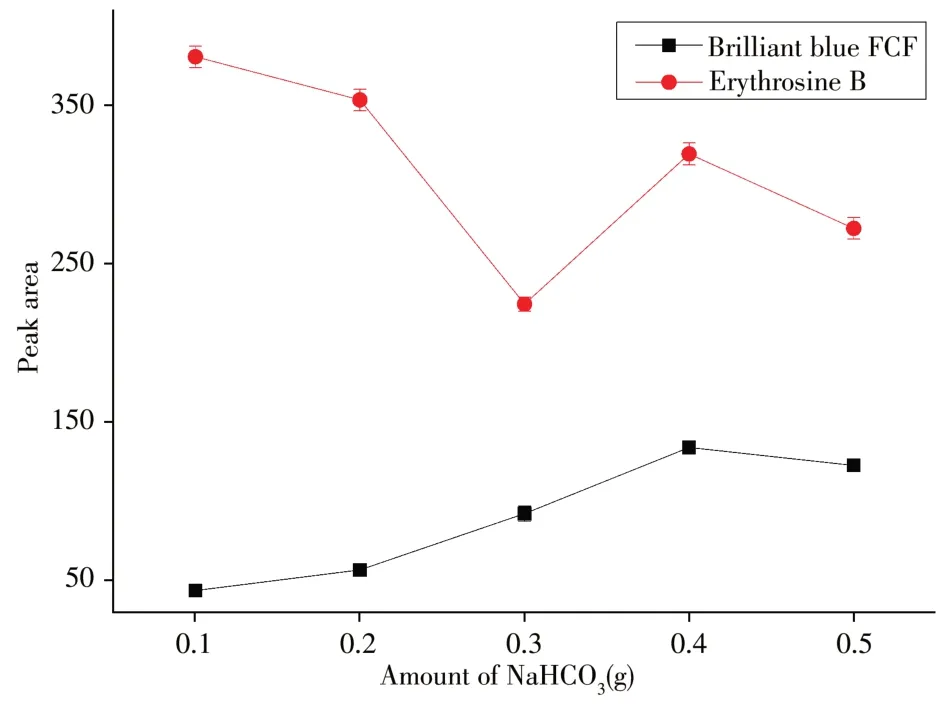
Fig.4 Effect of amount of NaHCO3 on peak area amount of acidic ionic liquid:400 mg;amount of salt:1.5 g
2.1.3 The amount of salt additionThe presence of sodium chloride in the pretreatment process could improve the extraction efficiency of samples because of the salting out effect[28].The amount of salt addition was investigated in present study.The peak area was increased with the increasing of the amount of NaCl from 0 to 2.0 g,other conditions were as follows,amount of acidic ionic liquid at 400 mg and amount of NaHCO3at 0.4 g.Nevertheless,when the amount of salt was higher than 1.5 g,the salt would be precipitated in the process of extraction which was not conducive to the next step of separation.Thus,1.5 g of salt addition was chosen for subsequent experiments.
2.2 Method validation
Under the optimal conditions,the proposed method was validated on the basis of linearity,sensitivity,accuracy and precision. The calibration curves were constructed by plotting the mean peak areavs.concentration levels of sample solutions. This method exhibited good linearity(0.005-5 µg/mL) with satisfactory linear correlation coefficient(r2)within 0.9933-0.9994.The LODs and LOQs(signal-to-noise ratio of 3 and 10,respectively)were in the range of 0.002-0.005 µg/mL and 0.007-0.017 µg/mL,respectively(as shown in Table 1).Furthermore,the intra-day and inter-day relative standard deviations(RSDs,n= 5)which used to measure precision of the method,were not more than 3.2% and 8.7%,respectively.To investigate the applicability of the present method,recoveries of target synthetic pigments were determined with two kinds of blank real samples spiked at two concentration levels(0.05,0.5 µg/mL).As shown in Table 1,satisfactory spiked recoveries(92.2%-107%)were obtained which showed that this method had less interference from sample matrix.All of these revealed the feasibility of the method.

Table 1 Validation results obtained by the proposed method and spiked recoveries
In addition,the analysis results of HPLC chromatograms of normal injection without extraction and after extraction showed in Fig. 5.Obvious extraction effect could be seen.Under the optimum conditions,the extraction efficiencies of brilliant blue FCF and erythrosine B were 56.0% and 90.5%,respectively.
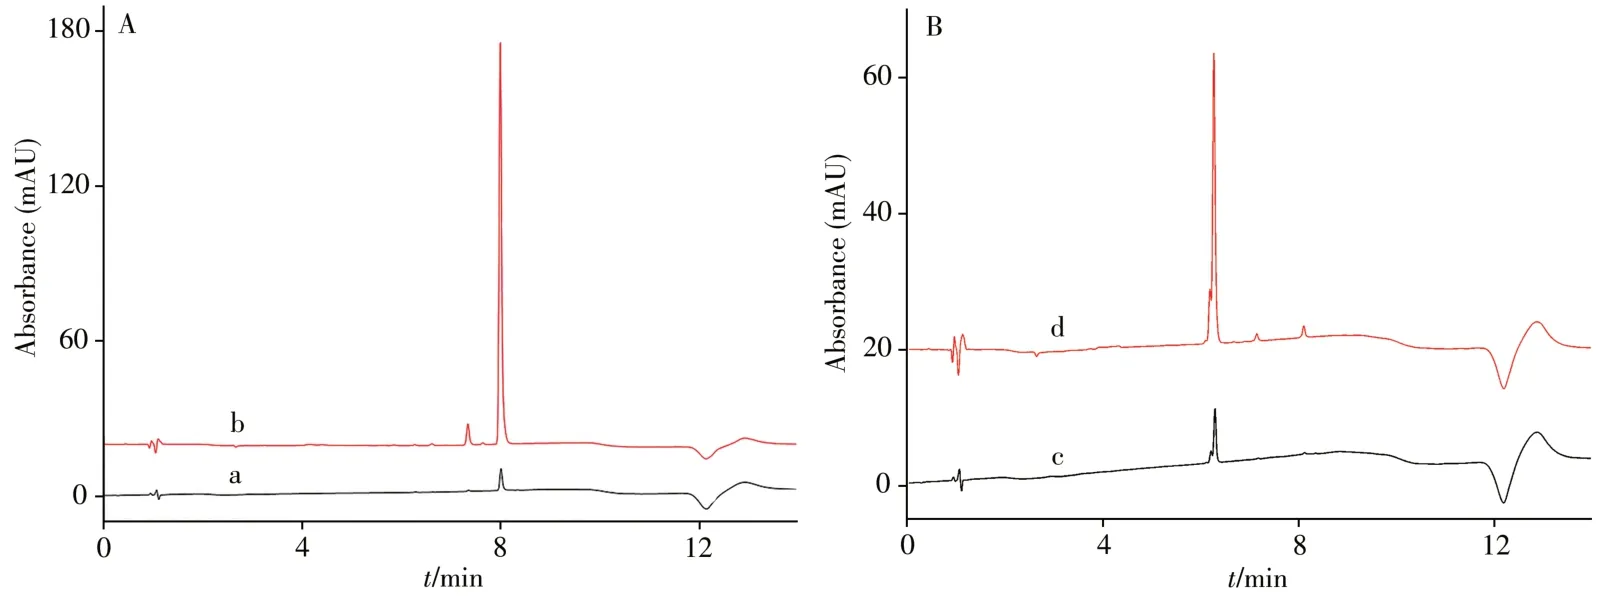
Fig.5 HPLC chromatograms of erythrosine B(A)and brilliant blue FCF(B)a,c:without extraction;b,d:after extraction
2.3 Analysis of real sample
To evaluate the established method,it was applied to determine the content of two synthetic pigments in two real samples(beverage and candy)which were purchased from local market.Real samples were extracted for analysis with established method.Brilliant blue FCF was detected in drink and candy with amount of 0.983 µg/mL and 464 µg/kg,respectively.The method could be successfully applied to the determination of brilliant blue FCF and erythrosine B in beverage and candy samples.
2.4 Comparison with previously reported methods
Other published methods were compared to the present method.The proposed method showed comparable or lower LODs to other methods(Table 2).In this study,there was using only a small amount of ionic liquid without a dispersive solvent,heat,ultra-sonication or additional chemical reagents.In addition,there was no need to prepare equipment in the whole pretreatment procedure,which was a favorable analytical feature compared to the previously reported methods.

Table 2 The comparison with other methods
3 Conclusions
In the present study,a rapid,efficient,eco-friendly and simple technique for the determination of synthetic pigments in drink and candy was proposed.The whole pretreatment procedure was easily performed,due to the dispersion being driven by chemical reaction in solution.Additonally,the separation and the collection of the extractant were very easy.For these reasons,dispersing equipment was not required to perform this method.Furthermore,acceptable analysis results,including linearity,sensitivity,precision and accuracy,were obtained.In conclusion,the pretreatment technique was robust and reliable for analyzing two synthetic pigments in beverage and candy samples.

