Influence of seven levels of chemical/biostimulator protection on amino acid profile and yield traits in wheat
Piotr Iwniuk*, Rfl Konecki Piotr Kczynski Alu Rysekov, Bozen Lozowick
a Instituteof PlantProtection-National Research Institute,Chelmonskiego 22Street,15-195Bialystok,Poland
b KazakhNationalAgrarian ResearchUniversity, Departmentof Plant Protection,Abai Avenue 8,Almaty050010, Kazakhstan
Keywords:Amino acids Biostimulators Plant protection products Wheat quality Yield
A B S T R A C T Biostimulators combined with pesticides can reduce the need for chemical crop protection to yield healthy wheat with high grain quality and nutritional value. The goal of this four-year field study was an assessment of the effects of seven levels of sulfonylurea herbicide,morpholine and triazole fungicides,and humic biostimulator protection on concentrations of 20 amino acids (AAs) and on yield parameters under diverse climatic conditions. Application of pesticides and biostimulators reduced amino acid concentrations.Sulfonylurea applied alone reduced AAs least.Chemical(herbicide+fungicide)protection or its combination with humic biostimulator were the most effective strategies for increasing yield,thousand-kernel weight,spike number,grain surface area,and wet gluten.Reduced dosages of fungicides showed effects on AA content and crop parameter values similar to those of the recommended dosages of fungicides and are in line with the European Commission’s‘‘From Farm to Fork”strategy.Humic biostimulators as agents supporting pesticide protection should be optimized for wheat growth stage to achieve the most desirable wheat parameters and implemented in agricultural practice.
1. Introduction
Wheat (Triticum aestivumL.), one of the most commonly cultivated cereals, is used in many products for human consumption or as animal feed. The quality parameters of wheat grain are the components that affect its nutritional value, caloric content, or digestibility: contents of starch, protein, and gluten and of amino acids [1]. Starch makes up about 70% of all grain carbohydrates.Proteins are components of tissues,hormones,and enzymes,while gluten is a mixture of the proteins prolamin and glutelin that as a result of cross-linking forms a spatial structure with water, giving the dough a ductile texture [2].
Amino acids (AAs) are components of grain. They are organic compounds constituting the building material of proteins [3,4].They function in controlling blood sugar levels, renewing the body’s energy resources, regenerating muscles, maintaining good skin condition, and strengthening bones, and in the immune, hormonal and nervous systems[5-7].Amino acids can be divided into nonessential(manmade and animal-made)and essential(supplied by food). Nonessential AAs include aspartic acid, glutamine,glutamic acid, asparagine, alanine, serine, glycine, tyrosine, cysteine, and proline, and the essential amino acids include tryptophan, lysine, arginine, histidine, phenylalanine, leucine, valine,and methionine [8-9].
Total protein content and amino acid composition may change depending on plant species,cultivar,habitat,fertilization,chemical protection, or stress factors [10]. Legume plants have the highest concentration of amino acids [11]. Pepo and Zoltan [12] reported differences in AA composition among cultivars ofTriticumspecies.Popko et al. [13] reported differences in AA composition in wheat after biostimulator applications.Variable levels of fertilization contribute to differences in protein and AA composition in winter wheat [14].
The proper nutritional composition of amino acids in feed varies depending on the animal species and influences the milk yield of cows and the growth and development of cattle, pigs, and poultry[15]. The biological value of cereal proteins in animal nutrition is low, owing to their low content of leucine and isoleucine. Cereal grains are also poor in methionine. For this reason, fodder rich in these amino acids should be added to nutrient mixtures for animals [16,17].
Herbicidal treatments reduce weed infestation and increase yield by limiting competition by weeds with crop plants for nutrients and water [18]. In agricultural practice, fungicides are used less frequently than herbicides; most often, they are used as an addition to herbicide protection.Their influence on quantitative or qualitative traits of wheat grain is unclear. Byamukama et al.[19] reported higher yield and test weight after prothioconazole and tebuconazole treatments,but Viecelli et al.[20]reported lower yields after propiconazole and azoxystrobin treatments.
Natural biostimulators mitigate negative effects of agroclimatic conditions and promote plant health [21]. Commonly used agents are based on humic or fulvic acids,which are ingredients of humic biostimulators and promote the development of lateral roots and counter effects of abiotic stress [22]. Few reports have described the influence of herbicidal protection combined with fungicides or biostimulators on grain traits such as protein, starch, gluten,and amino acid concentration [23]. Given that the European Commission’s‘‘From Farm to Fork”strategy assumes a reduction of fertilization and plant protection product use in agriculture, limiting pesticide application and identifying new products that improve plant growth and health properties are challenges in modern agricultural practice [24].
The aim of this study was to assess the influence of chemical and biostimulator protection on AA composition,nutrient content,and wheat yield. We hypothesized that 1) chemical and biostimulator treatments influence the concentration of different groups of amino acids and 2)grain parameters are influenced by the level of herbicidal, fungicidal and biostimulator protection. We undertook to use multifactorial statistical analysis to identify the most effective wheat protection strategy.
2. Materials and methods
2.1. Field experiment
The spring wheat cultivar Mandaryna was planted in plots of 4 × 5 m in Dobrzyniewo Duze, Poland (53°11′43.6′′N, 23°01′02.7′′E) in the 2017-2020 growing seasons. Certified seeds were sown on April 6, 2017, April 3, 2018, April 4, 2019, and April 7, 2020.Chemical protection consisted of herbicide (H: Apyros 75WG,active ingredient:sulfosulfuron),fungicides in recommended dose(F1: Artea 330EC, active ingredient: cyproconazole + propicona zole; F2: Falcon 460EC, active ingredient: spiroxamine + tebucona zole+triadimenol),fungicides in half recommended dose(½F1;½F2), and humic biostimulators improving plant growth(S1: liquid,S2: paste) (Table 1). The experiment was conducted in the following combinations with four repetitions each:A,control;B,sulfosulfuron; C, sulfosulfuron; ½ cyproconazole + ½ propiconazole, ½spiroxamine + ½ tebuconazole + ½ triadimenol; D, sulfosulfuron,cyproconazole + propiconazole, spiroxamine + tebuconazole + tria dimenol;E,sulfosulfuron,humic biostimulator S1;F,sulfosulfuron,cyproconazole + propiconazole, spiroxamine + tebuconazole + tria dimenol, humic biostimulator S1; G, humic biostimulator S1; and H- sulfosulfuron, cyproconazole + propiconazole, spiroxamine +tebuconazole + triadimenol, humic biostimulator S2.
Nitrogen(N)/phosphorus(P)/potassium(K)fertilization in each year was applied as follows:54 kg N ha-1,67 kg K ha-1,and 26 kg P ha-1. The physicochemical soil parameters indicated pH 7.4 and microelement content: 1.89 mg kg-1K2O, 1.93 mg kg-1P2O5and 0.76 mg kg-1Mg. Grain was harvested at the 89 stage of Biologische Bundesanstalt, Bundessortenamt und CHemische Industrie(BBCH) scale [25] on July 27, 2017, July 30, 2018, July 25, 2019,and July 23, 2020 and separated from husks. Mean temperature in the vegetative season was 13.25 °C and rainfall 295 mm in 2017, 16.41 °C and 204 mm in 2018, 14.9 °C and 183 mm in 2019, and 13.7 °C and 160 mm in 2020 (Fig. 1). Measurement of AAs was performed in three years of the study (2018-2020), and grain parameter assessments were performed in all four years(2017-2020).
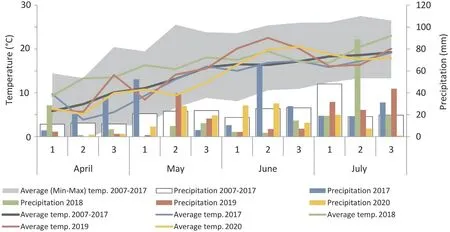
Fig. 1. Detailed climatic conditions (temperature, °C and precipitation, mm) during the four-year experiment (2017-2020). The numbers 1-3 represent each consecutive 10 days of the month.
2.2. Amino acid determination
Standards of the AAs alanine,arginine,asparagine,aspartic acid,cysteine, glutamic acid, glutamine, glycine, histidine, isoleucine,leucine, lysine, methionine, phenylalanine, proline, serine, threonine, tryptophan, tyrosine, and valine were obtained from Sigma-Aldrich(St.Louis,MO,USA).Individual stock solutions were prepared in 1%formic acid in water at concentrations of 1 mg mL-1.Standard mixtures were prepared at concentrations of 0.01-10 μg mL-1and stored at 4 °C.
Wheat grain was milled in the laboratory mill and flour samples of 1 g were mixed with 10 mL of water:methanol solution(8:2,v/v)with 0.1% formic acid. Samples were vortexed for 5 min and centrifuged at 10,000 r min-1for 10 min.Extracts(1 mL)were filtered through a 0.22 μm hydrophilic PTFE filter, transferred into labeled autosampler vials,and analyzed by liquid chromatography coupled with tandem mass spectrometry (LC-MS/MS) followed by validation as described in reference [26].
An Eksigent Ultra LC-100 (Eksigent Technologies, Dublin, CA,USA) liquid chromatography system was used (flow rate 0.5 mL min-1) with Kinetex HILIC 1.7 μm, 2.1 × 50 mm column(Phenomenex, Torrance, CA, USA) at 40 °C during analysis. The purified extract(2 μL)was injected into the LC-MS/MS.The mobile phases consisted of water+0.2%formic acid+20 mmol L-1ammonium formate(phase A)and acetonitrile(phase B).The experiment started at 5%A/95%B,held for 1 min,ramped linearly to 10%A/90%B in 2 min, then to 95% A/5% B in 3.5 min, and held for 1.5 min.After ramping, the mobile phase composition was restored to the starting condition in 1 min and held for 3 min for reequilibration.An MS/MS 6500 QTRAP(AB Sciex Instruments,Foster City, CA, USA), equipped with an electrospray ionization source,was used for mass spectrometric analysis. The capillary voltage was maintained at 4000 V for positive-ion mode.The temperature of the turbo heaters was set at 400 °C. As the nebulizer gas,auxiliary gas, and curtain gas, nitrogen was used at pressures ofrespectively 50, 60, and 40 psi. All AAs were detected in multiple reaction monitoring mode [27]. The details of LC-MS/MS parameters in AA determination are shown in Tables S1 and S2.

Table 1Plant protection products and biostimulators applied in this study.
2.3. Measurement of yield traits
Spike number (SN) was recorded as the number of spikes in 1 m2. Wheat grain yield (t ha-1), thousand-kernel weight (TKW,g)and kernel number per spike(KNS)were determined by weighing the grain harvested from 1 m2and counting with a seed counter (Drello, Nuremberg, Germany). Yield traits were measured by near-infrared spectrometer Infratec 1241 (Foss, Hilleroed, Denmark). Evaluated features included grain density (g L-1), protein(%), starch (%), gluten (%), and Zeleny sedimentation index (ZSI,mL). Grain surface area (mm2per kernel) was measured with a Marvin seed analyzer (Marvitech,Wittenburg, Germany). All samples were analyzed in quadruplicate.
2.4. Statistical analysis
Statistical significance was performed according to Fisher’s exact test (P<0.05). Mutual correlations between each pair of following parameters: climatic conditions, yield, grain density, TKW,KNS,SN,grain surface area,protein,starch,wet gluten,Zeleny sedimentation index and AA were calculated as Pearson’s correlation coefficient (r) atP<0.05. Principal component analysis (PCA) and agglomerative hierarchical clustering of the influence of chemical and biostimulator treatments on these parameters were performed. All analyses were performed with Statistica 12 software(StatSoft, Tulsa, OK, USA).
3. Results
3.1. Effect of biostimulator and chemical protection on amino acid concentration
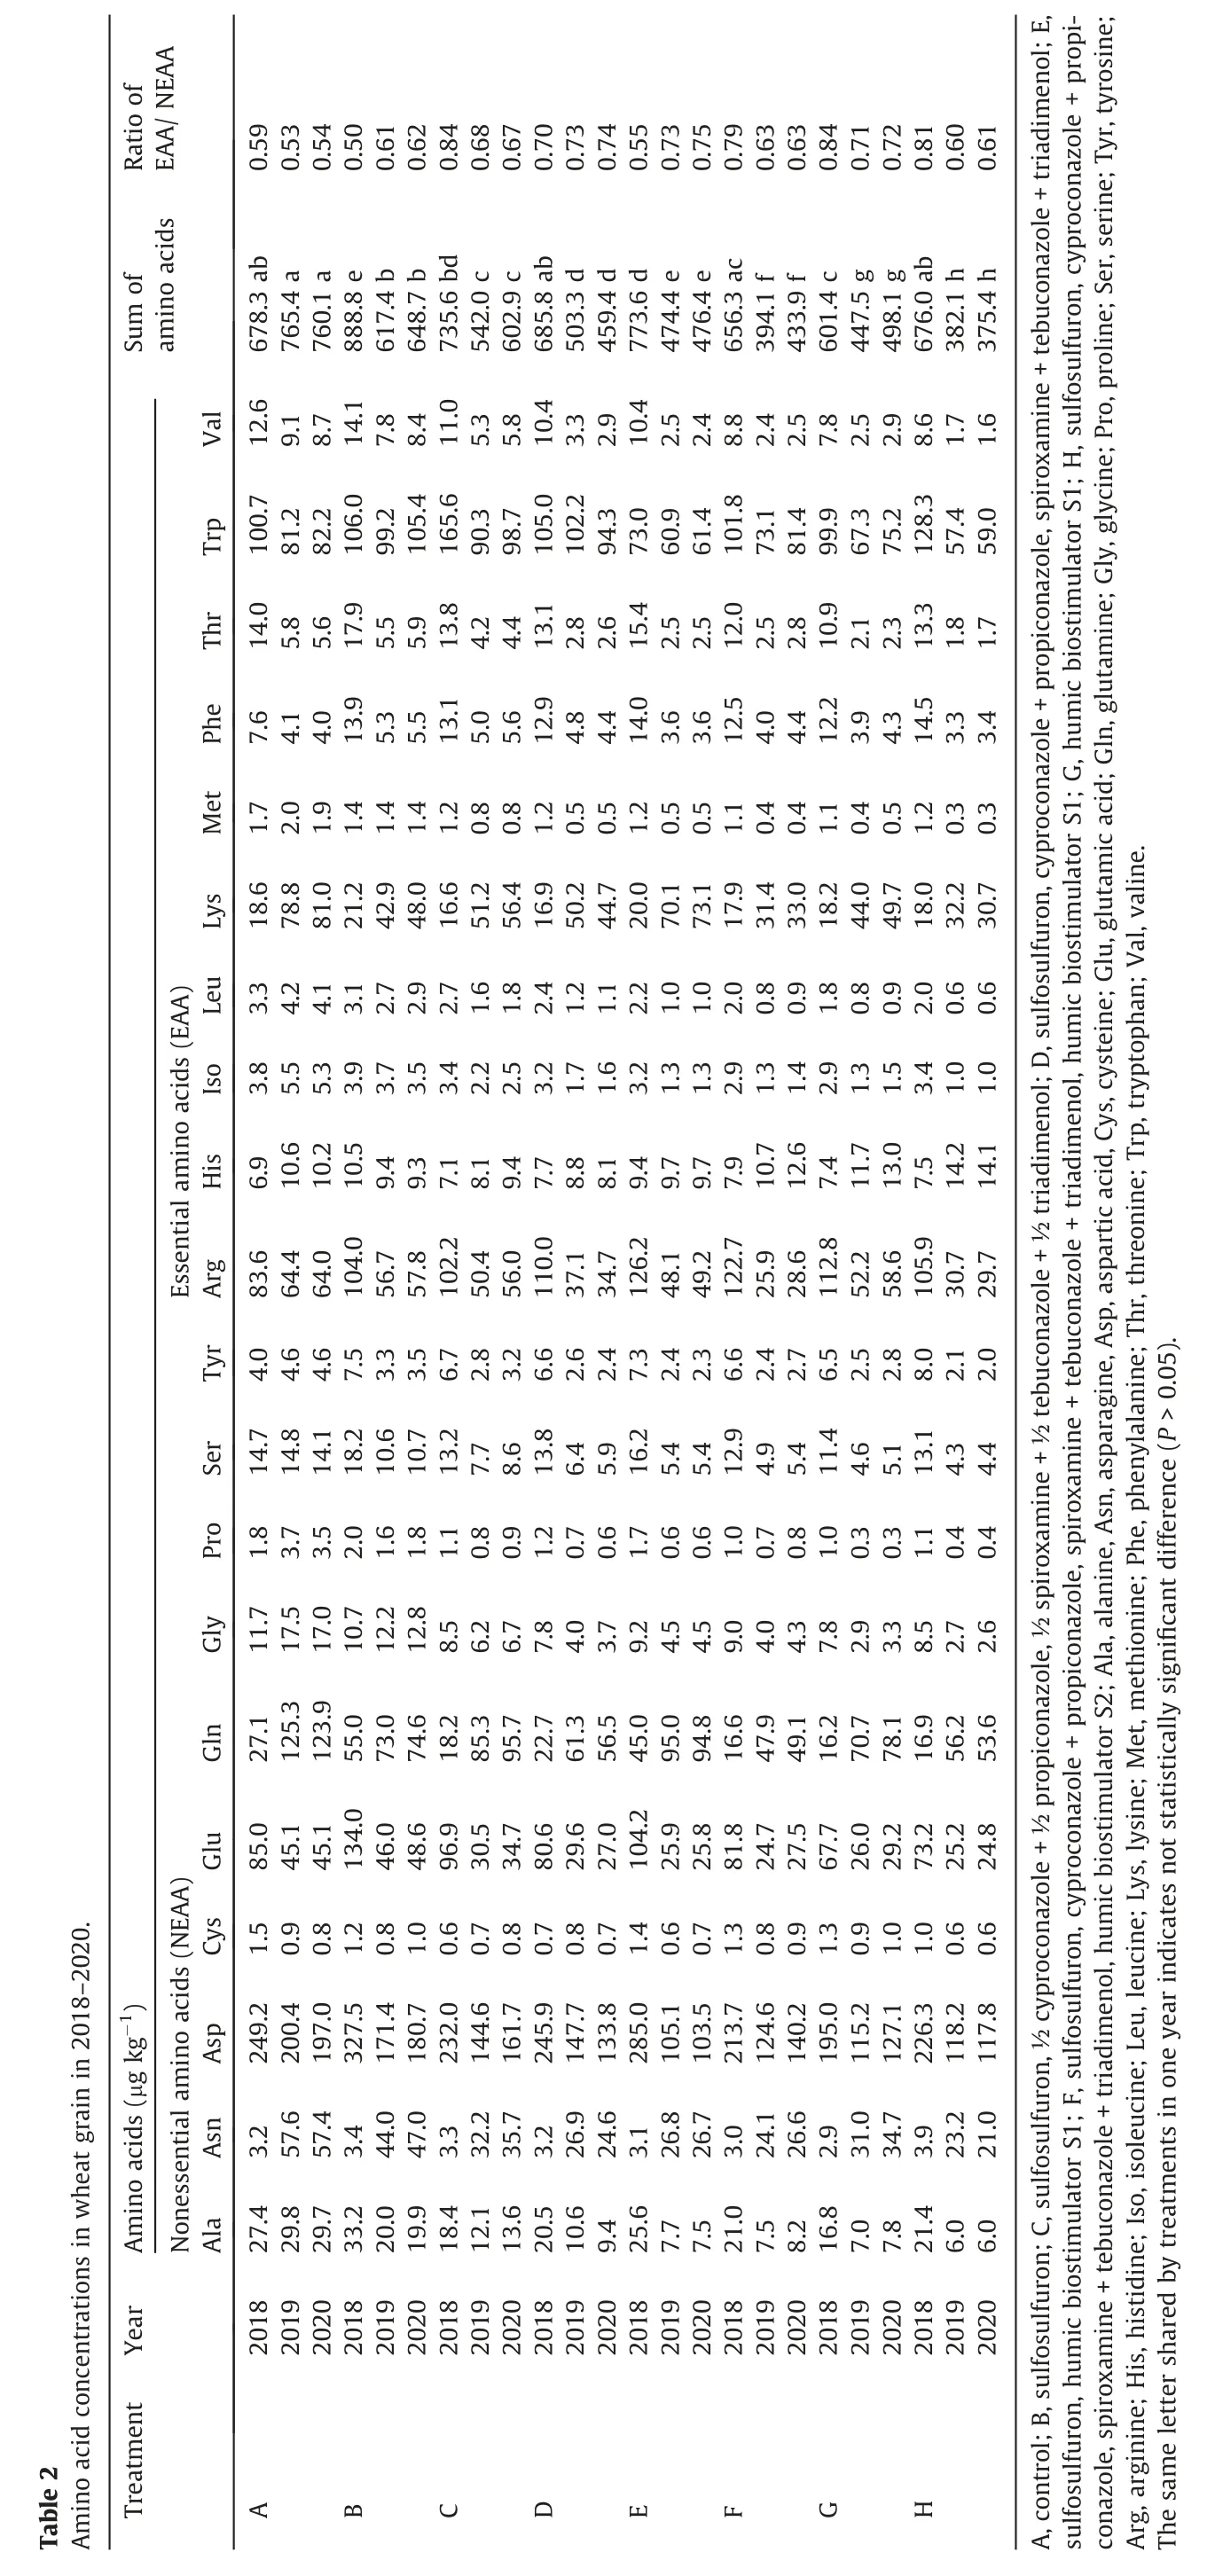
Grain collected from control plants had the highest concentration of total amino acids in 2019-2020, but not in 2018 (Tables 2, S3). A chromatogram of representative amino acid standards and wheat samples is shown in Fig. S1. Humic biostimulators and chemical protection contributed to the reduction in amino acid concentration in 2019-2020. Among the experimental plots, the highest concentration of amino acids was determined for sulfosulfuron treatment in 2018-2020. The greatest decrease of total amino acid level was determined for exclusive liquid biostimulator S1 (treatment G) in 2018 or sulfosulfuron combined with morpholine, triazoles, and paste biostimulator S2 (treatment H)in 2019-2020 (11.3%, 50%, and 50.6%, respectively). Similarly, the concentrations of nonessential (NEAA), essential (EAA), aliphatic,aromatic, and sulfur-containing amino acids was lowest in treatment H in 2019-2020 (Fig. 2). Sulfur-containing amino acids(methionine and cysteine) achieved the highest values for control grain (3.2, 2.9, and 2.7 μg kg-1in 2018-2020, respectively). Our study indicated a EAA/NEAA ratio between 0.5 for sulfonylurea application(treatment B)and 0.84 for exclusive humic biostimulator (treatment G) or sulfonylurea combined with a half dosage of morpholine and triazole (treatment C) (Table 2).
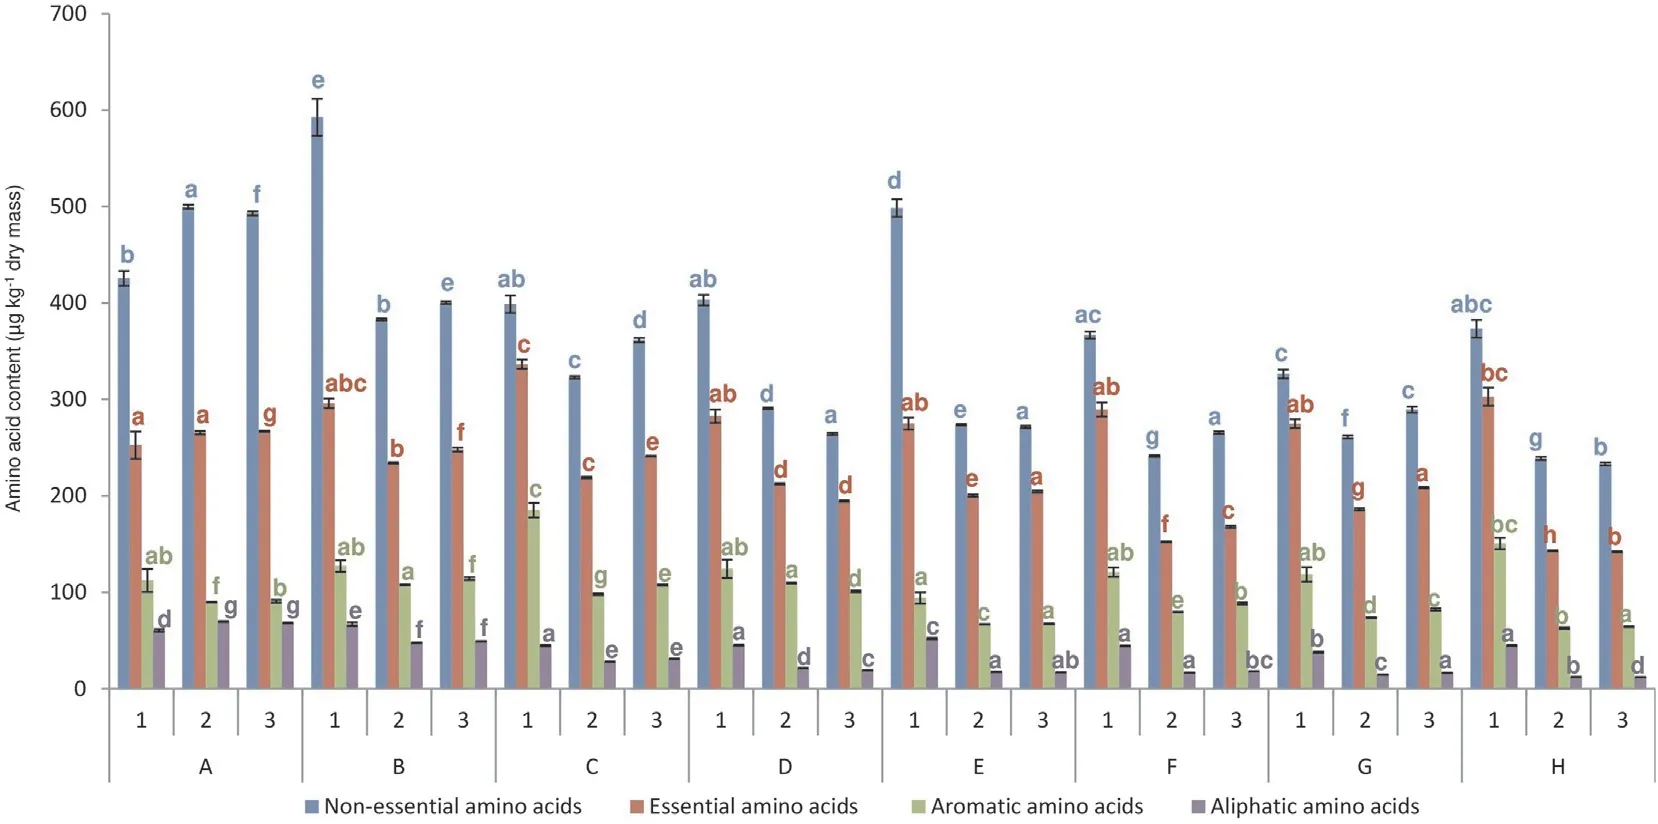
Fig. 2. Amino acid content in wheat grain (μg kg-1 dry mass). A, control; B, sulfosulfuron; C, sulfosulfuron, ½ cyproconazole + ½ propiconazole, ½ spiroxamine + ½tebuconazole + ½ triadimenol; D, sulfosulfuron, cyproconazole + propiconazole, spiroxamine + tebuconazole + triadimenol; E, sulfosulfuron, humic biostimulator S1; F,sulfosulfuron, cyproconazole + propiconazole, spiroxamine + tebuconazole + triadimenol, humic biostimulator S1; G, humic biostimulator S1; H, sulfosulfuron,cyproconazole + propiconazole, spiroxamine + tebuconazole + triadimenol, humic biostimulator S2. 1, 2018; 2, 2019; 3, 2020. The same letter shared by treatments in one year indicates not statistically significant difference (P >0.05).
Chemical treatments showed strong influence on the occurrence of specific amino acids(Table S3).In 2018-2020,the highest concentrations were observed for aspartic acid (327.5, 200.4, and 197.0 in 2018, 2019, and 2020, respectively) (Table 2) The most significant reduction of lysine in 2019 and 2020 was observed for sulfonylurea combined with morpholine,triazoles,and biostimulator S1 (11.4%, compared to the control in 2019) and for sulfonylurea (11%, compared to the control in 2020). In 2018 the accumulation of amino acids showed the highest arginine increase(12.8%, compared to the control) for sulfosulfuron combined with biostimulator S1.
3.2. Effects of chemical protection and biostimulators on yield traits
The highest yield in 2017-2020 was recorded for chemical protection enriched by humic biostimulator S1 (up to 6.32 t ha-1,treatment F),sulfonylurea combined with morpholine and triazole treatments (up to 6.59 t ha-1, treatment D), and sulfonylurea enriched by humic biostimulator S1 (up to 6.8 t ha-1, treatment E) (Table 3).
?
The type of chemical protection strongly influenced TKW, SN,and grain surface area (Table 3). The highest TKW and SN were realized in combinations with biostimulator (S1 and S2)application (up to 35.4 g and 546 spikes, respectively), compared to treatments without their use and irrespective of the type of crop protection used. Besides plant protection products,supplementation by humic compounds increased TKW, SN, and grain surface area. Higher TKW was also observed under complex sulfonylurea, morpholine, and triazole protection (treatment D,29.5-35.3 g) compared to single herbicidal protection (27.7-33.8 g), which is commonly used in agricultural practice. Surprisingly, in contrast to TKW, SN, and grain surface area, the highest values of kernel number per spike were achieved in treatment without application of humic biostimulator (up to 25.3 kernels in treatment E). Protein concentration and Zeleny sedimentation index (ZSI) were higher under chemical treatments than in the control. The highest protein content reached 11.1% in 2018(Table 3), but the mean concentration for most combinations was 10%-10.8%. ZSI ranged from 23 to 32.5. In the four-year period,the highest (P<0.05) protein content and ZSI were observed for sulfonylurea combined with a half dose of morpholine and triazoles (treatment C), and sulfonylurea (treatment B). Wet gluten content achieved the greatest values in 2018-2019 for complex herbicidal and fungicidal protection enriched by humic biostimulators (treatment H, 21.2% and treatments D and F, 20.9%). Starch level was comparable between treatments and control in the four years of the study indicating no effect of diversified chemical protection.

Table 3Parameters of wheat grain in the four years of the study.
3.3. Mutual correlations between examined parameters
Fig.3 shows a PCA indicating the influence of the type of chemical/biostimulator treatment, temperature and precipitation on amino acid concentration, yield, and quality parameters (grain density,TKW,KNS,SN,protein,starch,wet gluten,and Zeleny sedimentation index). The PCA explained 70.6% of total variation. The total variation in amino acids,protein and climatic conditions as a function of the wheat protection strategy achieved 83.83%(Fig. 3B).
Sulfonylurea combined with morpholine, triazoles, and humic biostimulators (S1, S2) had the highest influence on amino acid concentration and parameters of wheat grain in 2017-2020(Fig. 3C), while the control and herbicidal protection without fungicides were the most effective in the induction of amino acid biosynthesis (Fig. 3D). Half doses of fungicides showed effects on the traits comparable to those of full doses. Treatments based on humic biostimulators combined with pesticides (treatments F and H) showed similar efficacy on levels of individual amino acids(Fig. 3D).
There was a correlation of amino acid content with climatic conditions (r= 0.75 for temperature andr= - 0.79 for precipitation) (Figs. 4, S2). Additionally, there were negative correlations between all amino acids and precipitation in the range of - 0.33 to - 0.93, indicating that water content limited their concentration. Individual amino acids were generally positively correlated with each other(up tor=0.99)(Figs.4,S3).Moreover,higher yield was influenced by temperature and contributed to the TKW increase.The highest positive correlations were between grain surface area and TKW(r=0.98).Higher protein concentration resulted in increase of wet gluten content,Zeleny sedimentation index,and decrease of starch level. Reduced concentration of starch influenced on increase of grain density. Lower KNS contributed to an increase of grain density (r= -0.61) (Figs. 4, S2).
Based on the three years of amino acid analysis, aspartic acid was found in the highest concentration in the control and under exclusive sulfonylurea protection (treatment B), similarly to alanine, asparagine, glutamic acid, lysine, glutamine, tryptophan,and arginine (Fig. 5).
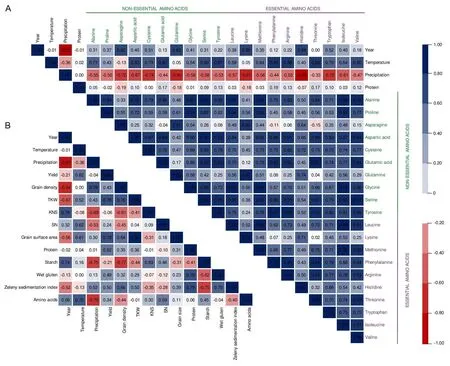
Fig. 4. Pearson’s correlation coefficient based on PCA. (A) Pairwise correlations between individual amino acids, protein, and climatic conditions. (B) Pairwise correlations between amino acids, parameters of wheat grain, and climatic conditions.
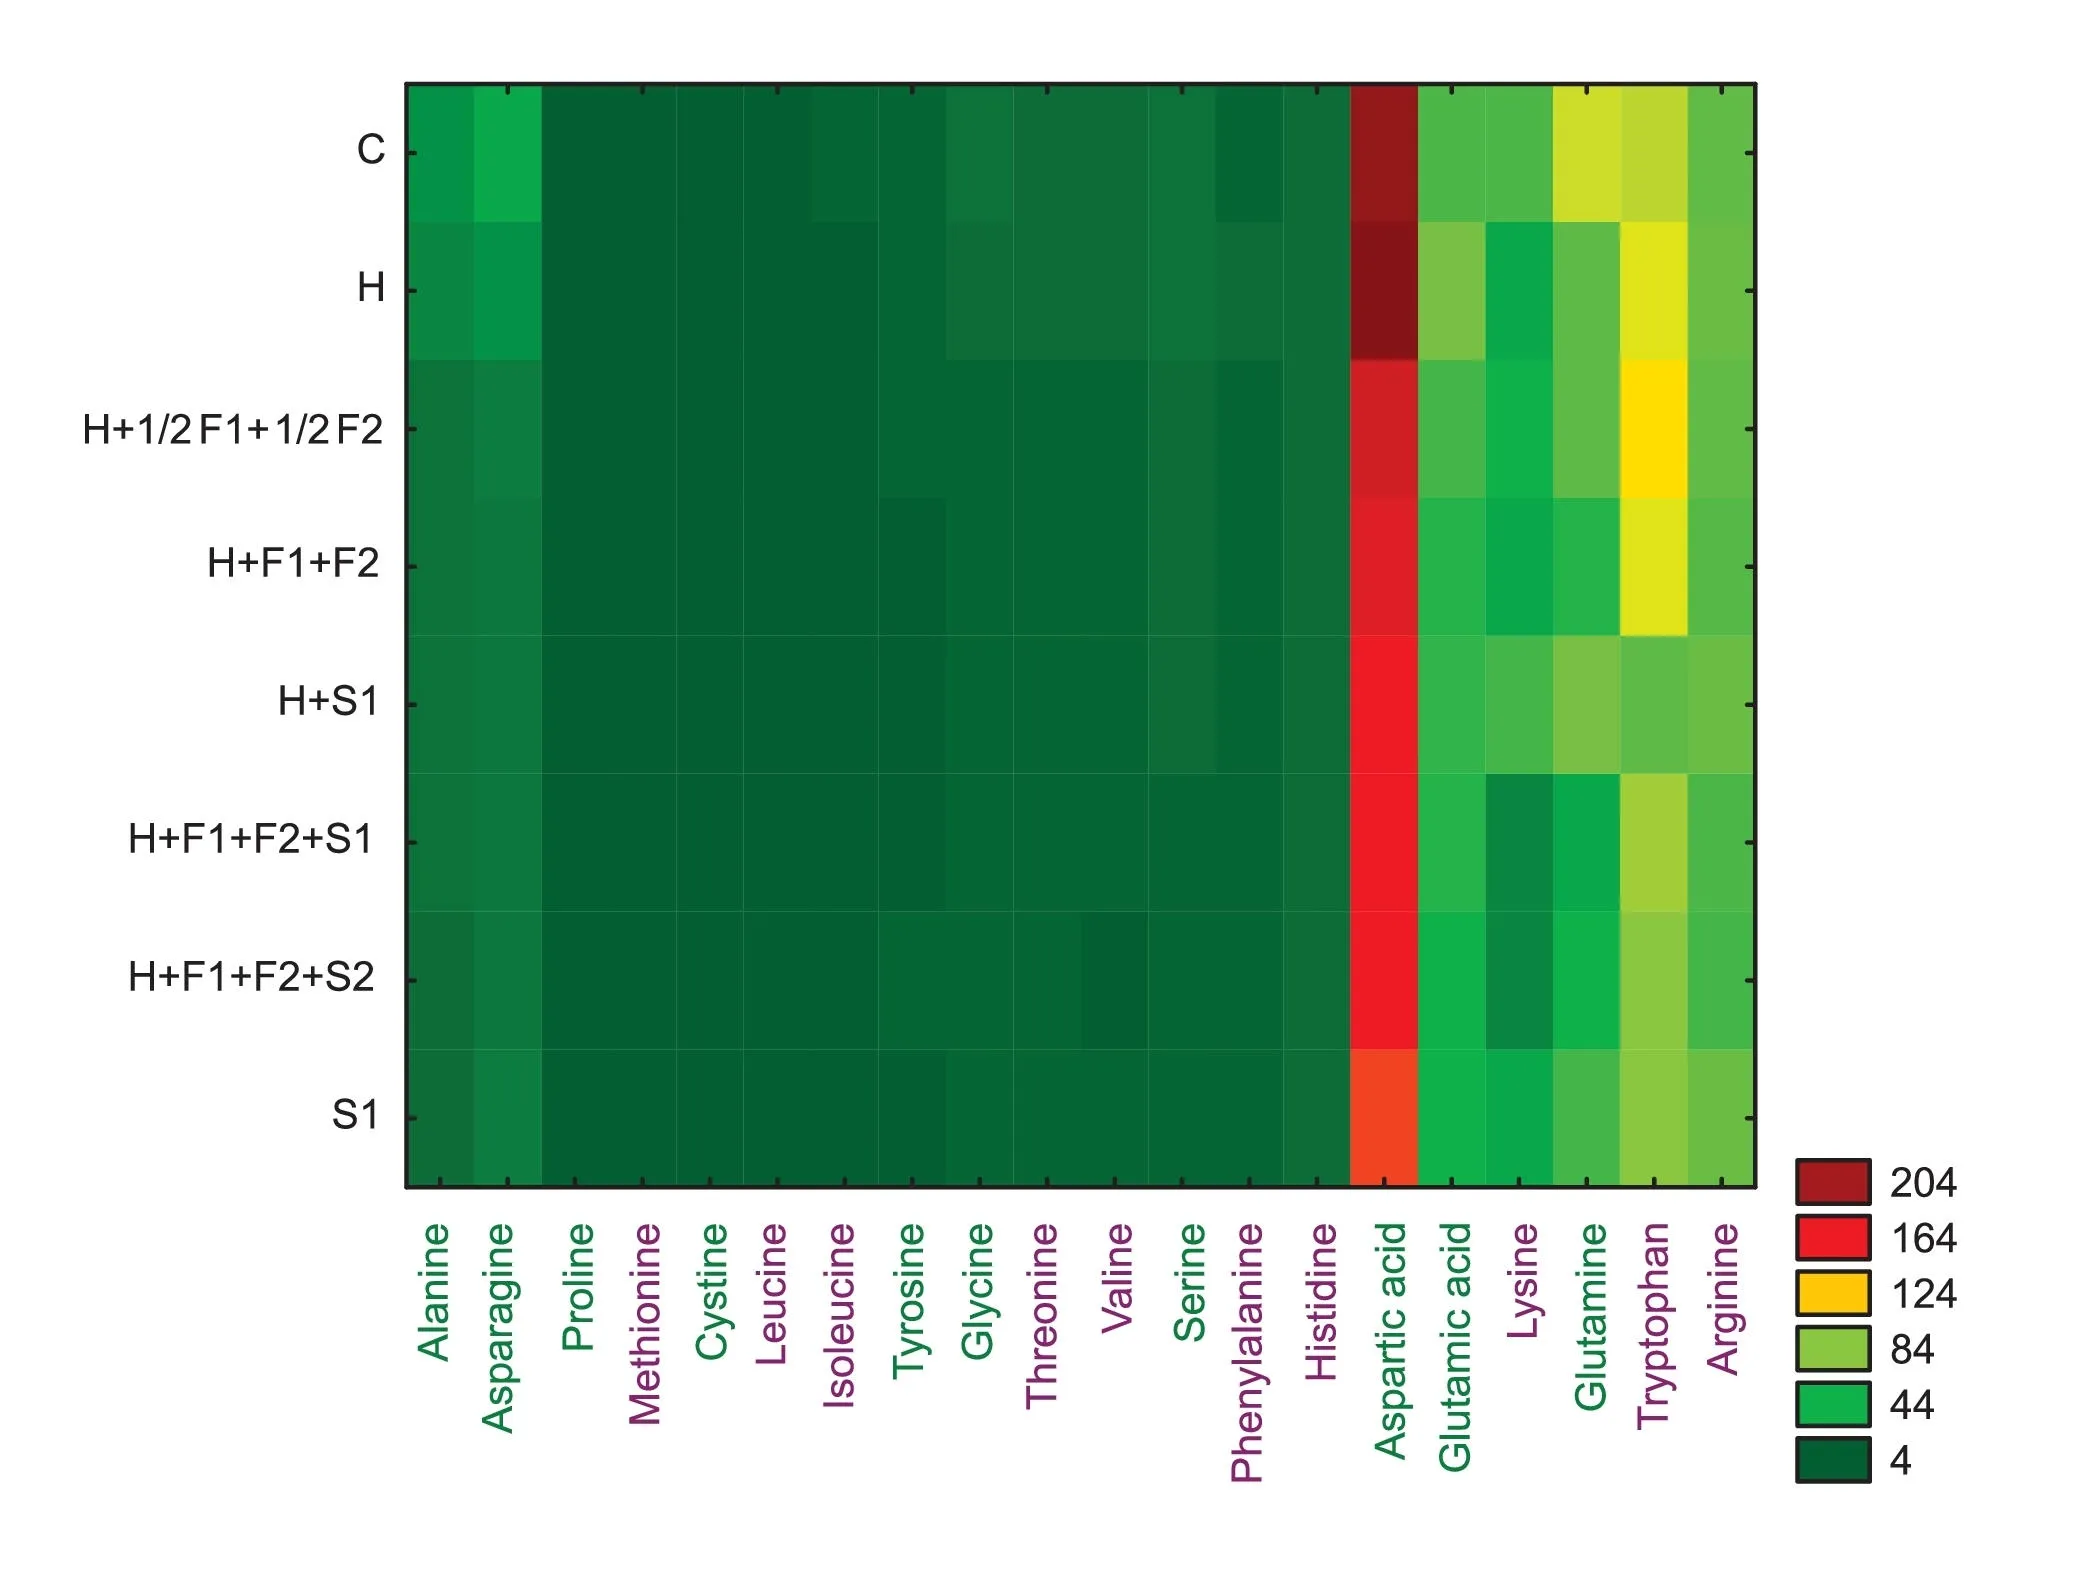
Fig. 5. Heat map showing differentiation of amino acids in wheat depending on chemical or biostimulator treatment(green names indicate nonessential and violet names essential amino acids).
4. Discussion
In contrast to the findings of Solomienko and Nagorniuk [28],our study showed a reduction in amino acids under biostimulator and chemical protection in 2019-2020 but an accumulation in 2018, indicating an influence of climatic conditions on amino acid biosynthesis even under the same protection strategies. Healy-Fried et al. [29] reported an inhibition of aromatic amino acid(AAA) biosynthesis by glyphosate, in contrast to this study, which showed the stimulation of AAA formation by sulfonylurea herbicide,and morpholine and triazole fungicides.It indicates the diversified influence of pesticide chemical group on changes of amino acids profile. Parthasarathy et al. [30] pointed out that the secondary metabolites of AAA are engaged in the biosynthesis of plant pigments,defense compounds(cutin,suberin,lignins,and lignans),and vitamins and hormones(auxins),which increase during stress conditions and can be explained by the lowest AAA concentration used for their synthesis under treatment with compounds including sulfonylurea, morpholine, triazole, and humic biostimulators.This group of amino acids is engaged in the synthesis of intracellular antioxidants(glutathione and N-acetyl cysteine)[31].The lowest level of sulfur-containing amino acids under biostimulator and pesticide treatments is probably associated with their capture for the formation of this group of antioxidants and of metabolic intermediates(coenzyme A)[32].Plant protection products or biostimulators can act like stress factors contributing to the decay of complex proteins to free amino acids, which are then used for defense protein biosynthesis or antioxidant system activation as signal molecules [33,34].
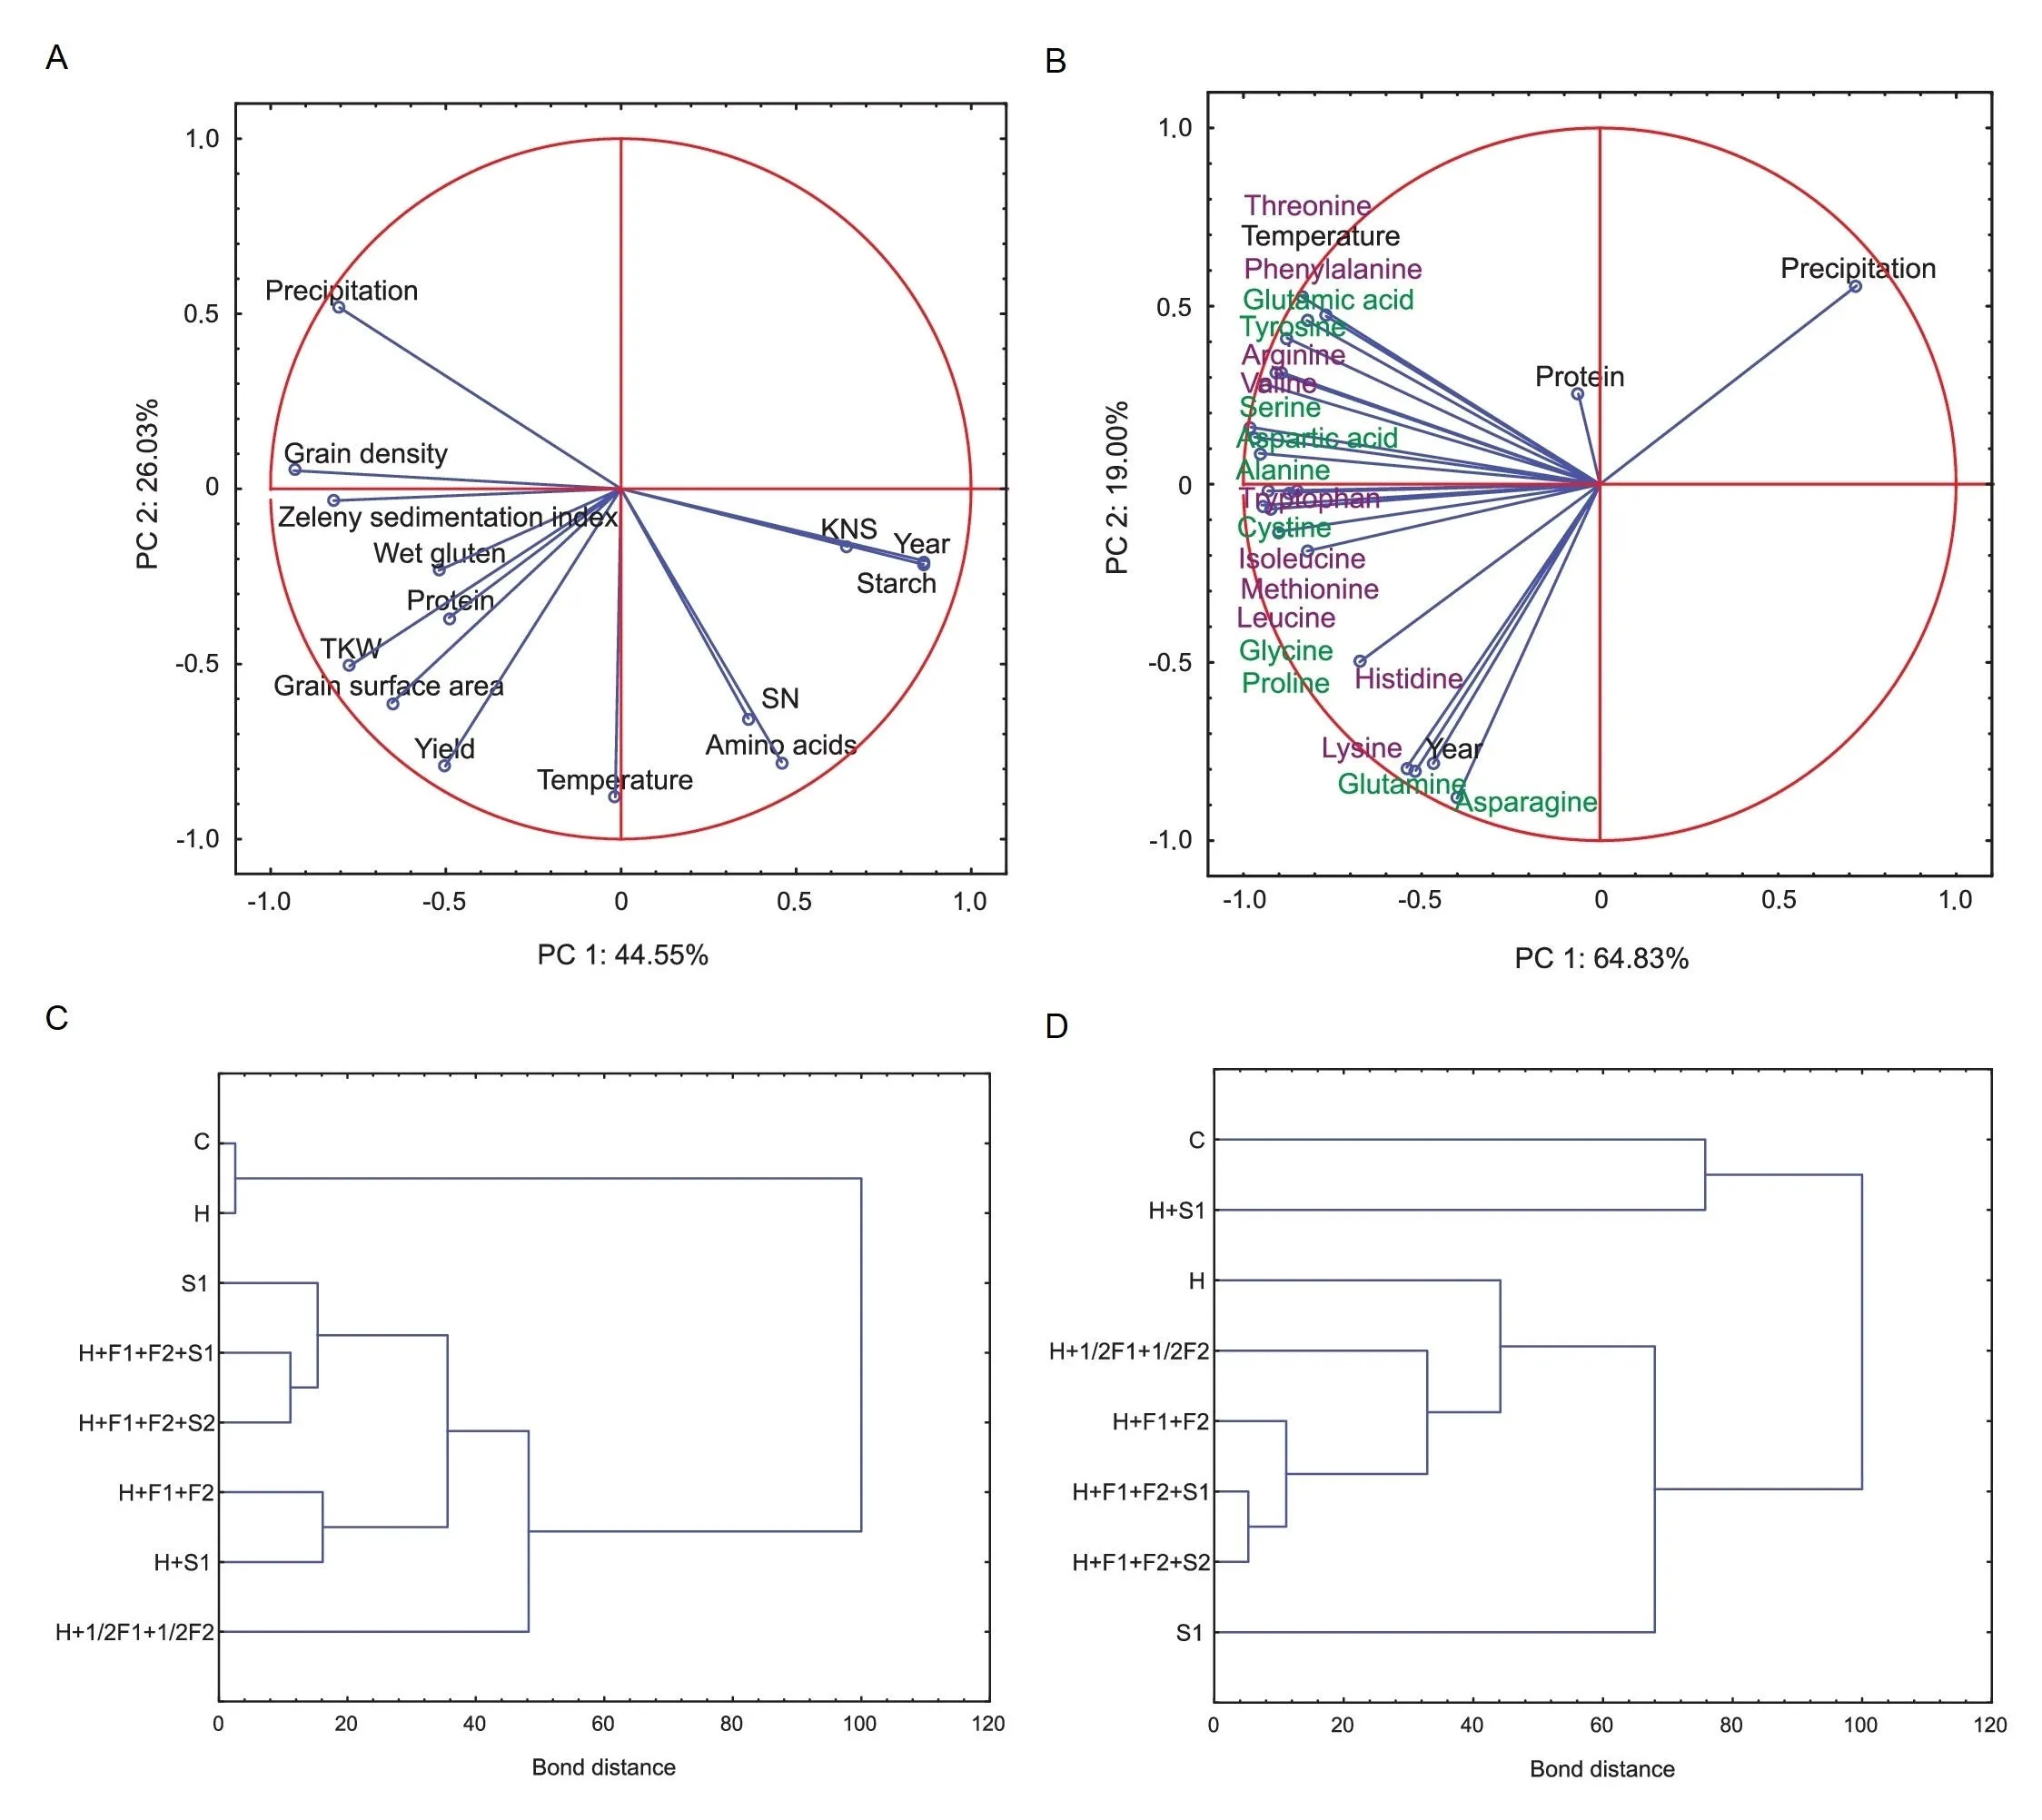
Fig.3. Diagrams of Principal component analysis(PCA)and agglomerative hierarchical clustering.(A)PCA of chemical and biostimulator treatment influence on wheat grain parameters. (B) PCA of chemical and biostimulator treatment influence on the concentrations of specific amino acids. Green names indicate nonessential amino acids and violet names essential amino acids.(C)Cluster diagram of the efficacy of chemical and biostimulator protection on the sum of amino acids and parameters of wheat grain.(D)Cluster diagram showing the influence of chemical and biostimulator treatment on the levels of individual amino acids.
The ratio of EAA to NEAA is crucial for correct metabolic balance and cancer cell apoptosis induction in humans and animals [35].The EAA/NEAA ratio increase under the biostimulator and pesticide treatments is a beneficial effect for human and animal diets,which are frequently poor in EAAs. Chemical/biostimulator protection affected the concentration of specific amino acids. Aspartic acid was found to be in the highest concentration in our study; however, the main amino acids synthesized by plants are glutamate,glutamine, and aspartate, which are then used for formation of other amino acids. Glutamate stands out for being the first amino acid into which the nitrogen absorbed by plants is incorporated,and a range of amino acids can be obtained through the activity of aminotransferases[36].A decrease of up to 82.2%of amino acids in response to biostimulator and pesticides may be due to the inhibition of acetohydroxy acid synthase by sulfosulfuron, a key enzyme in the biosynthetic pathways of alanine, leucine, isoleucine, proline, valine, and glycine [37]. Morpholine and triazole fungicides inhibit ergosterol biosynthesis in fungi. Lower concentrations of amino acids in response to application of these fungicides is likely associated with abiotic stress induction and their use in defense protein synthesis [33].
In contrast to the finding of Gaba et al.[38],a statistically significant yield increase after sulfonylurea combined with morpholine and triazole treatments was observed. Drobek et al. [39] reported a yield increase after humic biostimulator application. It seems that the beneficial effect of different types of biostimulators is dependent on plant species, and their health status and on soil and climatic conditions.
Karkanis et al.[40]also reported an increase of TKW and wet gluten after florosulam and 2,4-D herbicides combined with trifloxystrobin and prothioconazole fungicides compared to exclusive herbicide application. There was a higher spike number under chemical wheat protection,but in contrast to the findings of the present study,kernel number per spike did not differ from the control[41,42].The effect of biostimulators on spike number and grain surface area has been poorly investigated.Our findings showed a positive influence of humic biostimulators on these yield parameters.
Starch, wet gluten, and Zeleny sedimentation index are generally independent of pesticide application[43].Their highest values were observed under complex chemical/biostimulator conditions.Kotwica et al. [44] reported that biostimulators based on nitro sodium phenolate contributed to increased wheat grain quality.Wolejko et al.[45]also observed higher grain quality under herbicidal protection combined with fungicides. However, biostimulators based on humic and fulvic acids also contribute to the improvement of wheat nutritional values.
5. Conclusions
Efficacy of wheat chemical/biostimulator protection was influenced by weather conditions and despite the same treatments led to quantitative differences in traits among years.Sulfosulfuron applied exclusively (treatment B) was the strategy that lowered amino acid concentrations the least. Lower concentrations of free amino acids in pesticide- and biostimulator-treated wheat probably resulted from their use in defense protein synthesis induced by plant protection products. Chemical protection (treatment D)or its combination with biostimulator S1 (treatment E, F) were the most effective wheat protection strategies for improving yield parameters. They can accordingly be implemented in agricultural practice. Halving dosages of fungicides (treatment C) resulted in values of wheat parameters similar to those under recommended dosages but led to higher amino acid concentrations. Thus, reducing fungicide dosages meets the requirements of the European Commission’s ‘‘From Farm to Fork” strategy.
CRediT authorship contribution statement
Piotr Iwaniuk:Conceptualization, Methodology, Investigation,Writing-original draft.Rafal Konecki:Investigation,Formal analysis,Visualization.Piotr Kaczynski:Methodology,Formal analysis,Validation.Alua Rysbekova:Resources, Data curation.Bozena Lozowicka:Conceptualization, Writing - review & editing,Supervision.
Declaration of competing interest
The authors declare that they have no known competing financial interests or personal relationships that could have appeared to influence the work reported in this paper.
Acknowledgments
This study was partially funded by the Ministry of Education and Science in Poland in terms of designated subsidy among statutory activities (SIB-01, SIB-03). The authors are thankful to Mr.Wojciech Dragowski and Mrs.Aleksandra Pietraszko for their assistance in part of the analyses.
Appendix A. Supplementary data
Supplementary data for this article can be found online at https://doi.org/10.1016/j.cj.2021.12.007.
- The Crop Journal的其它文章
- Brief Guide for Authors
- Revisiting the role of delta-1-pyrroline-5-carboxylate synthetase in drought-tolerant crop breeding
- A new gain-of-function OsGS2/GRF4 allele generated by CRISPR/Cas9 genome editing increases rice grain size and yield
- Corrigendum to ‘‘De novo design of future rapeseed crops: Challenges and opportunities” [Crop J. 10 (2022) 587-596]
- Improving the resistance of the rice PTGMS line Feng39S by pyramiding blast, bacterial blight, and brown planthopper resistance genes
- Low N apparent surplus with higher rice yield under long-term fertilizer postponing in the rice-wheat cropping system

