Low N apparent surplus with higher rice yield under long-term fertilizer postponing in the rice-wheat cropping system
Yn Zhou, Lei Xu, Jinwei Zhng,b, Weiwei Li, Yu Jing, Songhn Wng, Ynfeng Ding,Zhenghui Liu, Gnghu Li,
a National Engineering and Technology Center for Information Agriculture/Key Laboratory of Crop Physiology and Ecology in Southern China/Jiangsu Collaborative Innovation Center for Modern Crop Production, Nanjing Agricultural University, Nanjing 210095, Jiangsu, China
b Scientific Observing and Experimental Station of Arable Land,Ministry of Agriculture and Rural Affairs,China/Institute of Agricultural Resources and Environment,Jiangsu Academy of Agricultural Sciences, Nanjing 210095, Jiangsu, China
Keywords:Fertilizer postponing N apparent surplus Rice yield Spikelets per panicle Rice-wheat cropping systems
A B S T R A C T Nitrogen (N) fertilization increases rice yield, but inappropriate N fertilizer application increases N loss and the risk of environmental pollution.Short-term fertilizer postponing(FP)generally reduces N apparent surplus and increases rice yields,but the effects of long-term FP on N surplus and rice yields remain unknown. Our study was the first to investigate the impacts of long-term FP (11 years) on N apparent surplus and rice yields.FP effects in the short term(≤6 years)did not affect rice yields,whereas FP effects in the long term (>6 years) increased rice yields by 13.9% compared with conventional fertilization(CF).FP did not affect panicles per unit area,1000-kernel weight,and filled-kernel rate,but spikelets per panicle increased over time due to spikelet formation stimulation. FP also reduced the N apparent surplus over time more strongly than CF owing to higher N accumulation and N utilization efficiency. FP effects in the long term also significantly increased soil organic matter, total N, and NH4+-N content. Our results were supported by a pot experiment, showing that rice yields in soils with a history of FP were significantly higher than those for soils without a history of FP, indicating that FP increased rice yields more strongly in later years mainly because of soil quality improvement. Our findings suggest that longterm FP can reduce N loss while increasing rice yields by improving soil quality.
1. Introduction
Rice (Oryza sativaL.) is the main staple food for many cultures worldwide, and its production demand is predicted to increase by approximately 30% by 2050 to maintain the current per capita consumption rate [1,2]. The Green Revolution enabled China to effectively use 9%of the world’s arable land to feed 22%of the global population [3]. Rice yields have increased by 238% from the 1960s to the 2000s,and nitrogen(N)input has contributed greatly to these yield improvements [4]. However, N input rates have increased by 65% in the last two decades,whereas rice production has grown by only 19.4%in China[4].Excessive inorganic N fertilizer use has been associated with a broad range of environmental impacts, including soil acidification, nitrous oxide emissions, and eutrophication [5-7]. In response, recent studies [8-10] have focused on optimization of nutrient management to promote nutrient uptake and utilization in rice, as well as to improve Nuse efficiency (NUE) and reduce N apparent surplus.
Most Chinese farmers apply 70%-80% of N fertilizer during the transplanting period and 7-10 days after transplanting[11].However,most of the N is lost owing to imperfect root system structure[12-15].Lin et al.[16]found that only 14.5%of base and tillering N fertilizer was taken up by rice plants, whereas approximately 26%of N applied at the panicle stage was absorbed. To increase NUE and reduce N apparent surplus, reducing the N input rate during the early growth stage and increasing the N input rate during the reproductive growth stage have been recommended.Several newly developed N fertilization practices have been promoted, including integrated nutrient management [8], integrated soil-crop system management [17], and site-specific N management [18]. The core aspect of these practices is rational fertilization based on the nutrient requirements of rice at different growth stages.
Fertilizer postponing (FP; i.e., reducing early growth stage N proportions and increasing panicle N proportions) is considered[1,8,19] to be an effective nutrient management strategy that adapts to the changing requirements of rice plants throughout their growth process. Over the past two decades, several experiments have demonstrated that FP could increase both rice yield and NUE. FP increased the number of tillers at peak tillering stage and the number of productive tillers[9,20].FP supplied adequate N levels, leading to an increase in spikelets per panicle during the early reproductive growth period [18,21]. Finally, compared to conventional fertilization practices, FP maintained a higher leaf area index(LAI)for longer periods and promoted more dry matter accumulation during the grain filling period, resulting in higher 1000-kernel weights [22].
Previous FP experiments have often spanned only two to three growing seasons. FP increases N uptake and may reduce soil N availability in the long term, resulting in systematic N deficiency and reduction in rice production. However, to our knowledge, no experiments have been conducted to assess the effects of longterm FP on rice yields and N apparent surplus. We conducted a long-term field experiment to assess these effects in a rice-wheat cropping system.
2. Materials and methods
2.1. Site description
A long-term field experiment was initiated in 2010 to study the effects of FP on N apparent surplus and rice yields. The study site was located at the Danyang Farm Experiment Station of Nanjing Agriculture University (Yanling, Jiangsu, China) (32°00′N,119°32′E). This region is a typical rice-growing area in the middle and lower reaches of the Yangtze River.The main properties of the original soil(0-20 cm)were as follows:soil organic matter(SOM),17.2 g kg-1; total N (TN), 1.0 g kg-1; total P, 0.5 g kg-1; total K,11.0 g kg-1; available P, 13.6 mg kg-1; available K, 93.5 mg kg-1.Air temperature, photosynthetically active radiation (PAR), and precipitation were obtained from a WatchDog 2900ET weather station (Spectrum Technologies, Inc., Aurora, IL, USA) at the experimental site, and the mean values for each rice season are summarized in Fig. 1.
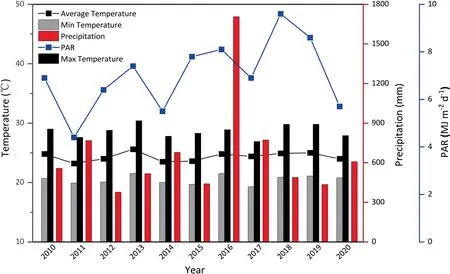
Fig. 1. Meteorological conditions during the 2010-2020 rice seasons.
2.2. Materials and experimental design
2.2.1. Field experiment
The field experiment consisted of a control without N fertilizer(N0), conventional fertilization (CF), and fertilizer postponing (FP)treatments with three replicates. Plots were 7.3 m×4.6 m in size and were separated by cement ridges set 20 cm above and 40 cm below the soil surface. In rice seasons, CF and FP treatments were treated with equal amounts of nutrient fertilizer; however, fertilization times and periods varied(Table 1).Urea was used as N fertilizer, calcium superphosphate as P fertilizer, and potassium chloride (KCl) as K fertilizer. The chemical fertilizers were applied at a rate of 300 kg N ha-1, 150 kg P2O5ha-1, and 240 kg K2O ha-1.In wheat seasons,fertilization times and periods of CF and FP treatments were similar to those in rice seasons(Table 1),but the total amounts of chemical fertilizer differed. Those for CF were applied at 190 kg N ha-1, 67.5 kg P2O5ha-1, and 67.5 kg K2O ha-1. Those for FP were applied at 225 kg N ha-1, 105 kg P2O5ha-1, and 105 kg K2O ha-1.

Table 1Fertilization times and timing of treatments.
The rice cultivar Wuyunjing 23 (2010-2020) was transplanted by hand in late June at a plant spacing of 30.0 cm×13.3 cm and harvested in late October, and winter wheat (Yangmai 16 (2010-2013) and Yangmai 20 (2014-2020),Triticum aestivumL.) was sown in mid-November at a seed rate of 225 kg ha-1. In rice seasons, water depth was maintained at 1-3 cm at tillering stage,drained at midseason and re-flooded at jointing stage, and then dry-wet alternate irrigating to maturity. All other management practices followed local recommendations.
2.2.2. Pot experiment
A pot experiment with three replicates was conducted.In early June 2020, two soil samples (0-20 cm) were collected with a shovel from six plots each of CF and FP. Samples were combined per plot, air-dried, and sieved to 6-mm mesh size to remove stones.Plastic pots (height, 20 cm; diameter, 18 cm) were filled with 4.0 kg of sieved soil. All plots were subjected to the FP nutrient management. Soils without a history of FP with FP nutrient management of plants (-S) mimicked year 1 of FP, whereas soils with a history of FP with FP nutrient management of plants(+S)mimicked year 10 of FP.The rice cultivar was the same one grown in the field experiment. One healthy rice seedling was transplanted into the pot in mid-July and harvested in mid-October.Water management was consistent with that of the field experiment.
2.3. Sampling and measurements
2.3.1. Tiller number, dry matter accumulation, and N content
In the field experiment, the mean number of tillers was determined by counting 60 hills of plants,after which three representative hills were sampled according to the mean number of tillers at panicle initiation stage(PI),heading stage(HS),and maturity stage(MS).The stems,leaves,and panicles of three hill plants were separated, dried at 105°C for 30 min, and then dried at 80°C to constant weight to determine dry matter accumulation. Each structure was digested with H2SO4/H2O2and total N was determined by the Kjeldahl method in 2010, 2011 and 2017-2020.The total N of mixed samples was determined in 2012-2016.
2.3.2. Rice yield and its components
Panicles per m2was the mean number of tillers at MS.For panicles of three representative hills at MS,the number of spikelets per panicle and filled-kernel rate were recorded.Sixty hill plants were also harvested from each plot to calculate mean 1000-kernel weight.Rice yield was calculated as the product of panicle number per m2, number of spikelets per panicle, filled-kernel rate, and 1000-kernel weight.
2.3.3. Soil plant analysis development (SPAD) values and leaf area index (LAI)
SPAD values of the third and fourth fully expanded leaves at PI and of the first to fourth fully expanded leaves at HS were measured with a SPAD-502 chlorophyll meter (Minolta Camera Co.,Osaka, Japan). The first to fourth fully expanded leaves from the top of the plant were named L1-L4.Five randomly selected plants from each field plot were measured, and the SPAD values of the upper, middle, and lower parts of the leaf were recorded, and the mean was recorded as the leaf SPAD value.
At PI and HS,LAI was measured for three representative hills of each plot with an LI-3100C area meter (LI-COR, Lincoln, NE, USA).
2.3.4. Soil properties
Soil samples (0-20 cm) were collected after the rice harvest in 2020. Soil organic matter (SOM) and total N (TN) were measured using the potassium dichromate oxidation method and the Kjeldahl method, respectively [23]. Soil NH4+-N and NO3--N (2 mol L-1KCl, 1:5 soil:solution) were colorimetrically determined with a segmented flow autoanalyzer (Skalar San++, Breda, Holland). Soil available P and K were quantified using the Olsen P and NH4OAc K methods, respectively [23].
In the pot experiment, aboveground weight and grain yield were recorded at harvest,and rice plants were dried as in the field experiment.
2.4. Data processing and analysis
Grain yield increase rates were calculated to measure the effect of long-term nutrient management on grain yields.

whereN(FP,CF)andN0are the plant N uptake(kg ha-1)in the N and N0plots, respectively. The number 300 represents the total N applied in the FP and CF treatments (measured in kg N ha-1).
whereYFPandYCFare the grain yields (t ha-1) of FP and CF,respectively.


To measure the effect of long-term nutrient management on material transport (MT) in different growth stages, the increase in material transport during the vegetative growth period (TS-PI),early reproductive growth period (PI-HS), and late reproductive growth period (HS-MS) were calculated. TS, PI, HS, MS represent the transplanting, panicle initiation, heading, and maturity stages,respectively. Formula 5 calculation of MT by formula 6.

where DW andirepresent dry weight(t ha-1)and different growth stages of plants, respectively.Ais the increase in dry matter accumulation (t ha-1) of stem, leaf or panicle from above three growth stages.
2.5. Statistical analyses
The Grubbs test was used to identify and eliminate outlier values,after which the Shapiro-Wilks test and Levene’s test were used to check for normality and homoscedasticity, respectively. If the samples did not pass these tests, logarithmic transformation was performed on the original data, after which linear regression and means comparisons were performed. Correlations between year and grain yield increase rate, yield components, dry matter accumulation, and harvest index were calculated, and the linear fitting between N accumulation, utilization, and apparent surplus and year were also calculated. Differences between short-term and long-term rice yields were analyzed by two-way (treatment and experimental duration) analysis of variance (ANOVA) and independent-samplet-test for the given treatment. In soil quality and pot experiment, means were compared using an independent-samplet-test. Statistical analyses were performed with SPSS 19.0 (SPSS Inc., Chicago, IL, USA). All figures were constructed using graphpad prism 8 (Graphpad Software Inc., San Diego, CA, USA).
3. Results
3.1. Rice yield increase rate, dry matter accumulation, and harvest index
Over an 11-year period,FP increased rice yields compared to CF(P<0.05) (Fig. 2a). On average, the rice yield of FP was 545.7 kg ha-1higher than that of CF. There was a treatment×experimental duration interaction such that FP showed no effect on rice yield in short-term experiments (≤6 years). FP increased rice yields by 13.9% in long-term experiments (>6 years)(Fig. 2b). There was no significant correlation between treatment year and aboveground biomass (Figs. 2c, S3a). The harvest index of FP showed an upward trend with time,while that of CF showed a significant negative correlation with treatment year, with the result that FP effects in the long term (>6 years) significantly increased harvest index compared with CF (Figs. 2d, S3b). With respect to plant material transportation (Fig. 3), the leaf and panicle weights of FP showed a significant increasing tendency over time only during the PI-HS period (Fig. 3d, e).
3.2. N accumulation, utilization, and apparent surplus
The temporal changes in rice N accumulation, NUE, and N apparent surplus of the CF treatment were relatively stable(Fig. 4). However, compared with the CF treatment, these three indicators of FP showed significant temporal changes over the 11-year period. Both the N accumulation and N use efficiency of FP showed a significant increasing trend, with mean annual increases of 6.37 kg ha-1and 1.57%,respectively.At the same time,with increased rice N utilization, the N apparent surplus of FP showed a downward trend over the 11-year period, with a significant annual reduction of 4.31 kg ha-1.
3.3. Correlations between rice yield components and year
There were no significant linear relationships between treatment year and panicles per unit area or 1000-kernel weight in either the CF or the FP treatment (Fig. 5a, c). In contrast, spikelets per panicle and filled-kernel rate were significantly correlated with treatment year(Fig.5b,d).The spikelets per panicle of FP was significantly and positively correlated with treatment year, with a mean annual increase of 2.10 seeds per panicle.However,the temporal change of spikelets per panicle showed opposite trends in the two treatments.Thus,in the long-term experiments(>6 years),the mean spikelets per panicle of FP was significantly higher than that of CF by 21.3% (Fig. S4b). The filled-kernel rate of CF was significantly and negatively correlated with treatment year, but there was no significant relationship between that of FP and the treatment year (Fig. 5d).
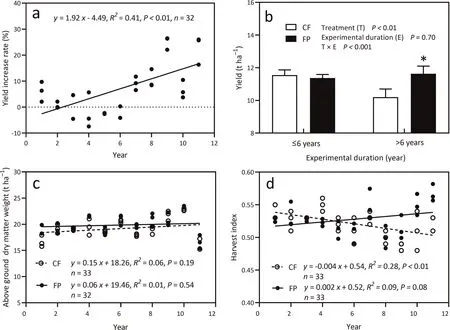
Fig. 2. Relationship between treatment year and yield increase rate (a), rice yield in short-term (≤6 years) and long-term (>6 years) experiments (b), dry-matter accumulation (c), and harvest index (d) in two nutrient management treatments over the 11-year experiment. CF, conventional fertilization; FP, fertilizer postponing. Each point in panels(a),(c),and(d)represents a repetition of the corresponding year.Values from the short-term experiment(≤6 years)and the long-term experiment(>6 years)are from 2010 to 2015 and 2016-2020,respectively.*indicates differences between the CF and FP treatments at P <0.05 based on the mean values of all years under the same long-term (>6 years) experiments.
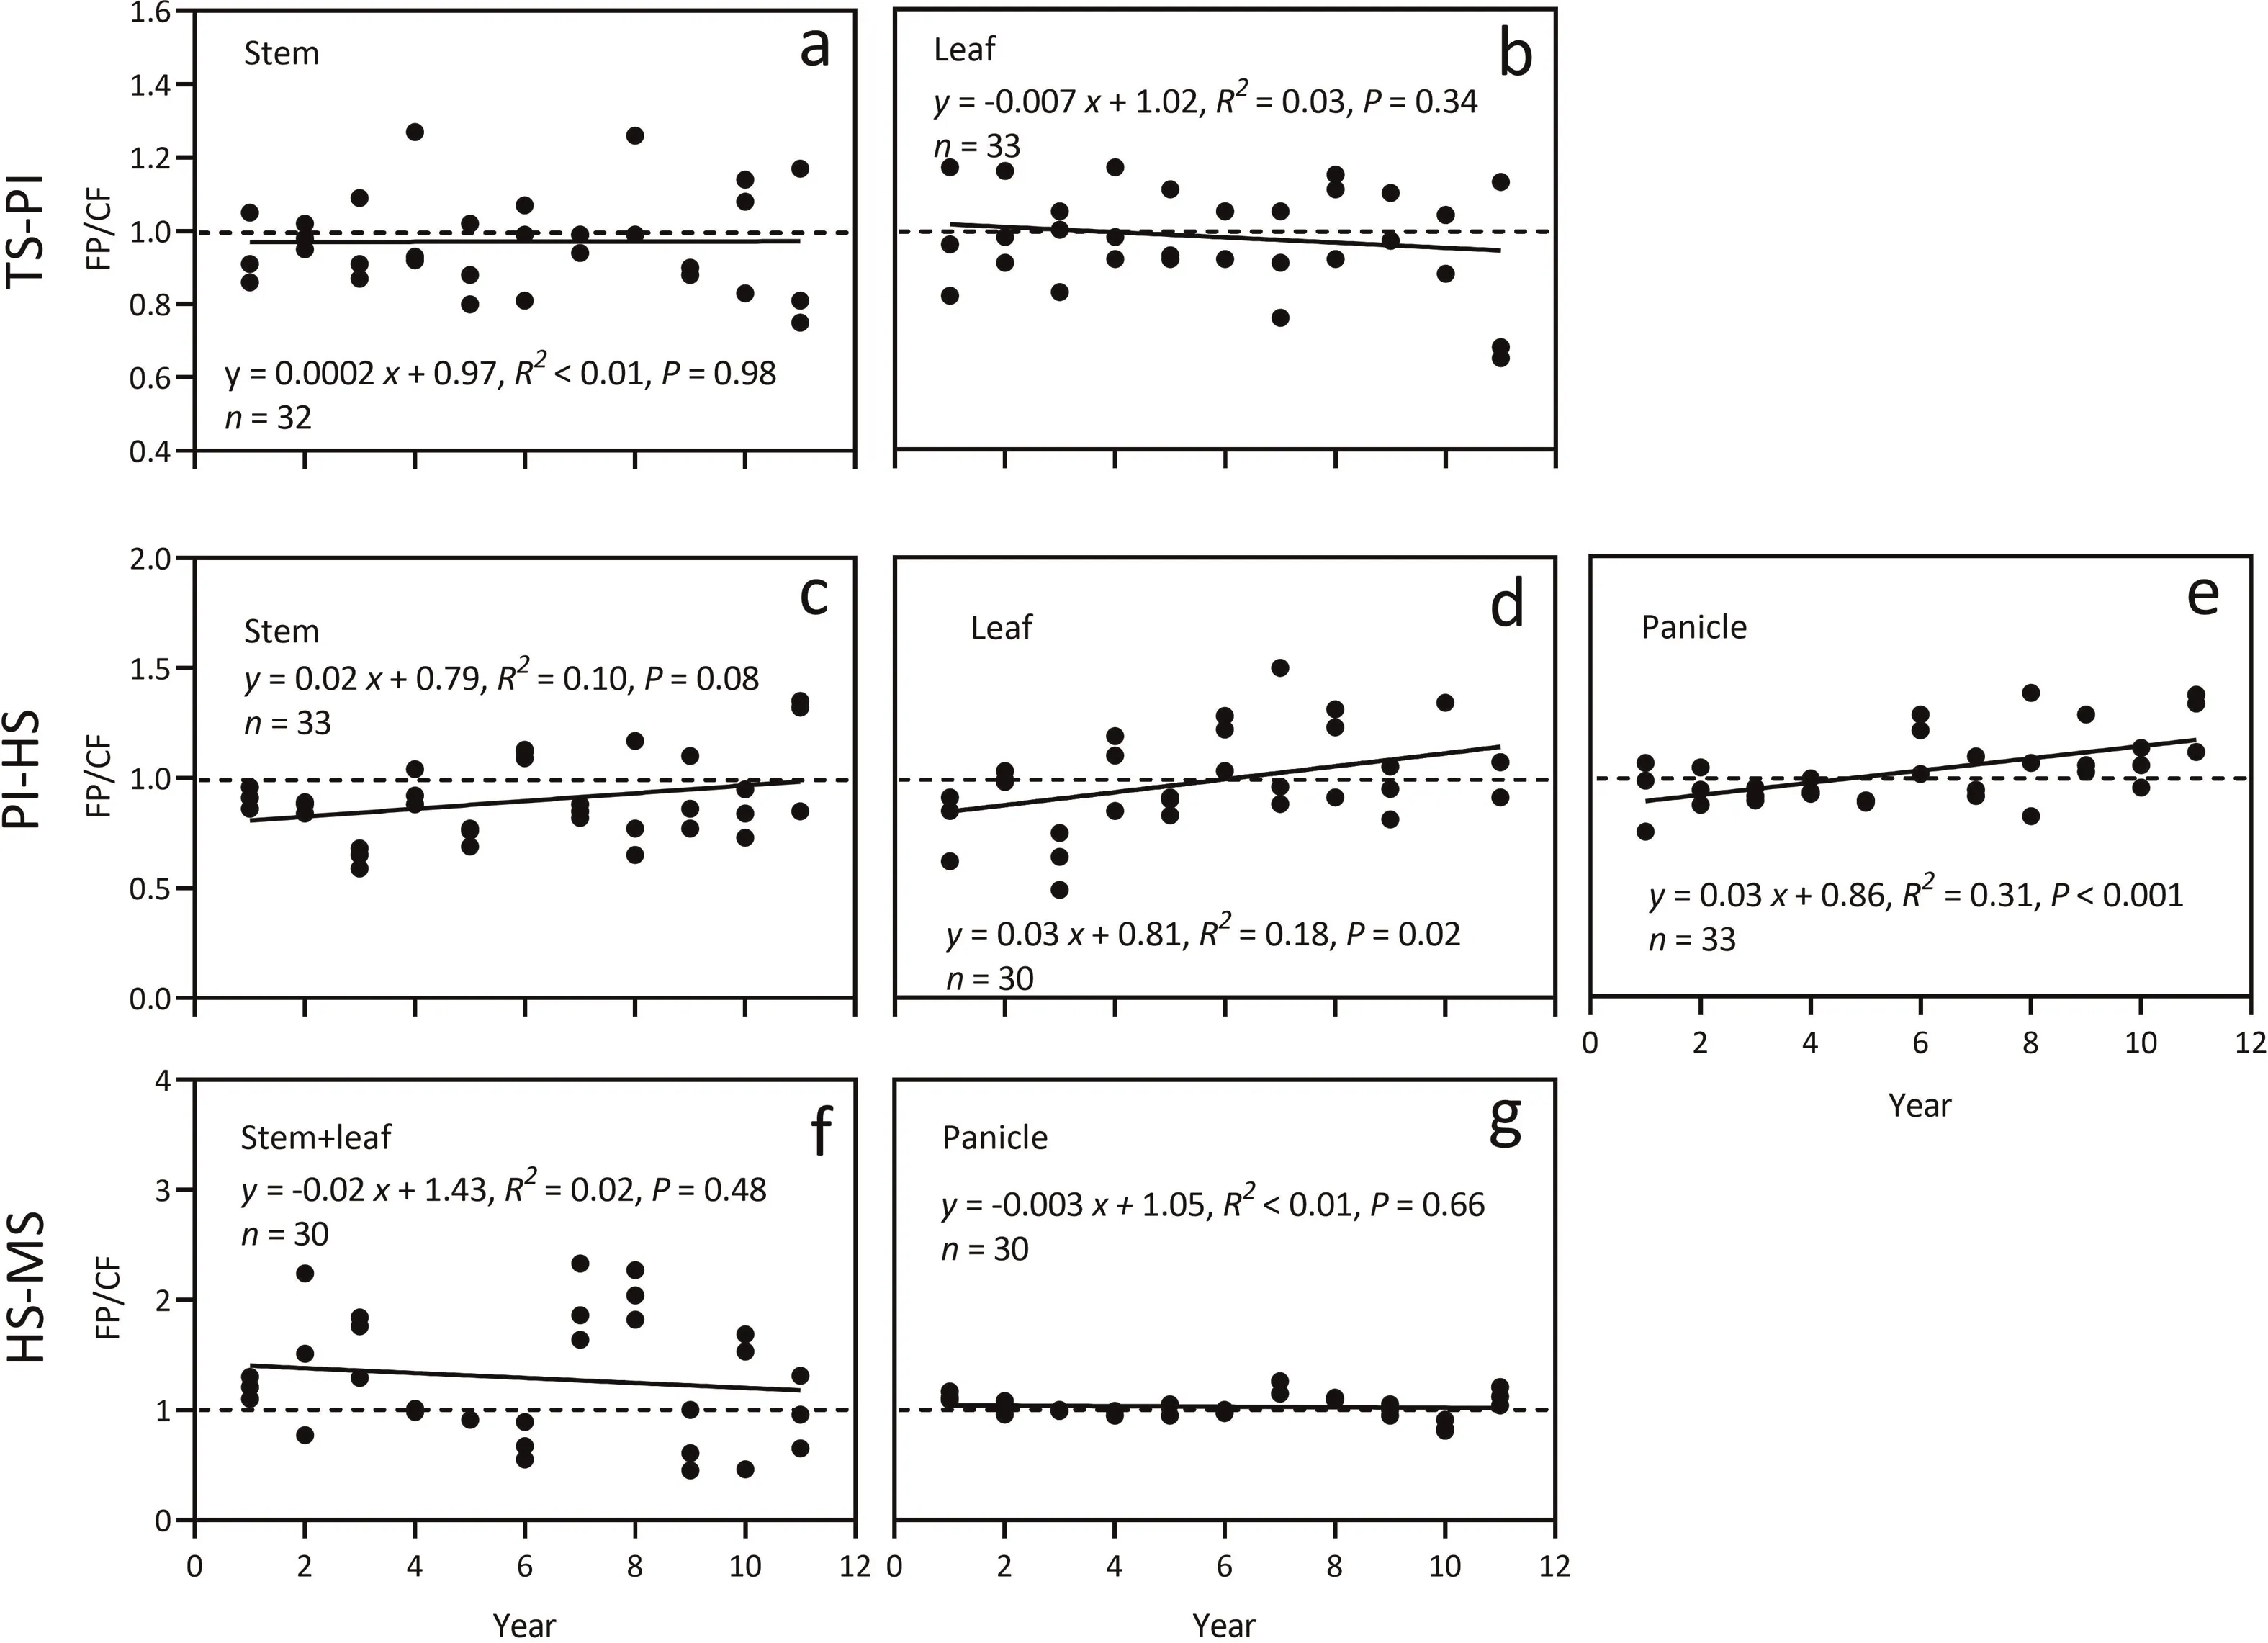
Fig.3. Relationship between treatment year and FP/CF ratio in each plant structure at three growth periods.(a)Stem weight of FP/CF at the TS-PI period.(b)Leaf weight of FP/CF at the TS-PI period.(c)Stem weight of FP/CF at the PI-HS period.(d)Leaf weight of FP/CF at the PI-HS period.(e)Panicle weight of FP/CF at the PI-HS period.(f)Stem+leaf weight of FP/CF at the HS-MS period.(g)Panicle weight of FP/CF at the HS-MS period.CF,conventional fertilization;FP,fertilizer postponing.TS,PI,HS,and MS represent the transplanting, panicle initiation, heading, and maturity stages, respectively. TS-PI represents the vegetative growth period, PI-HS represents the early reproductive growth period, HS-MS represents the late reproductive growth period. Each point in the plots represents a repetition of the corresponding year.

Fig. 4. Temporal changes in N accumulation (a), N use efficiency (b), and N apparent surplus (c) in two nutrient management treatments over the 11-year experimental period. CF, conventional fertilization; FP, fertilizer postponing. Each point in the plots represents a repetition of the corresponding year.
3.4.Short-term and long-term effects of nutrient management on rice growth
The effects of the nutrient management treatments on rice growth under two experimental durations (≤6 years: short-term effect, >6 years: long-term effect) are shown in Tables 2 and 3.Dry matter weight was not affected by nutrient management,experimental duration,or their interaction at PI,HS,and MS.Tiller number and LAI were affected only by experimental duration.Similarly, FP effects in neither the short-term nor long-term showed significant effects on dry-matter weight, tiller number, and LAI(Table 2). However, leaf SPAD values were significantly affected by nutrient management, experimental durations, and their interaction, especially at HS. Whereas FP effects in the short term did not affect SPAD values of L1-L4 (Table 3), FP effects in the long term significantly increased SPAD values on L1-L4. Only at HS,the N content of plants was significantly affected by nutrient management and experimental duration, but there was no interaction between the two. FP effects in the short-term significantly increased stem N content only at HS,whereas FP effects in the long term significantly increased the N content of both stem and leaf at HS.They also significantly increased N content in stems and leaves at MS (see Table 4).

Fig.5. Relationship between treatment year and rice yield components under two nutrient management treatments over the 11-year period.(a)Number of panicles m-2.(b)Spikelets per panicle. (c) 1000-kernel weight. (d) Filled-kernel rate. CF, conventional fertilization; FP, fertilizer postponing.

Table 2Effects of nutrient management on rice dry-matter weight, tiller number, and LAI at main growth stages.

Table 3Effects of nutrient management on leaf SPAD at main rice growth stages.
3.5. Long-term effects of nutrient management on soil quality
Compared with CF,FP effects in the long term showed no significant effect on NO3--N, whereas they significantly increased SOM,TN, NH4+-N, and available P content by 16.5%, 22.4%, 9.1%, and 17.7%,respectively(Table 5).Results from the pot experiment supported the long-term effect of nutrient management on rice growth(Fig.6).The treatment with a history of FP showed no effect on aboveground weight.However,the panicle weight for soils with a history of FP was significantly higher than that for soils without a history of FP, with an increased rate of 13.5% (in 2020).

Table 4Effects of nutrient management on N content of plants at main growth stages (%).

Table 5Long-term effects of nutrient management treatments on soil quality.
4. Discussion
Although several other studies have shown that postponing N fertilization increased rice yield throughout 2-3 growing seasons[19,24,25],the finding in the field experiment that FP did not affect rice yields in the short term (Fig. 2a, b) is consistent with those of recent studies[1,24].These differences were likely due to the variations in background soil fertility: short-term FP generally increased rice yields in high-fertility paddies (with SOM >24 g kg-1) [9,26],whereas it reduced rice yields in low fertility paddies(with 6.0 g kg-1<SOM <17.2 g kg-1) [1,27].
The finding that in both the field and pot experiments,FP effects in the long term significantly increased rice yields(Figs.2b,6b)can be explained by soil fertility improvement, as indicated by the higher SOM,TN,and NH4+-N contents after long-term FP.Given that the amount of plant N uptake from soil is about twice that from synthetic fertilizer [28], the plant can obtain more N from the soil after long-term FP treatment, especially to stimulate spikelet differentiation [29,30].In our study, FP did significantly increase spikelets per panicle after long-term experiments, indicating that FP effects in the long term can increase sink size. However, the increase in spikelets per panicle could intensify the competition between grain filling and single-kernel weight due to limited source capacity [31,32]. Therefore, high yields were more dependent on the coordination of source-sink relationship [33]. Our results suggest that FP effects in the long term increased spikelets per panicle while maintaining the grain-filling stability, which is closely related to photosynthetic capacity after heading and the accumulation of photosynthetic products before heading [34,35].In our experiments, FP effects in the long term mainly increased SPAD value and N content of leaves at the heading stage,indicating that soil fertility improvement supported continuous grain filling after sink enlargement primarily by increasing the strength of the source.High soil fertility can also increase rice plant resistance to biotic and abiotic stresses. Kumar et al. [36] reported that high SOM increased the sustainability of microbial activities to ensure normal function, thus mitigating the impact of heat stress and increasing the resistance of plants to heat damage.
FP effects in the long term increased the SOM content in our experiment. SOM is often affected by the balance of C inputs and C mineralization [37]. FP increased root productivity [38], which can increase or stabilize soil SOC by forming soil large aggregates and an organic-mineral complex [39,40]. However, in two studies[41,42], the increase of roots was often accompanied by the increase of rhizodeposition, leading to the enhancement of soil--root interactions and thereby accelerating the decomposition of SOC and leading to the rhizosphere priming effect.In our study,FP effects in the long term may have optimized the microbial community and function, so that the rate of soil C sequestration was greater than C mineralization,by a mechanism that invites further study.
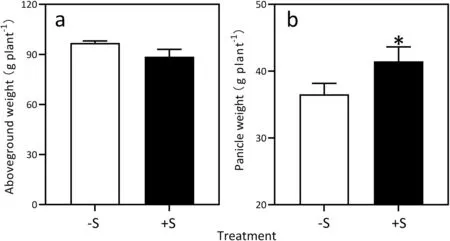
Fig.6. Long-term effects of nutrient management on rice growth.(a)Aboveground weight.(b)Panicle weight.-S,soils without a history of FP;+S,soils with a history of FP.*indicates differences(P <0.05)between the-S and+S treatments by Student’s t-test.
The finding that FP effects in the long term also reduced the N apparent surplus more strongly compared to CF over time could be explained by a promotion by long-term FP of a continuous increase in plant NUE. Our results showed that the increase of NUE in long-term FP was due to the increase of plant N content rather than dry weight. The similarity of dry weight may be due to the similar number of tillers.Plant N content is directly affected by soil available N content.Reducing N loss and increasing N stock are two ways to improve soil N availability. On the one hand, FP reducing early growth-stage N ratios can reduce N losses from ammonia volatilization, leaching, and runoff [5,43,44], because the imperfect rice roots in the early stage can absorb only limited nutrients [15,16,45]. On the other hand, FP increasing panicle-N ratios increased soil N fixation[28]and highly fertile soil was more conducive to soil N fixation.Pan et al.[25]found that adding a second panicle fertilizer (flower-preserving fertilizer, reducing floret degradation) increased residual N in soils. Xu et al. [8] found that 7.9% of panicle fertilizer remained in the soil. Moreover, high SOM levels could further promote N sequestration by increasing the stability of soil aggregates, as high SOM reduces the repulsive force and increases the attractive force between particles [46].Our experiment also showed that FP effects in the long term increased soil TN content in high SOM soils.In summary,FP effects in the long term reduced N apparent surplus by increasing soil N supply capacity to promote plant N uptake.
The FP technique requires more labor for applying N fertilizer,limiting its popularization and application, in contrast to mechanized one-time fertilization. However, the characteristics of high yield and high efficiency of the FP technique are the most consistent with the laws of rice nutrient absorption. Development of a new fertilizer type (controlled-release fertilizer) permitting nutrient release conforming to FP technique [47], and its combination with mechanized one-time fertilization may lead to sustainable rice production.
5. Conclusions
Compared with CF,the yield-increasing effects of FP in the long term were higher than those of FP in the short term owing to an increase in spikelets per panicle by promotion of young-panicle development. FP reduced the N apparent surplus more strongly over time owing to an increase in rice plant N accumulation and NUE. Long-term FP increased the contents of SOM, TN, and NH4+-N. In a pot experiment, rice yield in soils with a history of FP was higher than in soils without one, indicating that long-term FP increased rice yields more strongly mainly because of soil quality improvement.Our findings suggest that long-term FP can increase rice yields while reducing N loss, owing to improved soil quality.
CRediT authorship contribution statement
Yan Zhou:Conceptualization, Data curation, Formal analysis,Investigation, Methodology, Writing - original draft, Writing -review&editing.Lei Xu:Data curation.Jianwei Zhang:Data curation.Weiwei Li:Supervision.Yu Jiang:Supervision, Writing -review & editing.Songhan Wang:Supervision, Writing - review&editing.Yanfeng Ding:Project administration,Resources.Zhenghui Liu:Supervision.Ganghua Li:Conceptualization, Funding acquisition, Project administration, Resources, Writing - review &editing.
Declaration of competing interest
The authors declare that they have no known competing financial interests or personal relationships that could have appeared to influence the work reported in this paper.
Acknowledgments
Funding was provided by the National Key Research and Development Program of China (2017YFD0301203, 2017YFD0300100,and 2018YFD0300803) and Jiangsu Agriculture Science and Technology Innovation Fund (CX (18)1002).
Appendix A. Supplementary data
Supplementary data for this article can be found online at https://doi.org/10.1016/j.cj.2022.01.001.
- The Crop Journal的其它文章
- Brief Guide for Authors
- Revisiting the role of delta-1-pyrroline-5-carboxylate synthetase in drought-tolerant crop breeding
- A new gain-of-function OsGS2/GRF4 allele generated by CRISPR/Cas9 genome editing increases rice grain size and yield
- Influence of seven levels of chemical/biostimulator protection on amino acid profile and yield traits in wheat
- Corrigendum to ‘‘De novo design of future rapeseed crops: Challenges and opportunities” [Crop J. 10 (2022) 587-596]
- Improving the resistance of the rice PTGMS line Feng39S by pyramiding blast, bacterial blight, and brown planthopper resistance genes

