
Using image processing technology to create a novel fry counting algorithm
2022-08-08 10:24JianfeiZhangHaitongPangWeimingCaiZhonghongYan
Aquaculture and Fisheries 2022年4期
Jianfei Zhang, Haitong Pang, Weiming Cai, Zhonghong Yan
aSchool of Information Science and Engineering, NingboTech University, Ningbo, 315100, China
bCollege of Control Science and Engineering, Zhejiang University, Hangzhou, 310058, China
cChongqing University of Technology, Banan, 400054, China
Keywords:
Fish counting
Image recognition
Thinning algorithm
Connected area algorithm
A B S T R A C T
Quantitative counting of fry is required for multiple reasons, including breeding, transportation, and sales and creating a fish-counting algorithm using image processing technology is proposed as a useful method. The images for fish fry were preprocessed to extract the details of the target fish, using methods including binarization,dilation, and erosion. The thinning and the connected area algorithms were then independently adopted to count the fish fry within the image. The advantages and the disadvantages of the two algorithms under different densities were also compared, revealing that the fish fry pictures with a clear contrast between the foreground and background resulted in a higher accuracy. The main purpose of this research is to solve the problem of fry counting in the case of high density and high overlap. This research provides a reference point for this method based on image technology.
1.Introduction
The breeding and sales of fry in aquaculture have received increasing attention. As the scale of aquaculture production continues to expand, it is necessary to accurately count the fry for determining the stocking density, feed volume, transportation, and sales of the fry (Allison &Mills, 2018; Eggleston, Milne, Ramsay, & Kowalski, 2020; Garcia et al.,2020). The traditional methods of fry counting utilize the statistical sampling method of distribution sampling and weighing mass. The efficiency of these methods is low and the precision is poor and unable to meet the requirements of large-scale, factory aquaculture and sales(Castignolles, Cattoen, & Larinier, 1994; De Rosny & Roux, 2001; Fier,Albu, & Hoeberechts, 2014; Zhu, 2009). At present, the methods for counting fry are divided into methods based on counting by sensors and single-chip microcomputers, counting by optical instruments, and counting by computer graphics processing.
With the further development of technology, fry counting methods based on digital image processing, computer photo processing, machine vision, and other technologies have gradually attracted the attention of scholars at home and abroad (Awalludin et al., 2019; Grigoryan, Hostetter, Kallioniemi, & Dougherty, 2002; Jun, Di, Jun-Hua, & Nian-Fu,2018; Shah, 2007, 2010; Tajeripour & Fekri-Ershad, 2012; Zhang,Yang, & Wang, 2020; Fan et al., 2008). Huang Ling et al. (2012)segmented and removed noise from (denoised) the fry image, then identified the connected areas in the image, counted the number of fry pixels in each connected area, and compared it with a base value to obtain the number of fry in each connected area, therefore calculating the total number of fry. Wang et al. (2016) used the Bernoulli principle to design a steady fow tank, so that the fry and water fowed through the imaging area at a steady speed, collected the images at a certain frame rate, and transmitted it to the computer for image processing. The calculation was performed using threshold segmentation and target extraction, where the number of fry in the non-overlapping area of each image and the total number of fry were calculated. Yang et al. (2011)used MATLAB software to perform grayscale, denoising, and morphological processing on Photoshop-preprocessed images and counted fry by using the connected-graph counting and area counting methods. Guo et al. (2018) proposed a fry counting algorithm based on machine vision tracking. These fry counting methods all achieve good accuracy under low density and low overlap, but in the actual breeding of fry, the distribution of fry is random, uneven and prone to high density and high overlap. Therefore, we proposed a novel fry counting algorithm based on fish imaging. The image information of the fry was de fined by image preprocessing, binarization, expansion corrosion, etc. The thinning and connected area algorithms were used for fry counting. On the basis of image preprocessing, this paper compared and analyzed the two methods of fry counting in different conditions.
2.Image preprocessing method
Image preprocessing is a kind of preprocessing for image recognition and understanding (Tajeripour and Ershad, 2012). It mainly refers to making appropriate transformations to highlight useful information and eliminate or weaken useless information. The basic processing methods include grayscale transformation, histogram transformation, image smoothing, image sharpening, etc. In this paper, the corresponding processing methods are adopted according to the image characteristics of fish fry.
2.1.Grayscale
For the problem of fish counting, the contour information of fish is particularly important. Binary images are more conducive to extracting target contour information than color images, so images underwent grayscale processing. There are several ways to undergo grayscale processing: component method, maximum method, average method, and weighted average method. The component method takes the brightness of the three components in the color image as the gray value of the three grayscale images, and selects a grayscale image as required. It is de fined as:

The maximum method takes the maximum value of the brightness of the three components in the color image as the gray value of the grayscale image. It is de fined as:

In this paper, the weighted average method was used to weight the three components with different weights, and the RGB three components were weighted and averaged according to Formula 5, so that a more reasonable grayscale image could be obtained.

2.2.Image smoothing
Median filtering was used to select the appropriate points to replace the value of the pollution points, so the processing effect was relatively positive, especially in dealing with noisy points (see Fig. 1). We adopted median filtering to eliminate isolated noise in fish school images, which used an odd number template to take the median of each point in the template as the value of the center point. Fig. 4 is a fry image of Fig. 3 filtered by a median filter with a window size of 5. After median filtering, the smaller impurities in the original image were substantially removed and the overall image was slightly blurred, but the fish body had almost no change and did not affect the fish fry counting (see Fig. 2).
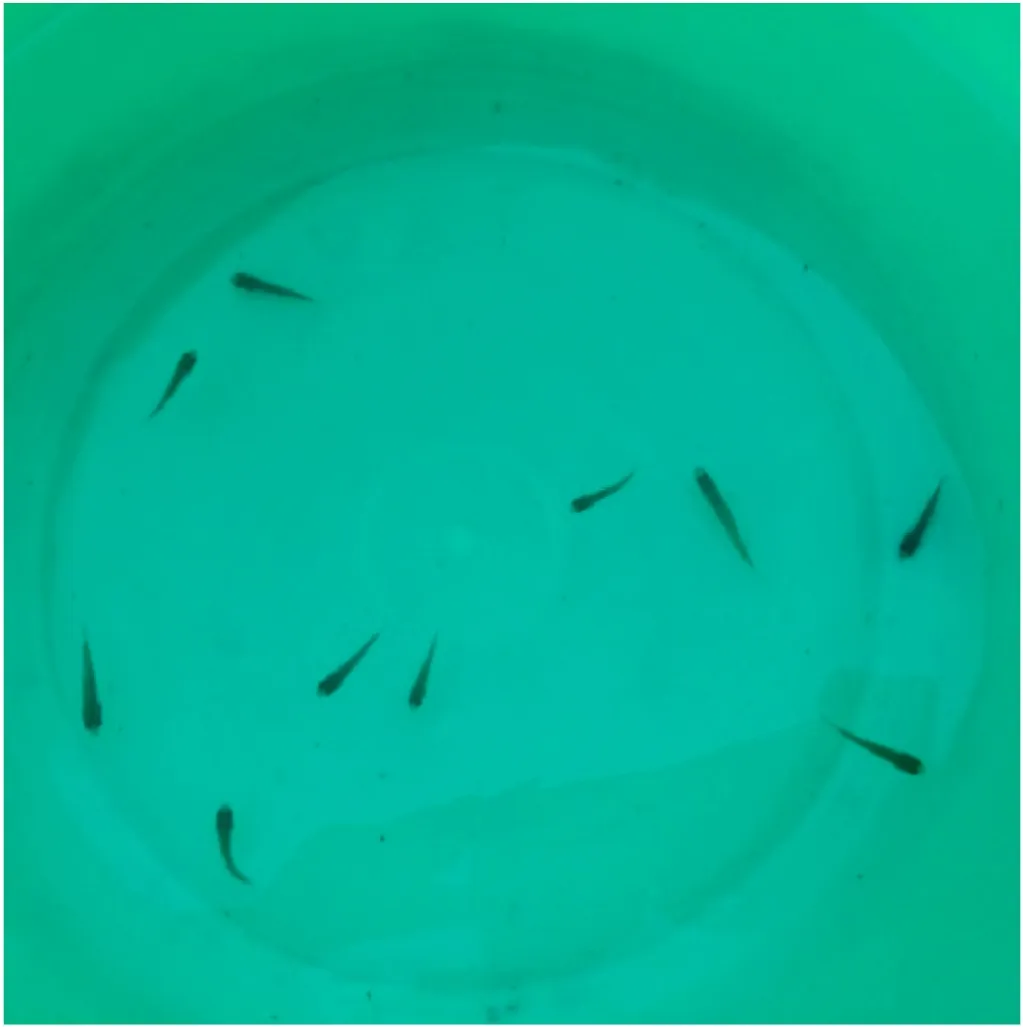
Fig. 1.Original image.
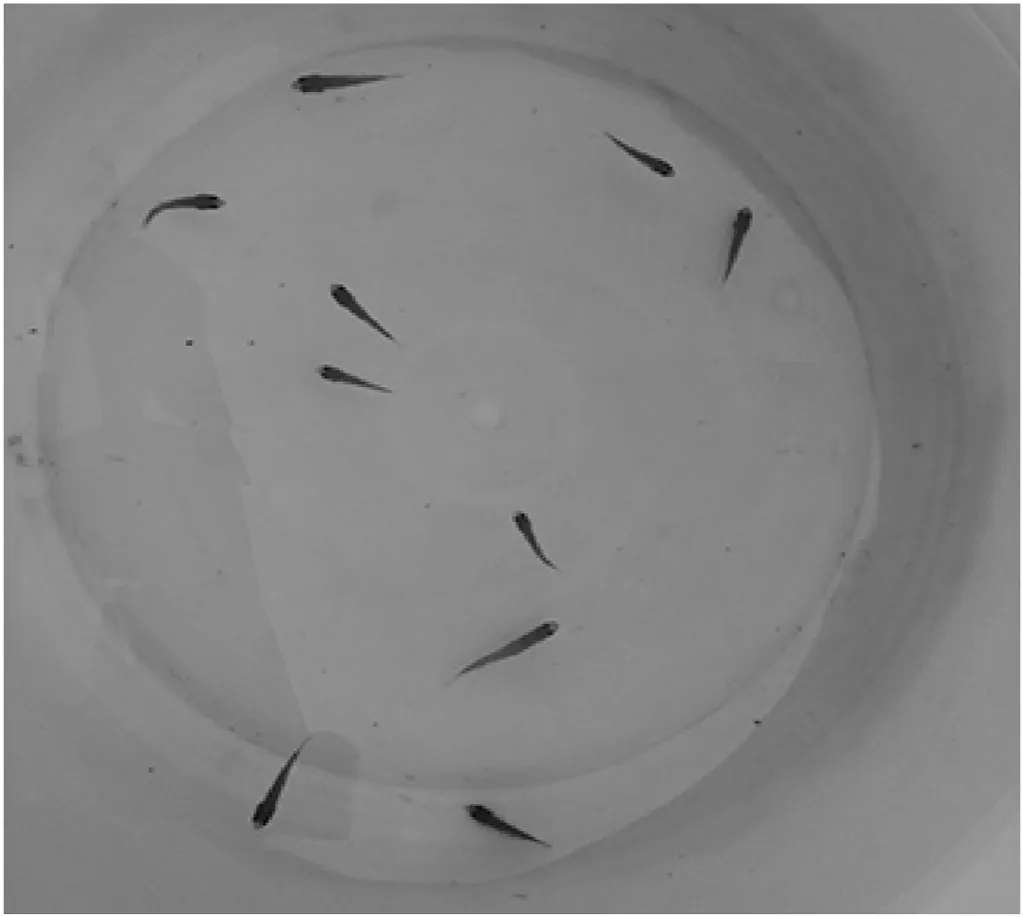
Fig. 2.Grayscale.
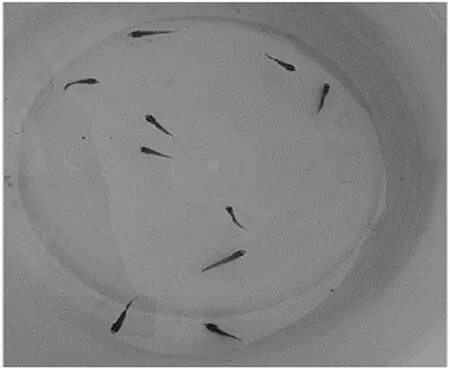
Fig. 3.Grayscale.

Fig. 4.After Median filter.
2.3.Image segmentation
Threshold segmentation is a region-based image segmentation technique that converts a grayscale image into a binary image in black and white. We used the maximum inter-class variance threshold segmentation method (OTSU). This method divides the image into two parts, the background and the foreground, according to the gray-scale characteristics of the image itself, which makes the segmentation with the largest variance between the classes, thereby minimizing the probability of segmentation errors.
The algorithm is described as follows:
Suppose X is an image with L-level gray levels, where the i-th pixel isNiand the value of i is between 0-L-1. The total number of pixels of the image is:
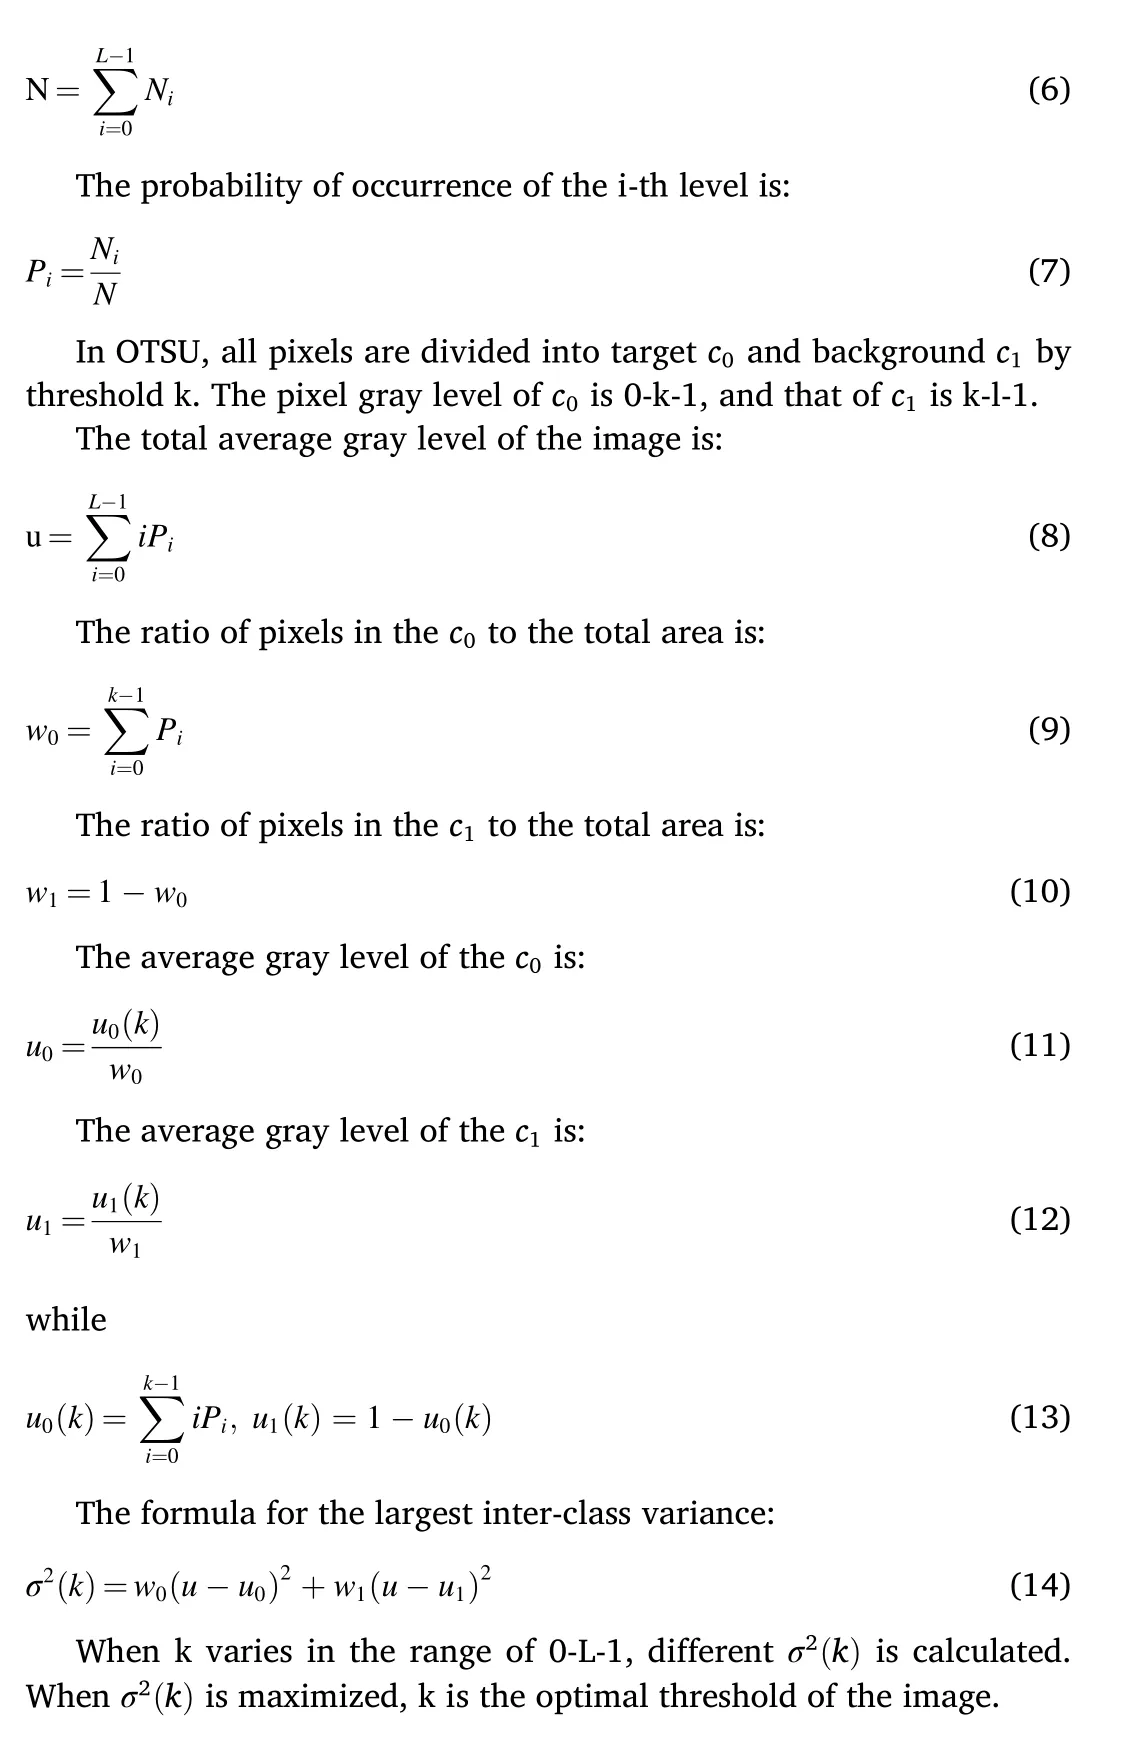
Fig. 5 and Fig. 6 are the experimental diagrams before and after the OTSU threshold segmentation. For the pictures with a clear difference in foreground and background, the segmentation effect with the OTSU algorithm threshold segmentation is good, which basically satis fies our threshold segmentation requirements.
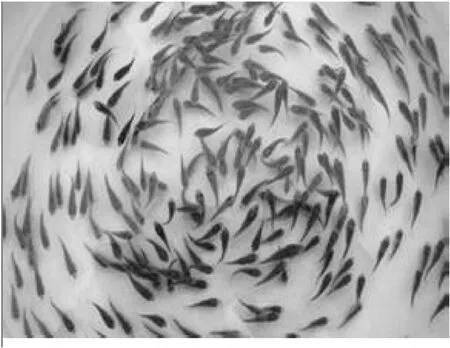
Fig. 5.Before OTSU.
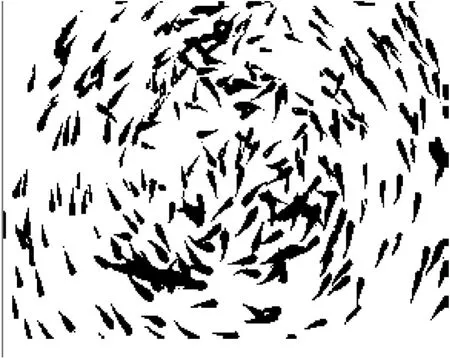
Fig. 6.After OTSU.
2.4.Image dilation and erosion
Dilation and erosion are the basic operations of digital image morphology. The mathematical de finition of dilation is:

Y is a binary image, B is a template operator, and E is the original image to be processed. Dilation is the process of merging all the background points in contact with the object into the object to expand the boundary outward. It can be used to fill holes in objects. Each pixel of the image is scanned with structural element B (as the template) and the set composed of the intersection and non-empty points of structural element B and E is taken. The mathematical de finition of erosion is:

Y is a binary image, B is a template operator, and A is the original image to be processed. Erosion is a process of eliminating boundary points and shrinking the boundary to the inside. It can be used to eliminate small and meaningless objects. The principle of erosion is to scan every pixel of the image with 3 ×3 structural elements. Use the structure element and the binary image it covers to do the “and” operation. If the elements above, up, down, left, right, top left, bottom left,top right, and bottom right adjacent to the element are all 255, the pixel is assigned a value of 255, otherwise 0. Since the fish body image will be larger than the original after dilation, erosion must be carried out to restore the actual size of the fish fry image.
In this paper, the method of first dilation and then corrosion, namely morphological closed operation, was adopted to remove the hollow points in the target fish fry. As shown in the image after threshold segmentation (Fig. 7), we can find many hollow points in the target fry image. Fig. 8 shows the image after dilation and we can clearly see that the hollow points in the image are nearly gone, but the image of the target fish fry is almost a circle larger. According to the image after erosion (Fig. 9), we can see that it has many changes, but still similar to the original image. Therefore, it has little effect on the later treatment of the fry.
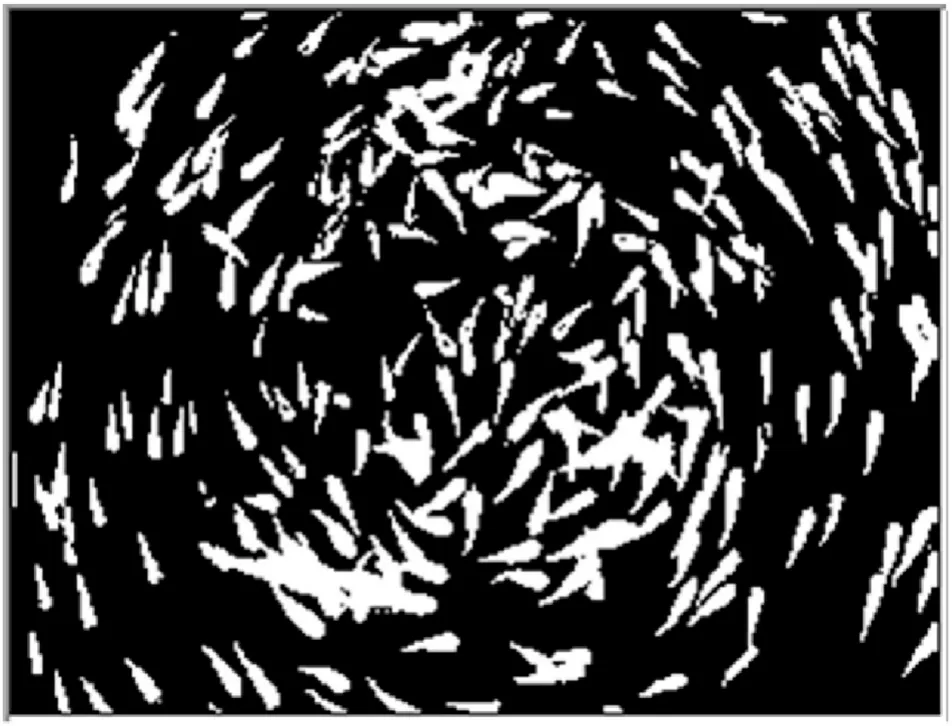
Fig. 7.After OSTU.

Fig. 8.Dilated image.
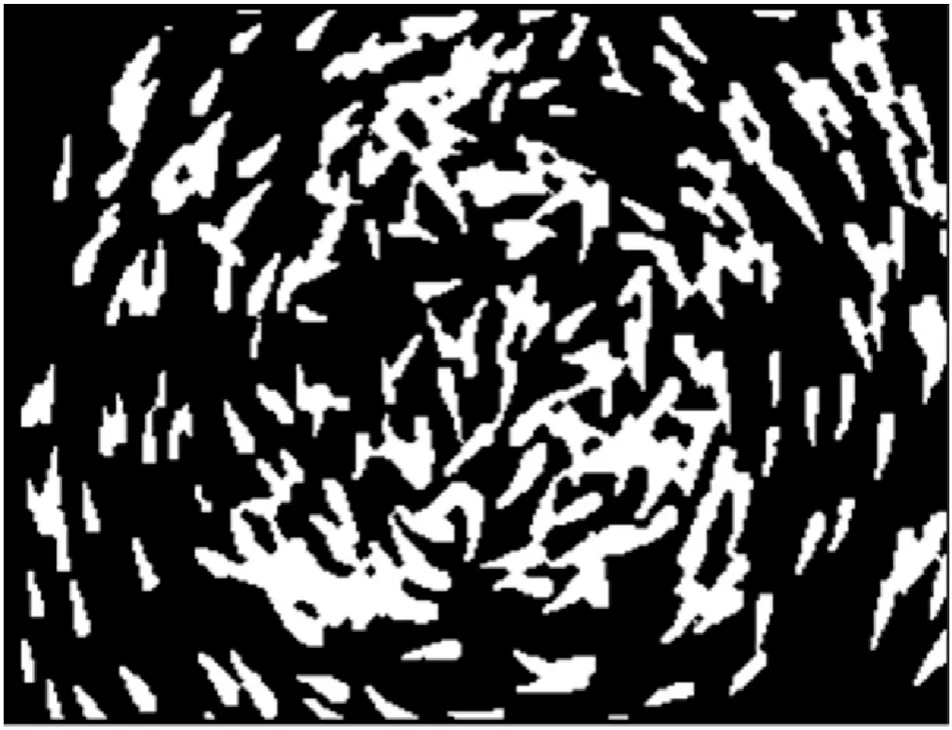
Fig. 9.Eroded image.
3.Fish counting algorithm
3.1.Connected area labeling algorithm
The pixel labeling algorithm is an effective method for extracting target characteristics commonly used in digital signal processing. In general, the algorithms used to extract the target characteristics include the pixel labeling algorithm and the run connectivity algorithm (Li and He, 2008). We used the pixel labeling algorithm which marks a binary image pixel to obtain the target features without any prior information.
The connected area labeling algorithm first marks all image data. If the image data is "255", the label value of the point is "1". If the image data is "0", the label value of the point is "0". Then, the binary image is scanned from left to right and from bottom to top. When the gray value of the pixel of the image data is "255", the mark judgement is performed,mainly to judge its eight neighborhoods. If the gray value of the left side,the lower left side, the lower side, and the lower right side is "0", it indicates the start of the new area, and the mark value is k at the point. If the same situation is encountered again next time, the image data pixel tag value is k-1. If at least one of the gray values of the left side, the lower left side, the lower side, and the lower right side of this point is not "0",query the marker value of the left side, the lower left side, the lower side,and the lower right side of the target point. Find their maximum value and assign the maximum value to the marker value of the target point.Then take down the marker value that is not "0" on the left side, the lower left side, the lower side, and the lower right side, and do the equivalent match with the marker value of the target point. Find the values on the left, lower left, lower, and lower right sides that are not "0",and change them to the marker value of the target point.
As shown in Fig. 10, p(i,j)represents the image data of the point, andp,(i,j)represents the marker value of the point, and the initial value is 1.When p(i,j)=255 and p(i,j-1), p(i-1,j-1), p(i-1,j),p(i-1,j+1)are all 0, the point is marked as k, namelyp,(i,j)=k, indicating the beginning of the new area, and the value of k is decremented by one each time the new area starts. When p(i,j)=255 and at least one of the values of p(i,j-1), p(i-1,j-1), p(i-1,j), p(i-1,j+1)is not 0, letp,(i,j)be the maximum value ofp,(i,j-1),p,(i-1,j-1),p,(i-1,j),p,(i-1,j+1). For example, the values ofp,(i,j-1),p,(i-1,j-1),p,(i-1,j),p,(i-1,j+1)are 2, 3, 4, and 5 respectively, andp,(i,j)=5. Letp,(i,j-1),p,(i-1,j-1),p,(i-1,j)andp,(i-1,j+1)which is not 0 be equivalently marked. In other words, the marker value that is 2, 3, or 4 should be 5.Then the labeling algorithm is completed.
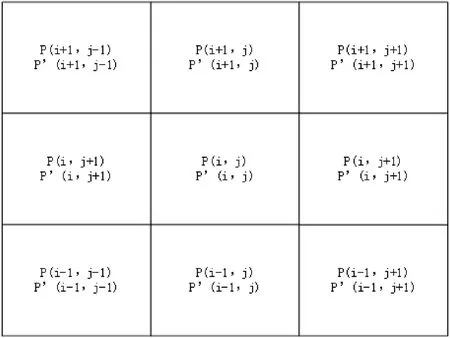
Fig. 10.Schematic diagram of connected area algorithm.
After the connected area labeling algorithm is completed, the target fry image data will be marked. We only need to count the number of different marker points and then set the parameters of the standard fry area. Compare this parameter with the number of marked points in each connected area of the statistics, and then determine the number of fry in the target area.
Of course, we can set a threshold of the area of the connected area to remove impurities. For example, when the connected area is less than 20 pixels, we do not count the fry in the connected area.
As shown in the test chart from Fig. 11, the white area represents the target fry. In the figure, there are 16 fry in theory, and the actual program output is also 16 with a correct rate of 100%, so the algorithm basically meets the requirements.
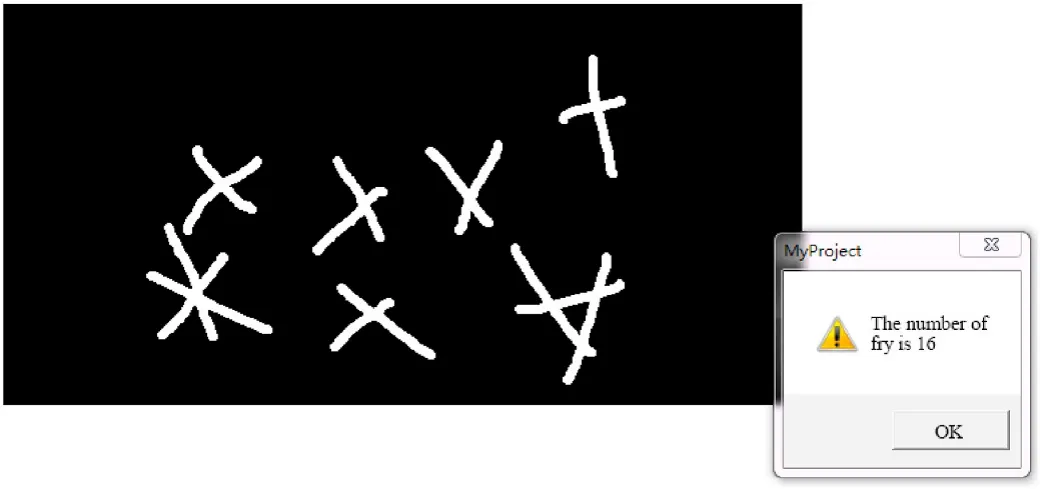
Fig. 11.Test chart.
3.2.Thinning algorithm
Thinning refers to the process of finding the skeleton or central axis of the target image while maintaining the original image topology,replacing the original image with a single-pixel skeleton, and eliminating redundant information in the image (Zhang and Qi, 2008).Thinning is a preprocessing method in image processing. It can reduce the redundant information of the original object while maintaining the shape information of the original object, and can quickly extract the image feature information. The effect of image thinning directly affects the effect of image processing in the future. The ideally thinned skeleton should be at the center of the original image and preserve the topology,connectivity, and detail of the original image.
A good thinning algorithm should satisfy the following conditions:
Convergence: Iterations must be convergent.
② Linkability: Does not break the connectivity of the lines.
③ Topological: Does not cause the gradual ingestion of the lines,maintaining the basic structural features of the original image.
④ Retention: Protects the detailed features of the meta image.
⑤ Re fineability: The width of the skeleton texture is 1 pixel, namely a single pixel width.
⑥ Axial: The skeleton is as close as possible to the centerline of the stripe.
The thinning algorithm can be divided into two categories depending on whether iterative operations are used:
Non-iterative algorithm: Generate skeleton once, such as distance transformation based method, run length coding re finement, etc.
② Iterative algorithm: The pixels whose image edges meet certain conditions are repeatedly deleted, and finally a single-pixel broadband skeleton is obtained.
According to the pixel inspection method of the iterative method, the thinning algorithm can be further divided into serial and parallel algorithms.
Serial algorithm: Whether the pixel to be deleted is fixed in the execution of each iteration. It depends not only on the result of the previous iteration, but also on the distribution of the processed pixel points in this iteration.
Parallel algorithm: Whether the pixel to be deleted is independent of the order in the pixel value image, which depends only on the result of the previous iteration.
In this paper, the fast Zhang parallel algorithm is used as follows:Endpoint fry counting:
The endpoint fry counting is based on the thinned fry image, and connected area labeling algorithm is used to find the number of endpoints in each connected area. The number of fry in each connected area is
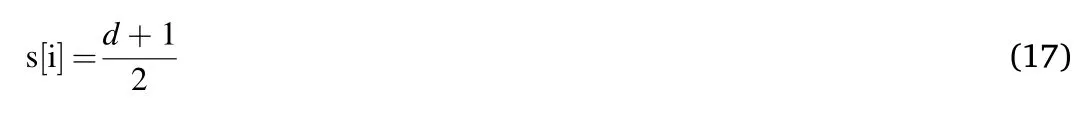
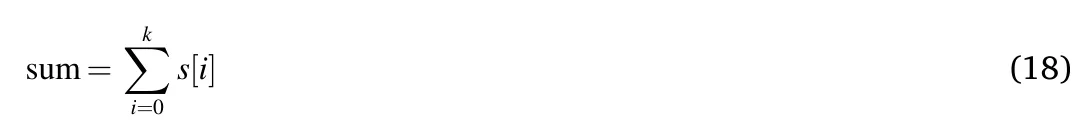
where s represents the number of fry in the connected area and d represents the number of endpoints in the connected domain. The total number of fry in the target image is
Of course, we can also remove impurities. When the number of pixels in the connected area is less than 5, we do not count the number of fry.
Fig. 12 shows the image of the fry before thinning (the white area in the figure represents the target fry). There are actually 16 fry in the figure. After the endpoint algorithm, the number of fry is 16 as shown in Fig. 12. The correct rate is 100%, which meets the requirements.

Fig. 12.Pre-thinning.
4.Results and discussion
4.1.The fry are connected end to end
Experimental results: Fig. 13a and b are the original images of the fry and the threshold after the segmentation. It can be clearly seen that there are 7 fry in the figure. Fig. 13c 13d are processed through a closed operation, namely the image after dilation and erosion. The image of the fry has not changed much, but some fish have been glued together.Fig. 14 is the diagram of the number of fry in the area algorithm, with 8 fry output.
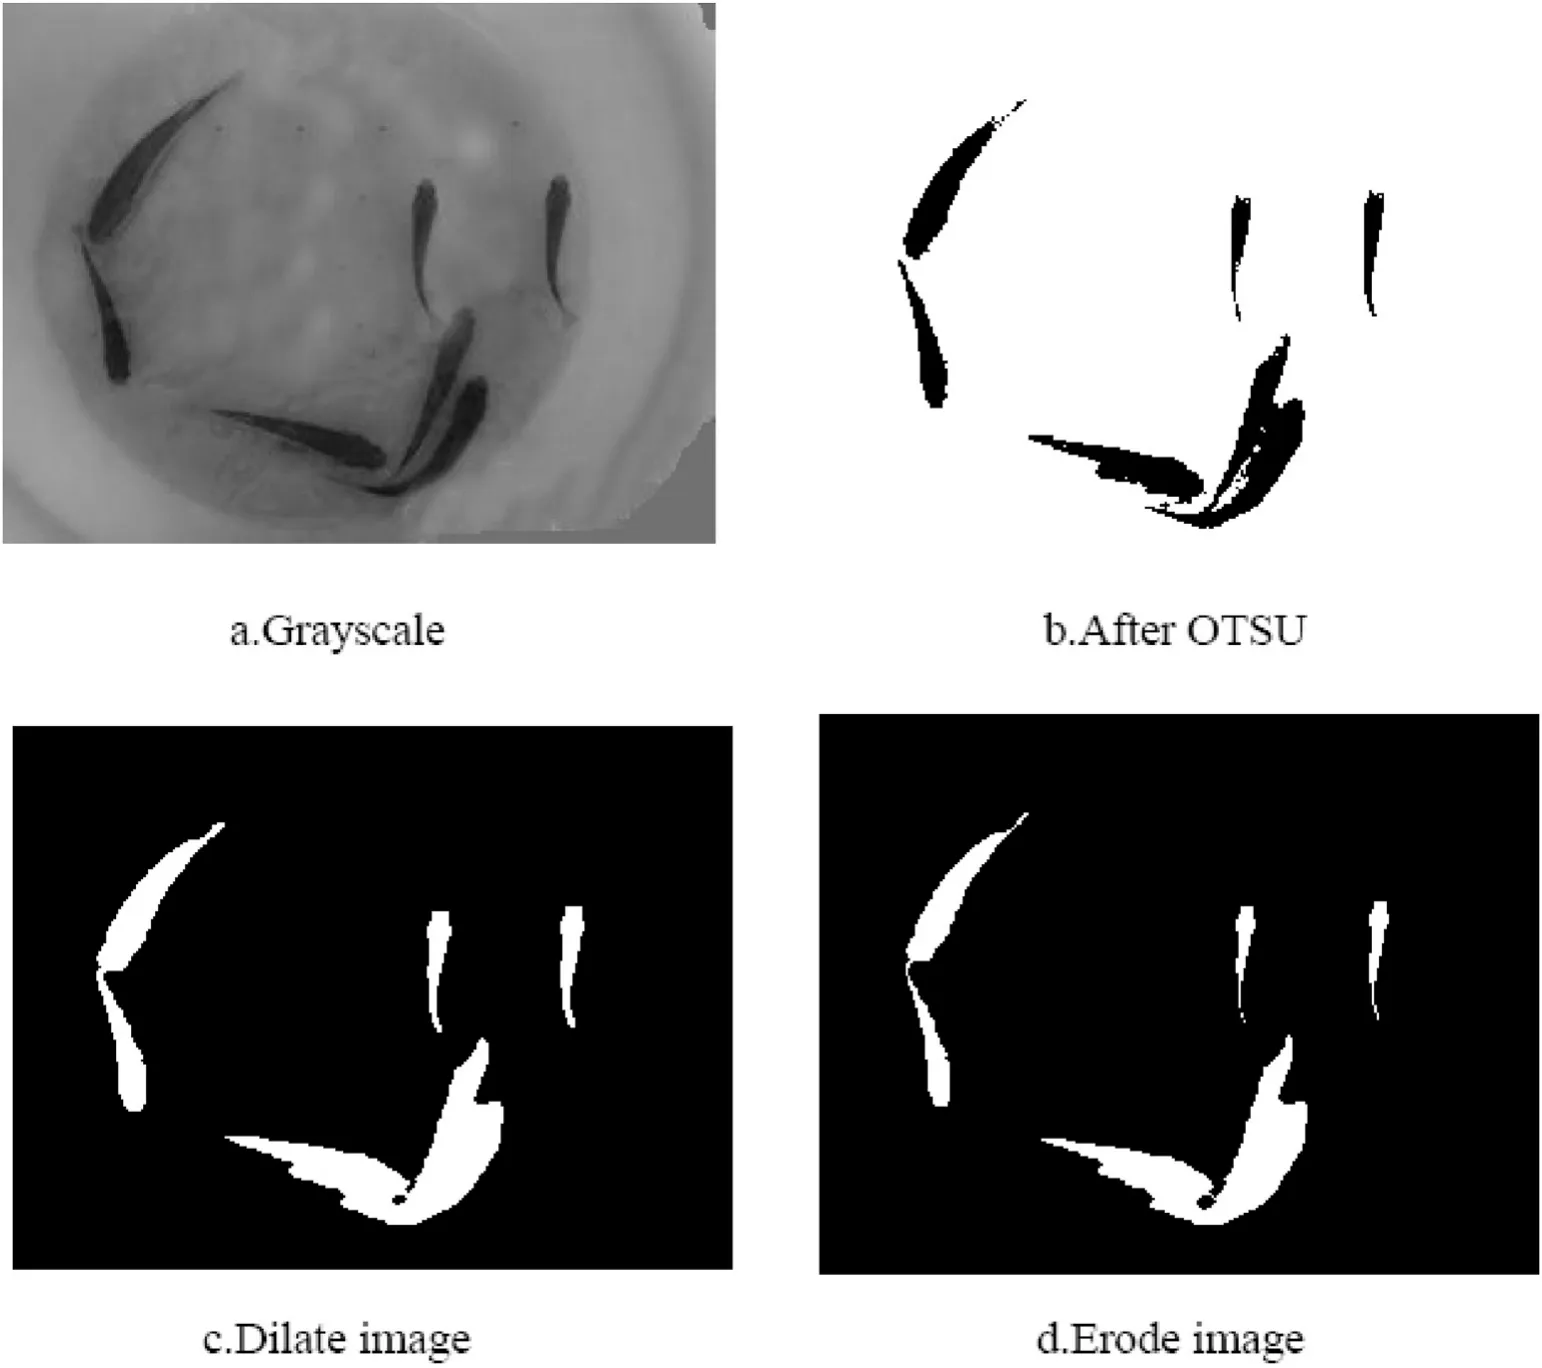
Fig. 13.Diagram of image processing process.
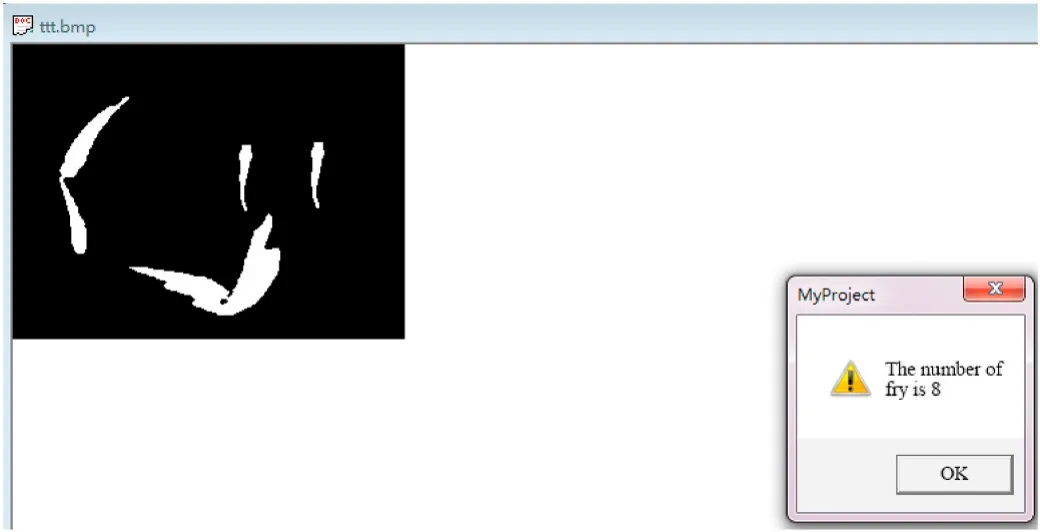
Fig. 14.Area algorithm.
Experimental analysis: The correct rate of fry counting based on the area algorithm was 85.7%, while the correct rate of fry counting based on the thinning algorithm was only 57%. Through this picture, we find that the area algorithm was better than the thinning algorithm. By comparing Fig. 13c and d, and 15, it can be seen that in Fig. 13c, two fry are connected end to end and the bottom three fry are connected end to side and side. Therefore, when the number is calculated by the thinning algorithm, only one line is displayed on the left side, resulting in the undercount of one fry, and only one line is displayed on the lower side,resulting in the undercount of two fish. The undercount of these three fish represents the number of errors. The error of the area algorithm comes from two aspects: First, the size of the fry is uncertain. We can observe the original picture (Fig. 13) and find that the size of the fry is uncertain, which is caused by the actual size of the fry and the shooting angle; second, fry adhesion can also lead to errors. As shown in Fig. 13c and d, we can find that the three fry on the lower side of the picture are stuck together, which produced the final error count.
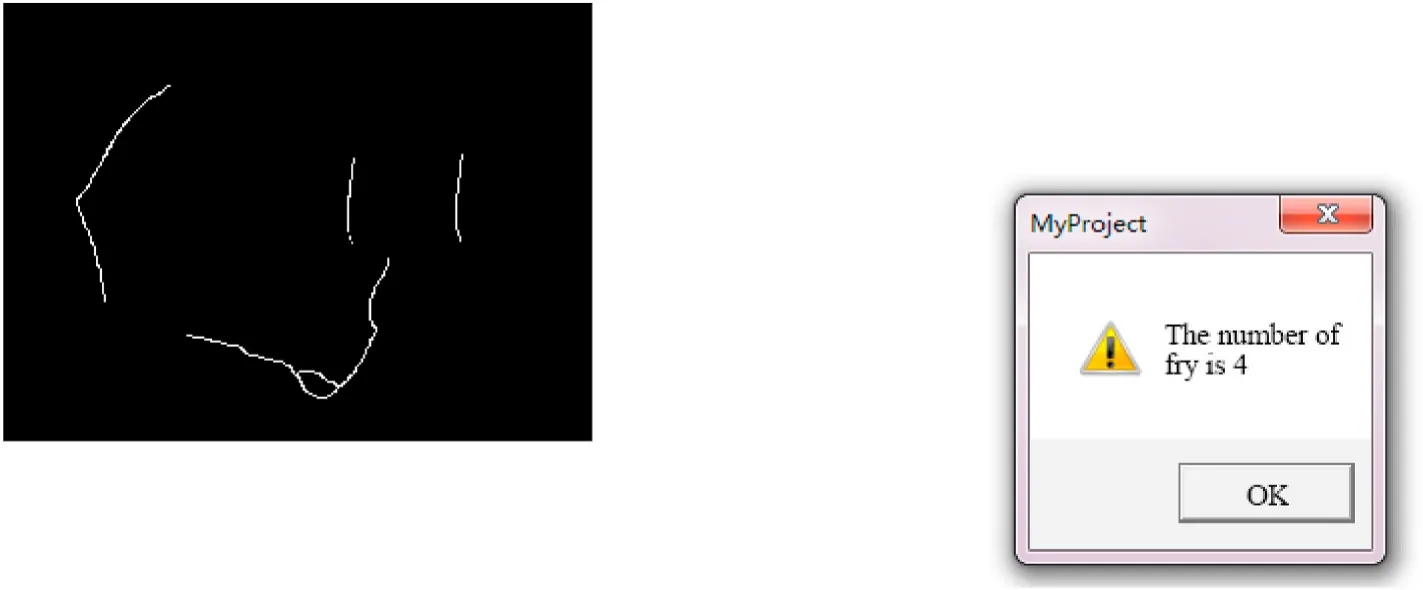
Fig. 15.Thinning algorithm.
Therefore, we can conclude that the correct rate of the area algorithm is higher than the thinning algorithm when the fry images are connected end to end or side to side after the image preprocessing.
4.2.Fry cross-adhesion
Experimental results: as shown in Fig. 16 and Fig. 17 below, there are 9 fry in both images and the threshold is well segmented. Fig. 18 shows the image of the fry using the area algorithm, revealing that the number of fry exported by the software was 9. Fig. 19 shows the image of the fry using the thinning algorithm and the number of fry output is also 9.
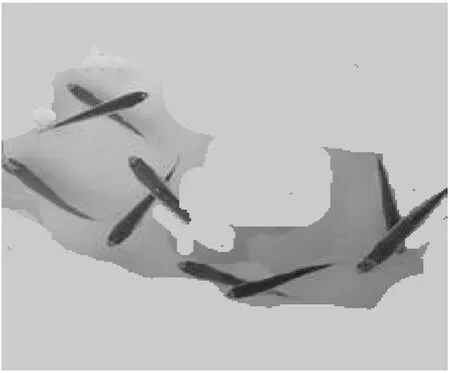
Fig. 16.Original image.
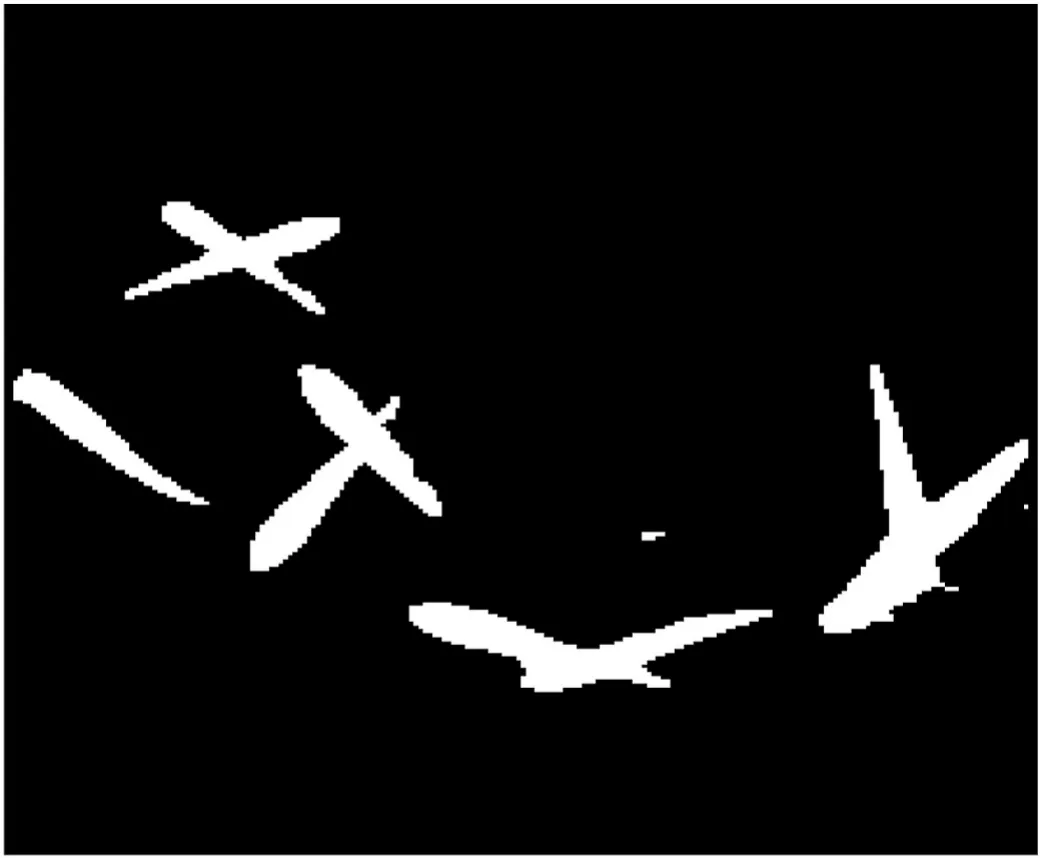
Fig. 17.After preprocessing.

Fig. 18.Area algorithm.
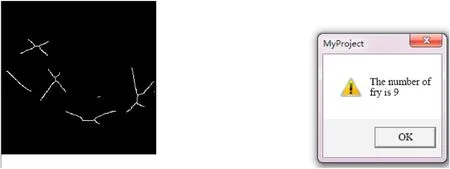
Fig. 19.Thinning algorithm.
Experimental analysis: The number of fry output by both algorithms is 9, which is equal to the actual quantity and the correct rate is 100%.However, only 2 fry are crossed at most in this example. So, we simulated a fry image with 13 fry crosses (Fig. 20). The black lines in the picture are defaulted to fry. Using the area algorithm (Fig. 21), it can be concluded that the number of fry is 12. The error was mainly due to the reduction in area due to the cross of the fry, resulting in the undercount of one fish. However, for the thinning algorithm (Fig. 22), the number of fry exported by the software is 13 and the correct rate is 100%.
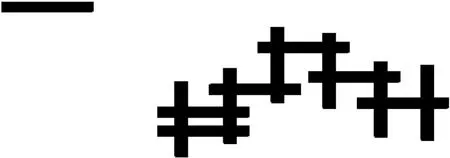
Fig. 20.Fry image of 13 fry crosses(simulated).
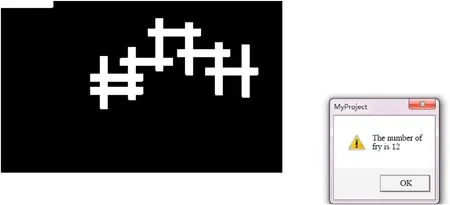
Fig. 21.Area algorithm.
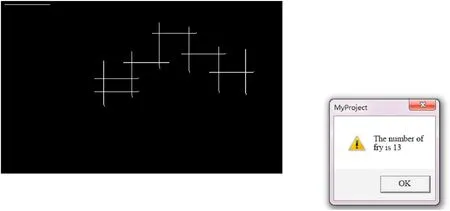
Fig. 22.Thinning algorithm.
5.Conclusions
We proposed a novel fry counting algorithm based on image processing technology. For the preprocessed fry image, the number of the fry was counted by the area algorithm and the thinning algorithm respectively, and the error analysis of the two algorithms was carried out under the condition that the fishtail cross-connected and the fry adhered to each other. Through a large number of experiments, the results showed that the more the fry were crossed, the lower the correct rate of the area algorithm was. In addition, the correct rate of the thinning algorithm will be much higher than that of the area algorithm. It provides a novel method to reduce the impact of high density and high overlap on fry counting.
CRediT authorship contribution statement
Jianfei Zhang: performed the experiments. Haitong Pang:conceived and designed the experiments. Weiming Cai: conceived and designed the experiments. Zhonghong Yan: were in charge of the results discussion.
Declaration of competing interest
The authors declare no confict of interest.
Acknowledgments
Research grants support from the Natural Science Foundation of China (No.31702393 & No.32073028), and Ningbo Public Welfare Key Project (No. 2019C10098).
 Aquaculture and Fisheries2022年4期
- Aquaculture and Fisheries的其它文章
- A review on fishing gear in China: Selectivity and application
- atg7 and beclin1 are essential for energy metabolism and survival during the larval-to-juvenile transition stage of zebra fish
- Association between single nucleotide polymorphisms of nLvALF1 and PEN2-1 genes and resistance to Vibrio parahaemolyticus in the Pacific white shrimp Litopenaeus vannamei
- Comparative analysis of the morphology, karyotypes and biochemical composition of muscle in Siniperca chuatsi, Siniperca scherzeri and the F1 hybrid (S. chuatsi ♀ × S. scherzeri ♂)
- Effects of salinity and alkalinity on fatty acids, free amino acids and related substance anabolic metabolism of Nile tilapia
- Differences in postembryonic dorsal fin development resulted in phenotypic divergence in two gold fish strains, Red Cap Oranda and Ranchu