
Effects of salinity and alkalinity on fatty acids, free amino acids and related substance anabolic metabolism of Nile tilapia
2022-08-08 10:24YameiChengJinliangZhaoChristianLarbiAyisiXiaoyingCao
Aquaculture and Fisheries 2022年4期
Yamei Cheng, Jinliang Zhao,*, Christian Larbi Ayisi,d, Xiaoying Cao
aKey Laboratory of Freshwater Fishery Germplasm Resources, Ministry of Agriculture and Rural Affairs, Shanghai Ocean University, Shanghai, 201306, China
bShanghai Collaborative Innovation for Aquatic Animal Genetics and Breeding, Shanghai Ocean University, Shanghai, 201306, China
cCenter for Research on Environmental Ecology and Fish Nutrition of the Ministry of Agriculture and Rural Affairs, Shanghai Ocean University, Shanghai, 201306, China
dDepartment of Fisheries and Aquatic Resources Management, Faculty of Natural Resources and Environment, University for Development Studies, Tamale, Ghana
Keywords:
Nile tilapia
Nutritional value
Flavor
Metabolism
Salinity
Alkalinity
A B S T R A C T
A 56-day experiment was conducted to investigate the effects of ambient salinity and alkalinity on fatty acids,free amino acids and related anabolic metabolisms of Nile tilapia. The fatty acid and free amino acid contents in the muscle of tilapia cultured in saline water (SW), alkaline water (AW), saline-alkaline water (SAW) and fresh water (FW) conditions were analyzed and compared. The mRNA levels and enzymatic activities of fatty acyl desaturase (FADS2), elongation of very long-chain fatty acids (ELOVL5), Δ1-pyrroline-5-carboxylate synthase(P5CS), ornithine-δ-aminotransferase (δ-OAT), and proline dehydrogenase (PDH) were also determined. The contents of saturated and monounsaturated fatty acids were significantly higher in the AW and SAW groups than those in the SW group, and those of eicosapentaenoic acid (EPA) and docosahexaenoic acid (DHA) were the highest in the SAW group. The contents of favor amino acids in the SAW and AW groups were significantly higher than that in the SW group, and that of proline in the SW, AW, and SAW groups was 3.58-, 4.11-, and 4.15-times higher than that in the FW group. The mRNA levels and enzyme activities of FADS 2, ELOVL5, PDH and P5CS were found to differ among the different groups. The results suggested that ambient salinity and alkalinity could effectively improve fesh quality of tilapia by regulating lipid and proline metabolism pathways.
1.Introduction
Fish fesh quality is a complex trait and one important characteristic in fish farming and processing (Hofmann, 1994). It is mainly determined by species genetic attributes, but also greatly affected by feed and feeding,and some environment factors in fish farming (Johnston et al., 2006;Larsson et al., 2012; Laesson et al 2014; Hu, Yun, Xue, Wang, Wu, & Zheng,2013). Ambient salinity is one important factor that affects the fesh quality of fish. Studies showed that total content of free amino acids(FAAs) and that of favor amino acids in the muscles ofChanna argusincreased with increasing salinity (Li, Li, Leng, & Wang, 2008), the total polyunsaturated fatty acids (PUFA), especially eicosapentaenoic acid(EPA) and docosahexaenoic acid (DHA), in the muscles ofLateolabrax japonicusincreased under the conditions of low salinity environments (Xu,Xu, Lin, Luo, & Bi, 2010). Moreover, significant differences were also reported in the fatty acid content in rainbow trout (Oncorhynchus mykiss)(Haliloǧlu, Bayır, Sirkecioǧ;lu, Aras, & Atamanalp, 2004) and Atlantic salmon (Salmo salar) (Krogdahl, Sundy, & Olli, 2004) cultured in marine waters in comparison to those cultured in freshwater.
After transferred into saline environments, euryhaline fish could maintain its normal physiological functions through osmoregulation(Hwang & Lee, 2007), which is achieved by some iron transporter proteins and enzymes in the gill, kidney, and intestine (Hiroi &Mccormick, 2012). Osmoregulation usually require a large amount of energy for ion transportation (Tseng & Hwang, 2008). Some studies have shown that non-essential fatty acids (NEFA) is the main composition in the lipid in fish (Imen et al., 2013; Wilson, 2003), which can provide enough energy for osmoregulation (Wilson, 1994; Sangiao-Alvarellos et al., 2003). Recently, a transcriptome and expression pro filing analyses showed that some genes involved in fatty acid and proline metabolism pathways changed dramatically in tilapia at different salinity (Xu et al., 2015), a similar result was reported inLeuciscus waleckiiunder alkaline stress (Chang et al., 2014).
The saline-alkaline water is one peculiar inland water type formed by long term evaporation, drought or less raining, which is generally characterized by high salinity, alkalinity, and pH values, etc. The saline--alkaline waters are detrimental for survival and growth of most freshwater fishes, which result in scarce biomass and hard to be used (Lei,Dong, & Shen, 1985; Wu, Zhao, Zhao, Luo, Wang, & Zhao, 2016; Zhao, Xu,& Sun., 2013). In China, there are about 99.13 million ha saline-alkaline land areas, mainly located in the north, northeast, and northwest regions of the country, however, these inferior land resources maybe transformed and became a huge potential for fisheries development. Since its high tolerance to harsh environments, tilapia had been successful cultured in saline-alkaline ponds built in the low wetlands along of the Yellow River(Li & Yue, 1996; Yuan, Zhu, & Liang, 2007), and some saline and alkaline waters in Hebei Province in 1990s (Zuo, Zhao, Wang, & Jin, 1990; Shen, X.H., Leng, S., & Zhang, S. G, 1995). Meantime, tilapia produced in saline and alkaline waters merited in some nutritional values (protein,protein-bound amino acid, fatty acid) and sensory and taste characteristics (chewability, hardness, and favor amino acid), in comparison to tilapia mostly cultured in freshwater in southern China (Cheng, Zhao,Song, Wu, & Zhou, 2020; Cheng, Zhao, & Tang, 2019).
In the saline-alkaline waters, fish not only need to maintain osmotic balance, but also to keep acid-base balance in bodies. Since different environmental factors may elicit different regulation mechanisms for osmotic and acid-base balance, their effects on the fesh quality and regulatory mechanisms need to be determined. Therefore, in this study,we focused on comparing the compositions of fatty acids and free amino acids in the muscles of tilapia cultured under different ambient salinity and alkalinity, and investigated two key enzymes (fatty acyl desaturase,FADS2, and elongation of very long-chain fatty acids protein 5, ELOVL5)in lipid metabolism and three key enzymes (Δ1-pyrroline-5-carboxylate synthase, P5CS, ornithine-δ-aminotransferase, δ-OAT, proline dehydrogenase, PDH) in proline metabolism in terms of mRNA expression and enzyme activities. The purpose of this study was to compare the effects of different environment factors (salinity, alkalinity) on the fesh quality and some related metabolism processes, which would provide a scientific basis for understanding of environmental modulation of fish fesh quality and development of saline-alkaline water fisheries.
2.Materials and methods
2.1.Fish for experiment
Nile tilapia juvenile was taken from the Tilapia Germplasm Station of Shanghai Ocean University, China. 180 juvenile fish with an initial weight of 50.00 ±4.12 g were selected, they were put into a circulating controllable aquarium tank (150 cm×120 cm×100 cm) for 2 weeks.
2.2.Experimental procedures
In this experiment, four experimental groups were set up, namely,saline water group (SW, salinity =12.0; pH =7.26), alkaline water group(AW, carbonate alkalinity =23.8 mmol/L; pH =8.52), saline-alkaline water group (SAW, salinity =12.0, carbonate alkalinity =23.8 mmol/L, pH =8.52), and fresh water group (FW salinity =0.3; carbonate alkalinity =1.4 mmol/L, pH =7.21), which was used as the control group. The range of salinity and alkalinity was set according to the previous results in our laboratory (Liang et al., 2014; Wu et al., 2016). Each group consisted of three repetitions, with 15 juvenile Nile tilapia in each tank (120 cm×60 cm×50 cm). Salinity solutions were prepared using sea crystals (produced by the Blue Coral Sea Crystal Processing Factory,China) and de-chlorinated filtered tap water and aerated for 24 h before use. Carbonate-alkalinity solutions were prepared using NaHCO3and de-chlorinated filtered tap water and aerated for 24 h before use. Salinity levels of the solutions were expressed in parts per thousand, carbonate alkalinity expressed in milimole per liter (mmol/L).
Sea crystal and NaHCO3were added daily to the set concentration of the water (Salinity was increased 4 per day using the sea crystal,alkalinity increased 8 mmol/L per day using the NaHCO3). These experimantal fish gradually adapted to the concentration range set by the experiment. During the period of the experiment, 12 h of daylight and 12 h of darkness were maintained; and water quality parameters were maintained within a suitable range for tilapia. Water temperature and dissolved oxygen averaged 24.3 ± 0.6°C and 6.0 ± 0.2 mg/L, respectively; ammonium, nitrite and nitrate averaged 0.06 mg/L, 0.05 mg/L and 55 mg/L respectively, during the experimental period. Fish were fed twice daily at 8:00 and 16:00 for 8 weeks. According to the feeding condition of the fish, the actual feed intake of each group was recorded in detail. The feces were removed daily by a siphon. The expanded special feed used in the experiment was produced by Tianbang Technology Co.,Ltd. (33.29% crude protein, 9.75% lipid, 5.38% ash, 15.82% moisture).The main raw materials were: fish meal, soybean meal, rapeseed meal,wheat four, secondary meal, fish oil, vitamin and mineral, etc.
2.3.Sample collection
The trial ended after 8 weeks of culture. Feed was withheld from fish 24 h before sampling. 15 fish were randomly taken in each group ( five samples per tank) and euthanized with an overdose of tricaine methane sulfonate at 100 mg/ L (MS-222). Sampled fishes were thoroughly washed with clean water and then descaled, their back muscle and liver tissues were removed aseptically, and then blotted dry with filter paper.The muscle and liver tissues were then cut into small pieces with sterile scissors, and pack into sealed pockets. The fatty acid and amino acid contents of muscle samples were determined firstly, the remaining muscle and liver samples were stored at -80°C for RNA extraction and antioxidant enzyme activity analysis.
2.4.Growth performance
Weight gain (WG) = final weight (FW) (g) - initial weight (IW) (g);Specific growth rate (SGR) (%) =(ln FW (g) - ln IW (g))/T ×100. T stands for total number of culture days; Feed conversion ratio (FCR) =FI(g)/WG (g); Feed intake (FI) is the average total feed consumed (g) per fish during the 56 days trial.
2.5.Measurement of fatty acid and free amino acid
2.5.1.Fatty acid
The proximal compositions of muscle of experimental fish samples were determined according to the methods previously descibed (Ayisi,Zhao, Hua, & Apraku, 2018). Before the assay was performed, the muscle was gronded to powder separately. The total lipid (TL) was extracted from freeze-dried samples with chloroform-methanol (2:1,V/V). Fatty acid methyl esters (FAME) were prepared by transesterification with 0.4 mol/L KOH methanol, and then detected by gas chromatograph (GC-7890 A, USA) using methyl heneicosanoate (C21:0)as the internal standard. Fatty acid content was determined using the normalization method (Folch, 1957). All measurements were performed in triplicates and the fatty acid content was expressed as g/kg.
2.5.2.Free amino acid
Sykam s-433 d automatic amino acid analyzer was used to determine the amino acids contained in the muscles following pre-treatment of the samples. In brief, 2 g of fresh muscle was taken and added to 15 mL of 5% trichloroacetic acid (TCA) and homogenized for 2 h. The homogenized samples were centrifuged at 12000 r/min for 10 min. 5 mL of the supernatant was then extracted and the pH adjusted to 2.0 using 1 mol/L NaOH solution. The extracted supernatant was then rocked to 10 mL, and filtered with 0.22 μm filter membrane and then detected by Sykam s-433 d automatic amino acid analyzer. Free amino acid content expressed as mg/kg.
2.6.Enzyme activities
Enzyme activities of Δ6 FAD, ELOVL 5, δ-OAT, P5CS and PDH were measured using enzyme linked immunosorbent assay (ELISA). A ground glass homogenizer was used to homogenize liver and muscle (0.5-1.0 g)on ice. The homogenates were centrifuged (11,000 rpm, 45 min at 4°C),and the clear phase between the top layer and the pellets used for the analysis. Samples were analyzed in 96-well plates by ELISA (Shanghai MLBIO Biotechnology Co. Ltd, China). Optical density (OD) was measured in an ELISA microplate reader (Bio Tek Synergy, USA) at 450 nm. According to the manufacturer’s instructions, a standard curve was generated and the standard diversity calculated using Excel 2003. Enzyme activity units (IU), de fined as moles of substrate converted to product per minute at assay temperature, were expressed per mg of hepatic soluble protein specific activity or per gram of liver or muscle tissues wet weight.
2.7.RNA extraction and real-time quantitative polymerase chain reaction(RT- qPCR)
For each group, 5 fish were extracted from each parallel group as a mixed sample. Expression analysis of FADS 2, ELOVL 5, δ-OAT, P5CS and PDH were performed using real-time PCR. Nucleotide sequences of the primers used to assay gene expression are shown in Table 1. The stability and suitability of β-actin as reference genes were con firmed by generating an expression stability measure “M” for the reference gene using the calculations outlined in Vandesompele et al. (2002). Total RNA was extracted from the livers and muscle using TRIZOL Kit (Invitrogen, Carlsbad, CA, USA) following manufacturer instructions. The concentration and quality of RNA were determined through absorbance measurements (ratio 260/280 and 260/230).The RNA samples were digested by RNase-free DNase I (TaKaRa Biotechnology Co., Ltd., Shanghai, China) to remove possible genomic DNA contamination. Next, RNA was transcribed into cDNA using M-MLV reverse transcriptase. Real-time PCR was conducted on a Mini Option Real-time PCR machine (Bio-Rad, Her-cules, CA, USA). The 20 μL reaction contained 1 μL cDNA sample, 10 μL SYBR green I Master Mix (TaKaRa), 0.5 μL of each primer and 8 μL deionized water.
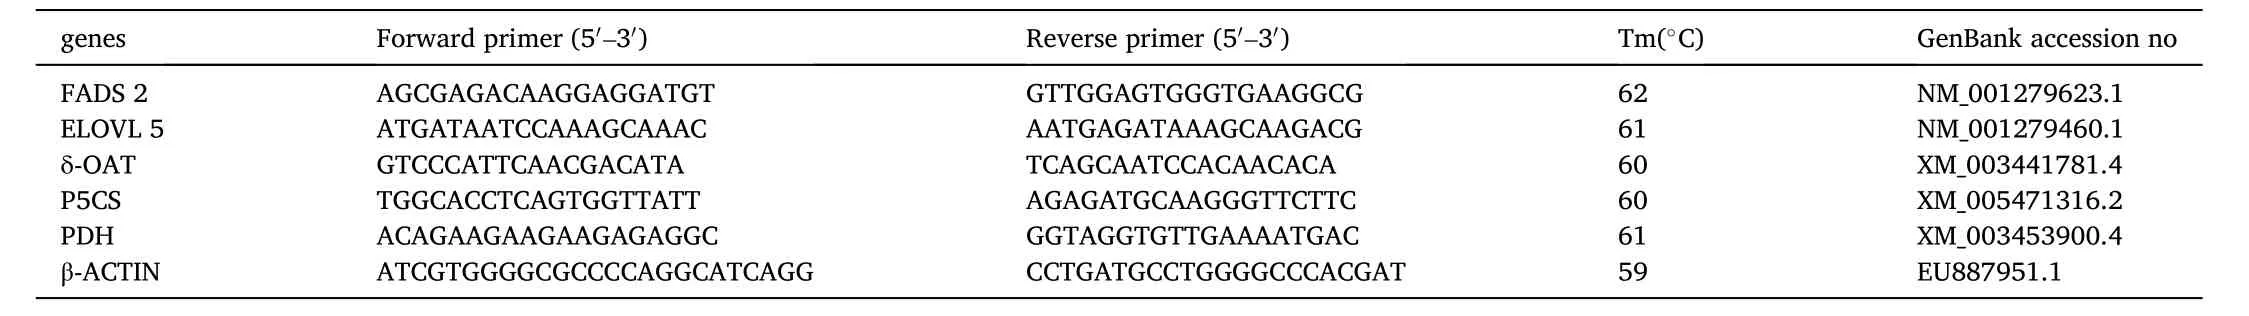
Table 1Nucleotide sequences of the primers used to assay gene expression by real- time PCR.
PCR amplification was performed in triplicate wells using the following protocol: 3 min at 95°C, 45 cycles at 95°C for 10 s, 15 s at 62°C and 25 s at 72°C. A melting curve analysis was performed to con firm that a single PCR product had been amplified. Approximately, there was an equal amplification efficiency for all genes ranging between 95% and 99.3%. The relative mRNA levels of these genes in each sample were normalized to the control gene (β-actin) using the 2-△△CTmethod (Livak & Schmittgen, 2001). The transcript level was described in terms of its relative concentration (RC target/RC control). Triplicates of each reaction were performed for each sample.
2.8.Statistical analysis
All data were reported as mean ±standard error of the mean (SEM). All data were analyzed by one-way analysis of variance using SPSS 19 software.Differences were considered significant at 0.05 probability level for all data.When the difference was significant (P <0.05), Student-Newman-Keuls was performed for identifying homogeneous subsets.
3.Result
3.1.Effect of salinity and alkalinity on growth performance and feed utilization of muscle in Nile tilapia
The results on growth performance and feed utilization were shown in Table 2. There was no mortality during feeding trial. After 56 days of feeding, the differences of the final weight (FW) and weight gain (WG)between the experimental groups (SW, AW, SAW) and the control group(FW) were not significant (P >0.05). There was no significant difference for specific growth rate (SGR), feed conversion ratio (FCR) and feed intake (FI) (P >0.05) among different groups.
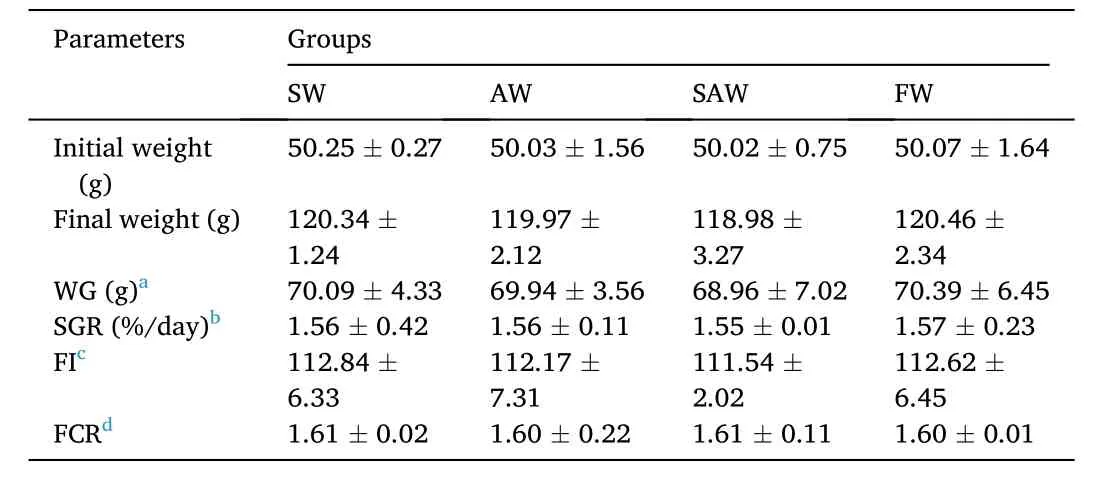
Table 2Effect of salinity and alkalinity on growth performance and nutrient utilization of muscle in Nile tilapia at different groups.
3.2.Effect of salinity and alkalinity on fatty acid composition of muscle in Nile tilapia
Fatty acid composition and content in muscle of Nile tilapia at different treatment groups were shown in Table 3. A total of 17 fatty acids were detected. Five saturated fatty acids (SFA) namely C12:0,C14:0, C16:0, C18:0 and C20:0 were detected. The total SFA ranged from 303.905 to 332.85 g/kg with C16:0 being the highest, followed by C18:0 (49.05-49.71 g/kg). Also, four monounsaturated fatty acids(MUFA) were detected and the total ranged from 324.81 g/kg to 353.7 g/kg. Among the MUFA, C18:1n-9 was the highest (215.12-237.35 g/kg). With respect to the eight PUFAs recorded, C18:2n-6 was the highest,which ranged from 133.14 to 133.82 g/kg, followed by C22:6n-3 (DHA)which ranged from 35.54 to 49.10 g/kg.
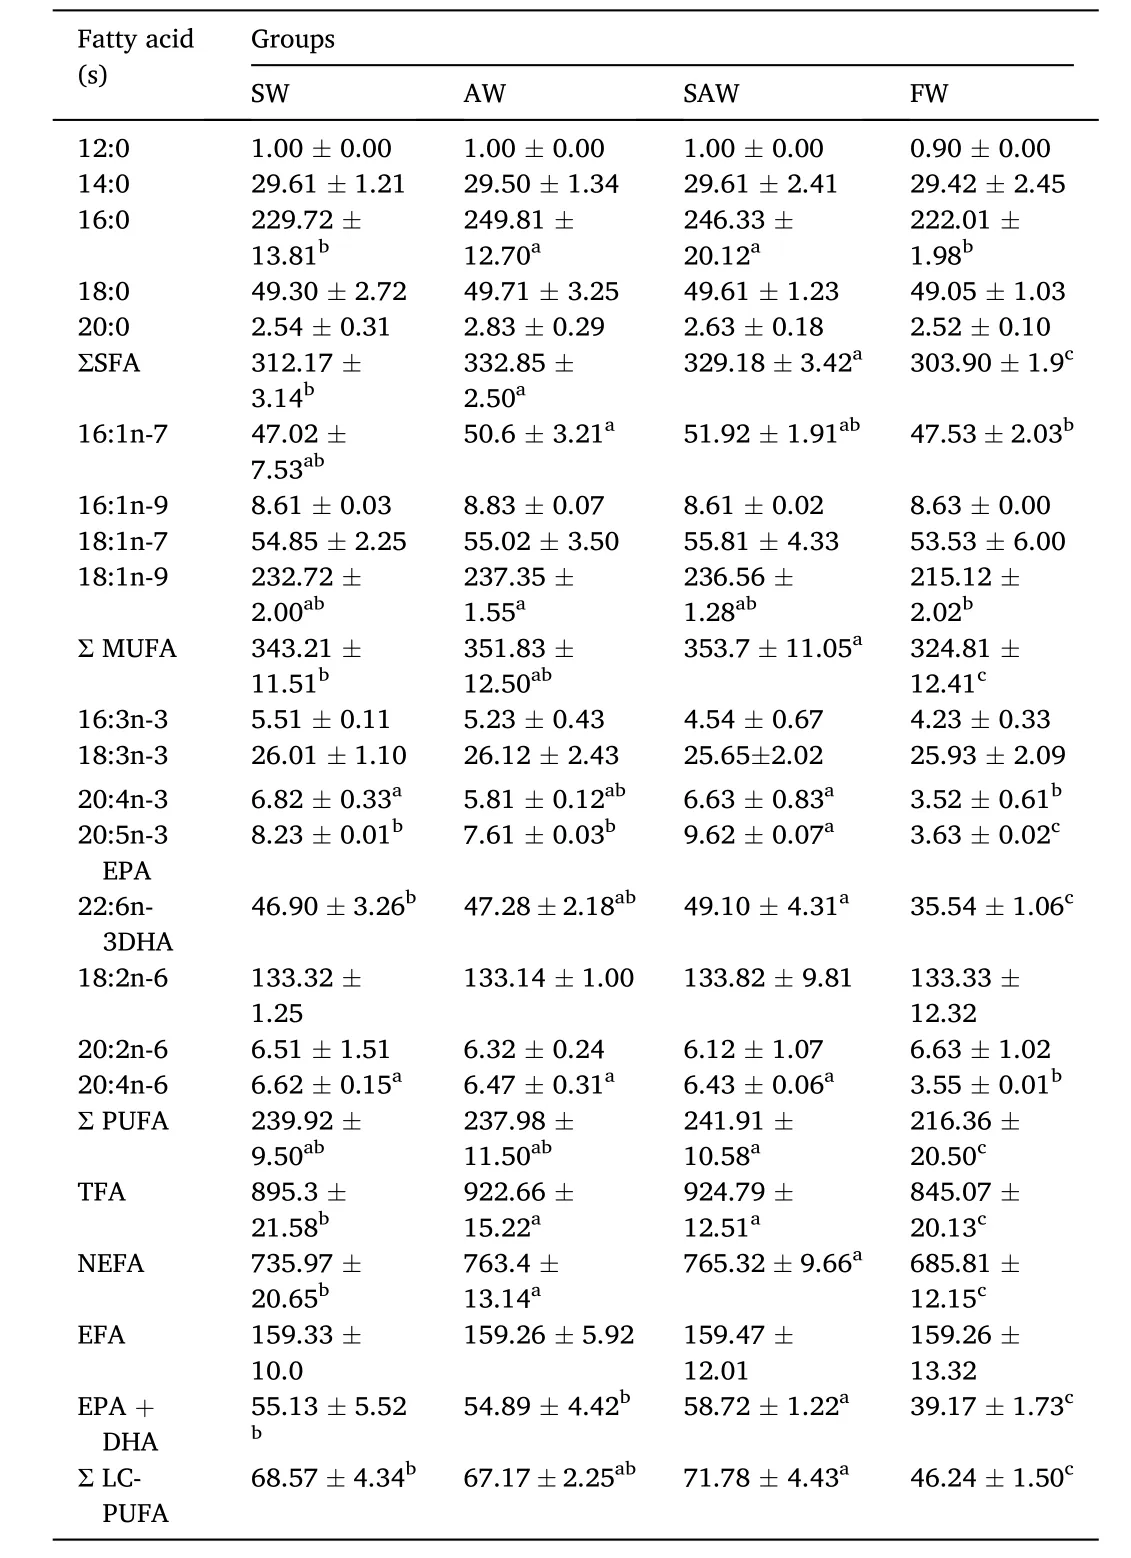
Table 3Fatty Acid composition and content of muscle in Nile Tilapia at different treatment groups (g/kg).
The results showed that the saline and alkaline of the water could affect the fatty acid composition of tilapia muscle in comparison to the freshwater group. Among the treatment groups, SFA and MUFA in the AW and SAW groups were significantly higher than those in the SW group (P <0.05). The content of PUFA in SW, AW and SAW groups were significant higher than that in FW group (P <0.05). The PUFA contents were slightly different among the three treatment groups, but the difference was not statistically significant (P >0.05). The total amount of C20:5n-3 EPA and C22:6n-3 DHA in SAW group was significantly higher than that in SW and AW groups (P <0.05). The total amount of LC-PUFA in SAW, AW and SW groups were significantly higher than that in FW group, and SAW group was significantly higher than SW and AW groups (P <0.05). The total amount of non-essential fatty acids (NEFA) in SAW, AW and SW groups were significantly higher than that in FW group (P <0.05). The NEFA content was the lowest in FW group, and the highest in the SAW group.
3.3.Effect of salinity and alkalinity on free amino acid composition of muscle in Nile tilapia
The effect of salinity and alkalinity on free amino acid content of the muscle of Nile tilapia is shown in Table 4. A total of 16 free amino acids were detected, the contents of favor amino acids and total free amino acids in muscle were affected by salinity and alkalinity. The contents of glutamic acid (84.5 mg/kg) and aspartic acid (32.4 mg/kg) were recorded the least in the FW group. The glutamic acid content in AW and SAW groups was significantly higher than that in the SW group(P <0.05), while aspartic acid content in AW group was significantly higher than that in SW and FW groups. Glycine content ranged from 359.9 mg/kg to 501.3 mg/kg. The contents of glycine and alanine were recorded the highest in SAW group. Arginine and leucine contents in FW group were significantly lower than those in AW and SAW groups (P <0.05).The favor amino acids (Glu, Gly, Ala, Asp, Lys, Ser, Pro) changed greatly, the proline content in SW, AW, and SAW groups was 3.58-, 4.11-, and 4.15-times higher than that in FW group, respectively.
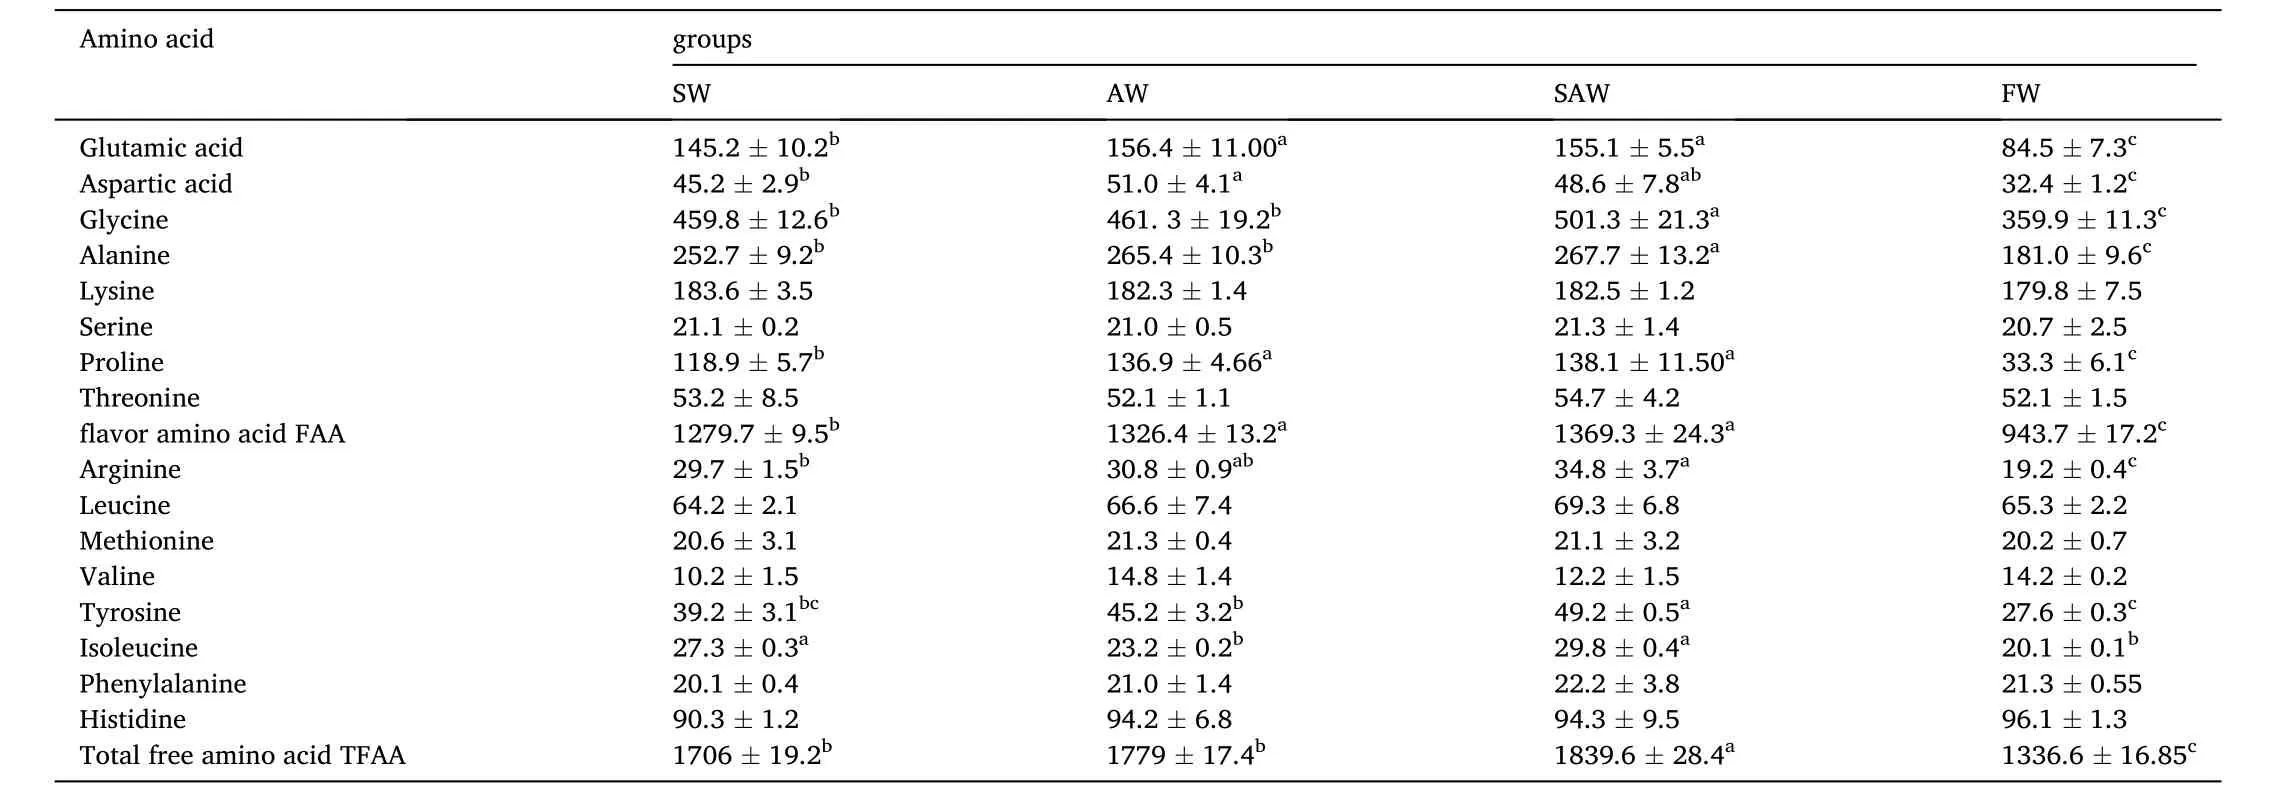
Table 4Free amino acid content of muscle in Nile Tilapia at different treatment groups (mg/kg).
In general, the contents of favor amino acid (FAA) and total free amino acid (TFAA) in the muscle of Nile tilapia increased under the saline and (or)alkaline water. The contents of FAA in SAW and AW groups were signi ficantly higher than that in SW group (P <0.05), the TFAA content in SAW group was significantly higher than that in SW and AW groups (P <0.05).
3.4.Effects of salinity and alkalinity on lipid metabolism enzyme activity and gene expression in Nile tilapia
The effects of salinity and alkalinity on lipid metabolism related enzymes and genes expression were shown in Table 5 and Fig. 1. The enzyme activity of Δ6 FAD ranged from 43.63 U/L to 66.15 U/L with the least value recorded in FW group. The enzyme activity of Δ6 FAD in SAW was significantly higher than that in SW and AW (P <0.05). Also, activity of ELOVL 5 ranged from 106.54 U/L to 159.7 U/L, with SAW group significantly higher than AW and AW groups (P <0.05) (see Fig. 2).
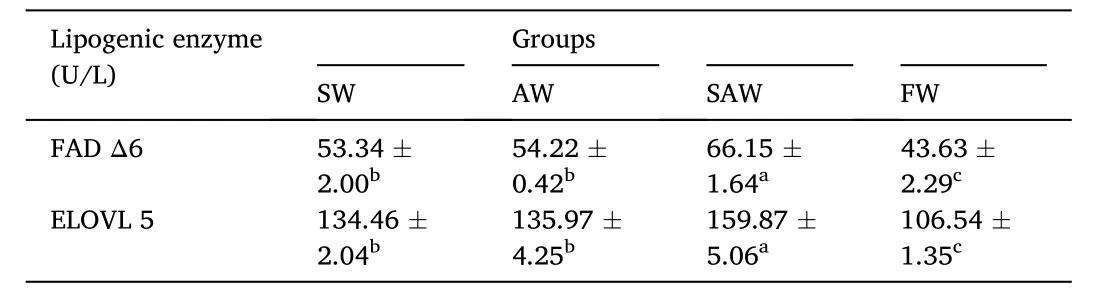
Table 5Enzyme activity of lipid metabolism enzyme of liver in Nile tilapia at different groups (U/L).
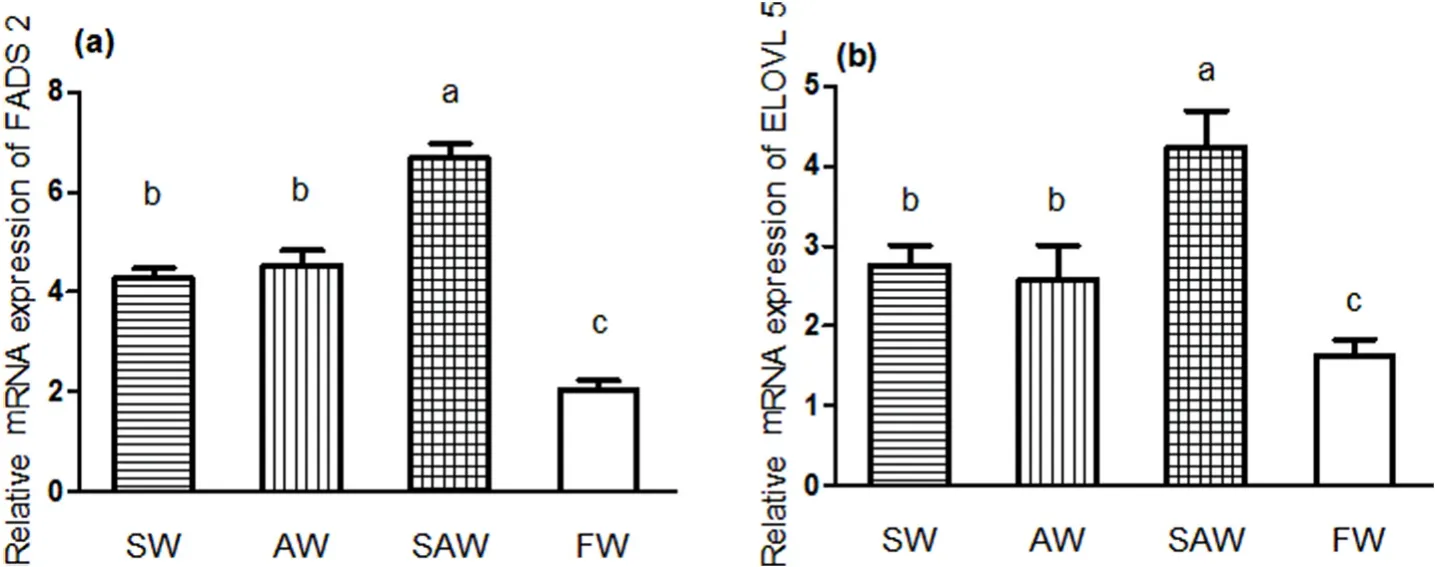
Fig. 1.Real- time PCR gene expression pro files of (a) FADS 2 and (b) ELOVL 5 in liver of Nile tilapia at different treatment groups. Values are expressed relative to βactin and are presented as means ± SEM (n =3); Different letters indicate significant differences among different treatment groups (P < 0.05).
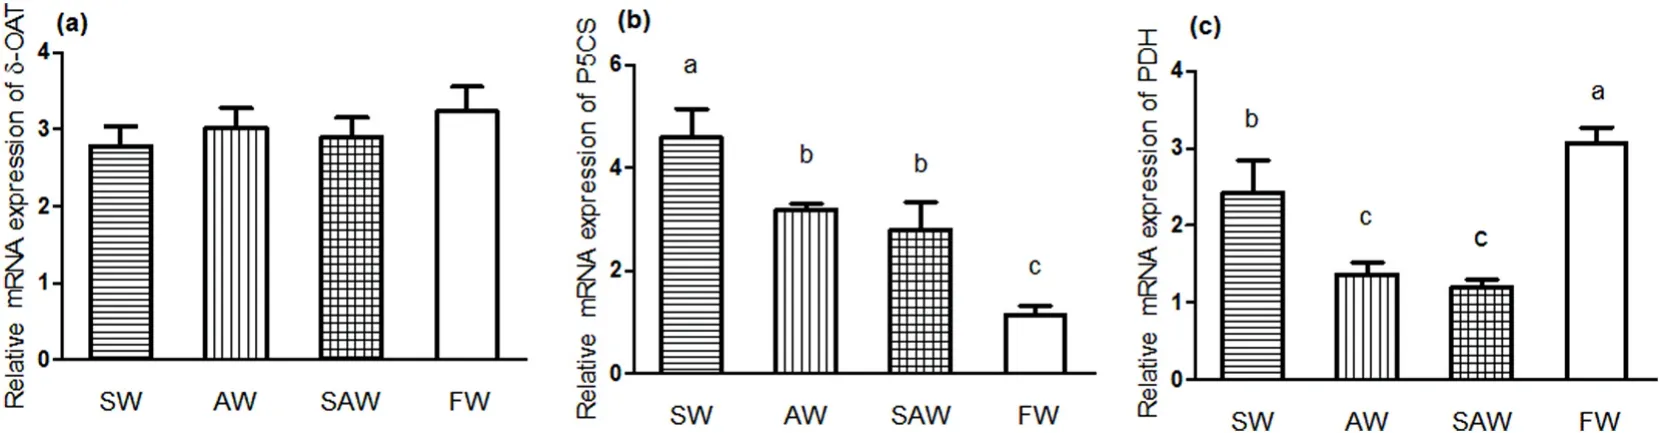
Fig. 2.Real- time PCR gene expression pro files of (a) δ-OAT, (b) P5CS and (c) PDH in muscle of Nile tilapia at different treatment groups. Values are expressed relative to β- actin and are presented as means ± SEM (n =3); Different letters indicate significant differences among different treatment groups (P < 0.05).
The mRNA expression levels of both FADS 2 and ELOVL 5 were upregulated in SW, AW and SAW groups (Fig. 1). FADS 2 and ELOVL 5 mRNA expression levels in the SAW group were significantly higher than those in the SW and AW groups (P <0.05).
3.5.Effects of salinity and alkalinity on proline metabolic enzyme activity and gene expression in muscle of Nile tilapia
The enzyme activities of δ-OAT, P5CS and PDH were shown in Table 6.The enzyme activity of δ-OAT in SW, AW and SAW groups decreased.Enzyme activities of P5CS and PDH were affected by the different environments. P5CS activity in SW group was recorded as 89.87 U/L, and was significantly higher than that in AW and SAW groups (P <0.05), the least value was recorded in FW group. PDH activity in the FW group was recorded as 36.58 U/L, and was higher than that in all treatment groups, PDH activity in AW and SAW groups was significantly lower than that in SW group (P <0.05).
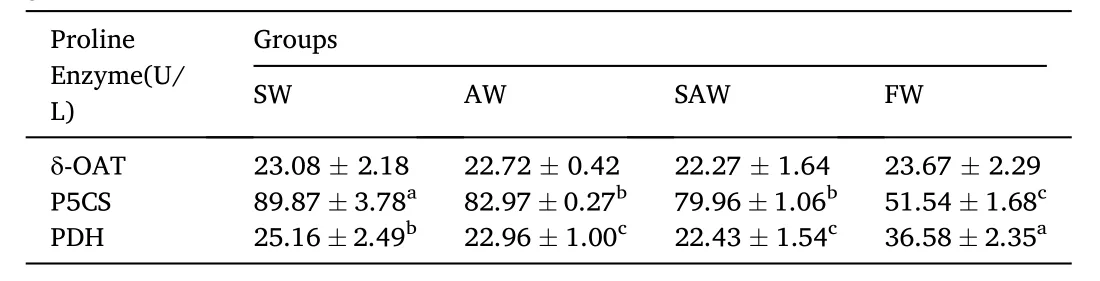
Table 6Enzyme activity of proline metabolism of muscle in Nile tilapia at different groups (U/L).
The expression level of δ-OAT in SW, AW and SAW groups were slightly lower than that in FW group, but the difference was not statistically significant (P >0.05). The expression levels of P5CS in SW, AW and SAW groups were up-regulated and were significantly higher than that in FW group (P <0.05), expression levels of P5CS in SW group was higher than those in AW and SAW group (P <0.05). Expression levels of PDH in SW, AW and SAW group were down-regulated and were significantly lower than FW group, PDH mRNA expression in SAW and AW groups were significantly lower than that in SW group (P <0.05).
4.Discussion
4.1.Effect of salinity and alkalinity on the content of fatty acids and free amino acid in the muscle of Nile tilapia
The contents of unsaturated fatty acid (UFA) in muscle refect the fesh nutritive values and healthcare conditions. Polyunsaturated fatty acid (PUFAs) such as C20: 5n-3 (EPA) and C22: 6n-3 (DHA), are closely related to human health and considered as essential fatty acids in the growth and development of humans and animals (Zhang et al., 2012). It has been reported that the saline water can regulate the fatty acid composition in muscle of fish and can improve the fesh quality. Zeng,Lei, Liu, Hong, and Ai (2014) reported that the contents of MUFA and PUFA in the muscles of juvenile turbot (Scophthalmus maximus) at a 12ppt salinity were significantly increased with respect to those at the 30 g/L salinity (Zeng et al., 2014). In this experiment, the salinity and alkalinity of water could affect the fatty acid composition and content in the muscle of tilapia, the contents of PUFA in SW and AW and SAW groups were significant higher than that in FW group (P <0.05) and the contents of PUFA were slightly different among the three treatment groups, but the difference was not statistically significant (P >0.05).However, the amounts of EPA +DHA in the SAW group were signi ficantly higher than that in the SW and AW groups (P <0.05). These results demonstrated that the salinity and alkalinity of water could improve the nutritional value of fatty acids of tilapia, and the effect was more significant when the fish were exposed to a combination of saline and alkaline water. This result was similar to the higher content of fatty acids reported in the muscles ofLeuciscus waleckiiexposed to high salinity-alkalinity levels (Chang et al., 2014). The differences among the treatment groups could result from the fact that fish in the SAW groups not only regulate the osmotic pressure but also need to maintain their acid-base balance. Meantime, there was no significant difference on amounts of EPA +DHA between AW group and SW group in this study,though their osmoregulation process were different. At the different treatments, tilapia could either synthesize large amounts of EPA and DHA in the body or store EPA and DHA from the consumed food, which accounted for a relative increase of EPA and DHA contents.
Although the content of free amino acids in the muscle is low (), it has an important contribution to the muscle favor of fish products. Free amino acids contribute directly to taste, and also participate indirectly in favor development (Bermúdez, Franco, Carballo, Sentandreu, & Lorenzo, 2014). Glutamic acid, aspartic acid, glycine, alanine, serine, and proline were the major form of amino acids with favor (Park, Watanabe,Endoh, Watanabe, & Abe, 2002). In this experiment, except for Ser, Lys,and Thr, the contents of other favor amino acid (Glu, Asp, Ala, Gly, and Pro) were significantly improved (P <0.05) in the SW, AW, and SAW groups. Among these, the content of Pro was changed at the most in the SAW, AW, and SW groups, it was 4.15-, 4.11-, and 3.58-times of that in the FW group, respectively. The favor amino acid content of muscle in the SAW and AW groups was significantly higher than that in SW group(P <0.05), indicating that both salinity and alkalinity could improve the favor of tilapia, the effect of alkalinity on favor was more obvious.
4.2.Effects of salinity and alkalinity on LC-PUFA anabolism of Nile tilapia
In fish, long chain polyunsaturated fatty acids (LC-PUFA) were typically synthesized from their 18-carbon polyunsaturated fatty acids(PUFA) precursors by fatty acid delta-6-desaturase (Δ6 FAD and Δ5 FAD) and elongation of very long-chain fatty acids enzyme (ELOVL2 and ELOVL5) (Sarker et al., 2011; Xie et al., 2015; Zheng, Tocher, Dickson, &Bell, 2004). Previous studies showed that the expression levels of related genes involved in LC-PUFA synthesis, such as Δ6/Δ5 FAD, Δ4 FAD,ELOVL 5, and PPAR γ, were higher in the liver ofS. canaliculatusexposed to low salinity condition (Zheng, 2007). In anin vitroexperiment, no LC-PUFA synthesis was detected in cells ofChirostoma estorisolated from the freshwater group, whereas its synthesis occurred in the isolated cells of fish from the seawater group (Fonseca-Madrigal, Martínez-Palacios,Rodríguez, & Tocher, 2012). Although tilapia converted LNA in a diet rich in certain vegetable oils into LC-PUFA (Olsen, Henderson, &McAndrew, 1990), its limited LC-PUFA synthesis ability resulted in a significant decrease of LC-PUFA content, and affected the fesh quality of fish (Bahurmiz & Ng, 2007; Teoh & Ng, 2016). In this experiment, the mRNA expression levels of FADS 2 and ELOVL 5 were up-regulated in SW, AW and SAW groups. FADS 2 and ELOVL 5 mRNA expression levels in the SAW group were significantly higher than those in the SW and AW groups (P <0.05). Theses indicated that both FADS 2 and ELOVL 5 were affected at the transcriptional level by salinity and alkalinity. The enzymatic activities of Δ6 FAD and ELOVL 5 in the SAW group were significantly higher than those in the SW and AW groups (P <0.05),indicating that Δ6 FAD and ELOVL 5 played an important role in the accumulation of LC-PUFA under salinity-alkalinity environments., these enzymes performances were consistent with the changes of the total content of EPA +DHA in muscle. We speculated that tilapia accumulated LC-PUFA in the muscles by regulating the synthesis, oxidation, and transport of fatty acids in the liver in responsing to salinity and alkalinity. The results suggested that the synthesis ability of LC-PUFA in tilapia was improved in saline and alkaline environments.
4.3.Effects of salinity and alkalinity on the anabolism and catabolism of proline
Free amino acids (FAAs) are often referred to as “compatible osmotic substances” (Hosoi, Kubota, Toyohara, Toyohara, & Hayashi, 2010), and play an important role in osmotic pressure regulation as regulatory factors(Hoyaux, Gilles, & Jeuniaux, 1976). Muscle is known as “the FAA library”and is the most important place where FAAs participate in the regulation of osmotic pressure(Wang et al., 2012). Proline is one of the important amino acids in osmotic regulation of fish. The amount of proline accumulation in fish depends on the activity of enzymes related to anabolism and catabolism of proline. In this experiment, the enzyme activity and mRNA expression levels of P5CS and PDH in the muscle of tilapia were affected by ambient salinity and alkalinity. The enzymatic activity and mRNA level of P5CS in the SW group were significantly higher than those in the SAW and AW groups (P<0.05), and those of PDH in the muscle of fish in the SAW and AW groups were significantly lower than those in the SW group. Therefore, we speculated that P5CS may play a major role in the synthesis of proline in SW group,PDH in the accumulation of proline in AW group, both P5CS and PDH play major roles in the accumulation of proline in SAW group. In addition, the enzyme activity of PDH in the SAW group was significantly lower than that in the SW group (P<0.05), which was similar to the change of P5CS in the SAW group. The enzymatic activity of P5CS was probably inhibited by the feedback of proline content in SAW group, resulting in a limited ability for proline synthesis. Meantime, the activity of PDH decreased thereby decreasing the ability of decomposition reaction of proline. Therefore, P5CS and PDH may coordinate in regulating the content of proline in saline-alkaline environment.
5.Conclusions
In conclusion, the contents of fatty acids and favor amino acids in muscle of Nile tilapia were affected by ambient salinity and alkalinity.Nutritional value of fatty acids was higher in SAW group, the fesh favor was obviously affected by alkalinity. Salinity and alkalinity enhanced the content of LC-PUFA by improving in vivo desaturase and elongase activity and up-regulating the expression of FADS 2, ELOVL 5 in liver, whereras the metabolism of proline varied in different water environments.
CRediT authorship contribution statement
Yamei Cheng: Conceptualization, Methodology, Validation, Formal analysis, Investigation, Data curation, Writing - original draft. Jinliang Zhao: Conceptualization, Resources, Data curation, Writing - review &editing, Supervision, Project administration, Funding acquisition.Christian Larbi Ayisi: Investigation, Validation. Xiaoying Cao: Resources, Investigation.
Declaration of competing interest
The authors declare that there is no conficts of interest.
Acknowledgments
The authors are thankful to China Agriculture Research System (CARS-46).
 Aquaculture and Fisheries2022年4期
- Aquaculture and Fisheries的其它文章
- A review on fishing gear in China: Selectivity and application
- atg7 and beclin1 are essential for energy metabolism and survival during the larval-to-juvenile transition stage of zebra fish
- Association between single nucleotide polymorphisms of nLvALF1 and PEN2-1 genes and resistance to Vibrio parahaemolyticus in the Pacific white shrimp Litopenaeus vannamei
- Comparative analysis of the morphology, karyotypes and biochemical composition of muscle in Siniperca chuatsi, Siniperca scherzeri and the F1 hybrid (S. chuatsi ♀ × S. scherzeri ♂)
- Differences in postembryonic dorsal fin development resulted in phenotypic divergence in two gold fish strains, Red Cap Oranda and Ranchu
- Chemical characteristics changes associated with extracted protein and salt addition and effect of different additives in the curing process on sensory acceptance of liquid fermented fish from tilapia frame